
Abstract
This article provides a quantitative synthesis of the published literature on word problem solving intervention studies for children with math disabilities (MD). Seven group and eight single-subject design studies met inclusion criteria. Mean effect sizes (ESs) for solution accuracy for group design studies were 0.95 (SE = .19) for children with MD-only and −0.45 (SE = .14) for children with MD and reading disabilities (MD + RD) when compared with their counterparts in the control condition. The mean ES for single-subject design studies was 0.90 (range = 0.09–2.99), with a mean ES of 1.45 for MD-only students and a mean ES of 0.58 for MD + RD students. Effective group and single-subject interventions shared a number of common instructional components (e.g., advance organizer, skill modeling). In general, the results suggest that specific sample characteristics (reading ability) and specific instruction components (sequencing, explicit practice, task reduction, advanced organizers, questioning, task difficulty control, elaboration, skill modeling, strategy cues) play a major role in treatment outcomes for children with MD.
Mathematical word problems are defined as linguistically presented problems requiring arithmetic solutions (e.g., Fuchs et al., 2006). A word problem involves translating linguistic statements into internal representations and applying mathematical operations to reach a solution (Mayer, 1985). Mathematical word problems are difficult for children of all ages because solution accuracy involves several processes beyond basic arithmetic skills (e.g., Fuchs et al., 2008; Swanson, 2006). Many children have a difficult time solving story problems although they possess adequate computational skills. Moreover, skills in word problem solving become increasingly important as students proceed to higher grades. Therefore, a synthesis of intervention studies that address children’s deficiency in solving word problems, especially those with math disabilities (MD), is an important focus of research.
Although there are few systematic syntheses of the experimental instructional literature on word problem solving and MD, three syntheses are relevant. Baker, Gersten, and Dae-Sik (2002) conducted a meta-analysis on mathematics intervention studies for children with learning difficulties published between 1971 and 1999. The 15 studies meeting their inclusion criteria defined the low-achieving math group through teacher nomination or poor performance on math measures. Their synthesis isolated three instructional activities that moderated effect sizes (ESs): (a) providing feedback to students on how they are performing, (b) small-group instruction incorporating peer cooperation, and (c) direct instruction. In addition, Baker et al. (2002) found that strategy instruction void of direct instruction of specific skills was an ineffective intervention model (estimate ES = 0.01). These findings were consistent with Swanson, Hoskyn, and Lee’s (1999) earlier meta-analysis of experimental intervention research for children with learning disabilities. Swanson et al. (1999) identified combined direct and explicit strategy instruction as an effective instructional model. Furthermore, several instructional components (explicit practice, elaboration, strategy cueing, small-group interactive settings) were highlighted as specifically critical to maximize the treatment outcomes (ESs) across various academic domains including math.
A second synthesis by Xin and Jitendra (1999) focused on word problem solving intervention studies for students with a variety of learning problems. The studies included samples of students with general learning problems and mild disabilities, and students at risk for MD. The synthesis contained 25 intervention studies, both published and unpublished. The general conclusion of their synthesis was that strategy training was beneficial toward improving word problem solving skills. However, their synthesis included studies without comparison groups, and their computation of ES focused on gain scores; therefore, it did not partial out the influence of pretest conditions.
More recently, Gersten et al. (2009) synthesized mathematics intervention studies on students with learning disabilities from 1971 to 2007. Studies in their synthesis met three inclusion criteria: (a) A focus was placed on evaluating the effectiveness of an instructional approach to enhance mathematics achievement, (b) the design of the study (whether quasi-experimental or experimental) used randomized control trials, and (c) only students with an identified learning disability (MD) were included in the study. A total of 42 group design studies met their inclusion criteria. The instructional components found effective in helping students with MD improve their mathematics proficiency were (a) explicit instruction, (b) visual representation, (c) sequence of examples, and (d) student verbalization. Explicit instruction was identified as a critical delivery tool for students with MD (mean ES = 1.22). When combined with other instructional components, visual diagrams demonstrated positive effects on teaching mathematics skills (mean ES = 0.47). In addition, providing a range of example problems had a strong positive impact on students’ mathematical performance and supported their transfer of newly acquired concepts/skills (mean ES = 0.82). Gersten et al. indicated, however, that some of the large ESs found in their synthesis were related to experimenter-developed measures closely aligned with the intervention instruction activities.
The purpose of this present synthesis was to extend these earlier syntheses in two ways. First, we sought to identify the student characteristics that moderate mathematical word problem solving interventions for children with MD. Previous syntheses did not take into consideration the role of sample characteristics within MD samples on treatment outcomes. Several studies suggested that variations in reading ability play a critical role in accounting for treatment outcomes in children with MD (e.g., Fuchs, Fuchs, & Prentice, 2004). Thus, in this synthesis, we investigated the comorbid effects of sample (e.g., math + reading problems vs. math-only problems) and related demographic variables (IQ, reading) as potential moderators in treatment outcomes. Second, we identified some of the instructional components that are related to positive outcomes in word problem solving interventions. Previous syntheses focused on general instructional approaches (e.g., direct instruction, strategy instruction) without further specifying some of the underlying instructional components that influence the magnitude of ESs. We drew on previous meta-analyses that identified instructional components contributing unique variance in the predictions of ESs in samples with learning disabilities (Swanson et al., 1999; Swanson & Hoskyn, 1998) and determined whether those components play a role in outcomes for children with MD. This study will address the following three questions:
Question 1: Do ESs in word problem solving interventions vary as a function of how children with MD vary in reading skills? To address this question, we compared ESs for children with MD only and other subgroups of children (e.g., children with both MD and reading disabilities (RD) to children without achievement difficulties).
Question 2: Do ESs in word problem solving interventions vary as a function of specific intervention components and instructional activities? Although previous syntheses isolated general instruction models, in this synthesis we attempted to identify common instructional components occurring across intervention studies that yield high ESs for children with MD.
Question 3: Do the general patterns on sample characteristics and instructional components found for group design studies hold for single-subject design studies? Previous syntheses have not systematically compared outcomes related to group design and single-subject design studies. This has occurred for several reasons (e.g., lack of consensus on ES calculations for single-subject design studies); however, we sought to determine whether similar variables (e.g., sample characteristics, instructional components) that underlie positive outcomes in group design studies also occur in single-subject design studies.
Method
Data Collection
Published intervention studies from 1986 to 2009 on word problem solving were the focus of this meta-analysis. In addition to searching the PsycINFO and ERIC online databases, we also checked the references from previously published meta-analysis studies and reviewed articles to ensure no exclusion of qualified studies (Baker et al., 2002; Gersten et al., 2009; Kroesbergen & Van Luit, 2003; Montague, 2008; Swanson & Hoskyn, 1998; Swanson & Jerman, 2006; Swanson & Sachse-Lee, 2000; Xin & Jitendra, 1999). Furthermore, we hand-searched the following journals: Journal of Learning Disabilities, Learning Disability Quarterly, Learning Disabilities Research & Practice, Exceptional Children, and The Journal of Special Education.
Four levels of descriptors were used together for the online database search to identify potential articles:
Mathematics, arithmetic, algebra
Problem solving, word problems, story problems
Disabilities (disabled), learning difficulties, learning problems
Instruction, intervention, training, treatment.
We identified 425 studies. We excluded articles that were nonexperimental (e.g., no control group or baseline) or did not include word problem solving as a dependent measure. In all, 41 articles met these criteria. Group design studies were further assessed regarding the following criteria:
The study was a pretest–posttest control group study that included participants with MD.
The study focused on school-age children (5–18 years) and reported at least one norm-referenced mathematics measure to define the participants with MD. Studies were included if students’ scores with MD fell below the 25th percentile (standard score of 90) on a norm-referenced math test (e.g., Wechsler Individual Achievement Test [WIAT], third edition of the Wide Range Achievement Test [WRAT-3]). The 25th percentile cutoff score on standardized achievement measures has been commonly used to identify children at risk for MD (e.g., Siegel & Ryan, 1989; see Swanson & Jerman, 2006, for a review) and therefore was used in selecting articles for this synthesis. Studies were excluded if the selection of participants with MD was based only on the recommendation of the school or teachers, or based on nonstandardized math measures.
The intervention focused on mathematical word problem solving. The interventions that only focused on basic computation skills were excluded.
The studies were written in English and published in peer-reviewed journals.
The study provided enough quantitative information to allow for the calculation of ESs. These ESs were calculated from the means and standard deviations of the dependent measures for the experimental and comparison conditions, or from the tests of the significance of the differences in performance between the intervention conditions (e.g., t or F tests, chi-square, and exact probability values).
The criteria used to assess single-subject design studies were the following:
The study used a single-subject design (e.g., variations of reversal, multiple baseline, changing-criterion, alternative treatment designs) and yielded data for at least three sessions at baseline and treatment.
The study provided sufficient clarity of information (e.g., clear graphs and charts) to permit the calculation of ESs.
The recipients of the intervention were identified as children with MD using the same psychometric criteria as defined above for group design studies.
The participants received intervention, training, or treatment that was over and above what they would have received during the course of their typical classroom experience.
Seven group studies and eight single-subject design intervention studies met the above-described criteria. The group studies and the single-subject design studies were coded and analyzed separately.
Coding Procedure
The general coding categorization of studies included (a) sample characteristics, (b) demographics, (c) conditions of treatment, (d) quality of research methodology (e.g., fidelity of treatment implementation, length of time), (e) content of intervention, and (f) components and parameters of intervention activities (to be discussed). Interrater agreement was calculated as the agreements divided by the number of agreements plus disagreements, multiplied by 100, and ranged from 98% to 100% across various coding items. One postdoctoral researcher served as independent rater on the coding of each study, with interrater agreement calculated for 20% of the articles by a second postdoctoral researcher. Approximate time to code each article varied from 3 to 4 hr. The mean interrater agreement for coding of the 18 instructional components (to be discussed), intervention content, and intervention delivery approaches (e.g., small group, technology use) was above 95%. During the coding of demographic data, all scales (e.g., normal curve equivalents, percentile ranks) were converted to standard scores for norm-referenced reading and math measures. For studies that only provided grade-level information rather than the participants’ chronological age, the median age corresponding to the grade was assigned to represent the mean age of the group. For group design studies, the groups were further categorized as MD-only group or MD + RD group using a 25th percentile (standard score of 90) cutoff on a norm-referenced reading test (e.g., Woodcock Reading Mastery Test–Revised [WRMT-R]; Woodcock, 1998). For single-subject design studies, individual participants were coded into students with MD-only (above 25th percentile) or with MD + RD (below 25th percentile) based on their reading scores on a norm-referenced reading test.
Categorization of Dependent and Treatment Measures
Dependent measures
Solution accuracy was the primary dependent measure coded on word problems. Secondary measures coded included computation skills, concept understanding, and labeling (i.e., labeling problems with words, mathematical symbols, or money signs). The scoring of “concept understanding” reflected a student’s proficiency at identifying relevant numbers and correctly applying correct operations to reach a final answer (Fuchs et al., 2004). A measure was also coded whether to be researcher developed or a norm-referenced test.
Treatment
Two general domains were coded to assess treatment conditions. The first domain coded was the general focus of the intervention procedures. These dummy coded variables (1 = reported, 0 = not reported) based on the intervention procedures were (a) curriculum-based material (i.e., the intervention material was reported to be in alignment with the district/school’s curriculum), (b) one-step/multiple-step word problems instructed through the intervention, (c) single/multiple arithmetic operations (i.e., addition, subtraction, multiplication, division), (d) instruction focused on conceptual understanding instead of procedural skills, and (e) inclusion of instruction of computational skills.
The second dummy coded domain focused on intervention components. In all, 18 intervention components were coded as present or not present in each study. The definition and composition of the 18 intervention components were obtained from previous studies, and the occurrence of the components was decided through presence/nonpresence of 45 instructional activities (e.g., Swanson, 2009; Swanson et al., 1999; Swanson & Hoskyn, 2001). These instructional components were found to capture a significant amount of variance across studies that included interventions for children and adolescents with learning disabilities (Swanson, 1999, 2000). We coded the occurrence of the following instructional components (Also included are the numbers related to the activities on the coding sheet provided in the appendix):
Advance organizers: statements in the treatment description about directing students to look over material before instruction, students directed to focus on particular information, providing prior information about task, and/or the teacher stating objectives of instruction (Activity Numbers 2, 3, 11, and 40).
Attributions: statements in the treatment description about teacher presenting the benefits of taught strategies (Activity Number 41).
Control difficulty or processing demands of tasks: treatment statements about probing learning, fading probes or prompts, short activities so the level of difficulty is controlled, and/or teacher providing necessary assistance (Activity Numbers 4, 7, 16, and 42).
Elaboration: statements in the treatment description about additional information or explanation provided about concepts, and/or redundant text or repetition within text (Activity Numbers 4, 7, 16, and 42).
Explicit practice: statements in the treatment description related to distributed review and practice, repeated practice, sequenced reviews, daily feedback, and/or weekly reviews (Activity Numbers 23, 26, 27, 39, and 45).
Large-group learning: statements in the treatment description about instruction in large groups and/or teacher-only demonstration (Activity Numbers 15 and 37).
Novelty: statements in the treatment description about new curriculum being implemented and/or emphasis on teacher presenting new material from the previous lesson (Activity Numbers 20 and 38).
One-on-one instruction: statements in the treatment description about activities related to independent practice, tutoring, instruction that is individually paced, and/or instruction that is individually tailored (Activity Numbers 9, 10, and 13).
Peer modeling: statements in the treatment description about peers presenting or modeling instruction (Activity Number 18).
Questioning: treatment description related to directing students to ask questions, the teacher and student or students engaging in dialogue, and/or the teacher asking questions (Activity Numbers 33, 35, and 36).
Reinforcement: statements in the treatment description about intermittent or consistent use of rewards and reinforcers (Activity Number 28).
Sequencing: statements in the treatment description related to breaking down the task, and/or sequencing short activities (Activity Numbers 12 and 29).
Skill modeling: statements or activities in the treatment description that involve modeling from a teacher in terms of skills (Activity Number 19).
Small-group instruction: statements in the treatment description about instruction in a small group, and/or verbal interaction occurring in a small group with students and/or teacher (Activity Number 14).
Strategy cues statements in the treatment description about reminders to use strategies or multisteps, the teacher verbalizing steps or procedures to solve problems, and/or use of “think aloud models” (Activity Numbers 25, 32, and 43).
Supplement to teacher involvement: statements in the treatment description about homework and/or parents helping to reinforce instruction (Activity Numbers 8, 21, and 22).
Task reduction: statements in the treatment description about breaking down the targeted skill into smaller units, mastery criteria, and/or task analysis (Activity Numbers 1, 17, and 34).
Technology: statements in the treatment description about developing pictorial representations, using specific material or computers, and/or using media to facilitate presentation and feedback (Activity Numbers 5, 31, and 44).
Calculation of ESs for Group Studies
Pretest–posttest means and posttest standard deviations were used in the computation of ESs. Hedges’s g was the measure of ES. Hedges’s g was calculated as the difference between pretest–posttest means for the treatment group and the pretest–posttest means for the control group. This difference score was divided by weighted variance of the posttest scores (see below). The comparison groups included students with MD only, MD + RD, or students with average mathematical skills. The ESs were computed as follows: MD-only treatment versus MD-only control, MD-only treatment versus MD + RD control, MD-only treatment versus average control, MD + RD treatment versus MD-only control, MD + RD treatment versus MD + RD control, MD + RD treatment versus average control. Hedges’s g was calculated as
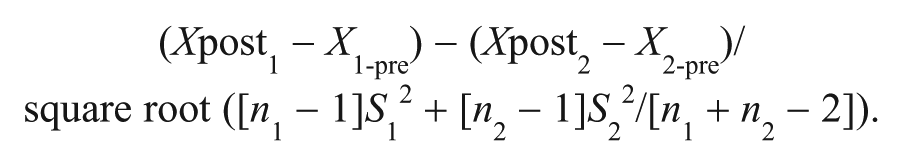
Xpost1 and Xpost2 were unadjusted posttest means, X1-pre and X 2-pre were unadjusted pretest means, n1 and n2 were sample sizes, and S1 and S2 were the unadjusted posttest standard deviations for the treatment and control groups, respectively. No doubt, this formula is not optimal because it fails to take into consideration the correlations between pretest and posttest differences. However, no study reported the correlation between pretest and posttest measures or reported adjusted posttest means, and therefore, we considered this formula a reasonable approximation of ES. Means and standard deviations were used in the computation of all ESs.
As suggested by Hedges and Olkin (1985), outliers were removed from the analysis of main effects. Outliers were defined as ESs lying beyond the first gap of at least one standard deviation between adjacent ES values in a positive direction (Bollen, 1989). Cohen’s criterion was used for the interpretation of the magnitude of the ESs. We also determined whether a set of ESs shared a common ES (i.e., was consistent across the studies) by category. The analysis of each category of measure reported separately is shown in Table 3. For the category of each dependent measure, a homogeneity statistic Q was computed to determine whether separate ESs within each category shared a common ES (Hedges & Olkin, 1985). The statistic Q has a distribution similar to the distribution of chi-square with k – 1 degrees of freedom, where k is the number of ESs. A significant Q indicated that the study features significantly moderated the magnitude of ESs. If homogeneity was not achieved, then the influence of outliers was assessed using a 95% confidence interval. Because we expected the absence of homogeneity, the subsequent analyses determined how the moderator variables (i.e., characteristics of the sample) of the various studies contributed to the variability and the heterogeneity of ESs.
To determine the relation between sample characteristics and the magnitude of ESs, a categorical model was analyzed. Categorical models, analogous to an analysis of variance, show whether the heterogeneity in ESs is isolated to a particular category. The procedure for calculating categorical models provides a between-class effect. This procedure was considered helpful in determining whether certain characteristics of the sample (e.g., age) made a significant contribution to ES.
ES Calculation for Single-Subject Design Intervention Studies
Although there is no consensus for calculating ESs for single-subject design studies, two procedures were selected. The first consisted of coding (a) the number of total baseline and treatment sessions and (b) the total number of overlapping data points between baseline and treatment points. This coding allowed us to use percentage of all nonoverlapping data points to calculate the overall ES (Parker, Hagan-Burke, & Vannest, 2007). The second procedure included an adaptation of Rosenthal’s (1994) formula by Swanson and Sachse-Lee (2000). For this procedure, the last three sessions in the baseline and treatment phases were used in the calculation. The formula takes into consideration the standard deviation of repeated measures (Sg). The average standard deviation for the baseline and treatment was converted to the formula Sp = Sg/√2(1 − r). ESs were transformed to a scale using the following multiplier: Adjusted ES = (ES baseline and treatment) √2 (1 − R), where R is the baseline and treatment correlation and ES = effect size of the last three baseline and treatment sessions. The computed mean intercorrelation between the last three sessions of baseline and the last three sessions of first treatment phase across studies was .80. Thus, the correlation of all studies was set at .80. Because ESs varied tremendously across studies, all adjusted ESs greater than 3.00 were considered outliers (see Bollen, 1989, for rationale) and were removed from the synthesis when reporting results using the modified Rosenthal formula. The number of ESs (>3.00) removed using this formula was eight.
Results
Group Design Studies
Table 1 provides a summary of group design studies included in this synthesis. The samples with math difficulties were categorized as children with MD only or MD + RD based on the reported mean norm-referenced scores. Also shown in Table 1 are the tests in the study used to define the sample.
Summary of the Characteristics of Group Design Studies.
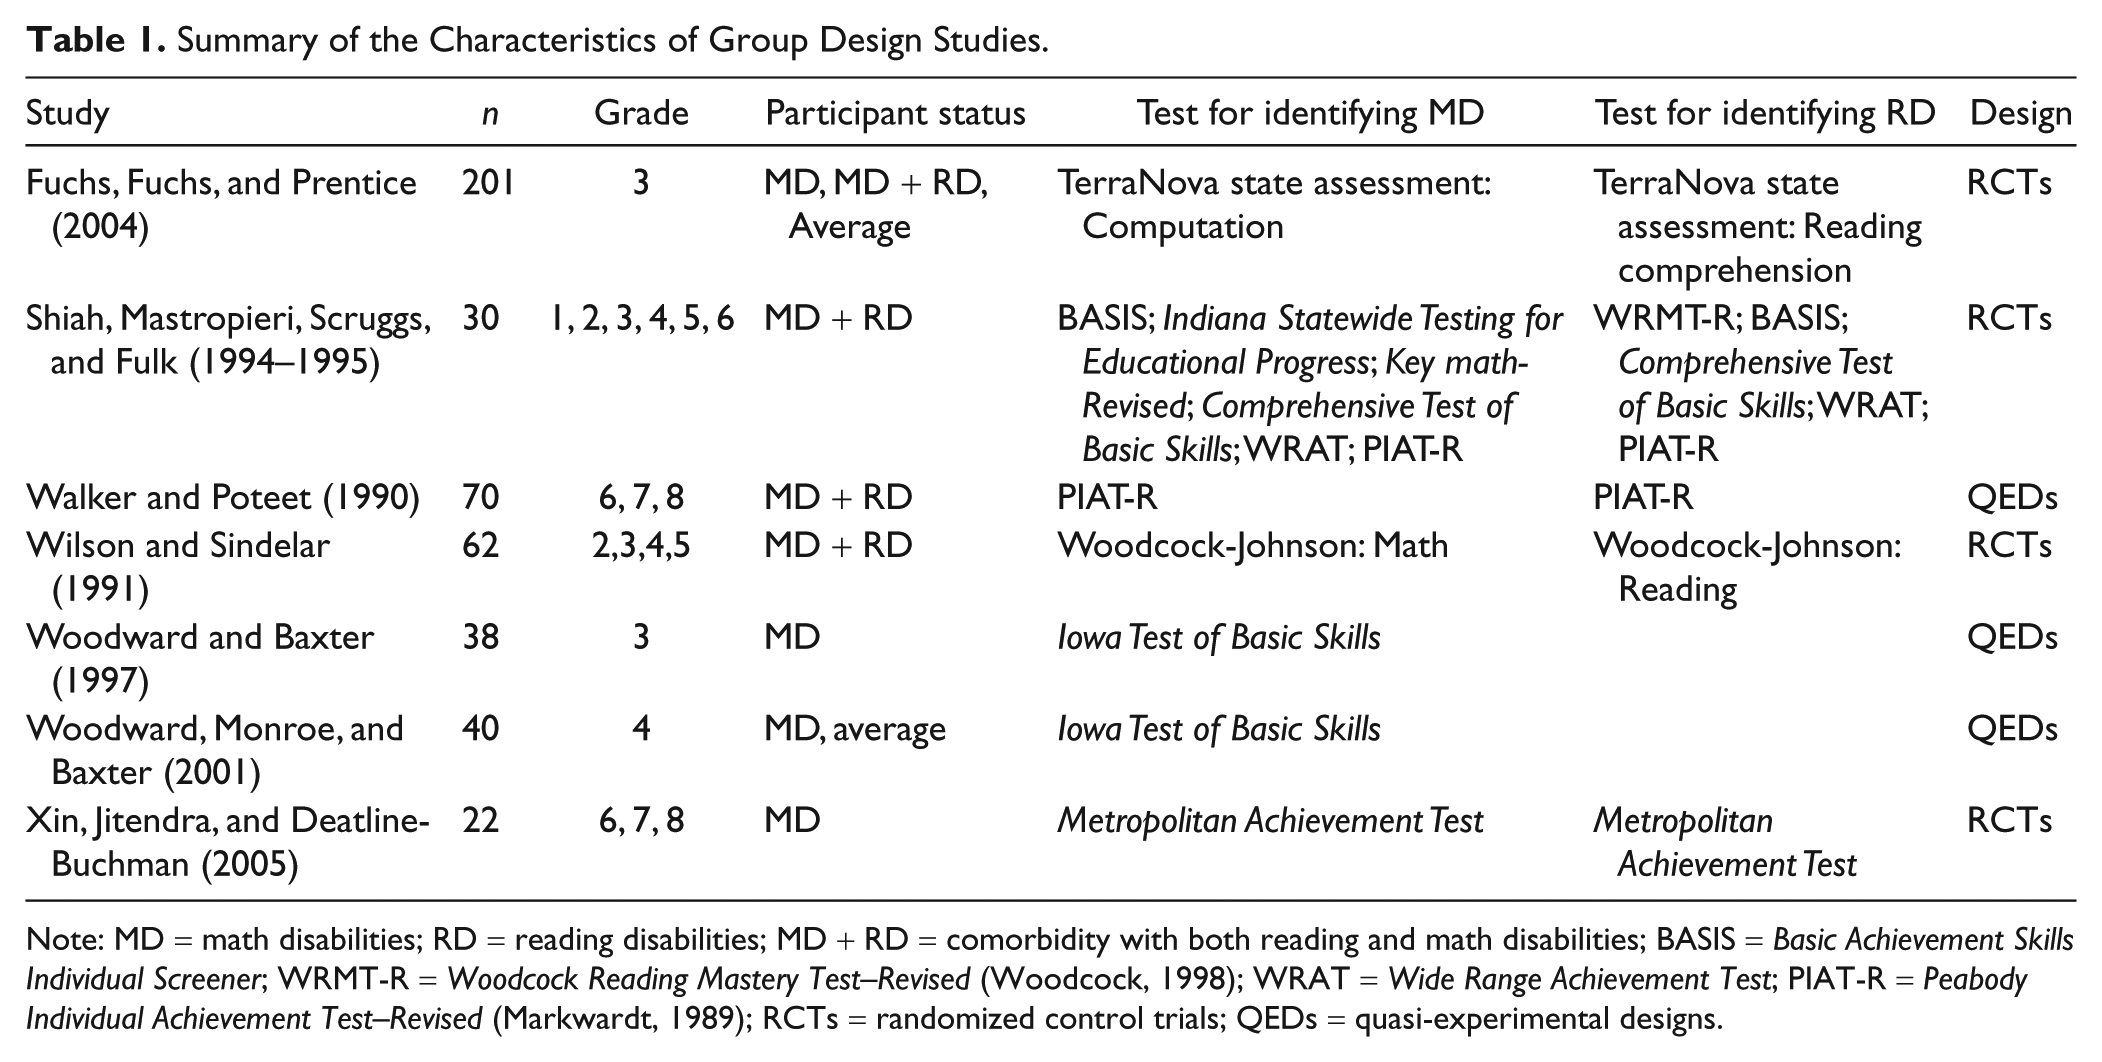
Note: MD = math disabilities; RD = reading disabilities; MD + RD = comorbidity with both reading and math disabilities; BASIS = Basic Achievement Skills Individual Screener; WRMT-R = Woodcock Reading Mastery Test–Revised (Woodcock, 1998); WRAT = Wide Range Achievement Test; PIAT-R = Peabody Individual Achievement Test–Revised (Markwardt, 1989); RCTs = randomized control trials; QEDs = quasi-experimental designs.
The group design articles were primarily published in Learning Disability Quarterly, Exceptional Children, and Journal of Learning Disabilities. Seven studies met the inclusion criteria for this synthesis (see Table 1). Publication dates ranged from 1990 to 2005. All studies were conducted in the United States within the past two decades. Only four studies reported the implementation of treatment fidelity checks (e.g., Fuchs et al., 2004). The number of intervention sessions varied from 3 (Shiah, Mastropieri, Scruggs, & Fulk, 1994–1995) to 32 (Fuchs et al., 2004), with six studies implementing more than 10 sessions. The length of each intervention session varied from 25 to 60 min. Four studies used randomized control trials and the remaining three studies used quasi-experimental designs. Six studies used researcher-developed word problem solving measures in alignment with intervention content on pretests, posttests, maintenance tests, and transfer tests. Only one study (Woodward & Baxter, 1997) used a norm-referenced test both at the pretest and the posttest.
The demographic information (IQ, math, and reading) on participants by ability group is summarized in Table 2. The treatment groups were divided into students with MD only or with comorbidity (MD + RD). The comparison groups were divided into students with MD only, MD + RD, or average mathematical skills (norm-referenced scores > 90 standard score). Five studies reported both math and reading standard scores of the participants on norm-referenced tests, which allowed us to code the sample into MD-only or MD + RD. Two studies (Woodward & Baxter, 1997; Woodward, Monroe, & Baxter, 2001) did not provide norm-referenced reading data to further categorize participants into MD-only or MD + RD. We coded the sample as MD-only because their description of participants indicated that these students did not participate in a special education program for students with reading problems.
Demographic Information on Participants in Group Studies.
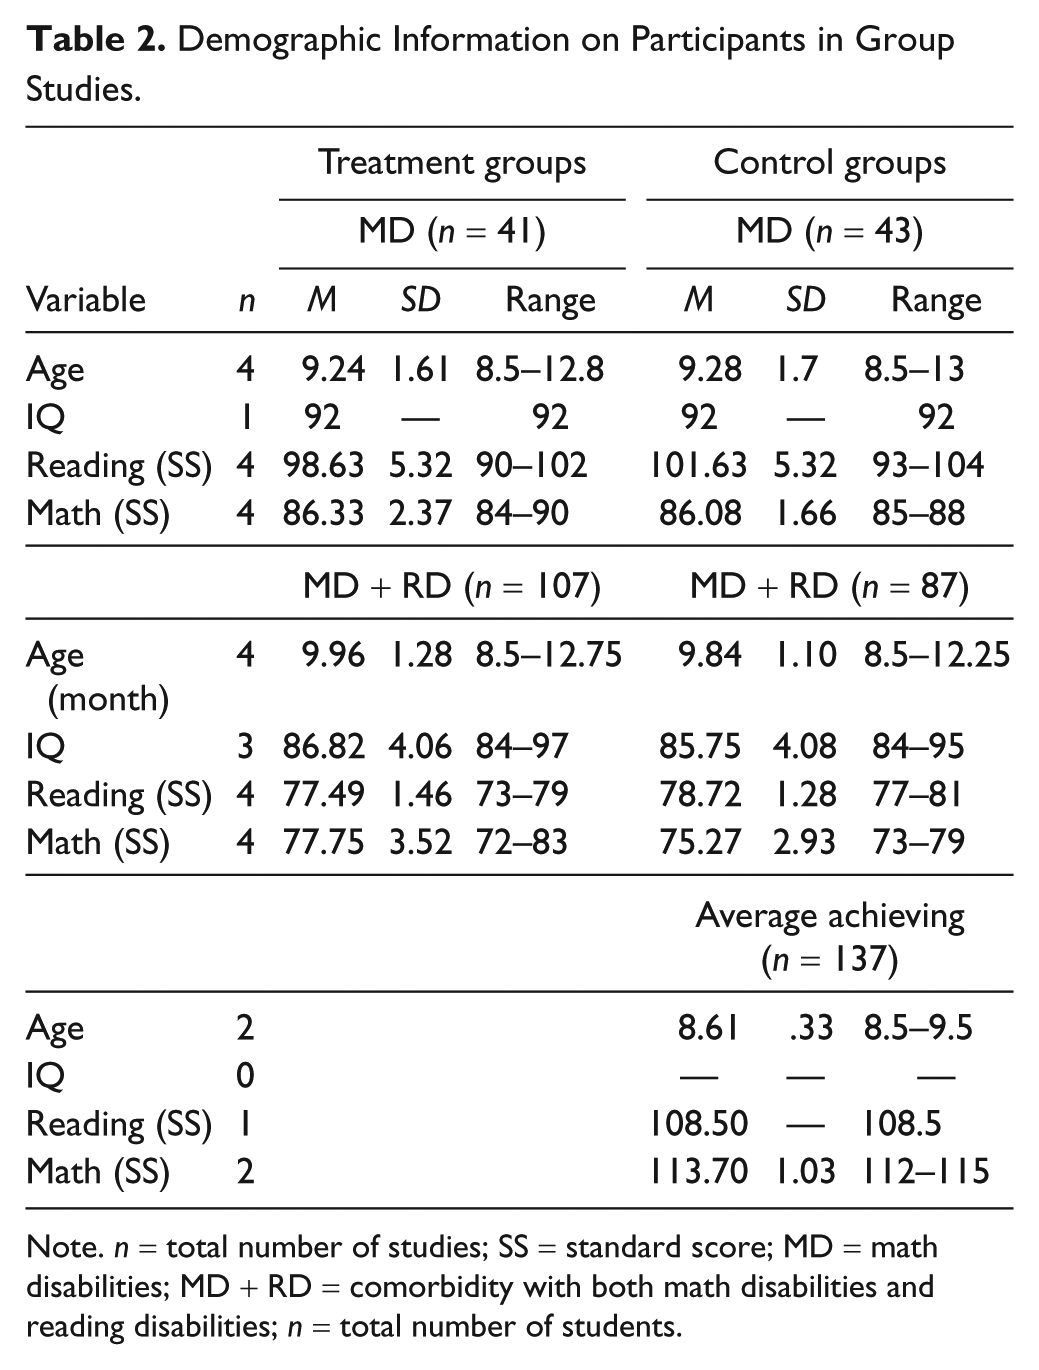
Note. n = total number of studies; SS = standard score; MD = math disabilities; MD + RD = comorbidity with both math disabilities and reading disabilities; n = total number of students.
As shown in Table 2, for the MD-only treatment participants, the mean age was 9.24 years (range = 8.5–12.8), the average standard reading score was 98.63 (range = 90–102), and the average standard math score was 86.33 (range = 84–90). For the MD-only control groups, participants’ mean age was 9.28 (range = 8.5–13), with an average standard reading score of 101.63 (range = 93–104) and an average standard math score of 86.08 (range = 85–88). For the MD + RD treatment groups, participants’ mean age was 9.96 (range = 8.5–12.7), with an average standard reading score of 77.49 (range = 73–79) and an average standard math score of 77.75 (range = 72–83). For the MD + RD control groups, participants’ mean age was 9.84 (range = 8.5–12.25), with an average standard reading score of 78.72 (range = 77–81) and an average standard math score of 75.27 (range = 73–79). For the average control groups, participants’ mean age was 8.61 (range = 8.5–9.5). Only one study reported the average standard reading score of 108.5, and two studies reported an average standard math score of 113.7.
The weighted means and the 95% confidence interval for ESs as a function of MD-only, MD + RD, and average achievers are shown in Table 3. In calculating weighted ES, adjusted mean difference was used as numerator to control the confounding effect of pretest. The results demonstrate that outcomes (ES) for children with MD-only and MD + RD vary tremendously as a function of the type of dependent measure and the sample characteristic in the control condition. Under “Comparison” in Table 3, the groups on the left side referred to treatment groups, whereas the groups on the right side referred to control groups. A positive ES is in favor of the treatment group; a negative ES is in favor of the control group. As shown, the comparison between MD-only in the treatment and MD-only in the control condition across the dependent measures yielded a mean ES of 0.78 in favor of MD-only treatment, which was substantial in magnitude according to Cohen’s criterion. The 95% confidence interval for the average ES estimate is between 0.52 and 1.03. The individual ESs were heterogeneous across studies, Q(12) = 49.03, p < .001. As shown in Table 3, the average ES for the comparison between the treatment group of MD-only and the control group of MD + RD was 1.82 in favor of the treatment group of MD-only, and 1.15 between the treatment group of MD-only and the control group of average mathematics achievers in favor of MD-only treatment. Note that the ES between the treatment with MD and average control was positive because the “difference in differences” approach was used to control the pretest effect. However, the average ESs for the treatment group of MD + RD compared with different types of control group were from small to moderate in favor of MD + RD treatment: 0.76 when compared with the MD control group, 0.24 when compared with the MD + RD control group, and 0.57 when compared with the average control group.
Weighted ESs, SEs, Confidence Intervals, and Homogeneity of Categories for Comparisons Between Treatment and Control Groups on Word Problem Solving Categories.
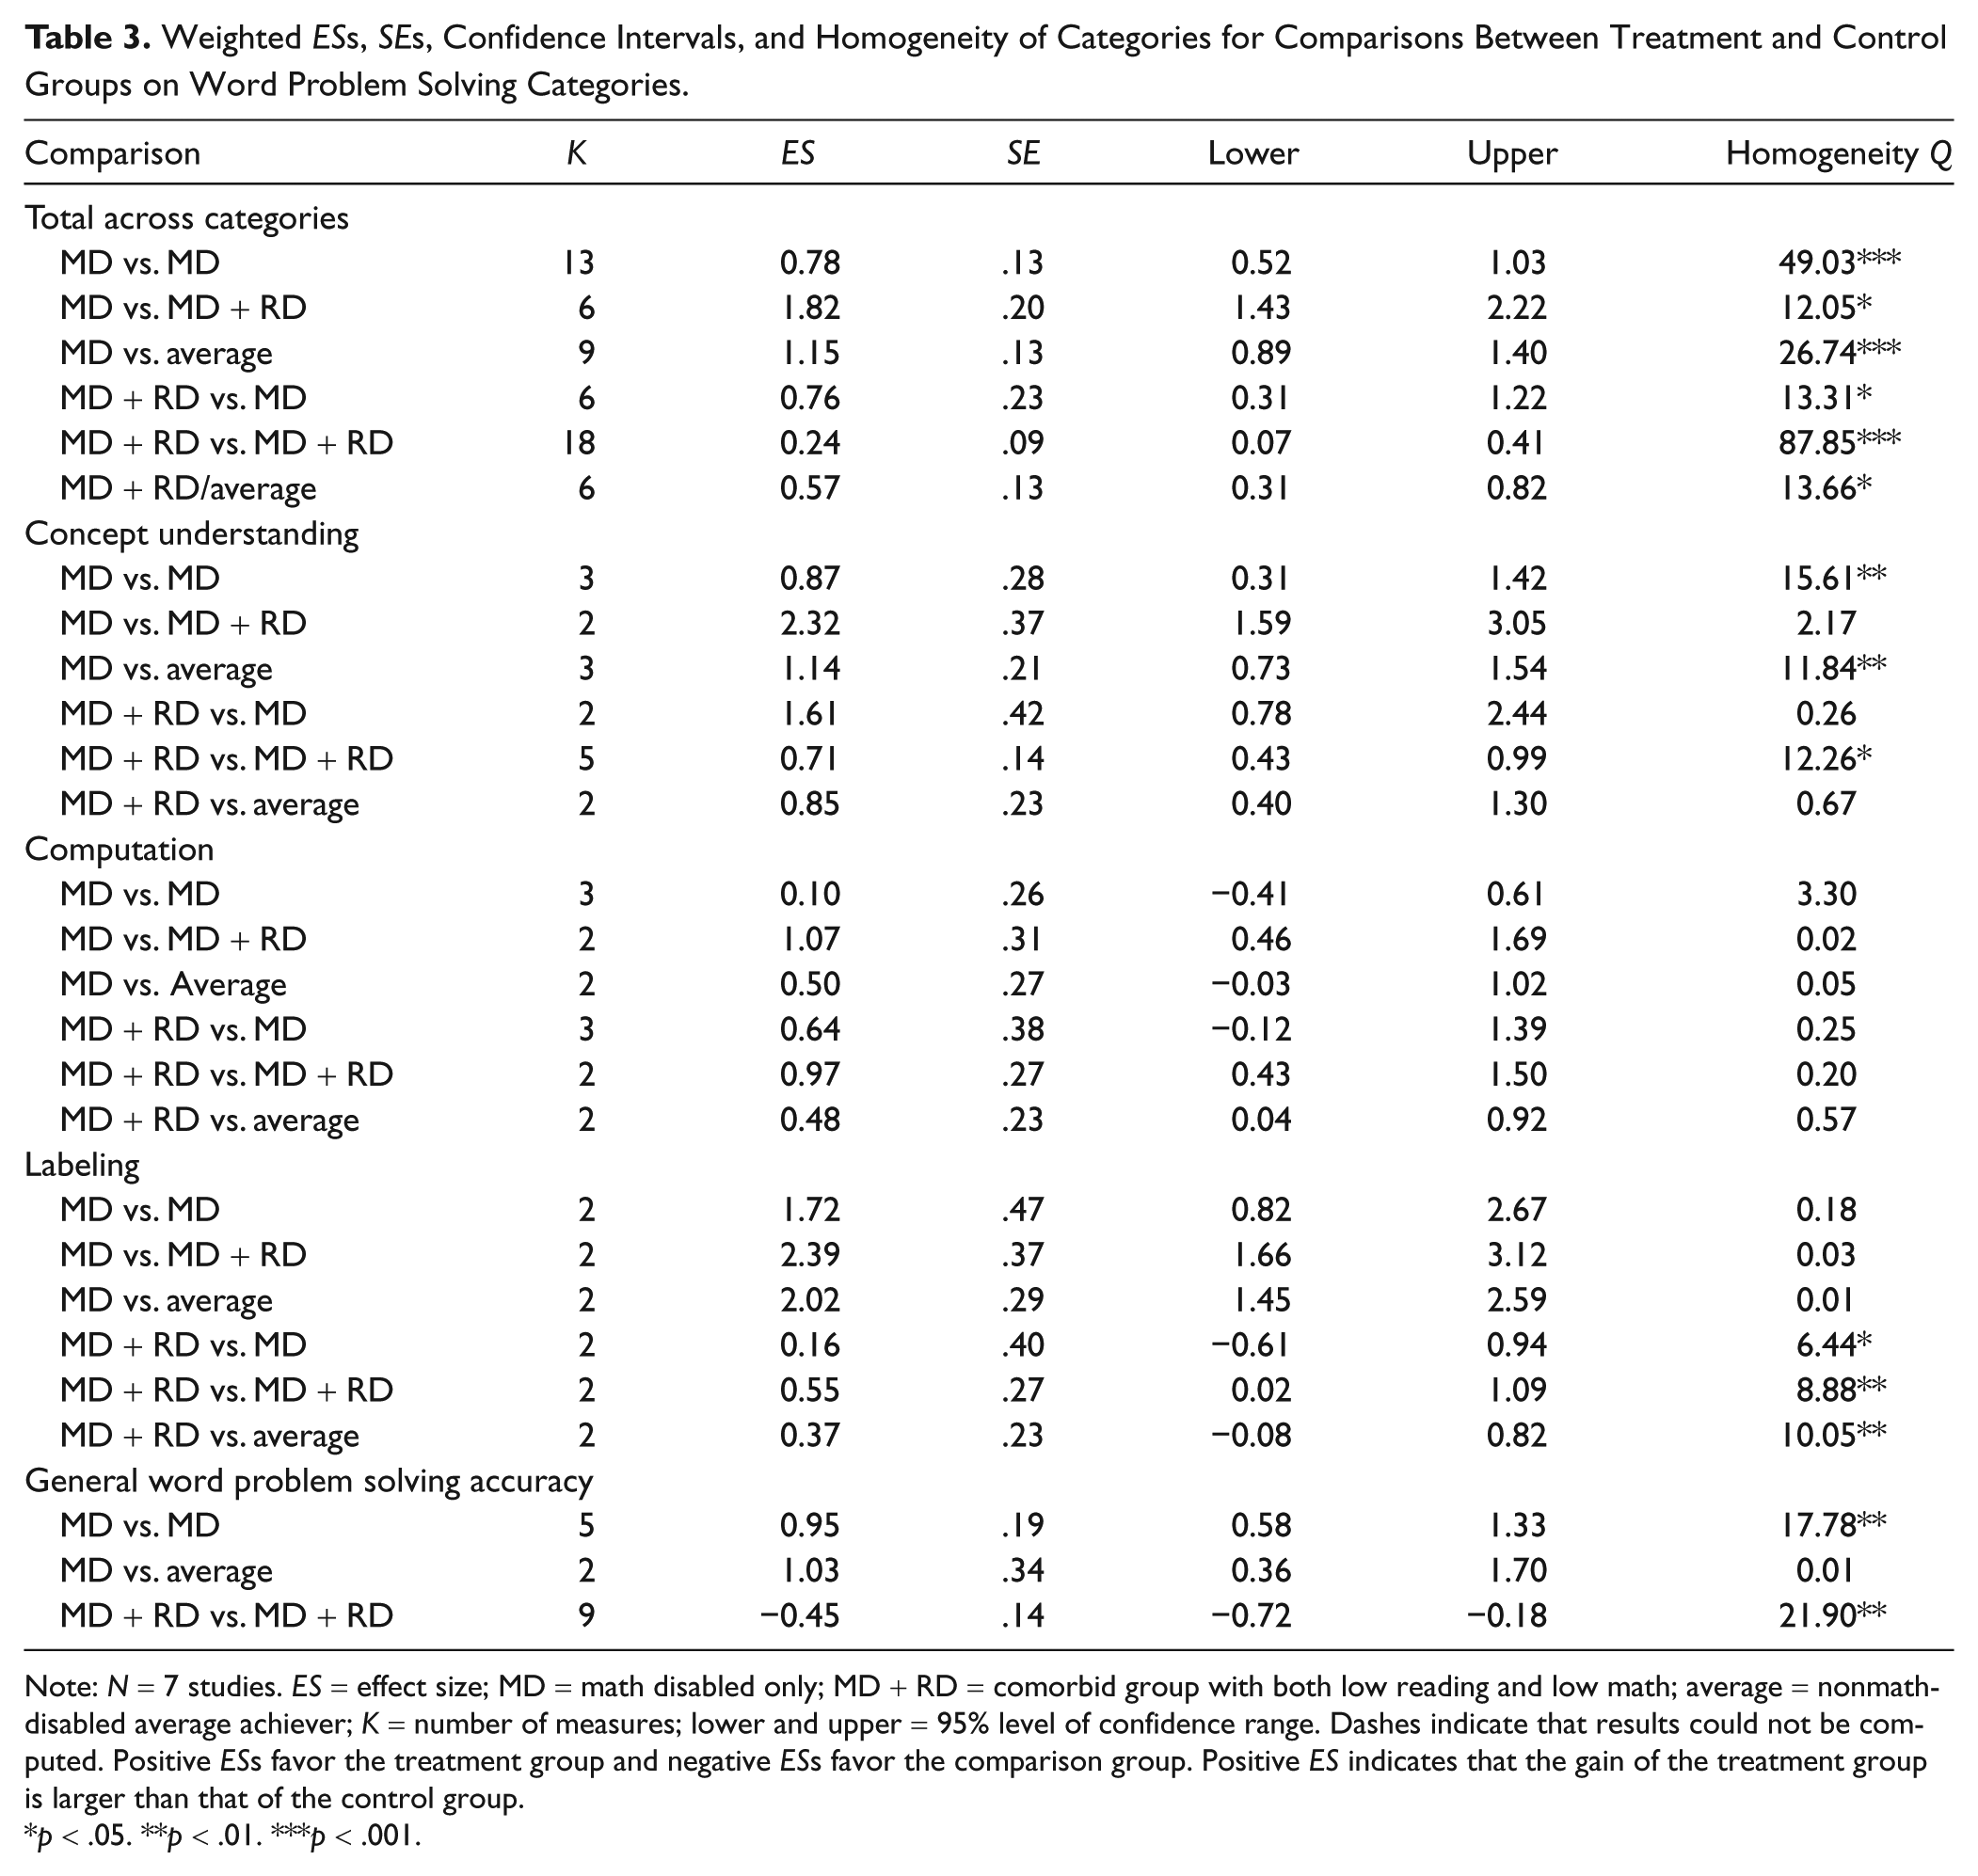
Note: N = 7 studies. ES = effect size; MD = math disabled only; MD + RD = comorbid group with both low reading and low math; average = nonmath-disabled average achiever; K = number of measures; lower and upper = 95% level of confidence range. Dashes indicate that results could not be computed. Positive ESs favor the treatment group and negative ESs favor the comparison group. Positive ES indicates that the gain of the treatment group is larger than that of the control group.
p < .05. **p < .01. ***p < .001.
Table 3 also provides mean ESs for the four specific categories related to word problem solving. For word problem solving accuracy, the MD-only treatment groups made substantial gains compared with control groups with MD-only or with average math achievers (0.95 and 1.03, respectively) in favor of MD-only treatment. However, in terms of solution accuracy, the students with MD + RD in treatment underperformed compared with the control group that included students with MD + RD (ES = −0.45). Treatment groups with MD-only or with MD + RD yielded large positive effects for dependent measure of concept understanding of word problems when compared with the control groups with mean ESs ranging from 0.71 to 2.32. For the dependent measure of computation, students with MD-only or with MD + RD in the treatment condition yielded large positive effects when compared with the control students with MD + RD (1.07 and 0.97, respectively). The treatment groups with MD-only made small improvements in computation compared with control groups with MD-only (mean ES = 0.10). In general, for the dependent measure of labeling word problems, the ESs for the MD-only treatment groups when compared with the different control groups were large in favor of the MD-only treatment groups (range = 1.72–2.39).
Instructional content
All seven intervention studies included training students on more than one arithmetic operation (addition, subtraction, multiplication, and division). In all, 78% of the treatment conditions focused on enhancing students’ conceptual understanding of word problem solving (e.g., the comprehension of mathematical concepts, relations, and operations). Approximately half of the studies reported using materials in the intervention in alignment with district curricula and focused on both computational and word problem solving skills. In all, 33% of treatments used multiple-step word problems (e.g., Fuchs et al., 2004), whereas the remainder of studies focused on one-step problem solving tasks (e.g., Wilson & Sindelar, 1991).
Table 4 shows the occurrence of instructional components for each study. As indicated in Swanson and Hoskyn (2001; see p. 113, for review), instructional components do not operate in isolation and overlap in a number of activities. Although pervious regression analyses (Swanson, 2000; Swanson & Hoskyn, 2001) have isolated the unique variance related to specific components (e.g., explicit practice), because of the limited number of studies in this synthesis, we can only analyze the occurrence of reported components. The reported components and the aggregated ES for each study are shown in Table 4. A tally across group design studies indicated that all seven studies incorporated explicit practice or distributed review. In all, 89% of treatments included strategy cues to remind students to use the taught strategies or procedures to help them solve problems.
Summary of Reported Use of 18 Instructional Components for Group Design Studies.
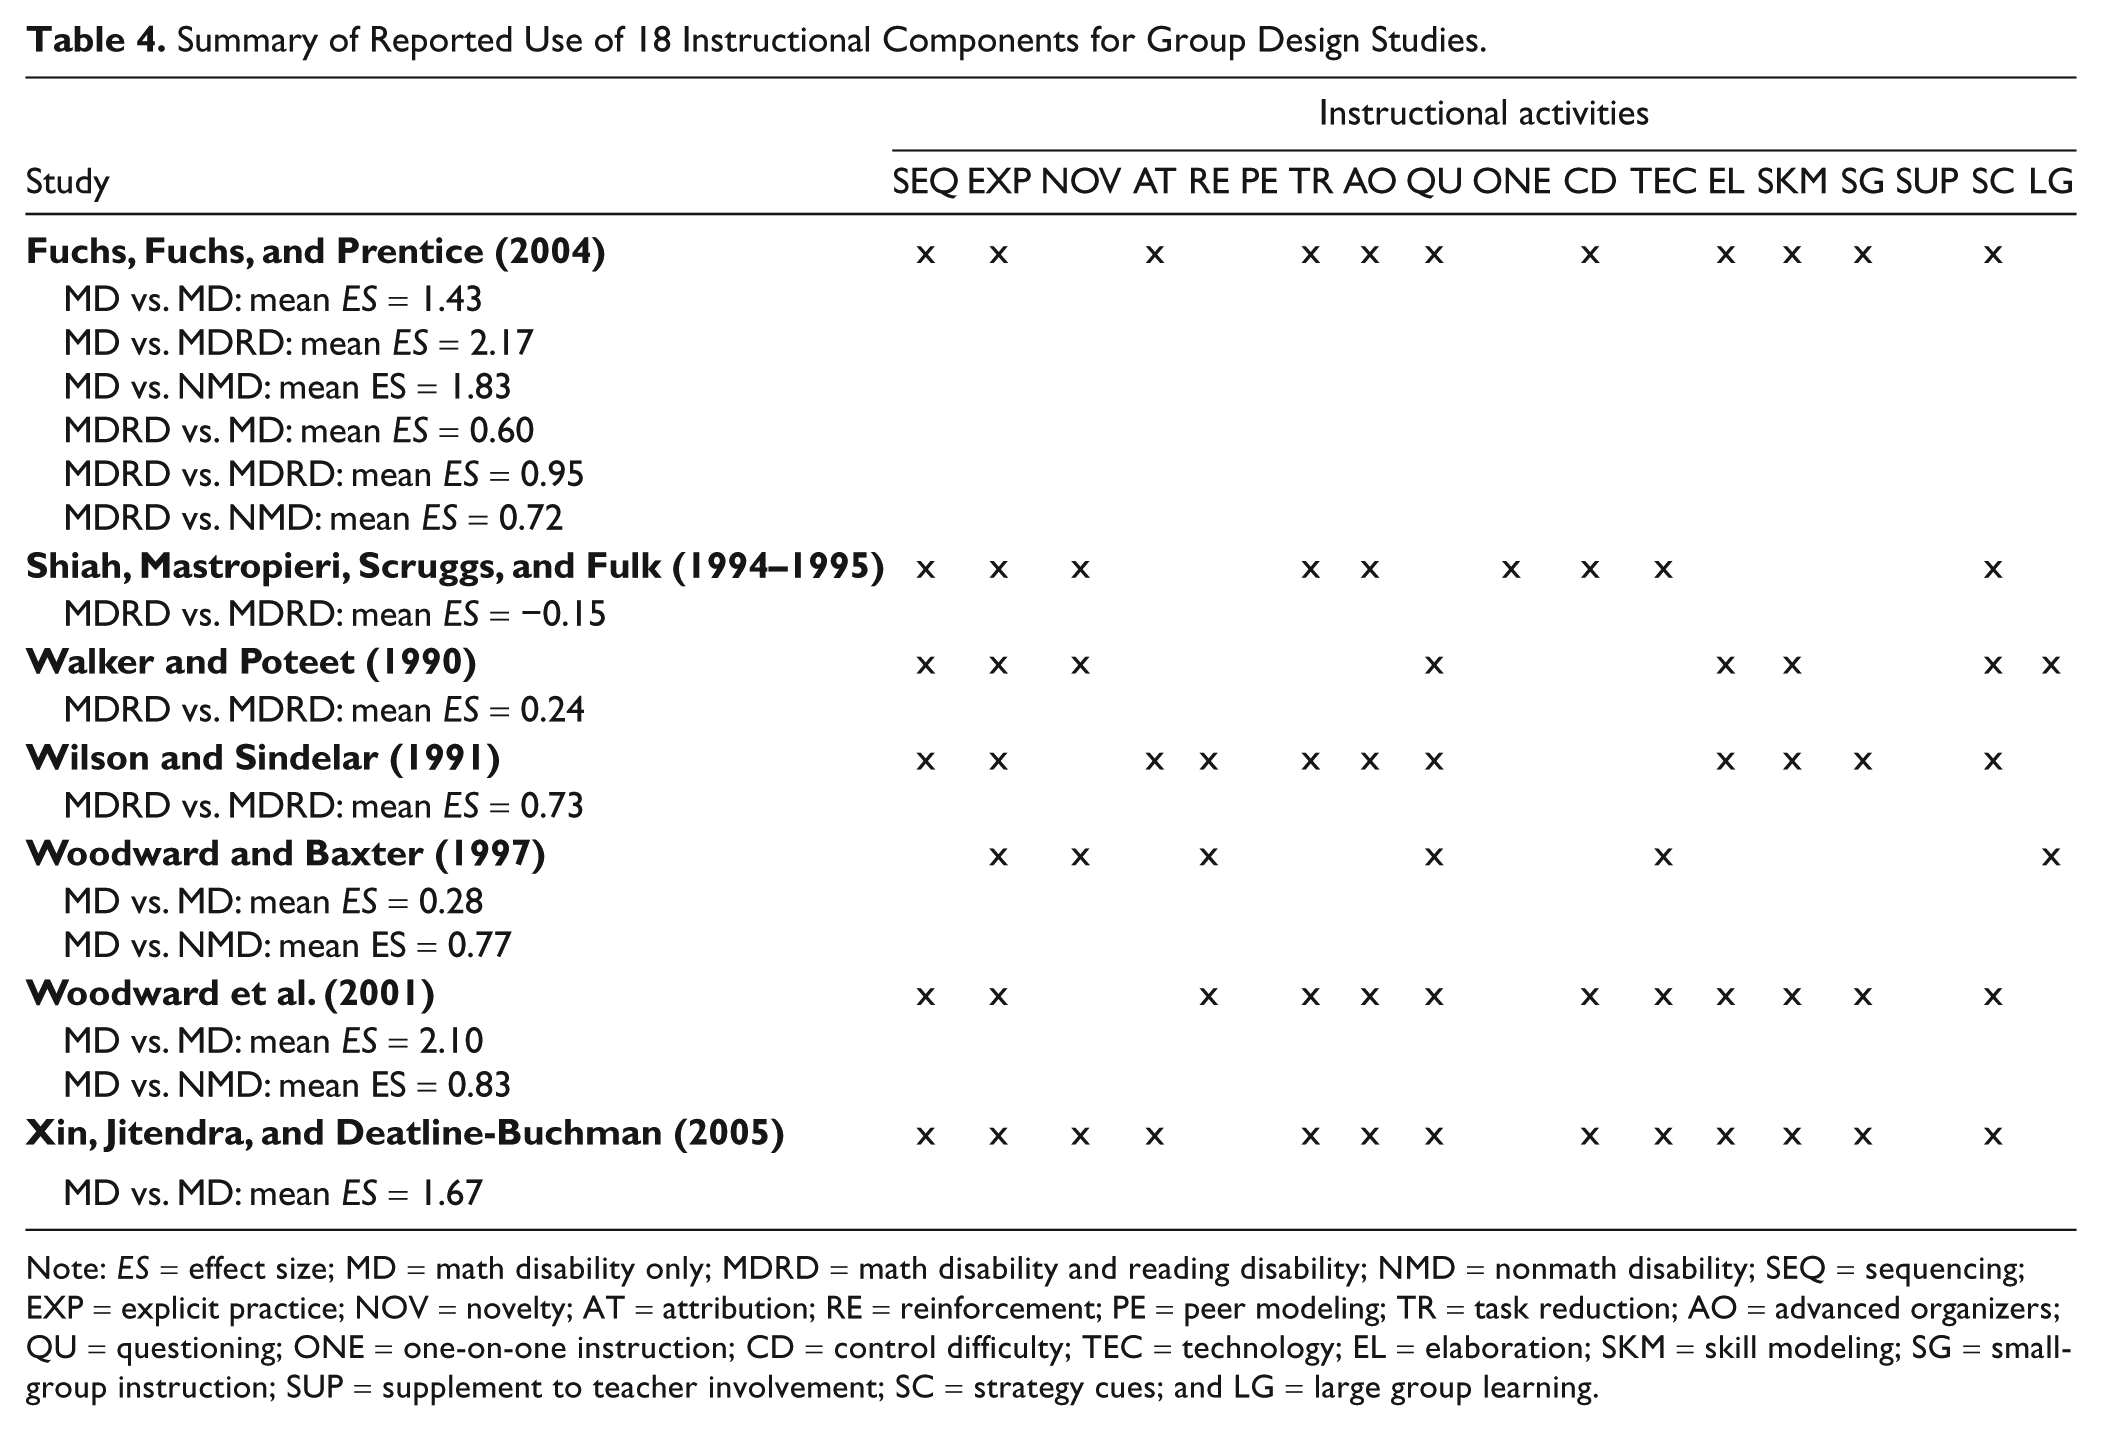
Note: ES = effect size; MD = math disability only; MDRD = math disability and reading disability; NMD = nonmath disability; SEQ = sequencing; EXP = explicit practice; NOV = novelty; AT = attribution; RE = reinforcement; PE = peer modeling; TR = task reduction; AO = advanced organizers; QU = questioning; ONE = one-on-one instruction; CD = control difficulty; TEC = technology; EL = elaboration; SKM = skill modeling; SG = small-group instruction; SUP = supplement to teacher involvement; SC = strategy cues; and LG = large group learning.
As shown in Table 4, the majority of interventions (>70%) reported the following instructional components: sequencing, task reduction, advanced organizers, questioning, elaboration, strategy cues, and skill modeling. No studies reported interventions that included peer modeling or a supplement to teacher involvement (e.g., homework). About 50% of the studies reported that instruction occurred in small-group (3–5 students) settings; implemented a new curriculum; used computer, media, or pictorial representations to facilitate presentation; and controlled the level of task difficulty. Less than half of the interventions explicitly presented the benefits of taught strategies (attributions) and reinforcement.
Table 4 shows a comparison of ES within studies and the reported instructional components. Note that positive ES is in favor of treatment groups, whereas negative ES is in favor of control groups. As shown, three studies (Fuchs et al., 2004; Woodward et al., 2001; Xin, Jitendra, & Deatline-Buchman, 2005) yielded ESs that ranged from 1.43 to 2.10 when comparing MD-only children in the treatment group and MD-only children in the control condition. The above three interventions shared the following common instructional components: sequencing, explicit practice, task reduction, advanced organizers, questioning, task difficulty control, elaboration, skill modeling, strategy cues, and small-group instruction. The study by Woodward and Baxter (1997) yielded a small ES of 0.28. The intervention of Woodward and Baxter was delivered in large groups.
Table 4 also shows that ESs for the MD + RD treatment group, when compared with the MD + RD control group, were more moderate in magnitude in contrast to MD-only comparisons. Two studies (Fuchs et al., 2004; Wilson & Sindelar, 1991) yielded large positive ESs (0.95 and 0.73, respectively), whereas two other interventions (Shiah et al., 1994–1995; Walker & Poteet, 1989–1990) yielded small or negative ESs (−0.15 and 0.24, respectively). Similar to the three interventions that yielded large treatment effects for MD-only groups compared with MD-only controls, the two more effective interventions comparing MD + RD treatment with their counterparts (Fuchs et al., 2004; Wilson & Sindelar, 1991) also included instructional components related to sequencing, explicit practice, task reduction, advanced organizers, questioning, task difficulty control, elaboration, skill modeling, strategy cues, and small-group instruction.
In summary, two important findings emerged. First, when children with MD-only were compared with MD-only in the control conditions, the ESs for solution accuracy yielded high outcomes (mean ES = 0.95). In contrast, the ESs were substantially lower for MD children with comorbid deficits for solution accuracy (M = −0.45). The second finding was that studies yielding high ESs used the follow components: sequencing, explicit practice, task reduction, advanced organizers, questioning, task difficulty control, elaboration, skill modeling, strategy cues, and small-group instruction.
Single-Subject Design Intervention Studies
Eight single-subject design studies met the selection criteria for this synthesis, and a summary of these studies is presented in Table 5. All studies were conducted in the United States, and the publication dates ranged from 1986 to 2009. The number of intervention sessions varied from 3 to 16 sessions, and the length of each session varied from 20 to 55 min. The intervention by Montague (1992) used materials extracted from middle school textbooks, whereas the remaining studies used researcher-developed materials. Three studies (e.g., Montague & Bos, 1986) adopted the design of a multiple baseline across participants to establish the functional relationship between the intervention and the targeted behavior. Five studies (e.g., Xin & Zhang, 2009) used a multiple-probe design across participants to assess treatment outcomes by additionally implementing posttests, maintenance, and/or generalization tests.
Summary of Single-Subject Studies Analyzed.
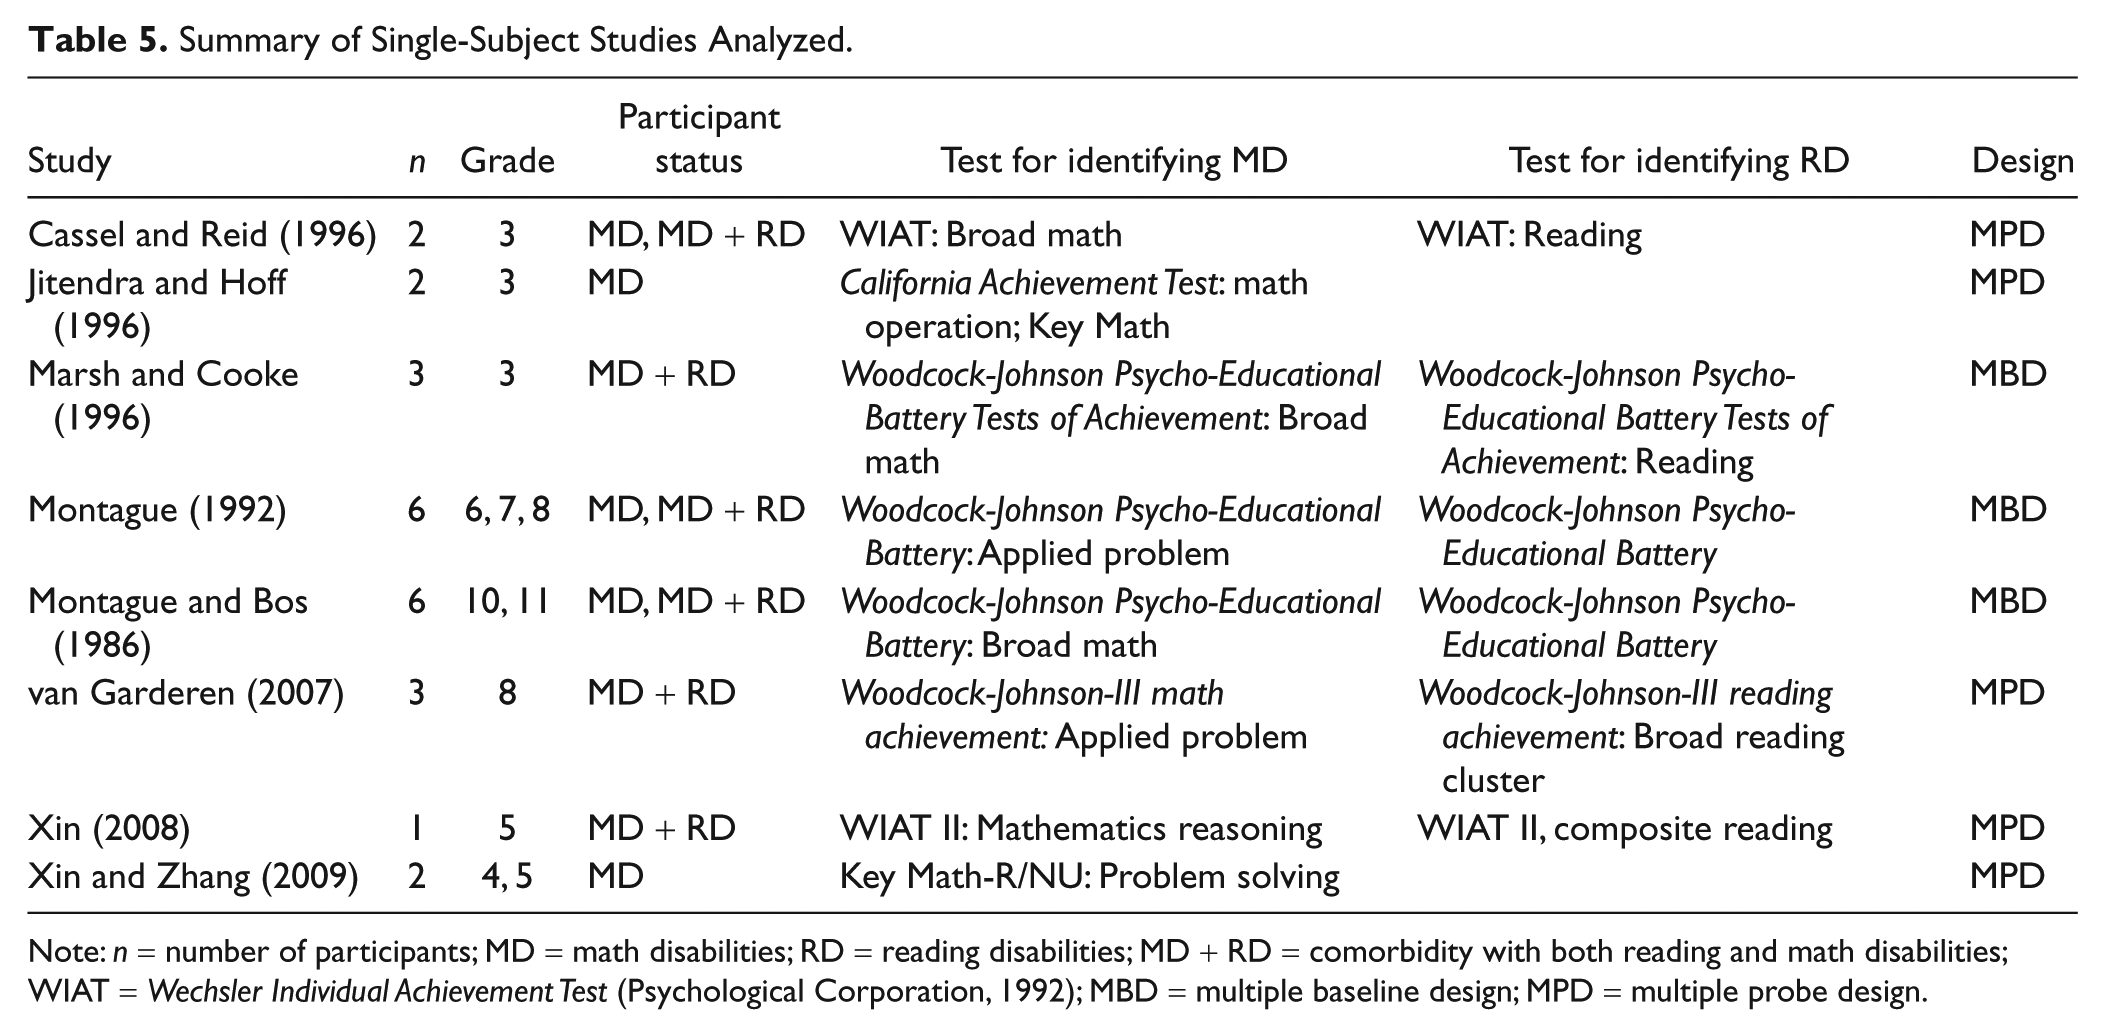
Note: n = number of participants; MD = math disabilities; RD = reading disabilities; MD + RD = comorbidity with both reading and math disabilities; WIAT = Wechsler Individual Achievement Test (Psychological Corporation, 1992); MBD = multiple baseline design; MPD = multiple probe design.
A total of 27 participants from eight single-subject studies met the criteria for inclusion. The demographic information for these participants is presented in Table 6. The mean age of the participants was 12.48 years (SD = 3.42), the average full scale IQ was 97.91 (SD = 8.27), the average standard score of broad math was 79.32 (SD = 9.28), and the average standard reading score was 86.52 (SD = 16.52).
Student Demographics for Single-Subject Design Studies.
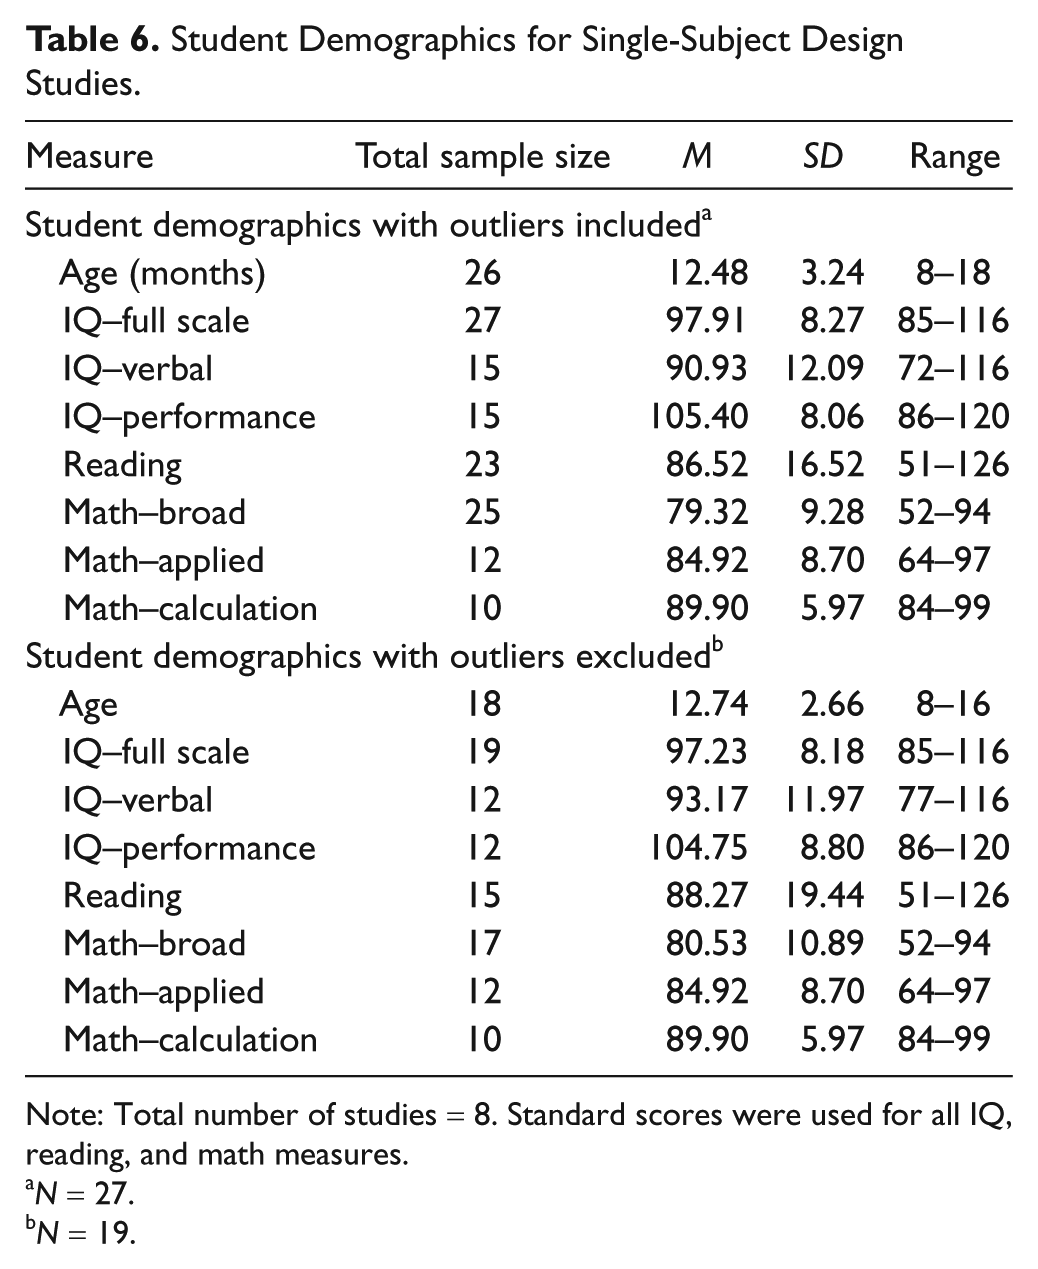
Note: Total number of studies = 8. Standard scores were used for all IQ, reading, and math measures.
N = 27.
N = 19.
The data for all 27 participants were used to calculate percentage of all nonoverlapping data (PAND; Parker et al., 2007). PAND was obtained by subtracting the percentage of overlapping data (9% for this synthesis) from 100%. The PAND was 91%. PAND was converted to Φ by multiplying PAND by 2 and subtracting 1 from the total (Parker et al., 2007). The obtained Φ was then converted to Cohen’s d (Cohen, 1988). The converted Cohen’s d for the 27 participants across eight studies was 2.91, which reflected a large treatment effect.
Using the modified Rosenthal’s (1994) formula to calculate ES for each participant, we detected outliers (ES larger than 3.00). Eight outliers were removed from the analysis. The average ES across 19 participants was 0.90, with a standard deviation of 0.82 (range = 0.09–2.99). The study of Marsh and Cooke (1996) was considered an outlier. Thus, the formula for repeated measures used by Swanson and Sachse-Lee (2000) was more conservative in estimates of ES and in line with the magnitude of the group design studies. The demographic information for the 19 participants is shown in Table 6. The 19 participants had an average Full Scale IQ of 97.23 (SD = 8.18), an average broad math score of 80.53 (SD = 10.89), and an average reading score of 88.27 (SD = 19.44).
All the intervention studies focused only on solving word problems involving multiple arithmetic operations. No study simultaneously focused on computation and problem-solving skills. Half of the studies included multiple-step word problems in line with school district curricula. Conceptual understanding was emphasized during the intervention in five studies.
Potential moderating variables were next examined. A median split was used to divide demographic variables (i.e., older age vs. younger age, high IQ vs. low IQ, and high broad math vs. low broad math). The 25th percentile in reading was used as cutoff to further categorize the individual participants into MD-only students or MD + RD students. A third category included participants without reported norm-referenced reading scores. A significant difference between ESs was found for reported reading scores, χ2(2, N = 19) = 4.22, p < .01. The average problem-solving outcome ES for students with MD only was 1.45 (SD = 0.94), the average ES for those with MD + RD was 0.58 (SD = 0.16), and the average ES for the MD students without reading scores reported was 0.35 (SD = 0.40). Variations in age, IQ, and broad math ability were not significantly related to treatment ESs.
We also examined whether the type of design and materials (curriculum based vs. experimenter developed) moderated ESs. The intervention design was found to be a statistically significant moderator, χ2(1, N = 19) = 4.32, p < .01. The mean ES for using multiple-baseline design (1.31, SD = 0.82) was significantly larger than the mean ES for using multiple-probe design (0.34, SD = 0.36). However, no significant effect was found when intervention materials were either curriculum based or not curriculum based, χ2(1, N = 19) = 0.37, p = .48.
Table 7 shows the occurrence of the instructional components and the aggregated ES using Rosenthal’s approach for each study. All eight single-subject design intervention studies reported nine components: sequencing, explicit practice, task reduction, advanced organizers, questioning, difficulty control, elaboration, skill modeling, and strategy cues. Seven studies reported one-on-one instruction, and only one intervention used small-group instruction (Marsh & Cooke, 1996). Reinforcement and technology were used in six studies. Only three studies used new materials. None of the studies reported using peer modeling, large group instruction, or supplementary instruction.
Summary of Reported Use of 18 Instructional Components for Single-Subject Studies.
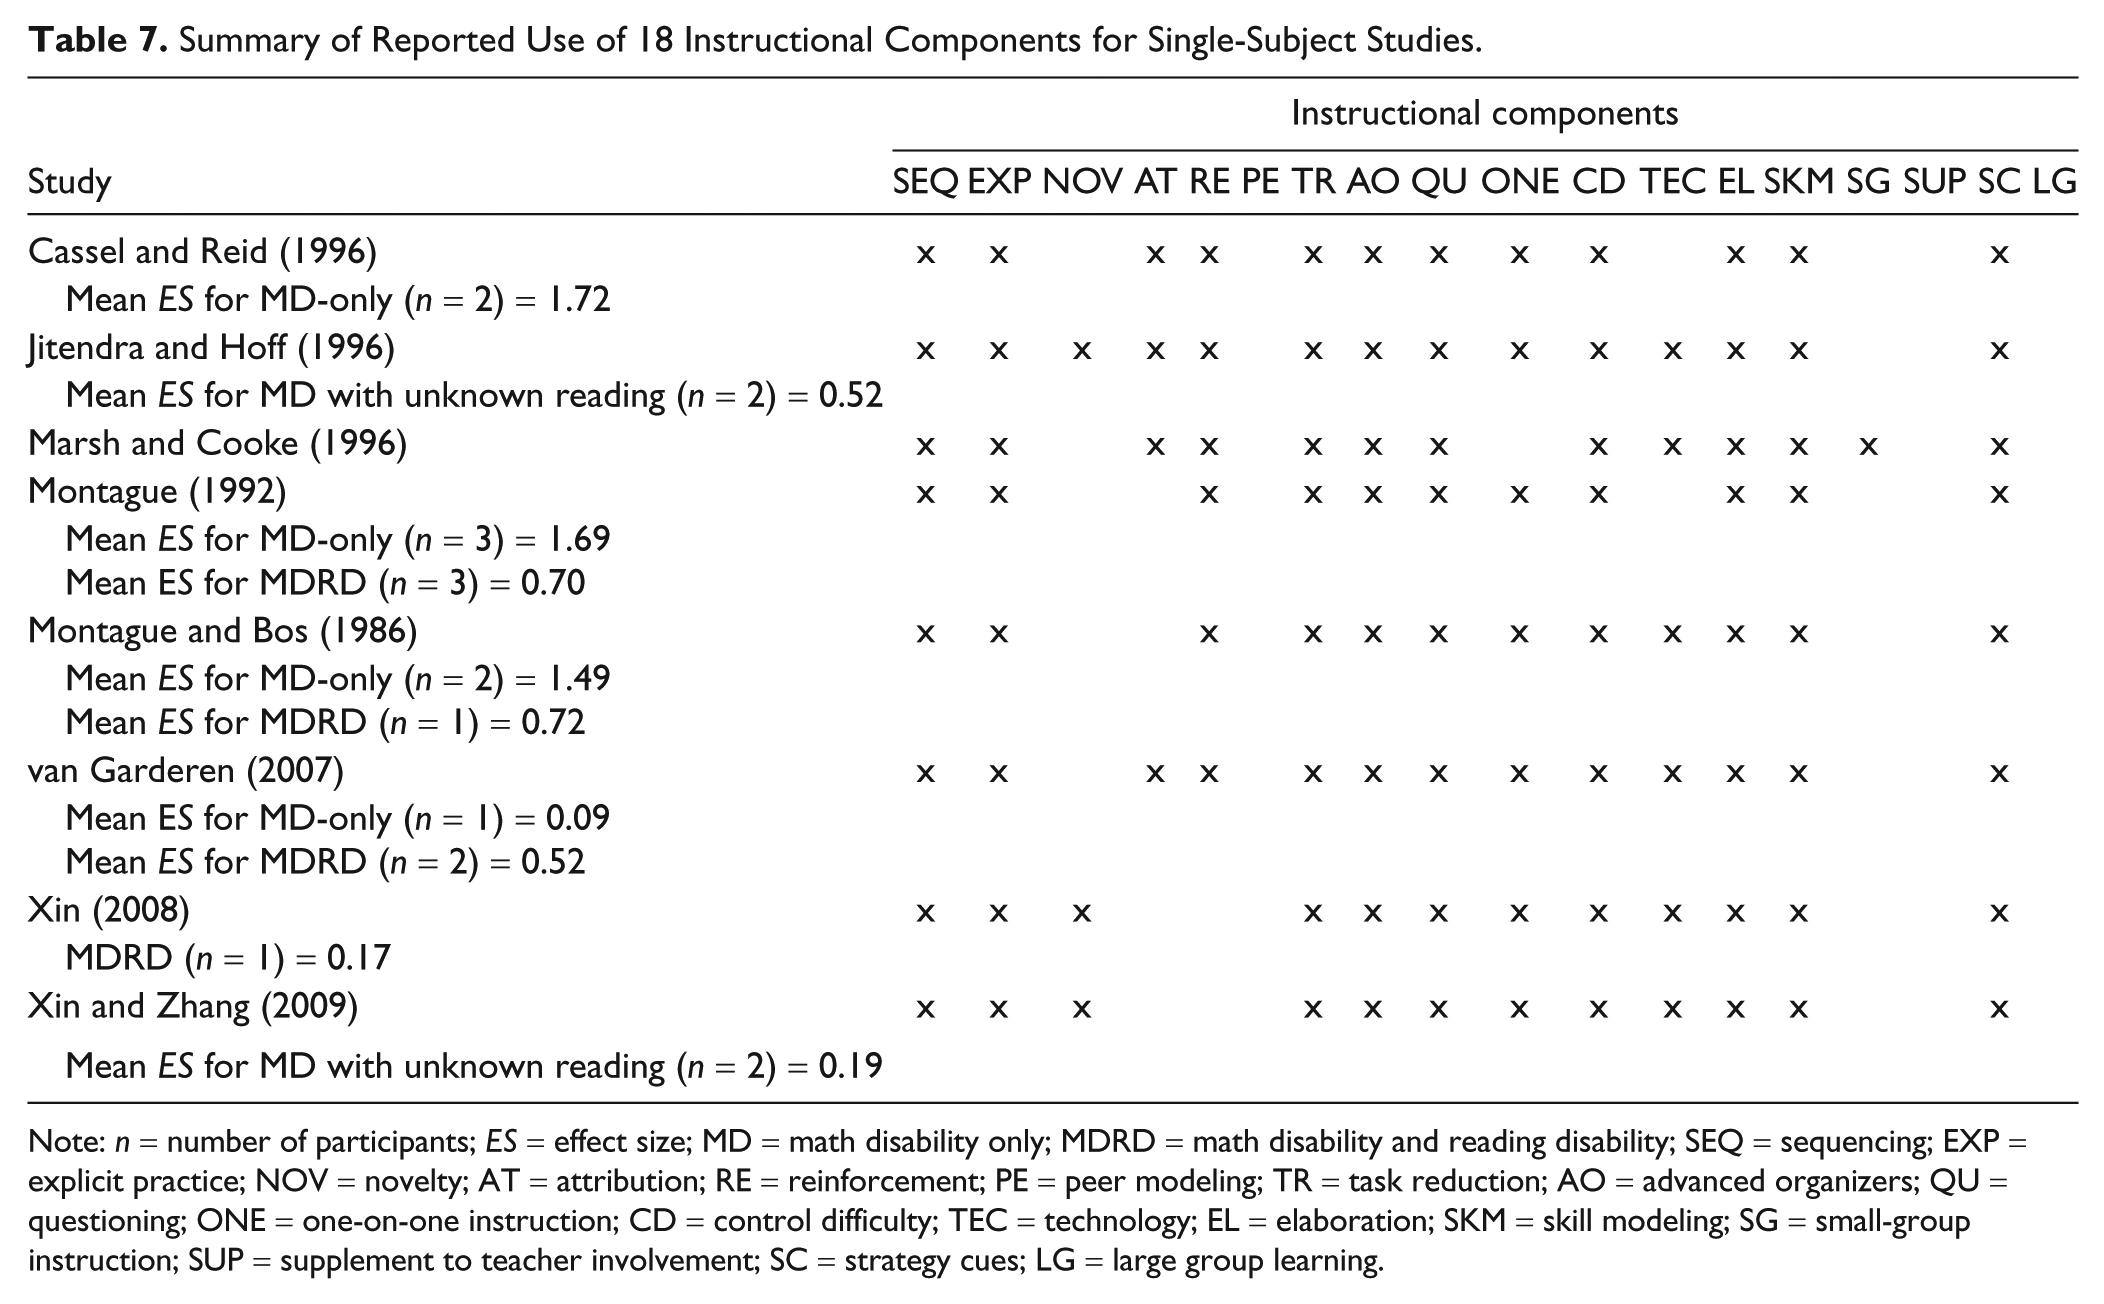
Note: n = number of participants; ES = effect size; MD = math disability only; MDRD = math disability and reading disability; SEQ = sequencing; EXP = explicit practice; NOV = novelty; AT = attribution; RE = reinforcement; PE = peer modeling; TR = task reduction; AO = advanced organizers; QU = questioning; ONE = one-on-one instruction; CD = control difficulty; TEC = technology; EL = elaboration; SKM = skill modeling; SG = small-group instruction; SUP = supplement to teacher involvement; SC = strategy cues; LG = large group learning.
In summary, a large ES (M = 2.91) based on 27 participants of eight studies emerged using the PAND approach (Parker et al., 2007). Using Rosenthal’s (1994) corrected d approach, seven selected studies consisting of 19 participants indicated that large ESs (M = 1.45) yielded for MD-only participants, moderate ESs (M = 0.58) for MD + RD participants, and small ESs (M = 0.35) for MD participants with no reading scores reported. The intervention studies included in our synthesis reported most of the 18 instructional components found in previous meta-analyses (e.g., Swanson & Hoskyn, 1998). Multiple-baseline design studies were found to yield higher ESs than those of multiple-probe design implementing postintervention assessment.
Discussion
The purpose of this selective meta-analysis was to identify the sample characteristics and instructional components that underlie effective intervention studies for enhancing mathematical word problem solving proficiency in children with MD. Prior syntheses identify direct and explicit instruction as critical instructional components associated with strong effects (e.g., Baker et al., 2002; Gersten et al., 2009; Swanson et al., 1999). Findings of this meta-analysis support previous analyses and extend findings to include differential effects between students with MD versus those with comorbid conditions (MD + RD), as well as identify additional moderators affecting intervention effects. We will now address three questions that directed this study.
Question 1: Do ESs in word problem solving interventions vary as a function of how children with MD vary in reading skills?
This question was addressed by focusing on the group design studies that allowed for between-group comparisons. The ESs for group design interventions varied from small to large across word problem solving skills. However, mixed findings were obtained for students with MD-only and MD + RD on word problem solving. Group interventions helped MD-only students make more gains in word problem solving accuracy than MD + RD students. The ESs computed for word problem solving across subcategories and for separate subcategories (e.g., concept understanding, accuracy) were consistently larger for MD-only treatment in comparison with MD-only control than for MD + RD treatment in comparison with MD + RD control.
Question 2: Do ESs in word problem solving interventions vary as a function of specific intervention components?
The results indicated that common instructional components underlie effective intervention studies for students with MD-only and students with MD + RD. The selected interventions that yielded larger ESs incorporated instructional components related to advance organizers, skill modeling, explicit practice, task difficulty control, elaboration, task reduction, questioning, and providing strategy cues. The majority of interventions used small-group instruction.
Overall, our synthesis is consistent with previous syntheses (e.g., Gersten et al., 2009; Swanson & Hoskyn, 1998) showing that explicit instruction is an effective approach for children with learning disabilities. A majority of interventions in the present synthesis adopted the model of combined strategy training and direct/explicit instruction. In addition, explicit practice was implemented in all of the interventions. This is consistent with the findings of Swanson and Hoskyn (2001) that explicit practice made a unique contribution to larger intervention ESs. Gersten et al. (2009) examined the impact of peer-assisted instruction ES and concluded that this component failed to benefit students with learning disabilities. Our synthesis found no intervention using peer modeling/assistance. We speculate that this may be because interventions that focus on higher order skills, such as word problem solving, would involve a significant period of time to train peer tutors.
Question 3: Do the general patterns on sample characteristics and instructional components found for group design studies hold for single-subject design studies?
The general pattern across group design and single-subject design studies revealed that reading skills moderate the magnitude of ESs. Higher outcomes occurred for children with MD only than for children with both MD and RD. As shown in Table 7 for single-design studies, the ESs for MD-only yielded a mean ES of 1.45, and participants with MD + RD yielded 0.58 relative to the baseline condition. Table 7 also indicated that there was tremendous overlap in the instructional components that yield high ESs. In general, studies reporting high ESs included the following components: (a) stating instruction objectives and/or directing students to focus on particular information (advanced organizers), (b) fading prompts and/or providing necessary assistance (control difficulty), (c) explaining underlying concepts and/or providing repetition within text (elaboration), (d) distributing review and practice (explicit practice), (e) engaging students in dialogue and asking questions (questioning), (f) sequencing short activities (sequencing), (g) skill modeling, (h) reminding students to use instructed strategies or procedures (strategy cues), and (i) breaking down the targeted skill into small units (task reduction). Another important finding was the reporting of ESs for single-subject design studies. Large ESs emerged using both PAND and Rosenthal’s formula. The Rosenthal formula was more in line with group design studies in terms of reporting ES than the PAND formula.
The intervention design was found to significantly moderate the magnitude of ES. Three studies used multiple-baseline designs, and five studies used multiple-probe designs. Interventions using multiple-baseline designs were found to yield larger ESs than those using multiple-probe designs. Complex multiple-step problems were adopted in some studies, and conceptual understanding was also emphasized. In all, 10 of the 18 instructional activities we examined were included in all the interventions (see Table 7). However, no single-case intervention used peer modeling or supplementary instruction.
Implications
Current intervention studies for mathematical word problem solving, including both group interventions and single-subject designs, work more effectively for students with MD-only when compared with children with MD + RD. We propose that a more complex mechanism underlies difficulties that students with both MD and RD have in solving mathematical word problems. We also suggest that the criterion for the assessment and identification of students with MD needs to be refined. We had to exclude several intervention studies due to poorly and vaguely defined participants with MD. Many studies only relied on recommendations from school or teachers to identify students with MD without conducting any standardized screening test of math skills. For those studies that used standardized math measures to identify students with MD, the measures varied from broad math to specific computation skill or word problem solving accuracy. Therefore, subgroups may underlie the general definition of MD.
Limitations
Our synthesis has at least three limitations. First, we only included peer-reviewed journal articles written in English and excluded dissertations, chapters, and unpublished studies. Such selection procedures reduce the generalization of our findings. Second, we had difficulty obtaining demographic data across studies. Several studies failed to report the accurate age of their participants. In addition, several studies failed to report IQ scores. The incomplete demographic and psychometric information for group interventions prevented us from examining additional moderating effects beyond reading on outcomes. Finally, we used rigorous criteria to exclude interventions that failed to define MD using a standardized math measure or did not have a comparison group (if group interventions), which resulted in a small sample size for this synthesis. Although our rigorous selection criteria increased the likelihood of quality in the research methods, a large number of potentially important studies were excluded from the current synthesis.
Summary
The present synthesis shows that the magnitude of treatment effects for children with MD varies as a function of their reading ability. The results also show that a great deal of commonality exists in the instructional components used in treatments that yield high ESs. The results also show that the patterns related to outcomes for children with MD in group design studies also occur in single-subject design studies.
Footnotes
Appendix
Intervention activities were coded based on key words and phrases (descriptions are abbreviated here).
Authors’ Note
The views expressed in this study do not necessarily reflect the views or opinions of the funding source.
Declaration of Conflicting Interests
The author(s) declared no potential conflicts of interest with respect to the research, authorship, and/or publication of this article.
Funding
The author(s) disclosed receipt of the following financial support for the research, authorship, and/or publication of this article: This study was funded by the Institute of Education Sciences (IES-Grant R324A090002) and a postdoctoral training grant (R324B08002) awarded to H. Lee Swanson.