
Abstract
Decision makers in developing countries are struggling to solve the present problems of solid waste management. Prioritisation and ranking of the most important indicators that influence the waste management system is very useful for any decision maker for the future planning and implementation of a sustainable waste management system. The aim of this study is to evaluate key indicators and their related sub-indicators in a group decision-making environment. In order to gain insight into the subject it was necessary to obtain the qualified opinions of decision makers from different countries who understand the situation in the sector of waste management in developing countries. An assessment is performed by 43 decision makers from both developed and developing countries, and the applied methodology is based on a combined use of the analytic hierarchy process, from the multi-criteria decision-making set of tools, and the preferential voting method known as Borda Count, which belongs to social choice theory. Pairwise comparison of indicators is performed with the analytic hierarchy process, and the ranking of indicators once obtained is assessed with Borda Count. Detailed analysis of the final results showed that the Institutional–Administrative indicator was the most important one, with the maximum weight as derived by both groups of decision makers. The results also showed that the combined use of the analytic hierarchy process and Borda Count contributes to the credibility and objectivity of the decision-making process, allowing its use in more complex waste management group decision-making problems to be recommended.
Keywords
Introduction
The role of modern technologies for waste management (WM), such as recycling and other forms of waste treatment and recovery, is growing in management practises in developed countries and it is expected that they will continue to change along with the needs of particular communities. However, the situation in WM in developing countries is mostly very different from that in the developed countries regarding legislation, financing, public awareness, social acceptance, and the development of Waste Management Strategies (WMSs) in such a framework is facing many future changes and challenges. According to the Millennium Development Goals report from 2015, the situation within developing countries regarding the reduction of poverty and hunger, improvement of education and health, and achieving environmental sustainability is not on satisfactory level (United Nations, 2015). In addition to the problem of WM, there are other significant problems that must be solved, such as access to pure drinking water and adequate sanitary conditions. The UNDP report showed that 45% of the population living in developing countries does not have adequate sanitation infrastructure, while 20% has no access to pure drinking water (United Nations Development Programme, 2010). This clearly indicates that environmental protection is not a priority. In most countries, municipalities are responsible for the provision of WM services (Al-Khatib et al., 2009). The responsibility of the municipality is to organise and manage the collection, transportation, treatment, and disposal of waste. Many municipalities in developing countries are facing a difficult struggle to manage their WM system in a sustainable manner, owing to increasing population and insufficient economic growth. These systems often become unsustainable or cease to exist owing to the different social, institutional, and technical limitations. The amount of generated waste is increasing exponentially, and thus new practises must be developed and implemented to provide functioning and sustainable WMSs, which will be adjusted to the needs and challenges of developing countries (Henry et al., 2006; Wilson, 2007).
The main problems in developing countries are a lack of political volition for an implementation of a strategy developed and the supporting legislation, lack of financial resources, expensive process of solid waste collection owing to high dispersion of settlements, and low quantity of waste per capita; there is also a social aspect, since complete implementation of the strategy will further increase the costs of WM services (Tot et al., 2016; Vujić et al., 2010a, 2010b).
Regarding the financial resources, Table 1 shows the slow gross domestic product (GDP) growth in six developing countries of South East Europe: Albania, Bosnia and Herzegovina, Kosovo, Macedonia, Montenegro, and Serbia (World Bank, 2017a). In 2015, Serbia recorded a GDP growth of 0.8%, which is not sufficient for new investments in the area of environmental protection and for achieving the sustainability of WM system (Table 1). In Serbia, the recovery of investments recorded in 2015 was 17.7% of the total GDP (National Bank of Serbia, 2015), which is still lower than in other similar countries, where the recovery of investments was over 20% (World Bank, 2017b). According to the World Bank in 2015, the recovery of world average investments to GDP was 23.215% (World Bank, 2017b). In order to achieve the preferred technical development of the WM system and to reduce negative impacts on the environment in non-EU South East Europe countries, it is necessary to increase GDP to projected growth rate for 2017, which is 3.2% (International Monetary Fund, 2016), and the recovery of investment share to at least 25% of the total GDP. The GDP growth will increase the living standard of citizens, furthermore, it means an increase in the national budget, which leads to an increment of the financial resources available for investment in WM.
GDP annual growth rate of six countries of South East Europe (SEE6).
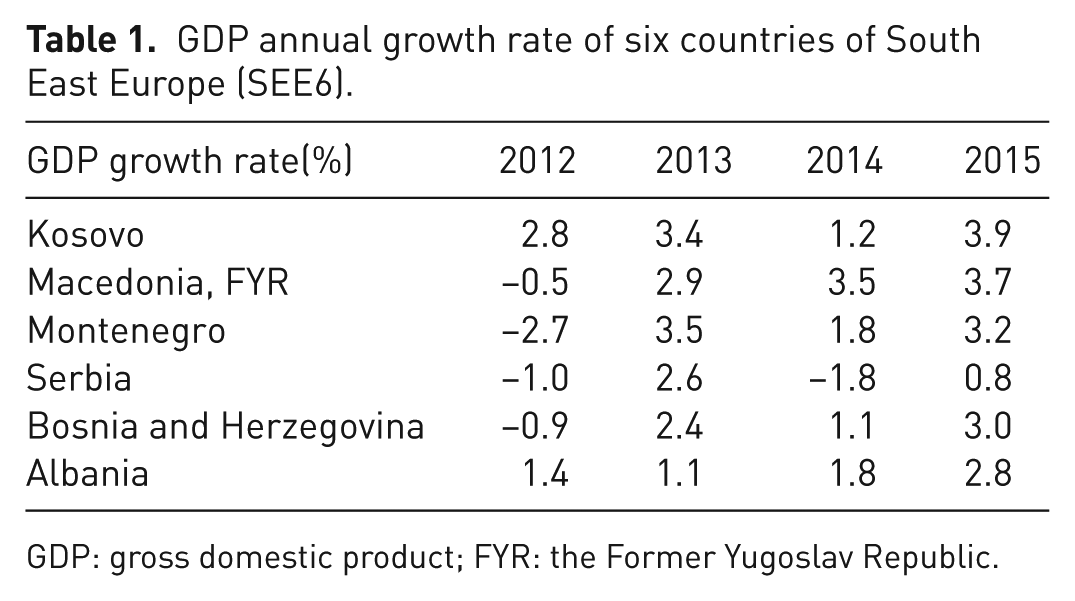
GDP: gross domestic product; FYR: the Former Yugoslav Republic.
Realisation of future activities that are intended to improve the WM system in developing countries largely depends on making the right decisions at the right time, but appropriate decision-making is not always easy to achieve (Mohemad et al., 2010). Sometimes, these decisions are made on the basis of a comparison between advantages and drawbacks of potential alternatives among the various potential states of the environment, which makes this process more complex owing to the large number of tangible and intangible indicators that must be taken into account (Sylla et al., 2010). Evaluation of the decision indicators is based on subjective views and assessments that reflect the subjective nature of the process and make it difficult to quantify (Singh and Tiong, 2005). This subjective nature and its impact on decision-making cannot be ignored. Considering that success in the decision-making process depends on the assessment of knowledge, experience, and anticipation, without a minimum level of specific skills and expertise, adequate decision-making on a certain issue is not possible (Saaty, 2005).
In this research, the analytic hierarchy process (AHP) and Borda Count (BC) methods were used to assess weight coefficients in order to determine which of four indicators and 14 sub-indicators are preferred by decision makers (DMs) from developed and developing countries. The AHP, which was developed by Saaty (1970), is a well-known method that allows DMs to model a complex problem in WM through a hierarchical structure (Contreras et al., 2008; Garfi et al., 2009; Lakicevic et al., 2014; Srdjevic et al., 2013; Su et al., 2007; Tot et al., 2016). According to Srdjevic (2007), methods can be divided into two groups: Multi-criteria analysis and optimisation on the one hand and optional social (voting) methods on the other. These methods can be used when decisions are evaluated from the standpoint of ecology, social justice, social development, and so on, hence in relation to the categories that are difficult to measure objectively. The BC method follows the modern requirements for responsible decision-making and is closely related to the methodology of multi-criteria analysis and optimisation, particularly in the context of group decision-making (D’ Angelo et al., 1998).
The developed framework, which is based on the AHP and BC methods, is efficient, provides satisfactory results and, therefore, encourages rational decision-making. This framework contributes to the credibility and objectivity of the decision-making process by minimising the possibility of errors owing to human factors.
The objectives of this research are: (1) to assess the importance of key indicators and their corresponding sub-indicators used for evaluation of solid waste management strategies by two groups of DMs – Group 1 comprises 20 DMs from developed countries (who had had the opportunity to live in, work on projects or cooperate with developing countries and therefore understood the specific situation and problems of their waste management sectors), while Group 2 comprises 23 DMs from developing countries; (2) to compare the results obtained by Groups 1 and 2; (3) to assess the applicability of selected methododology; and (4) to recommend a decision-making framework for more complex WM problems.
Materials and method
The goal of solid waste management strategies in developing countries is to identify the decision-making methods used to indicate the major problems that influence poor development of the WM system. Besides that, the goal is to determine the need for institutional, legislative, and educational development, to raise public awareness, and to identify the financial mechanisms for investment in sustainable long-term WM activities. A defined set of indicators and sub-indicators should symbolise the objectives of the DM as well as the requirements that are the goal of conducting the process. Tot et al. (2016) identified key indicators and sub-indicators that are closely associated with the development of a solid WMS that are shown in Figure 1.
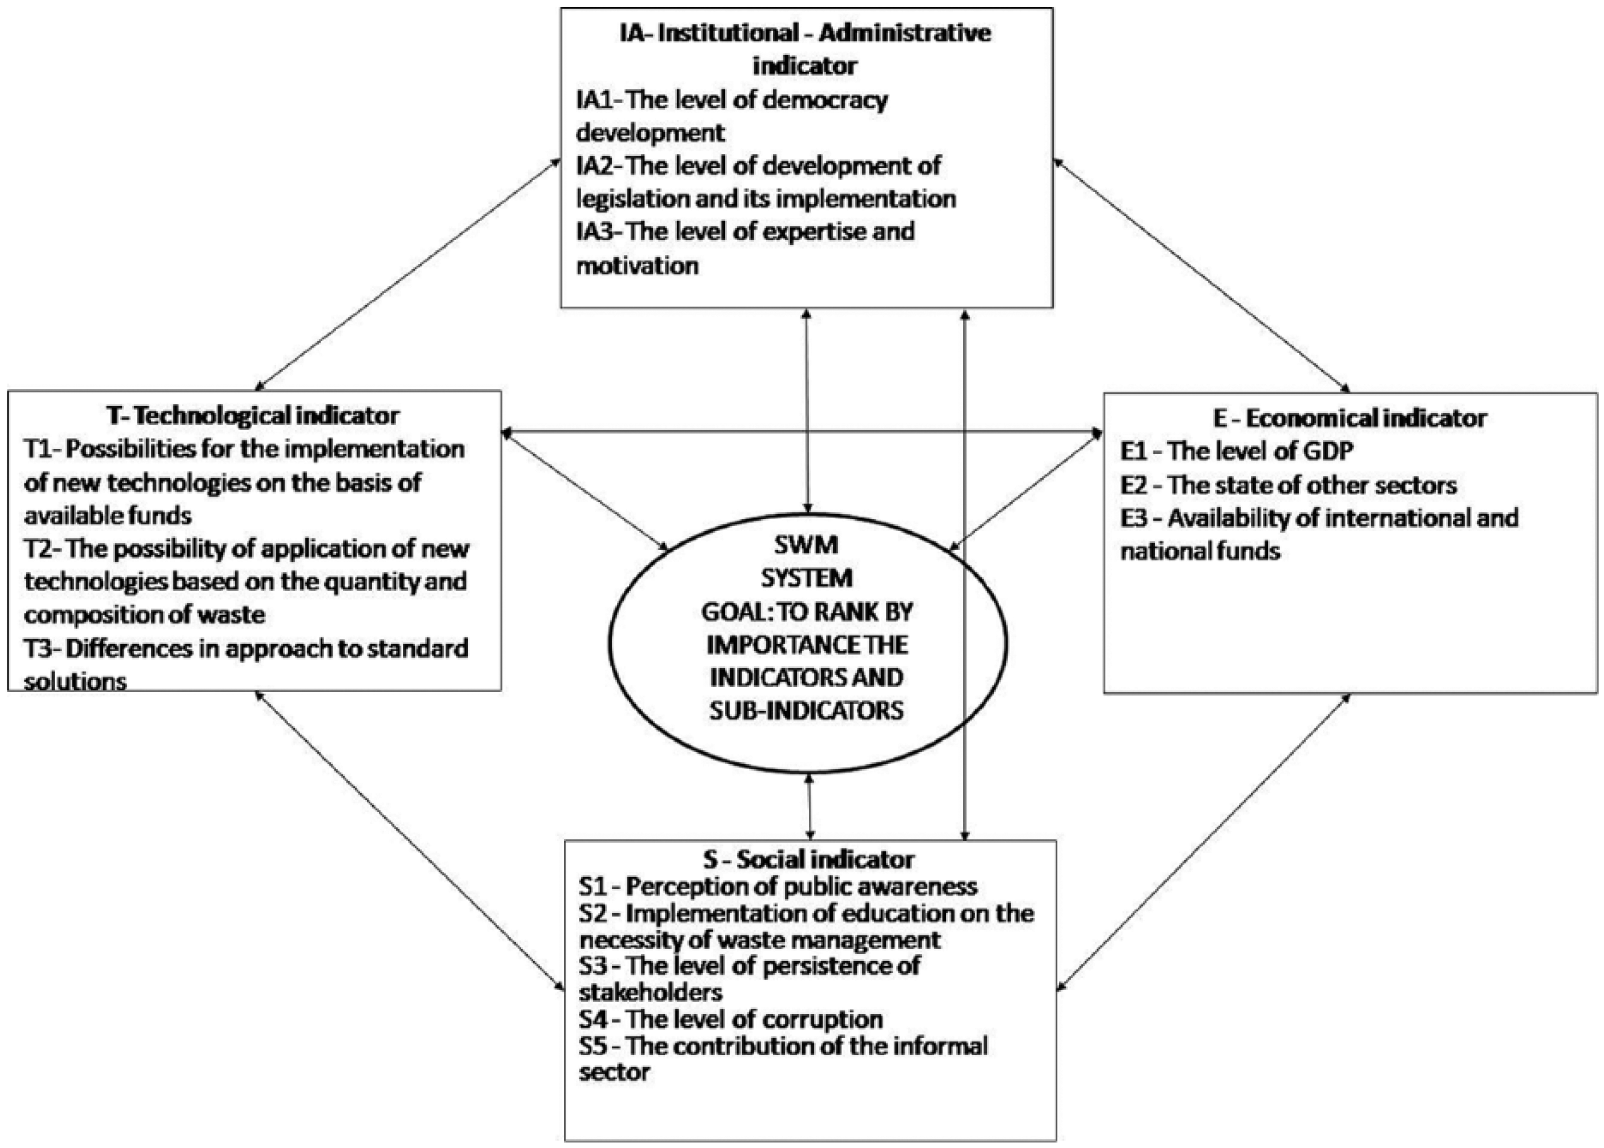
The interactions of indicators and sub-indicators in SWM system in developing countries (Tot et al., 2016).
Statement of the problem
One of the problems in developing countries is that the administration does not issue opinions and permits within the statutory deadlines. The resolution of property legal affairs can take up to 2 years. The legal procedure in municipalities is complicated owing to incomplete legislation. If there is no spatial plan, an urban plan cannot be made without the support of the municipality within a reasonable period of time.
Underdevelopment of the administrative capacity, which is responsible for fulfilling the obligations imposed by the European Union in the field of WM, is particularly evident at the level of local authorities and municipalities, which should be the main stakeholders in the planning, promotion, and implementation of WM.
The rate of generation of waste dictates the scale of the WM system. The composition and quantity of waste can affect the choice of the form of management and options for treatment. Before selecting a technology, control over all waste streams needs to be established (Mrayyan and Hamdi, 2006). The analysis of waste is one of the most important types of information for successful planning of a sustainable WM system in order to adequately estimate the size, type, quantity, and capacity of necessary infrastructure. In developing countries, the lack of this analysis leads to the selection of unsuitable techniques for waste treatment. Every country has its own solution for waste treatment, which is derived from a choice between a variety of technologies, and each of them is the best. It is often the case that the government is burdened not only by the current political and economic situation, but also by unresolved issues of WM. In such a situation, the government is facing new challenges, for example owing to economic interests and strong influence of lobby groups that is being imposed to accept the most expensive technology for WM, and also to promote this technology as the best solution available (Tot et al., 2016).
Developing countries do not have adequate funds intended for infrastructure investments. Since there is no institution that can manage funding, a ministry becomes responsible for granting subsidies, but unfortunately does not have enough administrative capacity to take over the role of overseeing funding.
In developing countries, citizens do not perceive the problem of WM as their own but as someone else’s. Consequently, someone else is always responsible for the resolution of the problem: Either the state, the local authorities, industry, or the neighbours. In developing countries, the interest of the public in direct participation in the design and implementation of environmental policy is increasing but is still very limiting (Boonrod et al., 2015), and this is accompanied by a general apathy related to active and responsible participation in politics in general (Moghadam et al., 2009). Many people are aware of the problem of solid waste generation, but most do not have a sense of personal responsibility (Achillas et al., 2011). In a long-term sense, an existence, social problems, and health care are the most concerning issues for the citizens in developing countries. People are realising that environmental issues will not be placed on the agenda until all the ‘more important’ issues have been resolved (Tot et al., 2016).
Method
This research is a continuation of a research published in a previous scientific article (Tot et al., 2016) focusing on the identification of problems in the framework of WMSs. Furthermore, an assessment of indicators and sub-indicators is based on empirical data. The selection method and determination of sample size was carried out on the basis of the principles of the experimental plan. For the purpose of this research, a survey aimed at DMs was created. The survey is based on a combination of AHP questionnaires and scales of evaluation. Implementation of the research and the collection of data, information, views, and opinions on the research problem are based on completion of the survey.
This survey was used to obtain data and information from 43 DMs (the first group of 20 DMs (DMsG1) from developed countries and the second group of 23 DMs (DMsG2) from developing countries). DMs, such as politicians, experts (academics, professional engineers, planners, etc.) on WM systems, and officials in charge of public and private utility companies from developed and developing countries, were identified as key participants in this study. Furthermore, participants were identified based on their knowledge, expertise, and abilities in the development and implementation of WMSs. The generality of the application of the model is provided through the analysis of a state of WM that is based on the quantified judgment of DMs from developing countries and DMs from developed countries.
The research was conducted on a voluntary and anonymous basis in order to obtain honest and realistic answers to questions from the participants. In this research, there is a certain limitation that could also serve as a basis on which this research could be expanded further in the future. Given that this research is an evaluation of predefined indicators and sub-indicators (Tot et al., 2016), participants only had to give their weighting preferences.
First, this research was planned as an empirical research that uses a model based on the AHP method in order to support DMs through the process of making decisions. Significances (weights) of four main indicators and 14 sub-indicators were obtained by conducting a survey research in which pairwise comparisons were made. Therefore, it was important to provide all the necessary information about the defined indicators and their corresponding sub-indicators to the DMs. Second, prioritisation of significances (weights) of the defined indicators and sub-indicators was conducted by DMs in order to identify their preference degrees. One of the basic problems is determination of the weights of the indicators, and therefore DMs were asked to determine the overall relative significances of each of the defined indicators and their corresponding sub-indicators in order to make a decision on the WMSs in developing countries through quantification of personal preferences in their mutual comparison. Third, the geometric mean method was used to aggregate individual judgments into a group judgment. Lastly, the BC was applied to rank and prioritise the indicators. A sensitivity analysis of all the results was performed in order to verify the extent to which certain weights were consistent.
Decision-making tools
AHP
The multi-criteria decision-making method most frequently used in WM in the last decade is AHP (Coelho et al., 2017). The AHP method establishes a link between goal, indicators, and alternatives for derived weights and consistency checks. According to Saaty (2007), the AHP method is a method that is placed in the context of the theory of relative measurement and that derives normalised values based on pairwise comparison of indicators/alternatives that could be used as a priority. The method allows the ranking of different indicators through pairwise comparisons that are obtained by a group of experts, and on the basis of these comparisons, the relative weights of decision-making indicators and sub-indicators are determined (Zavadskas et al., 2005).
Through the use of the AHP method, the previously defined indicators and sub-indicators were evaluated in pairs in order to determine the relative significance among them and the relative weights in relation to the overall objective of the research (Saaty, 2007). The matrix comparison has the following general formula:
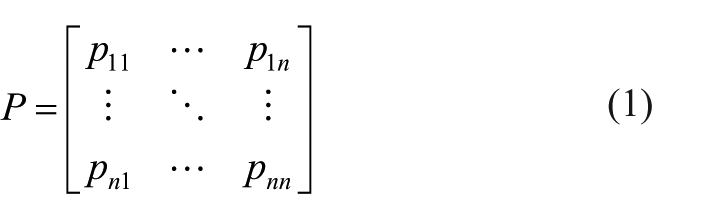
where the matrix P represents a real-value matrix of size n × n, while n represents the number of evaluation indicators to be considered. Each pij of the matrix P represents the significance of the ith indicator relative to the jth indicator. If pij>1, then the ith indicator is more significant than the jth indicator, whereas if pij<1, the ith indicator is less significant than the jth indicator. In the case where 0 > p > 1, the ith indicator is less important than the jth indicator. If two indicators have equal significance, pij is 1. Furthermore, all elements of the matrix P must meet the following restrictions: pij × pji = 1, and at the end, all the elements of the main diagonal need to be equal to one, pii = 1. In the normalised pairwise comparison matrix Pnorm, the sum of the entries in each column is equal to 1. It is performed when each element of the matrix of n is divided by the sum of elements in the appropriate column.
The geometrical values of normalised matrices were calculated in order to obtain the weight coefficients. The calculation of the weights is conducted by using equation (2):
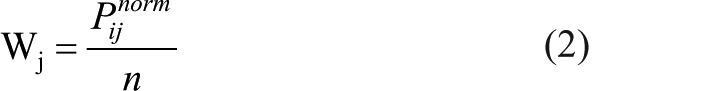
where n represents the number of indicators that are compared and wj represents the weight coefficients for each of the indicators.
For verification, the level of the consistency ratio (CR) was used. Depending on the number of indicators and sub-indicators being compared, a CR of up to 0.20 can be accepted (Saaty and Kearns, 1985). The acceptance of a higher CR also depends on the specific decision problem and the out-coming priorities. The rule of CR > 0.1 is obviously too strict for practical applications and would have resulted in rejection and revision of the majority of survey responses.
Being based on the subjective opinion of the DMs, the AHP method is weaker than other methods and the data obtained from its application can be unreliable, which can further lead to imperfect decisions. With the aim of reducing the risk of subjective reasoning, it is recommended that decisions be made collaboratively. One of the suggested ways is by the aggregation of individual decisions into a single representative decision for the entire group (Lakicevic et al., 2014; Srdjevic et al., 2013).
Borda Count
Each DM provides a linear ordering of the indicators. Each indicator is assigned a Borda score (BS) as follows: If there are four indicators, they receive 3 points for first place, 2 points for second place, 1 point for third place, and 0 points for last place, in order of preference (Emerson, 2013). The final BS for each indicator and sub-indicator is calculated as the sum of the products of the points allocated to each place and the number of assigned votes. The indicator and sub-indicator with the highest BSs are declared as the social choices (winners) (D’Angelo et al., 1998; Srdjevic, 2007).
Results and discussion
The AHP method was employed to determine the indicators’ and sub-indicators’ weights. The weights were calculated for each indicator and sub-indicator based on the judgment of two expert groups (DMsG1 and DMsG2) (Table 2). Each of the 43 DMs compared the indicators and sub-indicators that have an impact on the development of WM systems in developing countries and filled in the 3 × 3, 4 × 4, and 5 × 5 matrices; based on the geometric aggregation of individual AHP vectors, the priority vector was generated. Table 2 shows the evaluations and consistency measures suggested by all DMs from developed and developing countries. The most substantial inconsistencies were demonstrated by DM3G1 (CR = 1.23), DM7G1 (CR = 0.20), and DM17G1 (CR = 0.20) within the first group and by DM8G2 (CR = 0.23), DM9G2 (CR = 0.20), and DM16G2 (CR = 0.58) within the second group. However, these DMs were reluctant to alter their evaluations, claiming that their choices were made deliberately.
Priority vectors for DMs from developed and developing countries (DMsG1, DMsG2) and the geometric mean of individual AHP vectors.
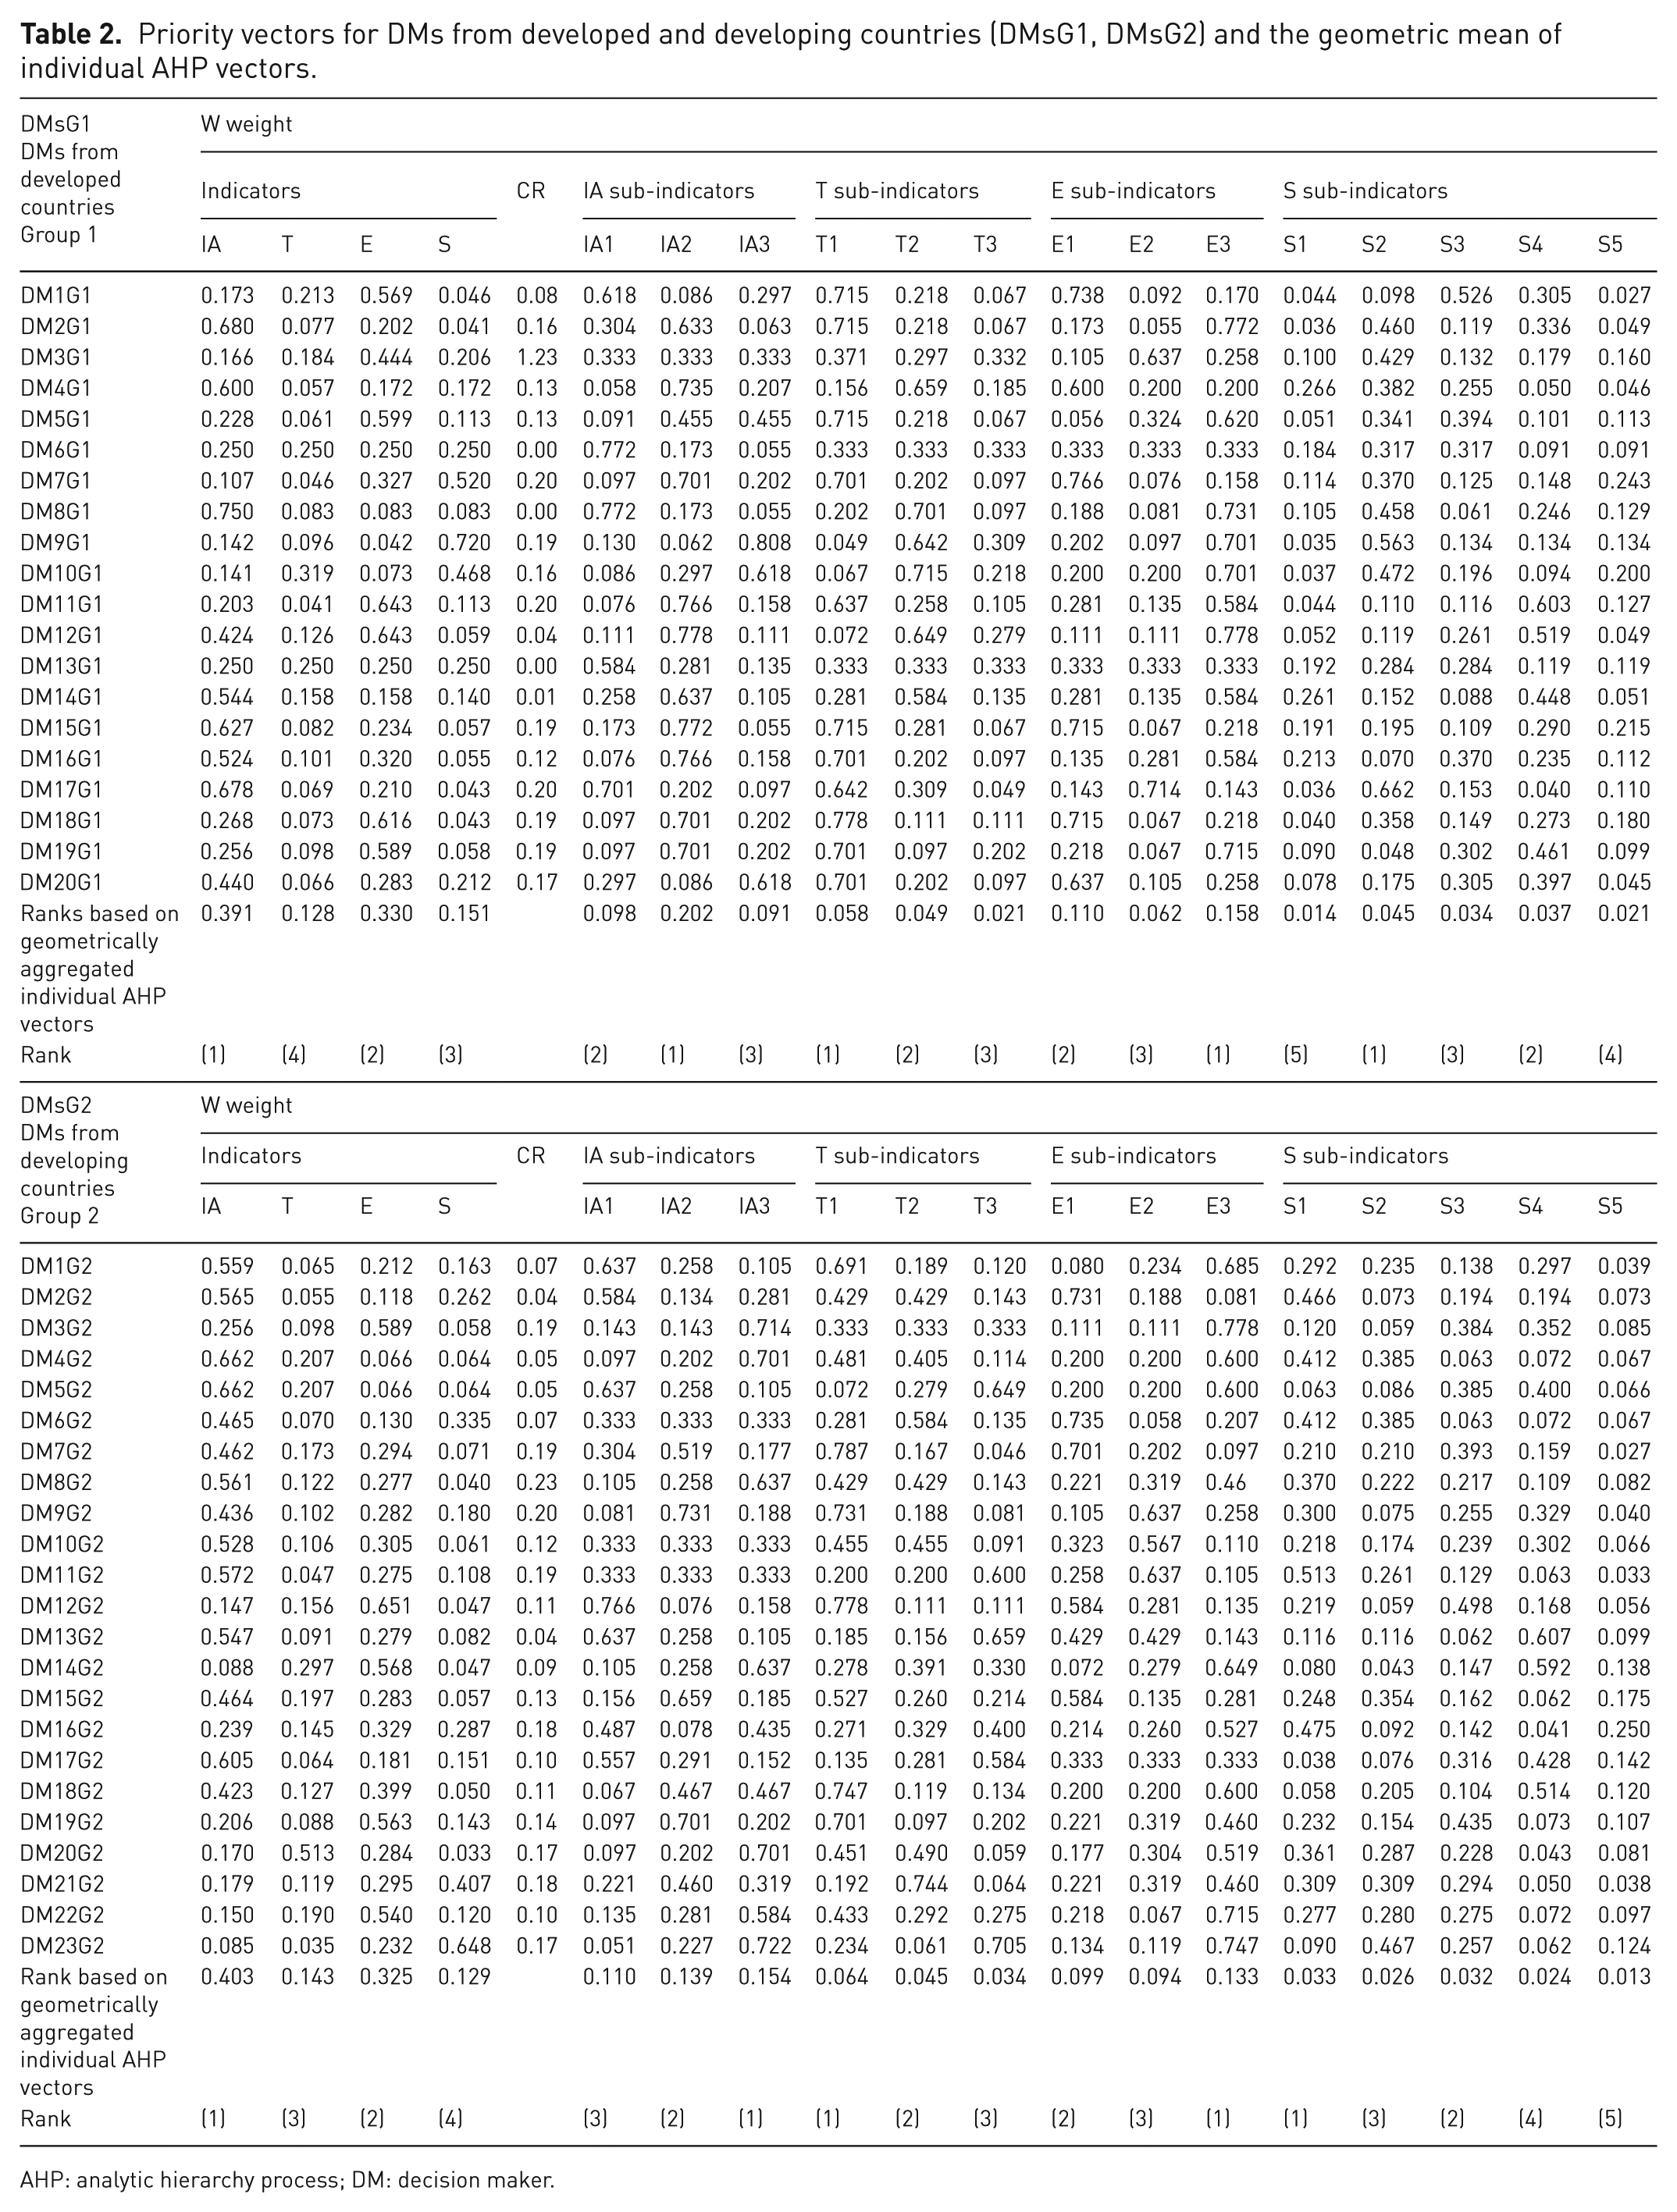
AHP: analytic hierarchy process; DM: decision maker.
Table 2 shows the final scores of indicators based on the geometrically aggregated individual AHP vectors. The results in Table 2 indicate that the maximum weight was assigned to the institutional–administrative indicator by both groups of DMs (DMsG1: 0.391; DMsG2: 0.403). The economic indicator took second place according to both groups. DMsG1 (0.151) ranked the social indicator in third place, whereas DMsG2 ranked the technological indicator in third place.
The individual preferences are given as cardinal numbers in Table 2. First, the cardinal numbers were converted to ordinal numbers (ranks) by the BC (Table 3). Then the preference among indicators is defined as the sum of these ranks. As shown in Table 3, according to the DMs from developed countries, the institutional–administrative indicator was selected as the most important with 38 points, followed by the economic indicator with 40 points, the social indicator with 60.5, and the technological indicator with 61.5. DMs from developing countries also identified the institutional–administrative indicator as the most important with 39 points, followed by the economic indicator in second place with 44 points, but they inverted the above ranking by putting the technological indicator in third place with 72 points, while the social indicator took fourth place with 75 points.
Borda count of indicators and sub-indicators based on individual AHP priority vectors.
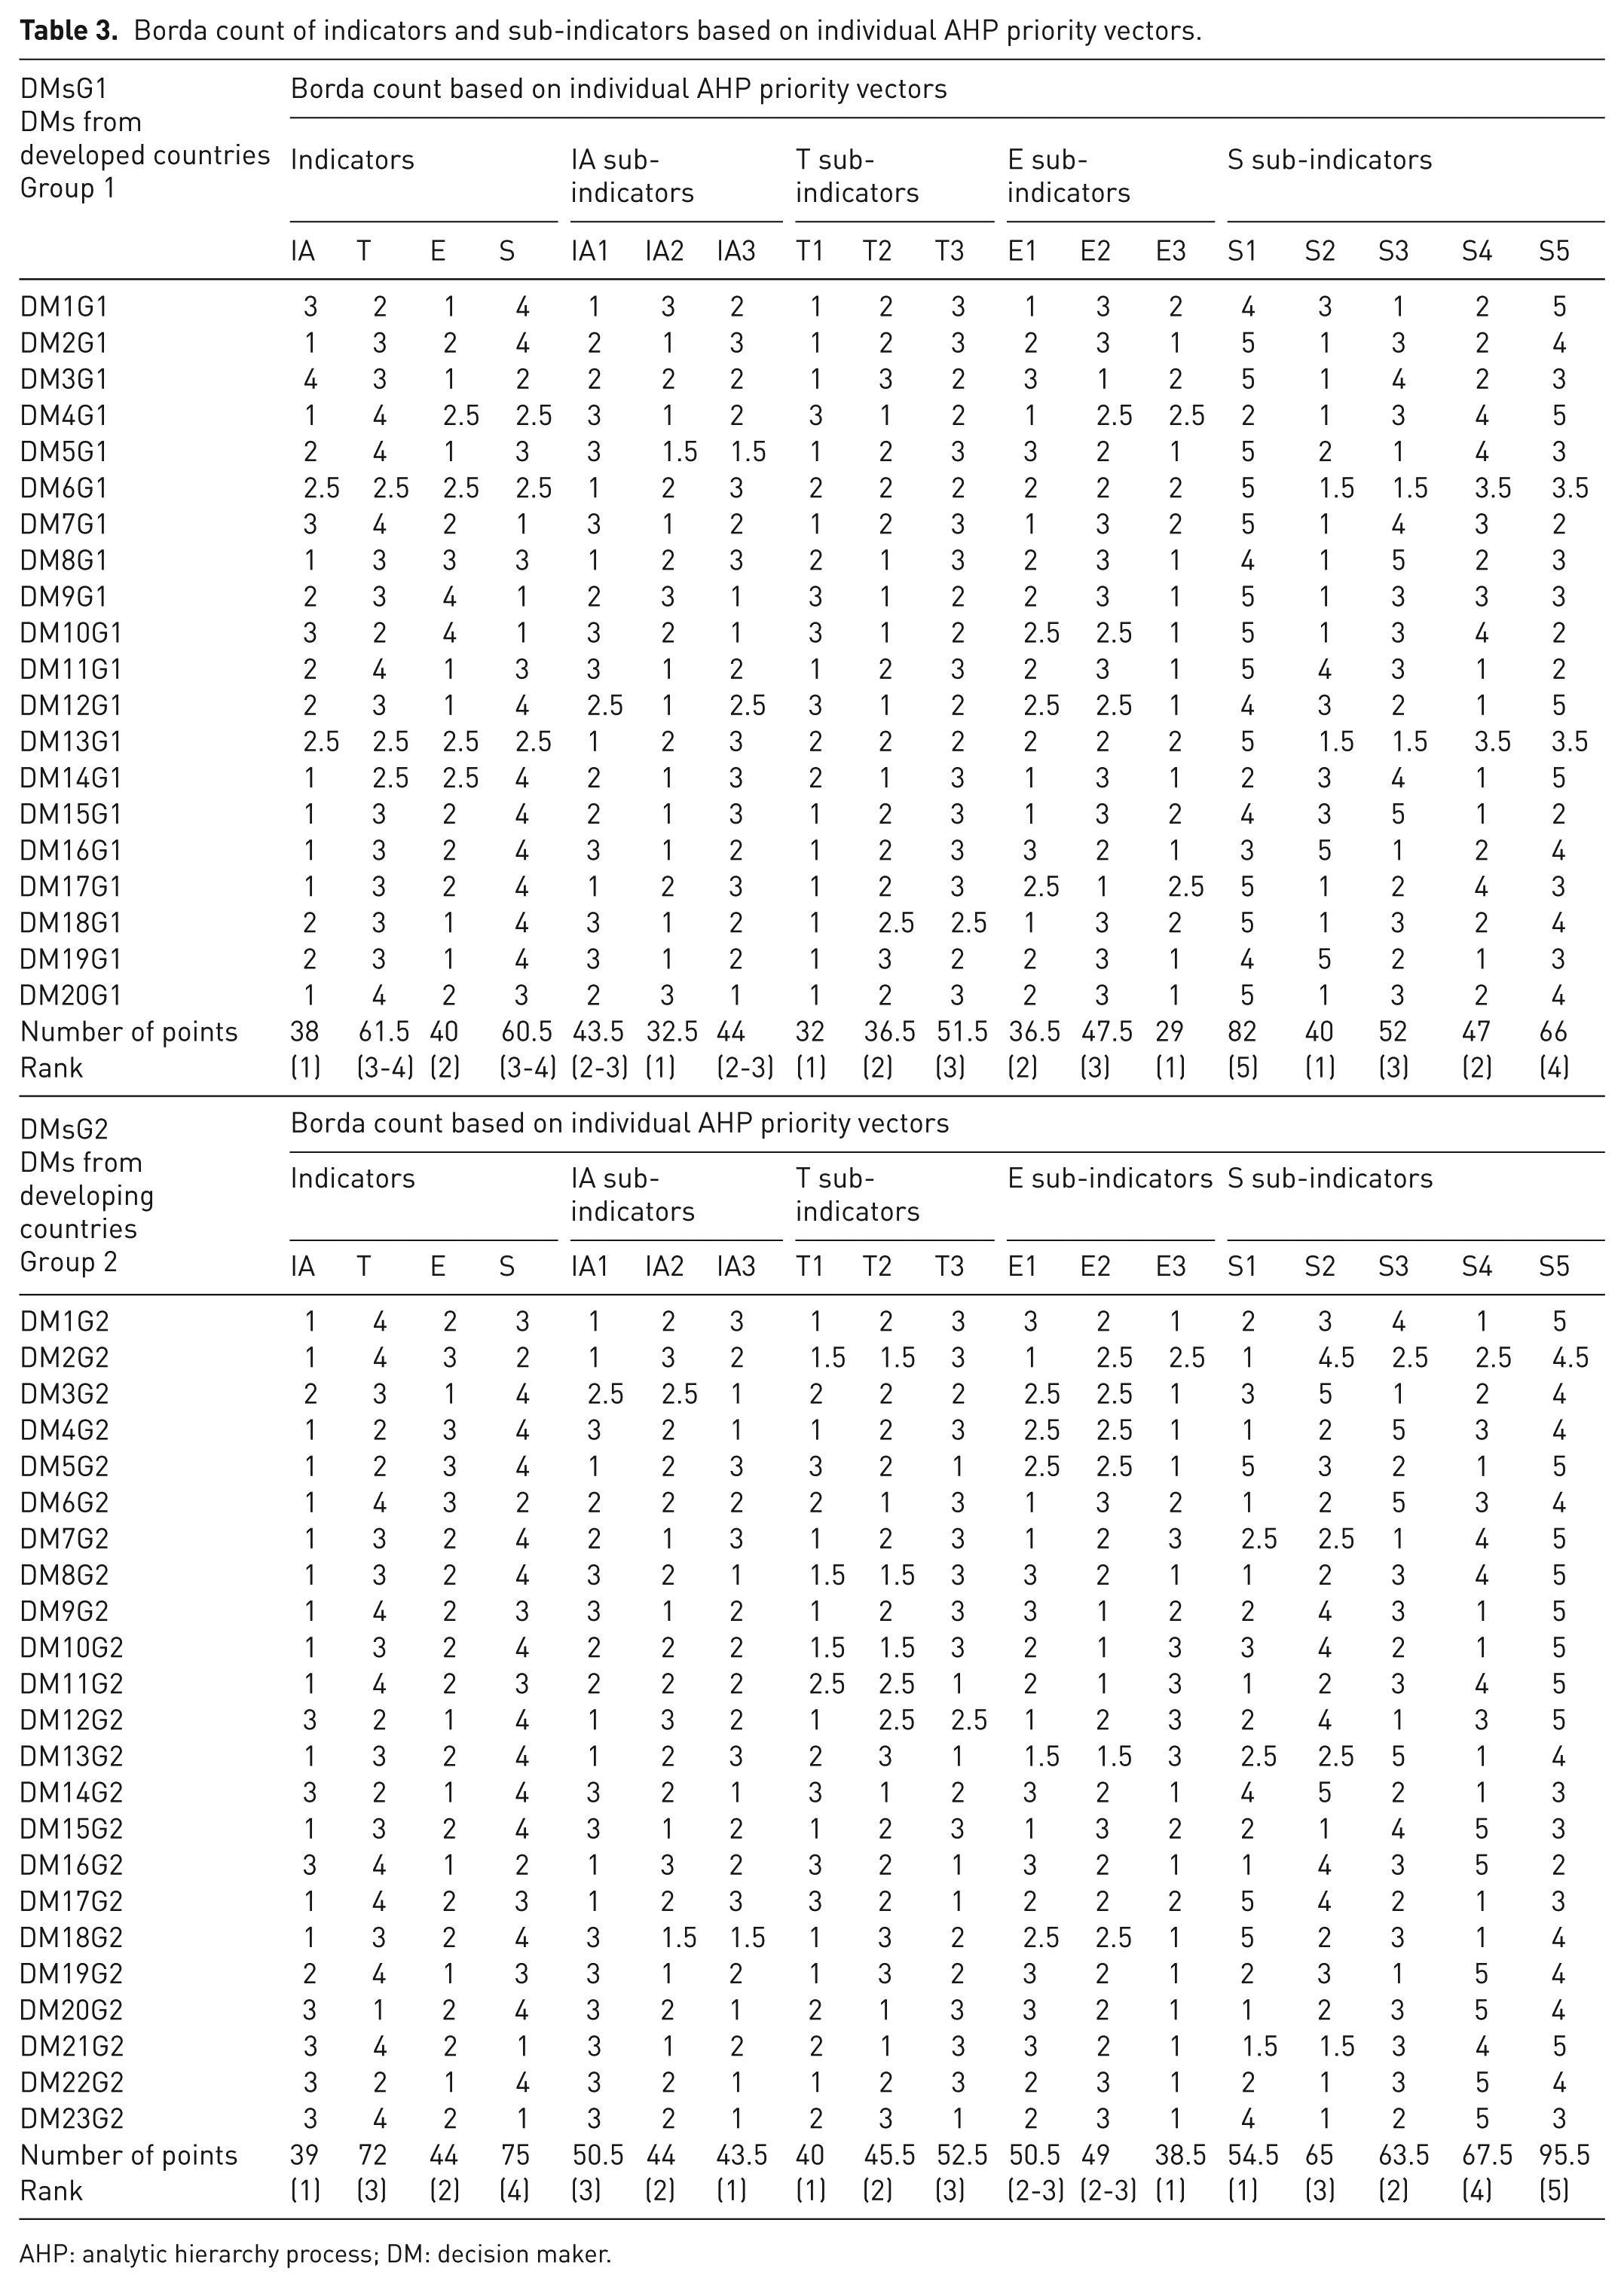
AHP: analytic hierarchy process; DM: decision maker.
Considering the following voting situation with 20 DMs from developed countries (Group 1), four indicators, and 14 corresponding sub-indicators, the BS for each of the indicators can be calculated as follows:
BS(IA) = 3 × 11 + 2 × 8 + 1 × 5 + 0 × 3 = 54
BS(T) = 3 × 2 + 2 × 5 + 1 × 13 + 0 × 6 = 29
BS(E) = 3 × 9 + 2 × 10 + 1 × 5 + 0 × 4 = 52
BS(S) = 3 × 5 + 2 × 4 + 1 × 6 + 0 × 11 = 29
The indicator with the highest total score is the ‘winner’. The ranking given by the BS is IA > E > S > T, so IA is the Borda ‘winner’.
The BSs of the sub-indicators are IA2 > IA3 > IA1; T1 > T2 > T3; E3 > E1 > E2; and S2 > S4 > S3 > S5 > S1. Thus, IA2, T1, E3, and S2 were selected as the winners, that is, the social choices, as they obtained the highest BS values.
Considering the following voting situation with 23 DMs from developing countries (Group 2), the BSs for the indicators are:
BS(IA) = 3 × 14 + 2 × 2 + 1 × 7 + 0 × 0 = 53
BS(T) = 3 × 1 + 2 × 5 + 1 × 7 + 0 × 10 = 20
BS(E) = 3 × 6 + 2 × 13 + 1 × 4 + 0 × 0 = 48
BS(S) = 3 × 2 + 2 × 3 + 1 × 5 + 0 × 13 = 17
Given the four indicators mentioned above, after applying the BC method, the IA indicator is the ‘winner’ with 53 points in terms of influencing the development of WM in developing countries. The BSs of the sub-indicators are IA2 > IA3 > IA1; T1 > T2 > T3; E3 > E2 > E1; and S1 > S3 > S2 > S4 > S5. According to the ranking created by the DMs from developing countries, the sub-indicators IA2, T1, E3, and S1 are the Borda winners.
Table 4 shows the ranking of variants from the most important to the least important, considering the evaluation of indicators and sub-indicators. Table 4 summarises the results of the average that is calculated with different aggregation methods, some derived from AHP and others derived from voting methods, such as BC.
Summary results of the average calculated with different aggregation methods.
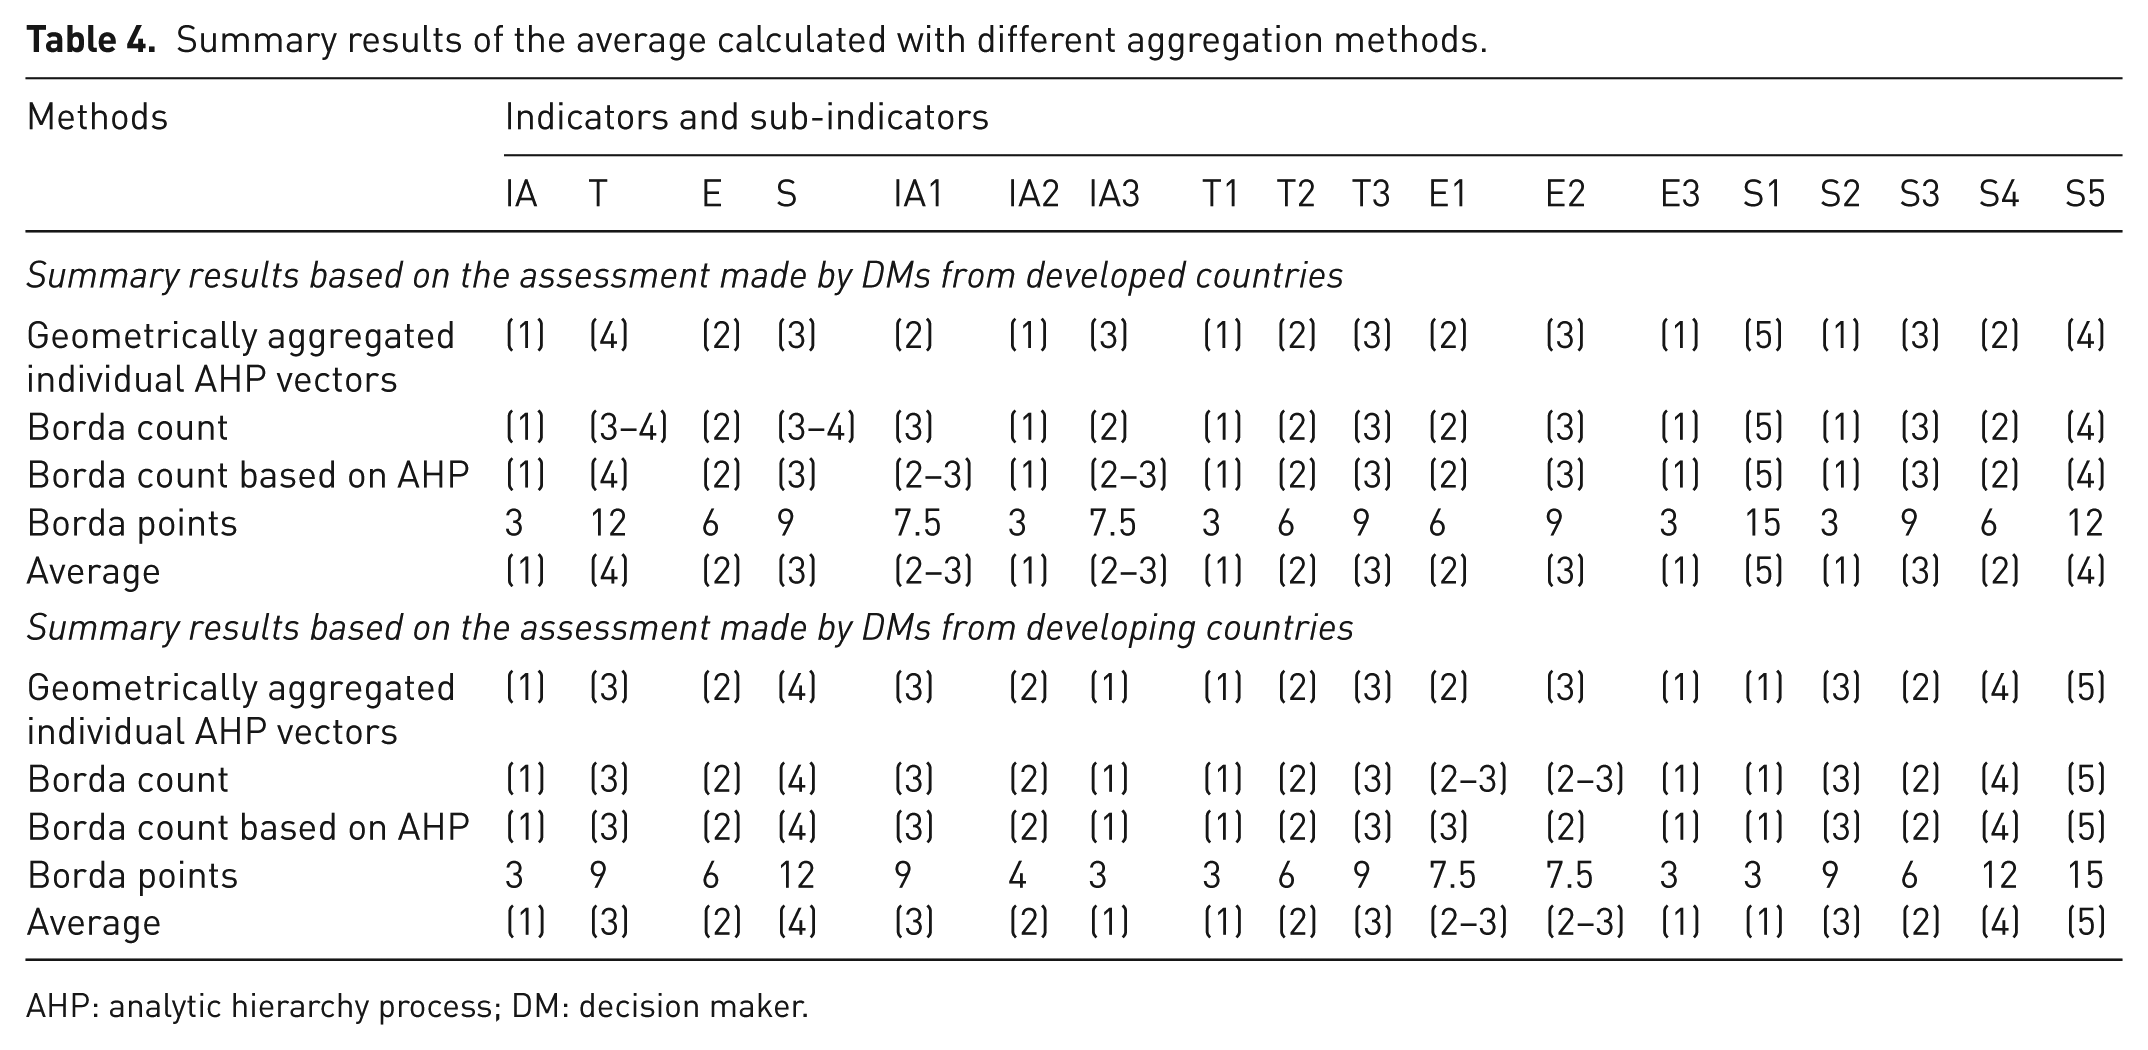
AHP: analytic hierarchy process; DM: decision maker.
The final ranking of indicators across the Borda and AHP methods by both groups of DMs is as follows.
IA (institutional–administrative indicator) is ranked as the most important by both groups.
E (economical indicator) is ranked as second most important by both groups.
T (technological indicator) is ranked as third most important by the second group and least important by the first group.
S (social indicator) is ranked as the least important by the second group and the third most important by the first group.
Using the evaluation and prioritisation of four indicators and 14 sub-indicators, the most important problems that lead to poor development of WM system within developing countries were obtained. Figure 2 shows the data of the weights of all indicators and corresponding sub-indicators assessed by both groups of DMs. DMs from developed and developing countries gave equal priority to the institutional–administrative indicator, which has the highest ranking compared with other indicators (economical, technological, and social). The results of the research show that the representative group of DMs from developed countries identified the sub-indicator of the level of development of legislation and its implementation in relation to the IA indicator as the one that has the largest influence (0.202) on the development of WMSs in developing countries, while DMs from developing countries prioritised the sub-indicator of the level of expertise and motivation in relation to the IA indicator, assigning it a weight of 0.154. According to both groups of DMs, one of the systematic problems is the existing manner of preparation and ratification of legislation, which does not provide an understanding of the real situation in the field.
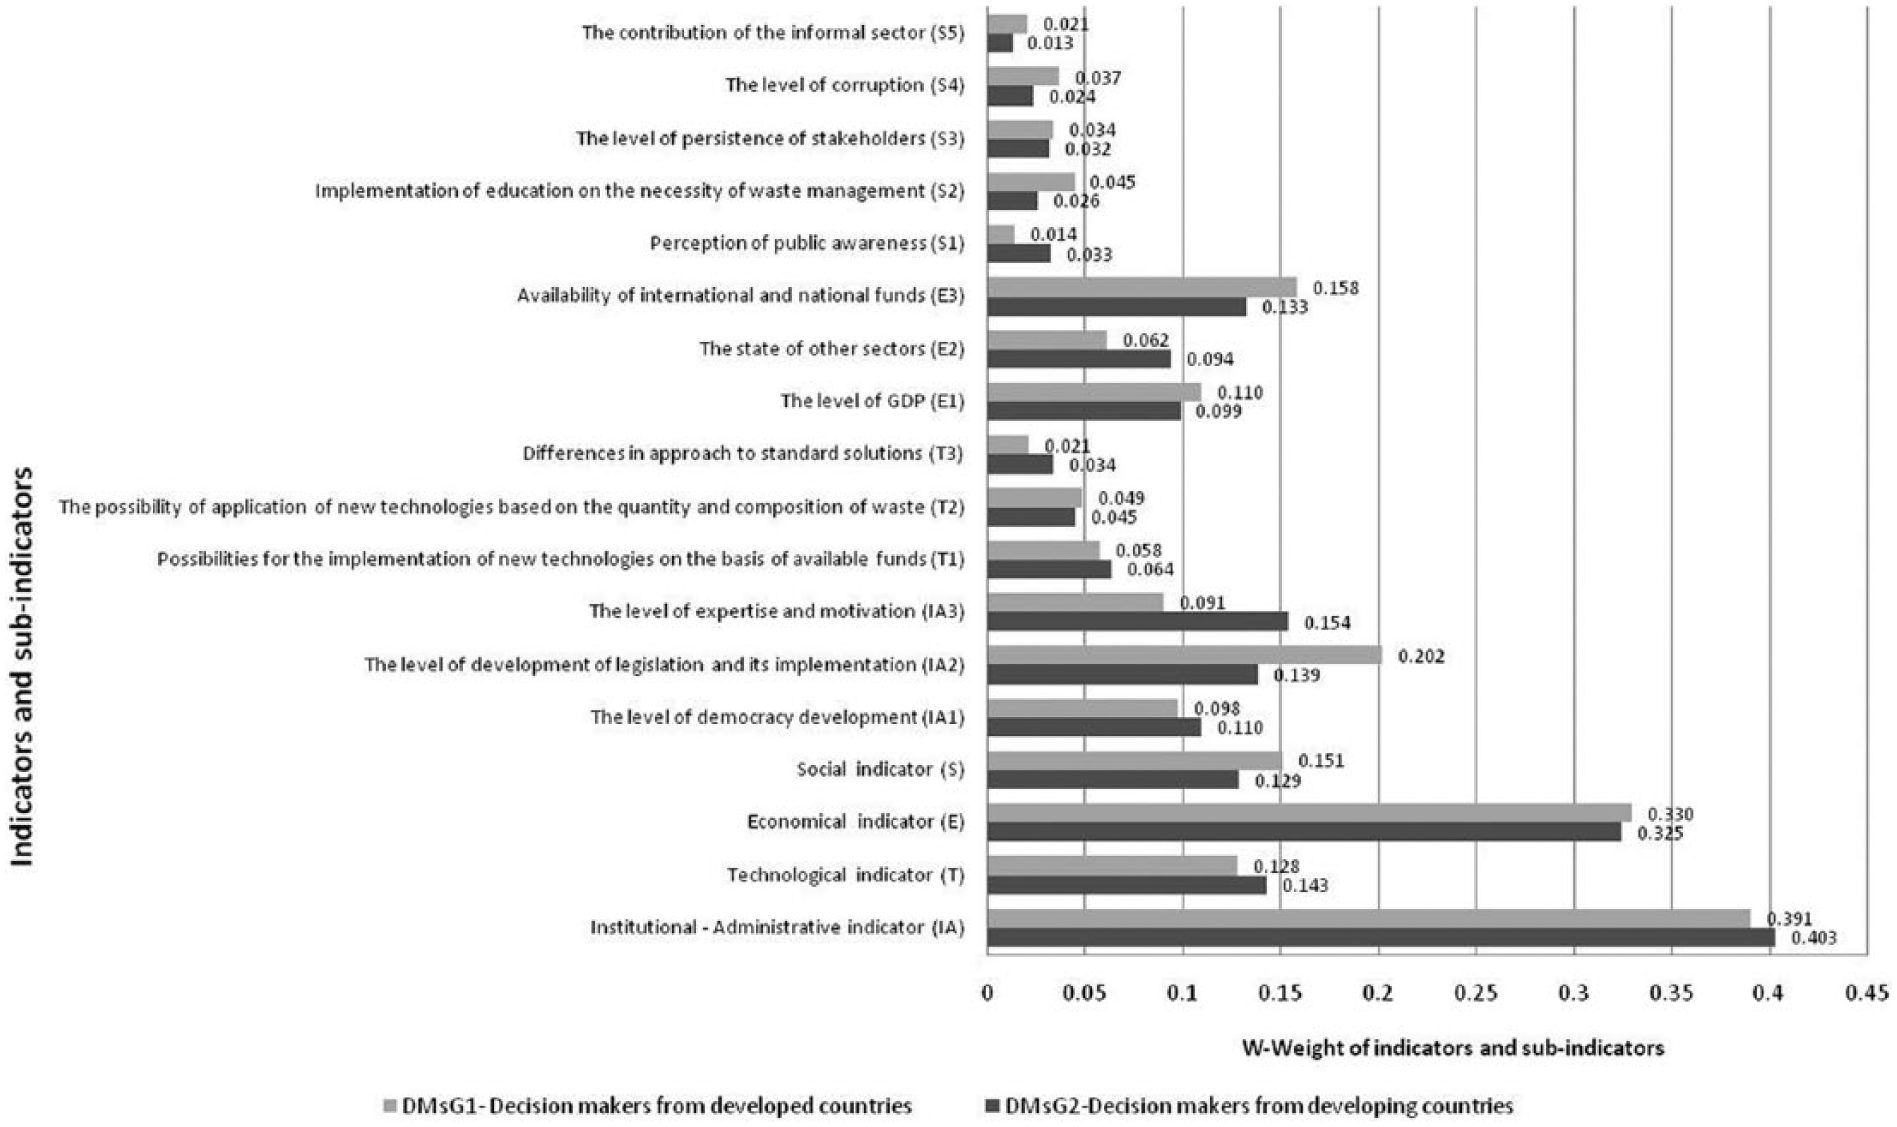
Weights of indicators and sub-indicators.
Conclusion
The development of WM is a long-lasting and financially demanding process that can became a significant burden for both the country and the economy. However, the resolution of the WM issues would influence economic and social development, because a development of a sustainable WM system would be a potential source of income. Thus, in order to make WM system sustainable, it is necessary to identify and prioritise main obstacles and issues related to this problem.
In this research, a methodology based on a combined use of the AHP and BC methods was used to determine the corresponding priorities and final ranking of four indicators and their corresponding sub-indicators for development of a sustainable WM system. Evaluation is performed by two groups of decision makers – a group from developed and a group from developing countries.
The results of the research indicate that the obtained weights of indicators have demonstrated a high level of concurrence among DMs on the significance of the defined indicators. Both groups of DMs have pointed out the institutional–administrative area as the first item that should be addressed in order to improve WM system in developing countries. Also, both groups of DMs agreed on the conclusion that poor planning is responsible, in significant part, for inadequate enforcement of regulations in the field of WM in developing countries. Besides that, the stability of relevant institutions and the capacity and credibility of public administration are also considered as crucial for development of a sustainable WMS. Consequently strengthening of the administrative capacity is necessary in order to establish an adequate system of WM. However, the motivation, competence, communication and behavioural change, and performance of employees in charge of WM are of utmost importance for the realisation and implementation of future developing activities in the WM sector. Methodology based on a combined use of the AHP and BC methods has proved to be efficient as a decision-support system, showed low complexity, was easy to master, provided acceptable results, and facilitated a successful decision-making process. Further research should be focused on the implementation of the applied methods in different areas of WM and on the analysis of alternatives for addressing the identified priority problems.
Footnotes
Funding
This research received no specific grant from any funding agency in the public, commercial, or not-for-profit sectors.
Declaration of conflicting interest
The authors declare that there is no conflict of interest.