
Abstract
Proper management and treatment of municipal solid waste (MSW) plays a central role towards the reduction or elimination of uncontrolled disposal and the achievement of United Nations (UN) Sustainable Development Goals (SDGs) with the reduction of its vast adverse environmental and health impacts. Despite that, till now, there has never been a quantitative analysis of the progress in waste management infrastructure delivery worldwide. In this paper, we provide valuable insights regarding the progress in new MSW infrastructure delivery based on a dataset of 1764 projects from 156 countries, for the period 2014–2019. We also estimate the magnitude of uncontrolled waste disposal practices worldwide by estimating the gap between the current MSW infrastructure delivery and actual changes in MSW generation. Our results show that the new capacity delivered during the six years period amounted to 243 million metric tonnes (Mt) (40 million Mt per year), out of which 45% was delivered in high-income countries, 37.5% in the People’s Republic of China and 17.5% in the rest of the world, mainly through thermal treatment (~57%) and landfilling (8%). The average allocated per capita budget of these projects during this period is about US$14, equivalent to US$2.33 (cap*year)−1. Our main conclusion is that the share of uncontrolled disposal will continue to rise at least until 2028, reaching almost 730 million Mt per year. Evidently, the global community continues to face a serious challenge towards the implementation of the UN SDG 12, target 12.4 by 2020. The analysis demonstrates that infrastructure delivery must increase by four folds to eliminate uncontrolled disposal practices.
Keywords
Introduction
Population growth, rapid urbanization, and accelerated globalization have resulted in a worldwide rise of municipal solid waste (MSW) generation, which is estimated at ~2 billion metric tonnes (Mt) per annum with predictions to reach 2.59 billion Mt by 2030 (Kaza et al., 2018). However, considerable uncertainty in waste estimation exists due to reporting inconsistencies, lack of standard definitions and classifications, unclear denominators, and the absence of standard methods for measurement and reporting (United Nations Environment Programme and International Solid Waste Association, 2015). In addition, the failure to consider factors such as the activities of the informal recycling sector, domestic open burning, and diffuse terrestrial dumping is another persistent problem that results in underestimations of the waste generated in the reporting systems and inaccurate waste statistics. These activities are challenging to manage and particularly prevalent in developing economies where up to 93% of waste is openly burned or dumped, while as low as 3% of waste is landfilled. Moreover, at least 61% of the MSW is not collected in developing economies (Kaza et al., 2018).
Worldwide, uncontrolled waste disposal, including open burning or dumping of waste on roads, open land or waterways, is commonly encountered and receiving an estimated 35–40% of waste generated (D-Waste, 2014) and serving 3.5–4 billion people (Mavropoulos, 2015). As urbanization and population growth continue, it is expected that several additional hundreds of millions of people will use uncontrolled disposal practices, mainly in the developing world (Mavropoulos, 2015). Important findings indicate that the 50 biggest dumpsites impact the daily lives of 64 million people, equivalent to the population of France. In addition, 38 out of the 50 biggest dumpsites have a direct impact on marine and coastal areas and may become a source of outbreaks of disease and the release of waste (especially durable plastics) to waterways and oceans (D-Waste, 2014). A recent report by Tearfund (2019) assessed that annually premature mortality related to improper solid waste management reaches 0.4–1 million. In 2010, it was found that only in India, Indonesia and the Philippines almost 8.7 million people were at high risk of exposure to industrial and hazardous waste pollutants, mainly lead and hexavalent chromium, from 373 dumpsites (Chatham-Stephens et al., 2013). Moreover, uncontrolled waste burning at dumpsites and households results in 270,000 premature adult deaths per year (Kodros et al., 2016).
D-Waste (2014) and the International Solid Waste Association (2015a, 2015b, 2016) recognized the urgent need to eliminate uncontrolled waste disposal practices that are affecting the quality of the environment, global health, and sustainable development. In this context, the 2016 Roadmap Report (International Solid Waste Association, 2016) has directly linked 15 of the 17 United Nations (UN) Sustainable Development Goals (SDGs), which have been adopted by 193 nations worldwide, to the targets of closing dumpsites and provided guidelines that would considerably help to attain the UN SDGs.
Studies suggest that improper forms of waste disposal in non-engineered dumpsites in addition to uncontrolled landfills constitute the world’s third largest cause of anthropogenic methane, a greenhouse gas (GHG) about 34 times (including climate-carbon feedbacks) more potent than carbon dioxide (CO2), contributing to climate change (Maalouf and El-Fadel, 2018a; Myhre et al., 2013). Without interventions, it is expected that existing open dumps will account for 10% of worldwide GHG emissions by 2025 (Law and Ross, 2019). However, studies (Maalouf and El-Fadel, 2018b, 2019) showed that substituting open dumping or burning with proper waste management systems such as engineered landfills coupled with a proper landfill gas collection system, incineration, recycling, biological treatment, food waste diversion, and/or energy recovery can contribute to significant savings in emissions that can reach up to 24–95% compared to the baseline, depending on the tested system. Another study by Maalouf et al. (2019) reported that the increase in the source segregation intensity with proper management of residual MSW resulted in significant savings in the climate change impact (reaching up to 20%) and stratospheric ozone depletion potential (about 55%) in a developing economy. As such, the delivery of infrastructure for MSW is driven by increased concerted policy action in an effort to reduce or eliminate uncontrolled waste disposal practices, especially in the developing world.
Even though MSW infrastructure plays a central role in the implementation of UN SDGs, till now, to the best of our knowledge, there has never been a quantitative analysis of the progress in waste management infrastructure’ delivery worldwide. Besides the presence of business reports, 1 a review of the literature showed that there is a lack of publicly available, consistent reporting systems, peer reviewed research articles, and reliable datasets covering the progress in solid waste management infrastructure, its geographic allocation, and technological distribution worldwide. This is particularly important to measure the change (increase or decrease) in uncontrolled disposal practices, which are in turn directly affecting the climate change, sustainability, and circular economy targets worldwide. Moreover, quantifying the progress in waste infrastructure, which consequently contributes to the elimination of uncontrolled disposal, is imperative for measuring the UN SDG 12, target 12.4: “by 2020, achieve the environmentally sound management of chemicals and all wastes throughout their life cycle” (United Nations, 2020).
Against this background, this study presents new findings at a global scale regarding the progress in solid waste management infrastructure delivery for the period 2014–2019 using an international dataset from the AcuComm database (AcuComm, 2019). The dataset is considered the most reliable and representative data collection about the waste infrastructure market trends worldwide. We analyze the progress of infrastructure delivery and compare it with the expected increase of waste generated worldwide to delineate the potential gap between infrastructure delivery and waste generated and shed light on future uncontrolled disposal practices. Using trends of the period 2014–2019 as a guide, we forecast the evolution of uncontrolled disposal practices for 2030 under the business as usual scenario, which to the best of our knowledge, have not been reported. Therefore, the main aim of this study is to examine current and future infrastructure delivery rates towards eliminating uncontrolled waste disposal practices worldwide. In our conclusion, we provide relevant policy recommendations and suggestions supporting waste management stakeholders.
Methodology
Dataset and sources
AcuComm has developed a detailed database of waste infrastructure developments from 156 countries. The company collects and reports on a regular basis country-level data on the development of new solid waste projects, including waste disposal, treatment and recovery facilities. Given this extensive coverage, we consider this dataset as the most representative of the global market for waste infrastructure delivery. Accordingly, a dataset was extracted from AcuComm’s Waste Business Finder database (AcuComm, 2019) for the period 2014–2019 (six years). A cross checking step was implemented to verify the dataset. This phase entailed reviewing and assessing projects from selected countries to validate data at various levels of waste management processes. It was confirmed that all major projects are included.
The dataset includes 4149 records of infrastructure projects for various waste streams. In this study, 1764 projects concerning municipal waste were analyzed in more details, including projects for food waste and biowaste, green waste, and organic fraction management. AcuComm reports information about five types of waste treatment technology/process: (a) mechanical biological treatment (MBT), anaerobic digestion, biofuel, and biogas; (b) incineration, and other thermal processes such as gasification; (c) integrated/mixed facilities and waste processing; (d) recycling; and (e) landfilling. Moreover, a distinction is made between incineration with and without energy recovery. Note that the data include active facility development projects at all phases from preparation (e.g., planning, project proposal, feasibility studies, tender documents, funding approval, etc.) through implementation (signed contracts, set commencement dates, or construction and operation). Thus, we were able to identify how many projects were in a phase of implementation and how many still under preparation.
The dataset also provides the budget 2 value of projects in United States dollars (US$), the annual capacity of the projects (in Mt per year), and the estimated power and/or heat output in megawatts (MW), by country, geographic region, and type of technology. A summary of some of the basic data with corresponding analysis is presented in the “Progress in municipal waste infrastructure delivery” Section and the dataset is presented in the supplementary material (Online Table SM1).
Gap analysis
Past efforts have assessed the worldwide progress in achieving controlled disposal as a first step of eliminating uncontrolled dumpsites (D-Waste–International Solid Waste Association, 2013; Wilson et al., 2015). However, most efforts were based on data extracted from accessible secondary sources such as literature research papers, national plans and reports, and international business reports. Invariably, these sources refer to different time periods and use different methods, thus, researchers have always to adjust to the different approaches to be able to provide an assessment of the uncontrolled disposal rate on a global scale. As a result, the outcomes are associated with high uncertainties and lack updated figures, usually reporting the progress achieved 5–6 years before the relevant publications.
In this paper, we developed a gap analysis approach to estimate the magnitude of uncontrolled waste disposal practices worldwide by measuring the gap between the current MSW infrastructure delivery and actual changes in MSW generation. This approach determines whether the capacity of delivered MSW infrastructure per year is sufficient to reduce or eliminate uncontrolled waste disposal and its corresponding health and environmental impacts. The gap is calculated by subtracting the new capacity of MSW delivered (NEWCAP) for a specific year (t) from the sum of the gap in a previous year (t-1) and the extra amount of MSW generated (EXTRAMSW), as expressed in equation (1). This approach can be applied in different geographic scales (in our case it is applied on a global scale).

where GAPt is total MSW that goes to uncontrolled disposal for the year t (million Mt/year),
EXTRAMSWt is extra amount of MSW generated by population growth for the year t (million Mt/year), and NEWCAPt is total new capacity of MSW infrastructure delivered for the year t (million Mt/year). Baseline data for the year 2016 were adjusted for 2030 to develop projections for the amount of waste that goes to uncontrolled disposal (GAP). The starting point is that in 2016, the total amount of MSW driven to uncontrolled disposal (GAP2016) is at least 687 million Mt (Kaza et al., 2018). Using the dataset, we were able to assess the new capacity delivery (NEWCAP2016) in developing economies (as estimated in the “Progress in municipal waste infrastructure delivery” subsection). Based on the assumption that the global stakeholders will recognize the international need to assist developing countries in addressing waste management challenges (rather optimistic scenario), we assume an additional annual increase of 2% in the new capacity delivered to developing countries. The extra MSW quantities (EXTRAMSW2016) are calculated from the population increase 3 based on an average per capita generation rate of 0.74 kg (cap*day)−1 (retrieved from Kaza et al., 2018). We assumed that the per capita generation rate remains the same for all years. It is also assumed that the EXTRAMSW generated during the years 2016–2030 is only affected by the population growth without considering other factors such as the growing world gross domestic product (GDP) per capita. A well-documented relationship between population growth, GDP growth, and MSW generation per capita is reported in the literature (Kaza et al., 2018; Kawai and Tasaki, 2016), given that at a country level, the rise of population contributes to an increase in the amount of total waste produced. Thus, the approach to estimate the expected MSW generated is likely to result in quantities lower than the actual amounts.
Two assumptions are crucial for our assessment. The first one concerns that all the expected increase in waste generation will happen to the developing world. The population forecasts (United Nations, Department of Economic and Social Affairs, Population Division, 2015) support this assumption. The major increase in population between 2015 and 2030 is expected in Africa (+42%) and Asia (+12%), which means that Africa and Asia will host around 6.6 billion people in 2030, instead of 5.6 in 2015. Latin America and the Caribbean are expected to have an additional population of 87 million people, while both North America and Australia will have an extra of 48 million people, and Europe is expected to decline slightly. This means that 96% of the expected increase in population will take place in areas where uncontrolled disposal is still a common practice.
The second assumption is that 70% of the whole new capacity that will be delivered in Africa, Asia, Latin America, and the Caribbean will be used to eliminate uncontrolled disposal and close dumpsites, while the remaining 30% will be used to expand or upgrade existing systems that serve urban areas and countries’ capitals. This assumption can be justified by the: (a) significant progress achieved in the People’s Republic of China (China) and major urban areas in Latin America during the past 10 years, which means that expansion and/or upgrade projects will be important for the period till 2030; and (b) dataset analysis.
Results and discussion
Progress in municipal waste infrastructure delivery
In total, 1764 MSW infrastructure projects (excluding waste collection and recycling programs) were registered worldwide for the period 2014–2019. The total value/budget of registered projects was close to US$120 billion with 60% (in terms of capacity) in a phase of implementation and the remaining 40% under preparation. Table 1 presents the size/capacity (in both total million Mt during 2014–2019 and average million Mt per year) of MSW projects in all phases, including the shares (in %) of various technologies. New landfills represent 15% of the total capacity, recycling facilities represent 10%, and the rest (75%) is mostly new incinerators and some MBT plants.
Capacity of new municipal solid waste (MSW) projects under different phases of preparation and implementation.
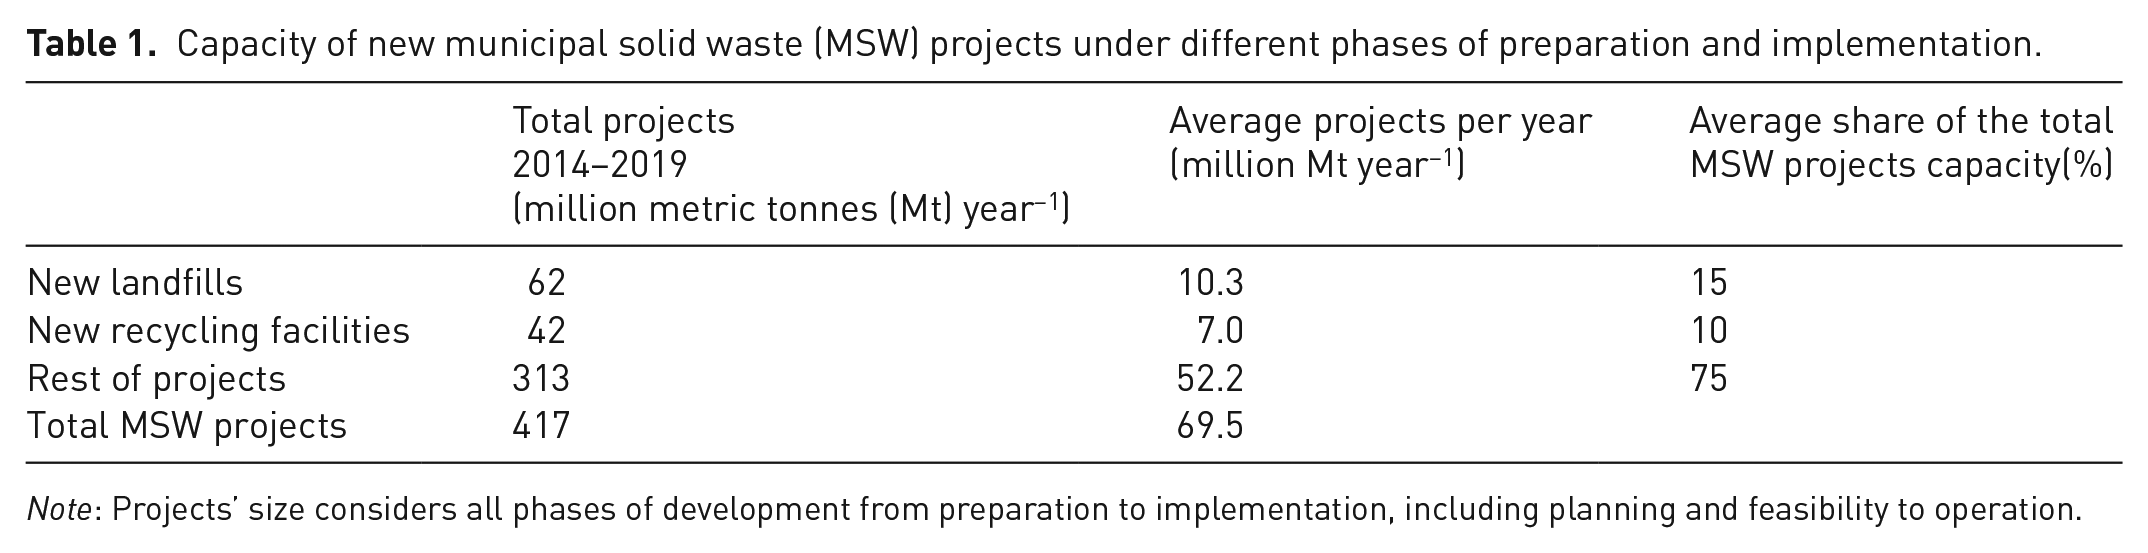
Note: Projects’ size considers all phases of development from preparation to implementation, including planning and feasibility to operation.
Projects in the implementation phase in particular represent progress in infrastructure delivery at a total investment of US$67.7 billion for the period 2014–2019. In terms of capacity, the total size of implemented projects is about 243 million Mt for the six years, which is equivalent to an average annual delivery rate of 40 million Mt per year of new infrastructure or almost 2% of the global annual generation of MSW, which was about 2.01 billion Mt in 2016 (Kaza et al., 2018). A full mapping of new projects that were implemented in 98 countries is available in the supplementary material (Online Table S1). Figure 1 displays the distribution of new MSW projects in terms of budget, capacity, and energy generation potential by income level in various countries. High income countries 4 account for 50% of new projects in budget, 45% of the new projects in capacity, and 39% of the new energy generation potential. Upper-middle income countries constitute 44% of new projects in budget, 46.4% of new projects in capacity, and 55.4% of new energy generation potential. Therefore, it is probably the first time that upper-middle income countries deliver more MSW projects (in terms of both capacity and energy potential) than high income countries. Lower-middle income countries deliver 4.4% of new projects in budget, 7.6% in capacity, and 4.2% in new energy generation potential. Low-income countries are the least contributor and deliver 1.5% of new projects in budget, 1.1% in capacity, and 1.7% in new energy generation potential.
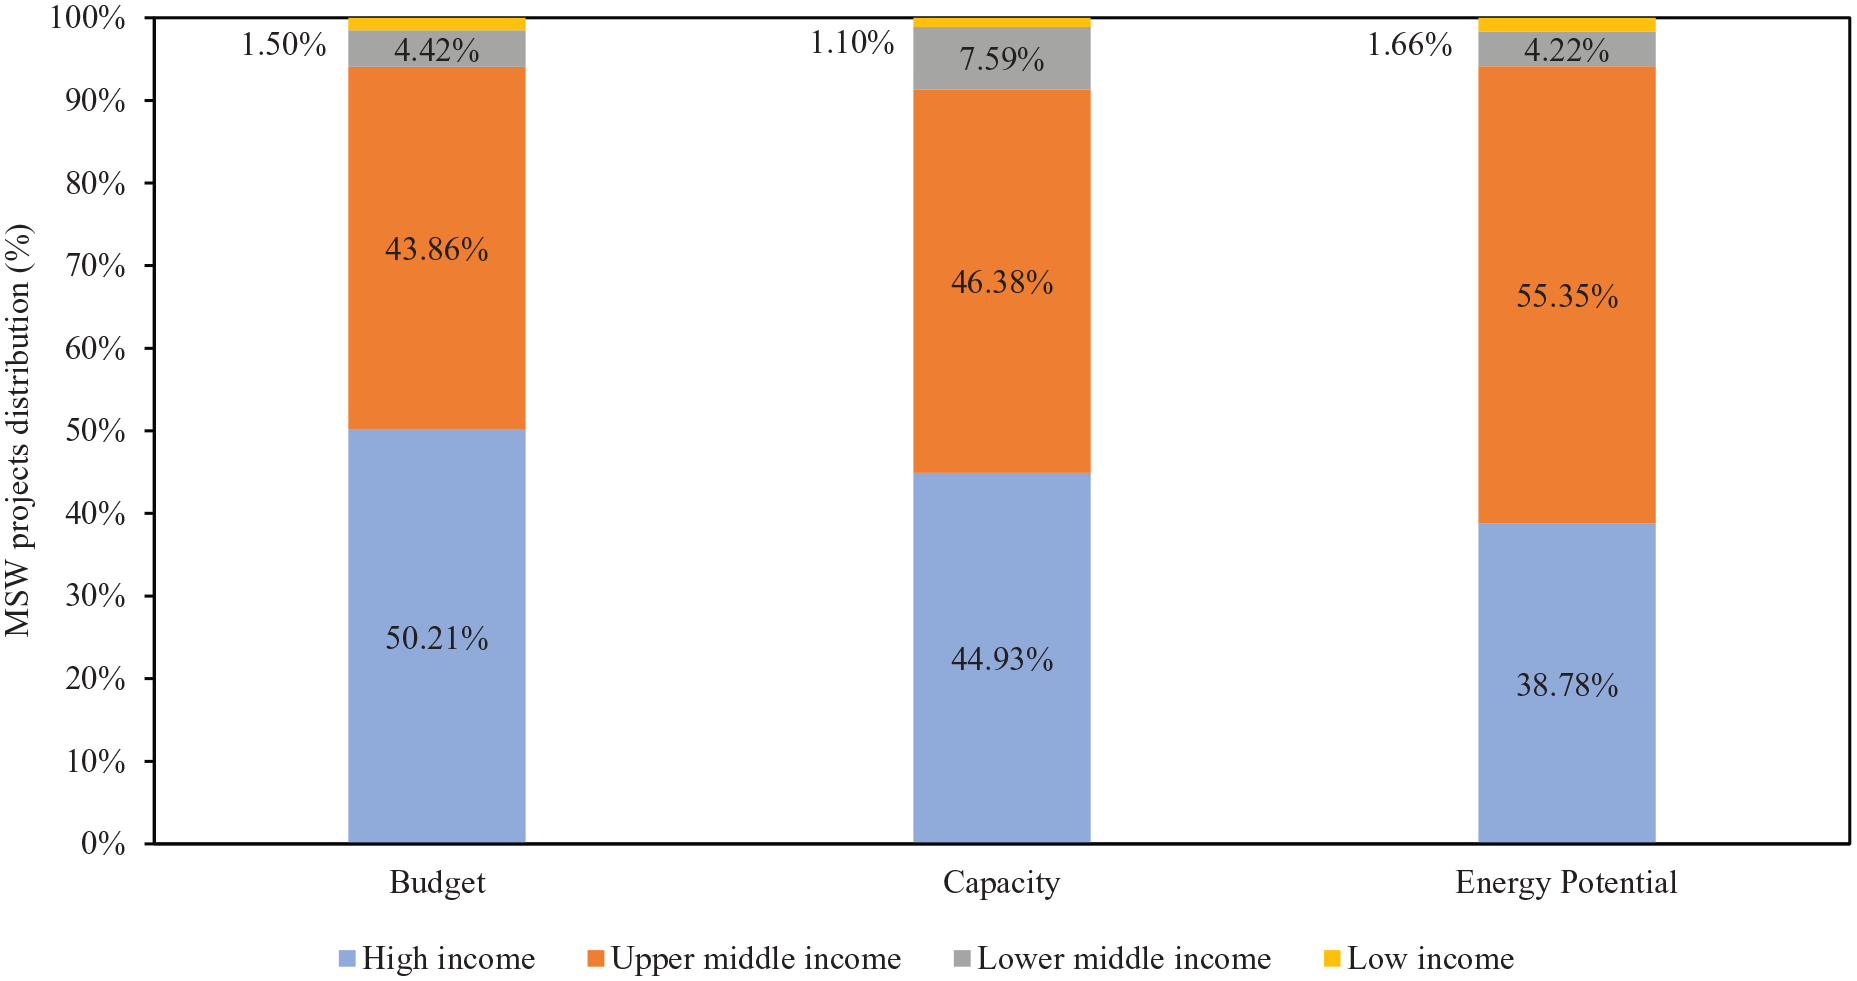
Distribution of new implemented municipal solid waste (MSW) projects in terms of budget, capacity, and energy generation potential in countries by income level during 2014–2019 (total budget of US$67.7 billion, total new capacity of 243.1 million metric tonnes, and total energy potential of 14,041 MW).
At a country level, in terms of new capacity, China and the United States delivered 37.5% and 12% of the total new MSW capacity from 2014 to 2019, respectively. Therefore, if we exclude China from the upper-middle income countries, all the other countries under this category have only delivered 8.9% of the new capacity (Table 2). Overall, China and high-income countries have delivered 82.5% of the new infrastructure and the rest of the world delivered only 17.5% (Table 2).
Distribution of total new municipal solid waste capacity (243 million metric tonnes) delivered worldwide from 2014 to 2019.
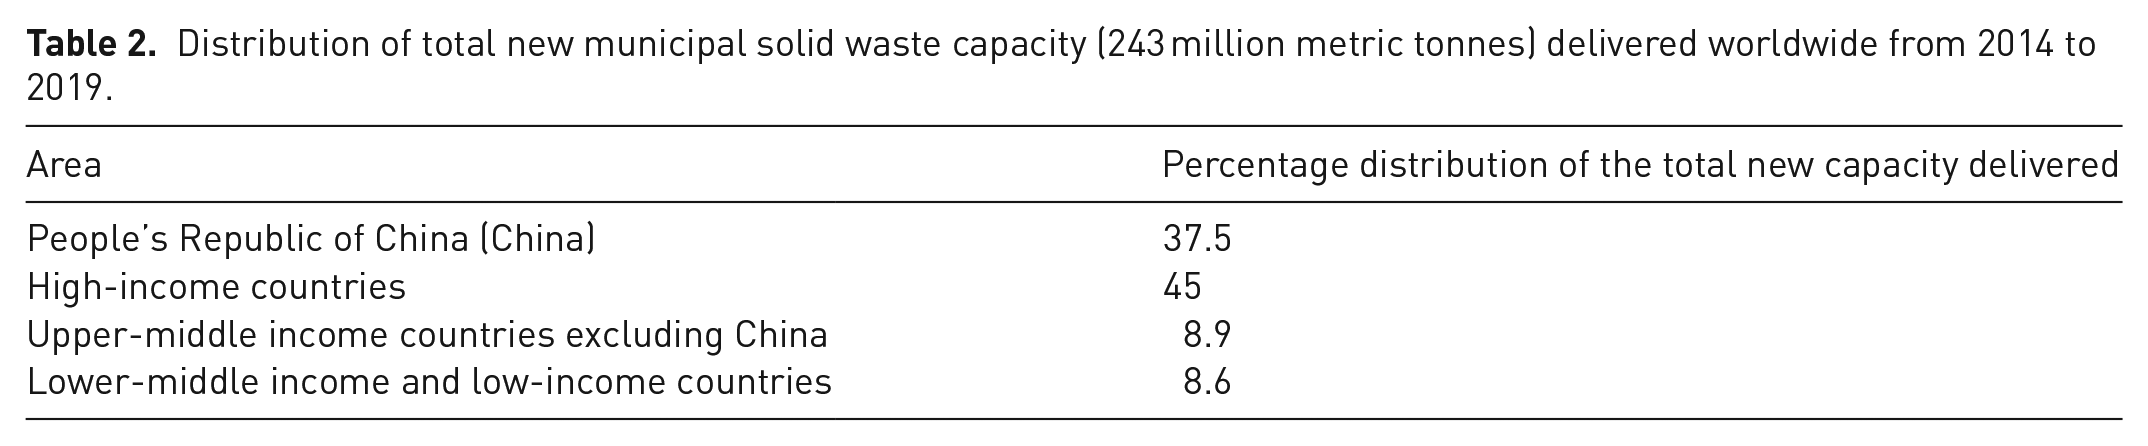
Figure 2 offers a first glance at the performance of infrastructure delivery by country in terms of share of the total capacity (million Mt) of new MSW facilities delivered during 2014–2019, while Figure 3 shows the cumulative annual capacity of the 26 countries delivering 90% of the total new infrastructure capacity during this period. Obviously, China (37.5%), the United States (12%), the United Kingdom (6.1%), Japan (4.3%), and India (3.35%) were the five main contributing countries to the total new infrastructure delivered capacity worldwide.
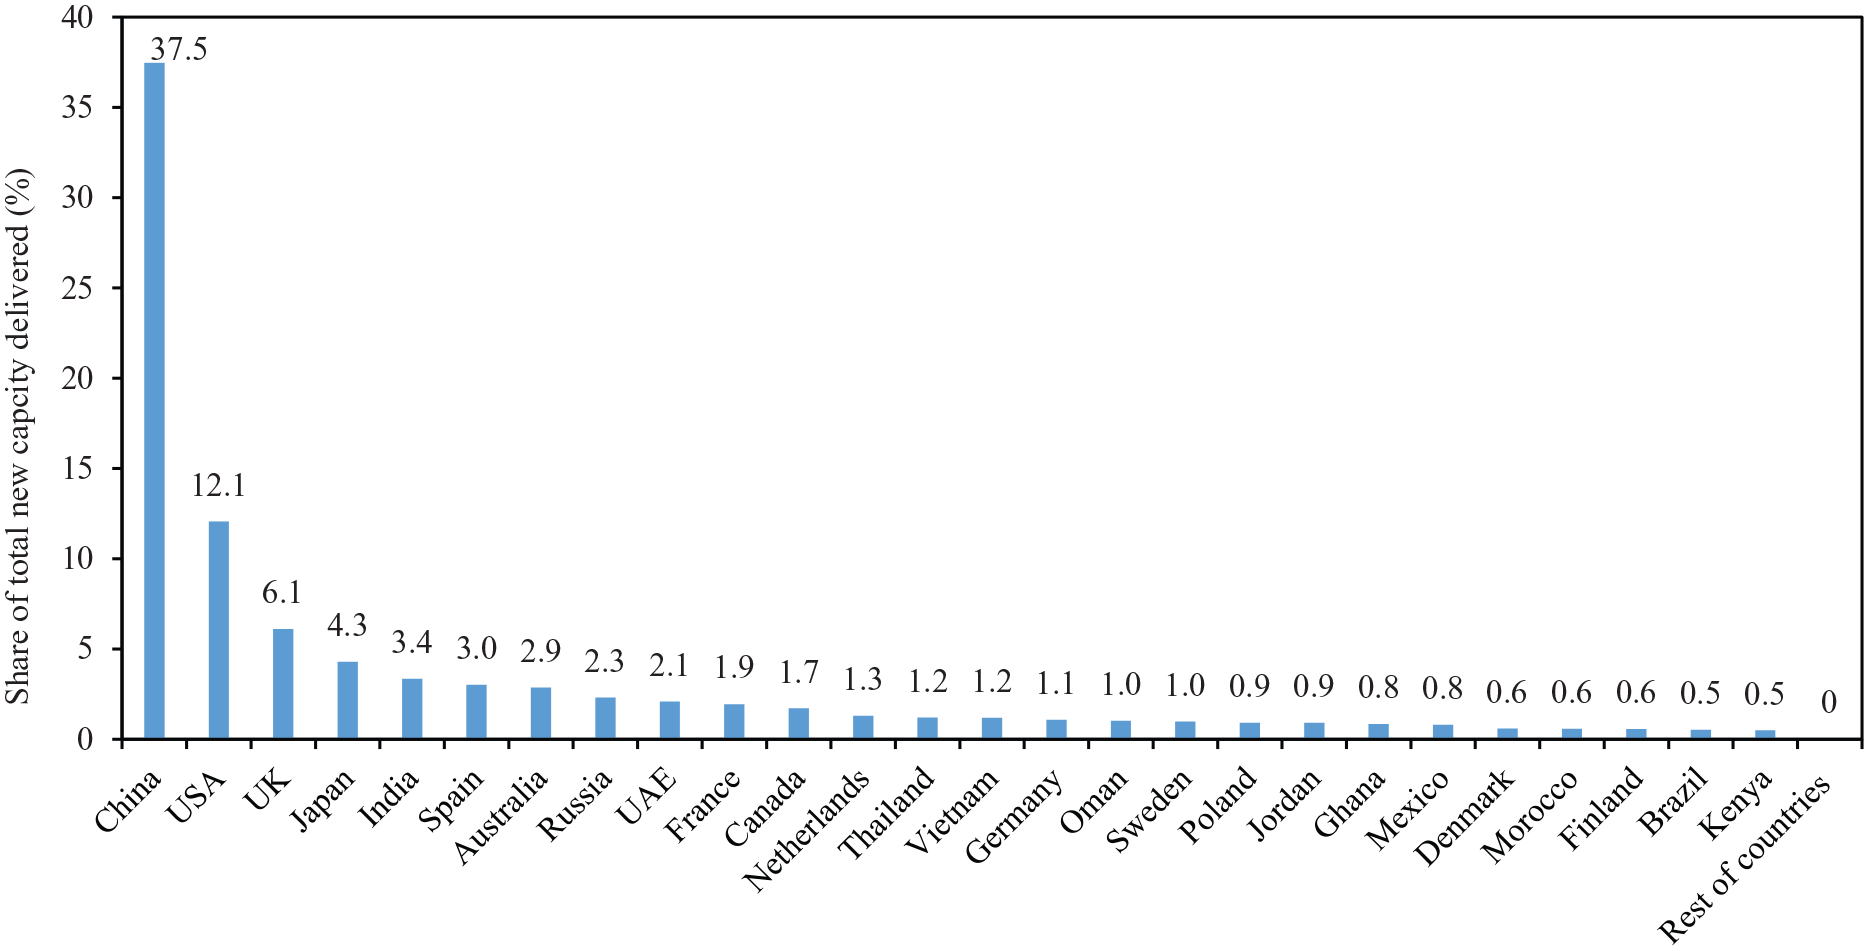
Distribution (total of 98 countries) of the total new capacity (243 million metric tonnes) of municipal solid waste (MSW) projects implemented worldwide 2014–2019 (26 countries account for 90% of the total new MSW capacity delivered).
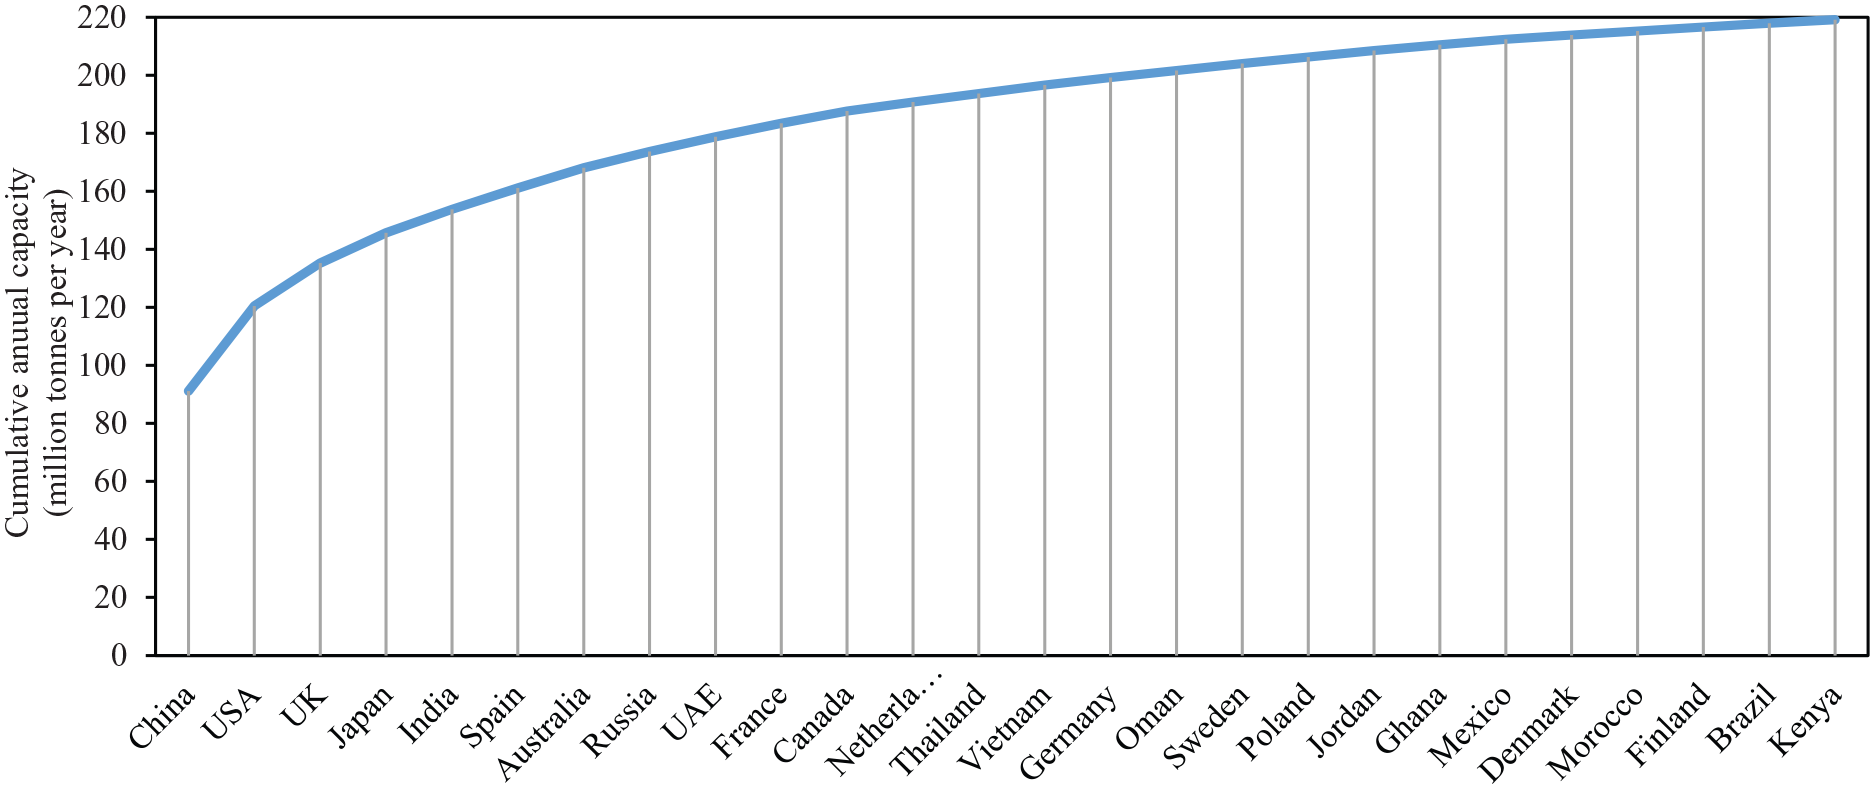
Cumulative annual capacity of 26 countries delivering 90% (about 219 million metric tonnes) of the total new municipal solid waste (MSW) infrastructure capacity during 2014–2019.
In terms of budget, considering the 26 countries that have delivered 90% of the new capacity with a population of 4.35 billion people, the average MSW budget per capita for the six-years period (2014–2019) is about US$14, equivalent to US$2.33 (cap*year)−1. Moreover, when analyzing the new investments on a per capita basis (Figure 4) the United Arab Emirates, Finland, Japan, United Kingdom, and Sweden can be categorized as high runners, while the United States and China are middle runners.
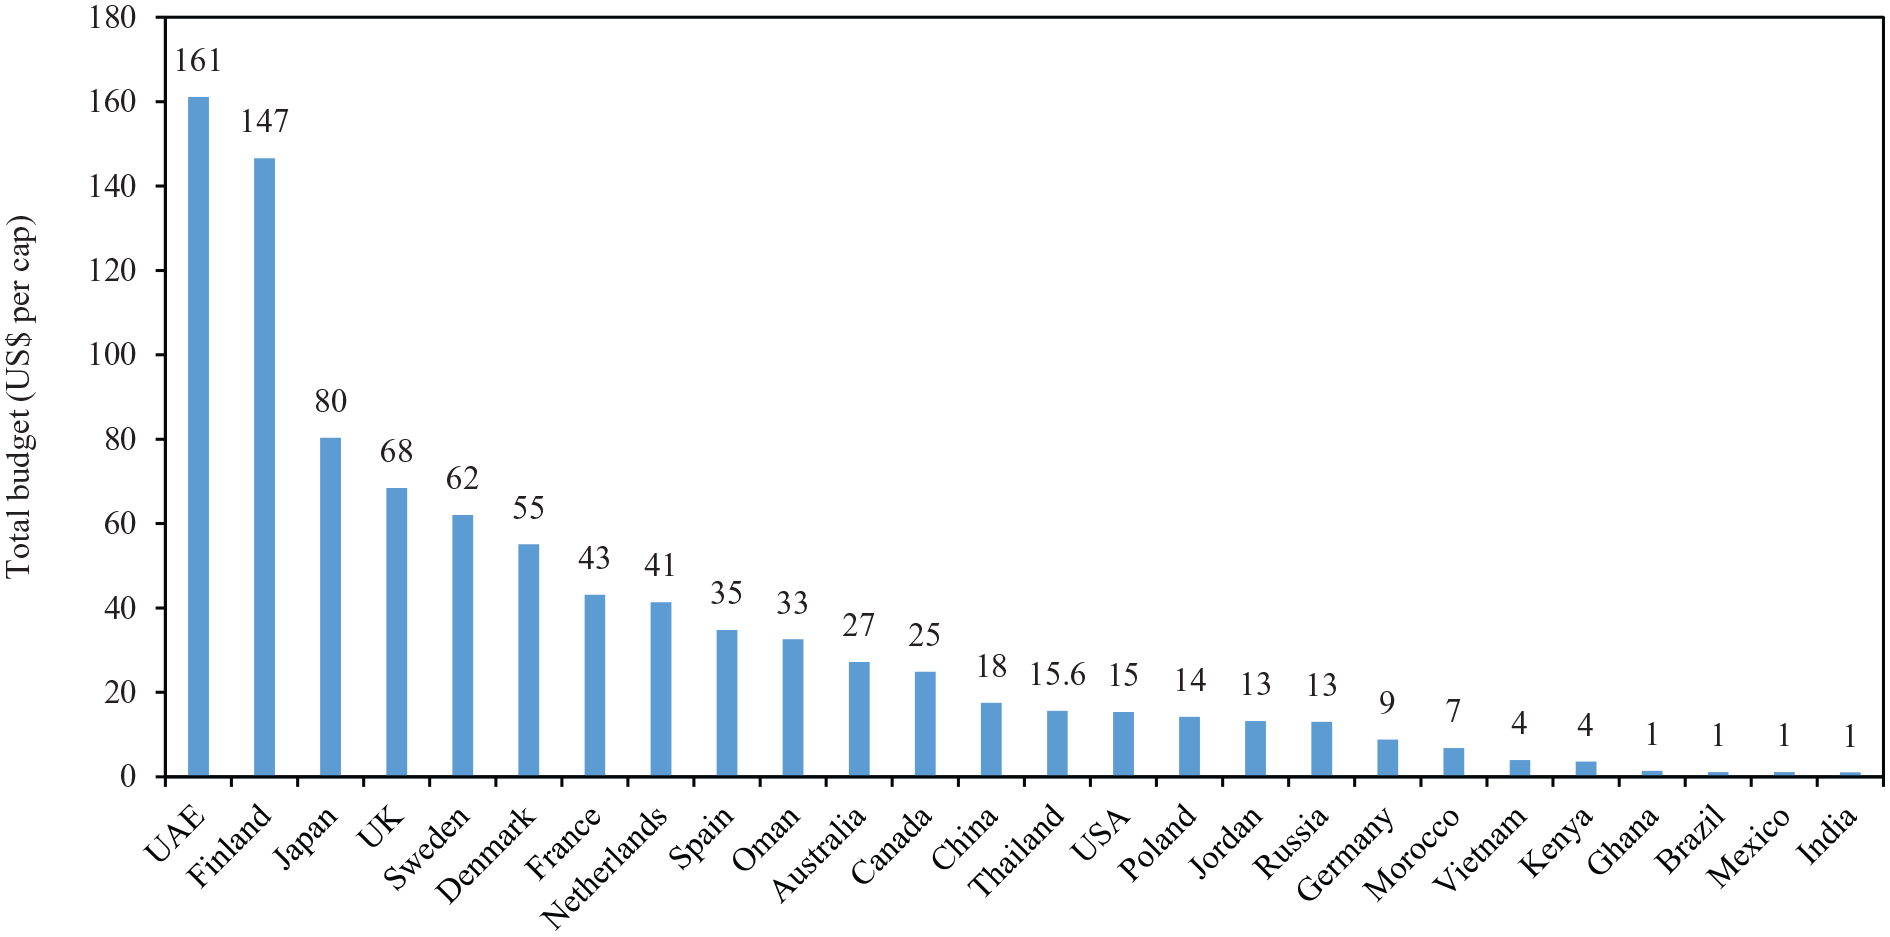
Total budget (US$ per capita) of new municipal solid waste (MSW) infrastructure delivered per country for the period 2014–2019.
There are also major differences at the level of specific waste treatment technologies. Figure 5 shows the distribution of the new infrastructure delivered capacity by technology. The largest share in terms of capacity of new implemented projects is related to thermal technologies (about 57%), particularly new incineration plants, followed by recycling facilities (about 13%), and landfills (only about 8%). In terms of distribution by income level, 56% of the new landfills and 23% of the new incinerators are delivered in high-income countries, 37% of the new landfills and 69% of the new incinerators in upper-middle income countries, and the rest, in both cases, in low-middle and low- income countries. Notably, all incinerators involve energy recovery in the forms of heat and/or electricity. While the technical specifications for incinerators are somehow different across markets, environmental criteria for emissions control are becoming gradually more uniform worldwide (Bourtsalas and Themelis, 2019).
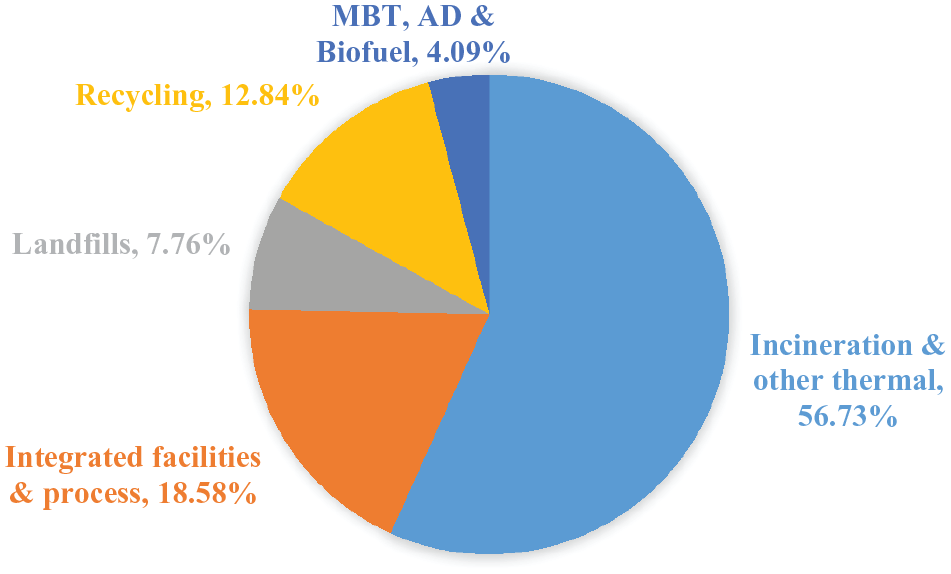
Distribution of implemented municipal solid waste (MSW) projects between 2014 and 2019 by technology. The total new MSW capacity across all project is 243 million metric tonnes.
The total capacity of thermal technologies was about 136.6 million Mt with a budget of 46.7 billion dollars, almost 2/3 of the total budget of the new delivered infrastructure, and with an added energy potential of ~11,800 MW. China represents almost 64% of the new thermal treatment delivered capacity, followed by European countries (11%), and Japan (6.6%).
The dominance of China in the global waste-to-energy (WtE) market is a well-documented trend. According to Hanwei (2019), from 2000 to 2015, China delivered new incinerators with a total capacity of almost 73 million Mt per year and is expected to have an established capacity of more than 200 million Mt per year by 2022. For comparison purposes in 2015, the European Union (EU) had a total capacity of 72 million Mt per year while the United States and Japan together had 60 million Mt per year. In their review, Cheng and Hu (2010) showed that incineration has gained an increasing popularity in China mainly because of its ability to decrease the growing MSW volume, and create fewer impacts in urban land-uses and people’s lifestyle. In addition, the application of incinerators reduces the country’s reliance on fossil fuel, especially that the country is the world’s second-largest energy user and third-largest oil importer, which is also facing large energy demand to support its economic growth. Depending on waste composition and on the policies and goals of local governments, the energy recovery may play a significant role in solving different problems. For example, since the first EU-level waste management Directive 91/156/EC (European Council, 1991), incineration coupled with energy recovery has been reported as an effective solution for reducing the mass and reactivity of waste that cannot be reused, recycled, or recovered prior to landfilling (Di Maria et al., 2018). More recently, Guanghui et al. (2019) showed that the rapid development of incineration technologies in China is directly linked with the governance and institutional patterns of the country that influence positively people’s trust and risk perception attitudes. In addition, the shift to a circular economy, which is the official Chinese policy for almost 15 years, requires more clean cycles, and thus more final sinks to depollute material cycles (Mavropoulos and Nielsen, 2020). Similarly, ongoing projects in Africa demonstrate a high energy potential from WtE projects including incineration (Scarlat et al., 2015).
As for landfills, the total new capacity is about 19 million Mt, which constitutes almost 7.8% of the total new infrastructure capacity delivered and about 3.7% of the total budget for the new infrastructure. The United States contributes 21% to total new landfills capacity delivered, followed by European countries at 14%, and Oman and Jordan delivering around 11% each. Despite the fact that the technical specifications of landfills are different from country to country, the projects in the dataset concern new sanitary landfills or expansion projects that follow the basic rules of sanitary landfilling in design, construction and operations. Sanitary landfills have been long recognized as the cheapest way to ensure environmentally sound waste disposal (El-Fadel et al., 1997). But recently they have been discouraged worldwide by the development of the EU waste management regulations and misunderstandings regarding the potential and the applicability of a circular economy (Mavropoulos and Nielsen, 2020). However, in the Global South landfilling remains the first and indispensable way for the development of a sustainable waste management system. More details, including the capacity, budget, and potential energy generation from landfill and incineration per country, are available in the supplementary material (Online Tables S2 and S3).
Forecast of uncontrolled waste disposal
Based on the analysis above, high income countries deliver 45% of the new waste infrastructure in terms of capacity, and reasonably these projects consider upgrading of existing facilities, expansion of existing landfills, and/or establishment of new treatment facilities. Thus, we assume that the rest of the delivered capacity (55%) will be used for: (a) expansions and upgrades of existing waste management systems (30% of the 55%); and (b) the elimination of uncontrolled disposal practices worldwide, excluding high-income countries (70% of the 55%). This assumption is also justified from the dataset. Considering that the annual delivery rate of new MSW infrastructure was assessed to 40 million Mt for the period 2014–2019, the amount of the new capacity that is used to eliminate uncontrolled disposal is 55% × 70% × 40 = 15.4 million Mt of new MSW capacity in 2016 (assumed to grow by 2% per year, as explained in the “Methodology” section). To forecast the uncontrolled disposal, we assessed the gap between this figure and the additional MSW generated due to the increase in population, as also explained in the “Methodology” section.
Figure 6 displays the progress in new MSW infrastructure delivered to eliminate uncontrolled disposal and the additional waste generated between 2017 and 2030. Furthermore, Figure 7 presents the evolution of uncontrolled waste disposal practices worldwide during this period. The assessment shows that despite the assumed continuous 2% increase in the new MSW capacity delivery to eliminate uncontrolled disposal, by 2030 the waste that goes to uncontrolled disposal will be around 730 million Mt per year. In 2028, a slight decrease in uncontrolled waste disposal will be achieved since the annual delivered capacity becomes higher than the extra MSW quantities generated. In fact, from 2016 to 2030 an additional 10.7 billion Mt of waste will be driven to uncontrolled disposal. Therefore, the elimination of uncontrolled waste disposal practices seems unrealistic if the current trajectory will be followed (even with a 2% annual increase in infrastructure delivery). In order to close the dumpsites by 2030, the capacity of MSW infrastructure delivered in developing countries must increase by 45 million Mt per year (moving from 15.4 to 60 million Mt per year), which is equivalent to an increase of 270%.
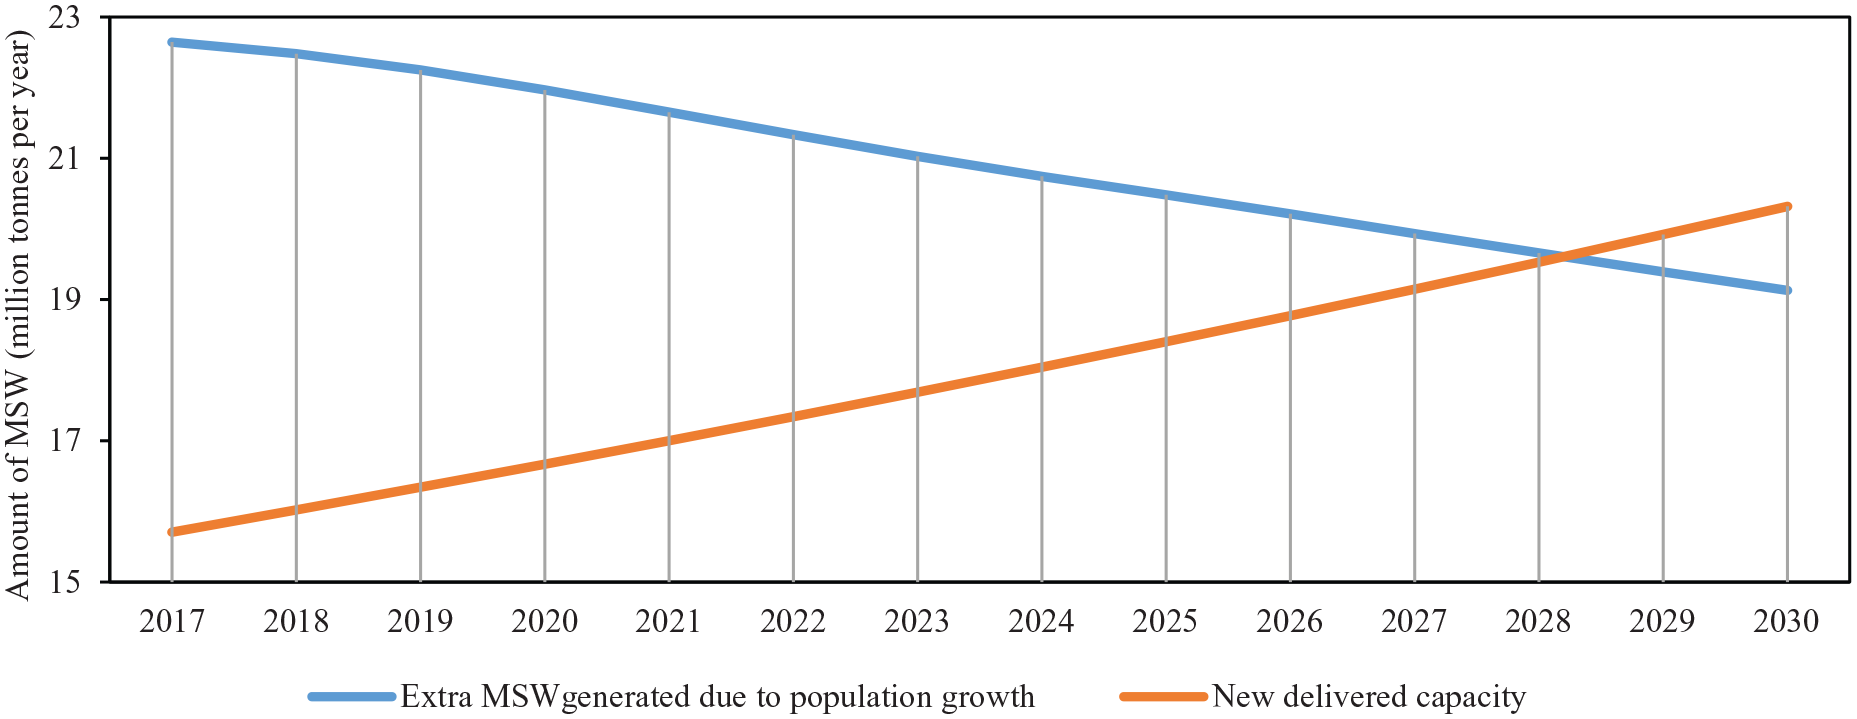
Progress in municipal waste infrastructure capacity and extra waste generation for the period 2017–2030.
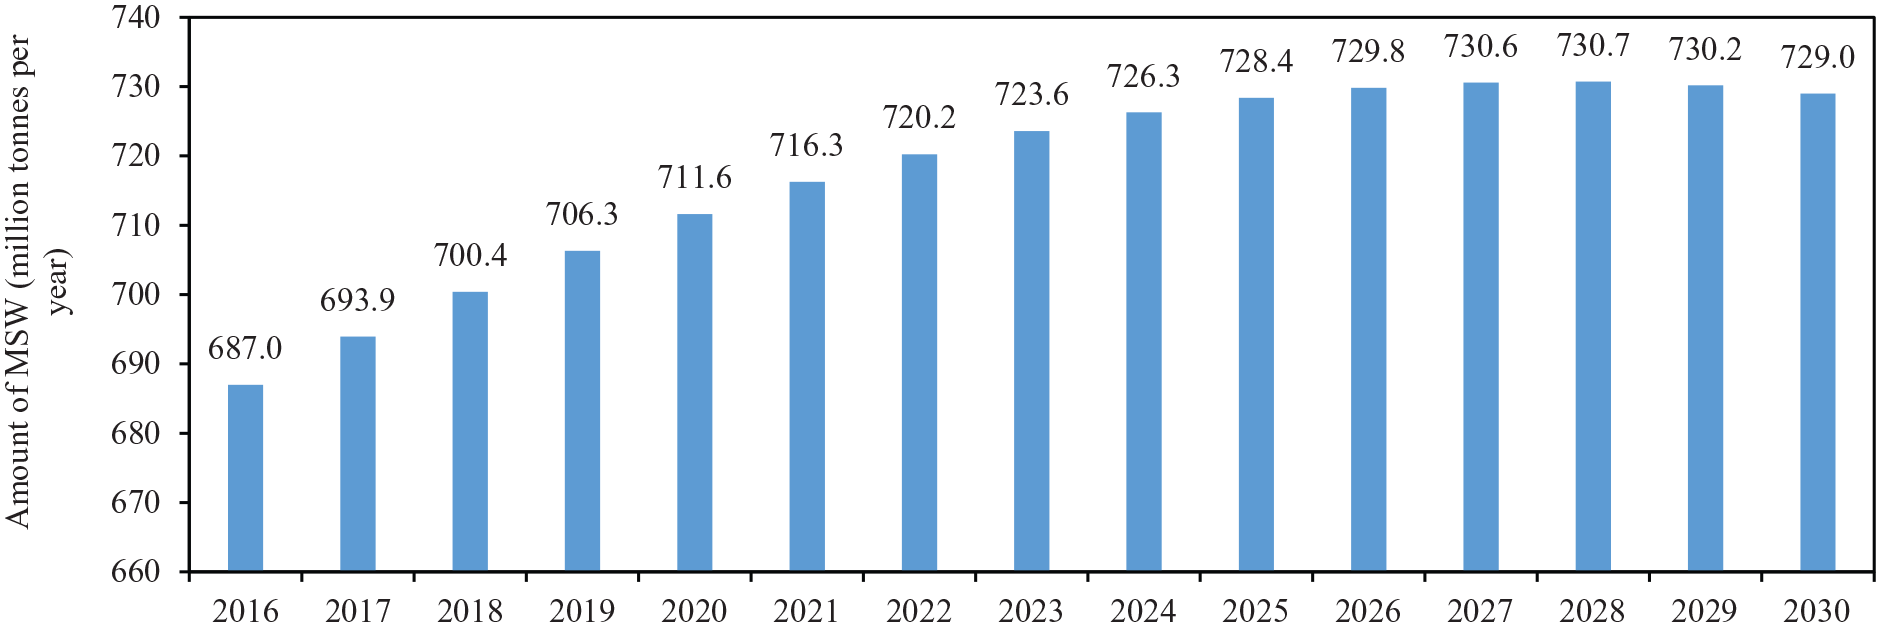
The evolution of uncontrolled disposal of municipal solid waste (MSW) for the period 2016–2030.
Conclusion
This paper provides some useful insights regarding the progress in new MSW infrastructure delivered worldwide for the period 2014–2019. The analysis shows that the new MSW infrastructure delivered capacity amounted to 243 million Mt, equivalent to ~40 million Mt per year. Therefore, the annual rate of delivery of new MSW infrastructure accommodates 2% of the global MSW generated in 2016. Almost 57% of the new capacity is attributed to thermal treatment technologies and about 8% to new landfills. China alone delivered 37.5% of the new capacity, high-income countries delivered 45%, and the remaining 17.5% by all other countries. The total budget allocated to delivered projects is close to US$68 billion with two-thirds of it assigned to new thermal treatment systems and less than 4% to landfills. Only 26 countries delivered 90% of the total new capacity with China and the United States alone delivering almost 50%. The average MSW budget per capita for the six-years period (2014–2019) is about US$14, or 2.33US$ (cap*year)−1, which is less than the price of a coffee in many European and United States cities.
The analysis also shows the dominance of China in the thermal WtE market and the lack of sufficient infrastructure delivery in low-income and low-middle income countries. Considering that the latter are the ones in which a high population growth is expected with increased waste generation, it is imperative to identify major barriers for infrastructure delivery. Governance and institutional development as well as the implementation of a cohesive systemic approach for waste management are of great priority (International Solid Waste Association, 2015b).
The analysis also demonstrates that from 2016 to 2030 an additional 10.7 billion Mt of waste will be driven to uncontrolled disposal in the form of open dumping, open burning, or leakages to the natural environment. It is expected that uncontrolled disposal will continue to rise until 2028 (reaching 730 million Mt of MSW per year) while the new infrastructure delivered will rise by 2% annually under an optimistic scenario. Therefore, the UN SDG 12.4 target could not be met by 2020 and urgent policy interventions are required. In this context, the closure of dumpsites by 2030, necessitates an increase in the capacity of MSW infrastructure delivered in developing countries by four folds to reach 60 million Mt per year, thus highlighting the need for further international assistance to enhance the global agenda in waste management.
In conclusion, it is worth noting that a global scale analysis on uncontrolled disposal does not capture accurately the expected increase in waste generation at a smaller geographic area (e.g., regional basis). In addition, the examination of the waste management systems based on infrastructure data hides one of the important players in waste management in the Global South, the informal recyclers who deliver a significant contribution in terms of cost-effectiveness and resource recovery. Their contribution is difficult to be quantified at a global scale. Future work should target the analysis of the new infrastructure delivery in comparison to expected increase in waste generated on a regional basis and take into consideration the contribution of informal recyclers.
Supplemental Material
Supplemental_material – Supplemental material for Global municipal solid waste infrastructure: Delivery and forecast of uncontrolled disposal
Supplemental material, Supplemental_material for Global municipal solid waste infrastructure: Delivery and forecast of uncontrolled disposal by Amani Maalouf, Antonis Mavropoulos and Mutasem El-Fadel in Waste Management & Research
Footnotes
Acknowledgements
We greatly appreciate AcuComm Company for their approval and provision of the database of global waste plant developments. Special thanks are extended to Mr Eric Wigart and Mr Andy Crofts for their assistance during the data-collection process and their valuable discussions during data analysis.
Declaration of conflicting interests
The authors declared no potential conflicts of interest with respect to the research, authorship, and/or publication of this article.
Funding
The authors received no financial support for the research, authorship, and/or publication of this article.
Supplemental material
Supplemental material for this article is available online.
Notes
References
Supplementary Material
Please find the following supplemental material available below.
For Open Access articles published under a Creative Commons License, all supplemental material carries the same license as the article it is associated with.
For non-Open Access articles published, all supplemental material carries a non-exclusive license, and permission requests for re-use of supplemental material or any part of supplemental material shall be sent directly to the copyright owner as specified in the copyright notice associated with the article.