






Abstract
Students’ ability to effectively allocate time toward educational tasks and reduction of maladaptive behaviors such as procrastination are important predictors of successful educational outcomes. The Academic Time Management and Procrastination Measure (ATMPM) purports to measure the extent to which students engage in such behaviors; however, the psychometric properties of the ATMPM have only been explored with exploratory techniques. In addition, the extent to which measurement invariance is supported among first-generation college students (FGCS) and non-FGCS is unknown. The purpose of the present study was to (1) examine the factor structure of the ATMPM within a college population by employing confirmatory factor analysis and to (2) investigate measurement invariance through an application of multiple group confirmatory factor analysis (MGCFA). Results supported a three-factor solution (planning time, monitoring time, and procrastination), and invariance analyses supported full configural, metric, and scalar invariance.
Keywords
Two important predictors of successful educational trajectories and outcomes among college students are time management and procrastination. Time management is conceptualized as students’ effective use of purposeful time to complete academic tasks within a specified period of time (Bembenutty, 2009). Students who possess effective time management skills are able to prioritize their goals, engage in effective planning of activities, and establish and maintain schedules to fulfill those goals (Bembenutty, 2009). Procrastination, on the other hand, is conceptualized as a maladaptive behavior whereby a student postpones the behaviors necessary for beginning and completing tasks the student intends to complete (Wolters et al., 2017). Effective time management strategies are positively correlated with exam scores and grade point average, even after controlling for factors such as standardized test scores (Bembenutty & Karabenick, 1998; Burlison et al., 2009; Credé & Phillips, 2011; Lahmers & Zulauf, 2000). Procrastination has been linked to lower academic performance, higher levels of stress and illness, and problems in social relationships (Solomon & Rothblum, 1984; Stead et al., 2010; Tice & Baumeister, 1997).
The Academic Time Management and Procrastination Measure (ATMPM, Won & Yu, 2018) is a 14-item scale that purports to measure behaviors related to time management and procrastination. It includes items developed by Won and Yu (2018), Wolters (2003) and Won et al. (2018). Although the scale has been used in a number of studies (Wolters, 2003, 2004; Won & Yu, 2018; Won et al., 2018; Wolters et al., 2013), its psychometric properties have only been examined with exploratory techniques. In addition, to the best of our knowledge, the scale has not been utilized in a sample involving first-generation college students (FGCS) and non-FGCS and the extent to which measurement invariance holds between these two groups is unknown. This is important because FGCS, defined as students for whom neither parent nor guardian graduated from college with a bachelor’s degree (Billson & Terry, 1982; Ishitani, 2006; Toutkoushian et al., 2018), are known to have a distinct profile of characteristics compared to their non-FGCS counterparts. For instance, FGCS are less likely to have taken a rigorous high school curriculum than their non-FGCS peers, more likely to need remedial classes, and are at higher risk of attrition (Antonelli et al., 2020; Chen, 2005; Stuart, 2013; Ting, 2003; Terenzini et al., 1996). Moreover, establishing measurement invariance is a necessary prerequisite for making meaningful group comparisons with respect to latent constructs (e.g., do FGCS procrastinate more than non-FGCS?). Given this background, the objective of the present study was to investigate the factor structure of the ATMPM by employing confirmatory factor analysis (CFA) and to investigate measurement invariance between FGCS and non-FGCS through an application of multiple group confirmatory factor analysis.
Methods
Participants and Measures
The sample consisted of N = 656 undergraduate students from a large university in the Western United States. Ages ranged from 18 to 37 years (M = 19.16, SD = 1.62). Approximately 50% of the sample identified as a FGCS, with the remaining 50% identifying as non-FGCS. The sample was ethnically and racially diverse, with 57% of the respondents identifying as Hispanic, 19% Asian-American, 14% white, 4% Black or African-American, and 6% indicating “other” (e.g., biracial).
ATMPM
The ATMPM is a 14-item self-report scale that measures the degree to which students engage with strategies indicative of effective time management and behaviors associated with procrastination. Respondents indicate the extent to which they agree or disagree with each item using a 7-point response format ranging from 1 (strongly disagree) to 7 (strongly agree). None of the scale items are reverse-coded. All items are provided in the Appendix (Table A1). Over 98% of the sample had complete response patterns (see Table 1).
Statistical Analyses
Factor analysis
The response data were analyzed in Mplus version 8.4 (Muthén & Muthén, 1998–2017) using the robust maximum likelihood estimator. We evaluated three models: a one-factor model (Model 1) consisting of a general time management factor (this model is the most parsimonious and serves as the baseline model), a two-factor model consisting of a time management and procrastination factor (Model 2), and a three-factor model consisting of a planning time, monitoring time, and procrastination factor (Model 3). The latter is the factor structure found by Won and Yu (2018) with a sample of adolescent grade school students. Global model fit was assessed by evaluating the root mean square error of approximation (RMSEA), standardized root mean square residual (SRMR), Tucker–Lewis index (TLI), and the comparative fit index (CFI). The χ2 goodness-of-fit index also is reported but interpreted with caution as it is sensitive to sample size (Brown, 2015). Following Hu and Bentler (1999), cutoff values of RMSEA ≤ 0.06, SRMR ≤ 0.08, TLI ≥ 0.95, and CFI ≥ 0.95 were used to indicate excellent model fit. Localized model fit was evaluated by examining the residual covariance matrix for abnormally large residuals. If large residuals were found, modification indices were considered and applied only if the proposed modification could be theoretically and substantively justified. Nested model comparisons were made via rescaled likelihood ratio tests (LRTs; Millsap, 2011; Satorra & Bentler, 2010). We also evaluated information criteria, including the Akaike information criteria, Bayesian information criteria, and the sample size adjusted BIC (aBIC). All models were identified by setting the factor mean and variance to 0 and 1, respectively. This specification allowed all model parameters to be freely estimated (Brown, 2015).
Reliability
Reliability of the ATMPM was evaluated with coefficient α and coefficient ω. The latter has been shown to be a more robust estimate of reliability than the former because it does not assume items are unidimensional and tau-equivalent (McNeish, 2018); however, we report coefficient α for consistency with the literature and to allow for comparisons with existing measures.
Measurement invariance
Invariance analyses were conducted to determine the extent to which the scale constructs were measured in the same way for FGCS and non-FGCS. Specifically, we examined configural invariance (i.e., same factor structure imposed between groups, but all parameters freely estimated), metric invariance (i.e., equal loadings between groups), and scalar invariance (i.e., equal loadings and intercepts between groups). We assessed the fit of the invariance models by following Chen (2007), who recommended an absolute change of ≤ .010 in CFI, in addition to an absolute change of ≤ 0.15 in RMSEA or a change of ≤ .030 in SRMR to provide evidence of invariance. To supplement the above criteria, nested model comparisons via LRTs were used to determine if the imposed constraints resulted in significant reduction in model fit.
Results
Item Descriptive Statistics and Inter-Item Correlation Matrix.
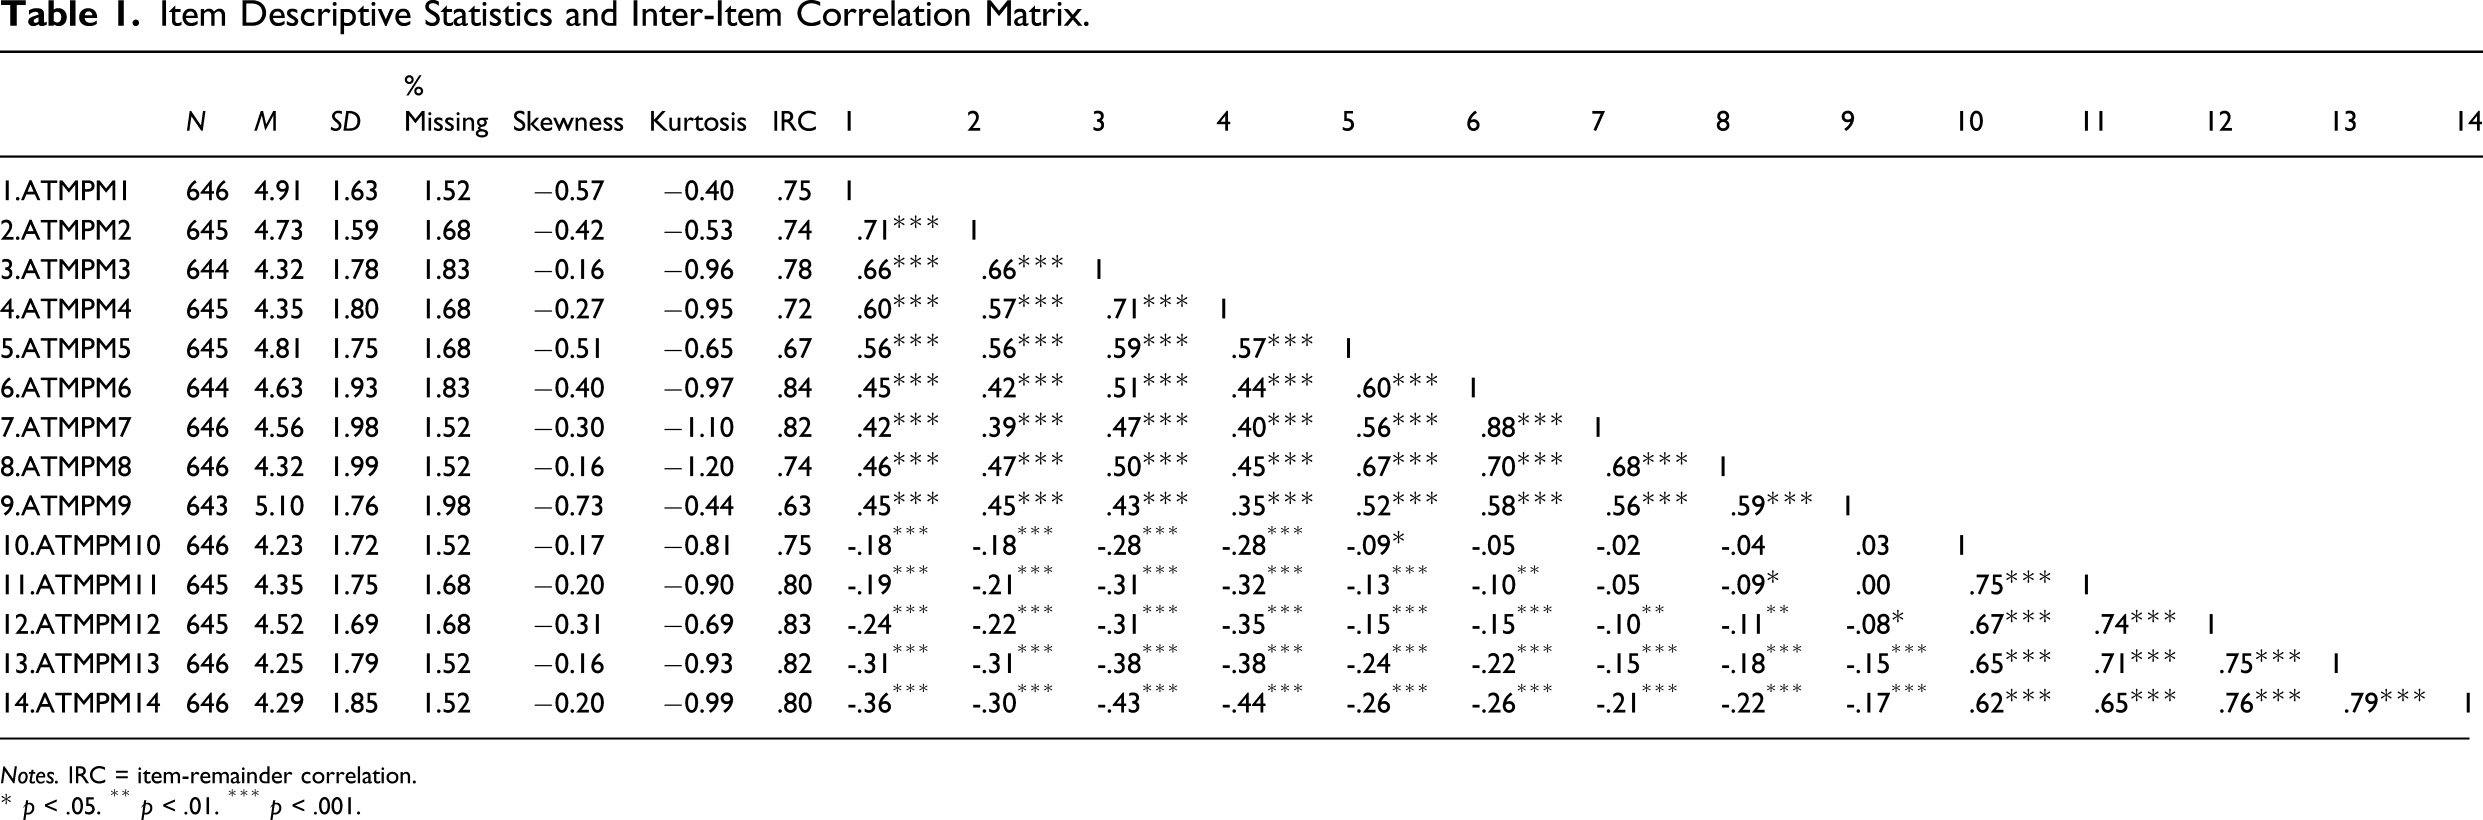
Notes. IRC = item-remainder correlation.
* p < .05. ** p < .01. *** p < .001.
CFA Model Fit Statistics.
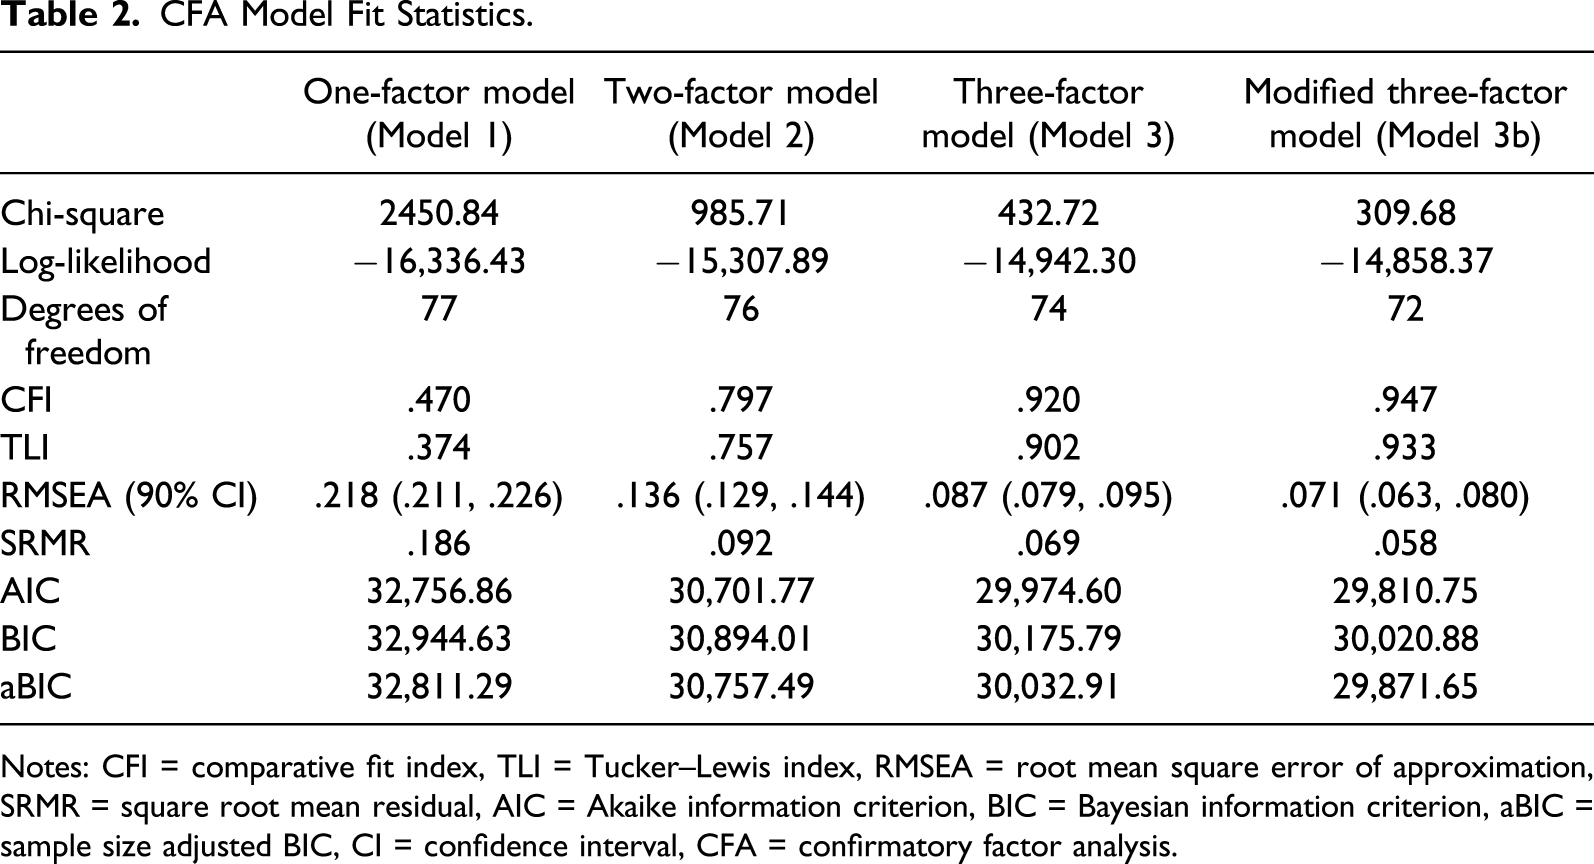
Notes: CFI = comparative fit index, TLI = Tucker–Lewis index, RMSEA = root mean square error of approximation, SRMR = square root mean residual, AIC = Akaike information criterion, BIC = Bayesian information criterion, aBIC = sample size adjusted BIC, CI = confidence interval, CFA = confirmatory factor analysis.
Nested Model Comparisons via Likelihood Ratio Tests.
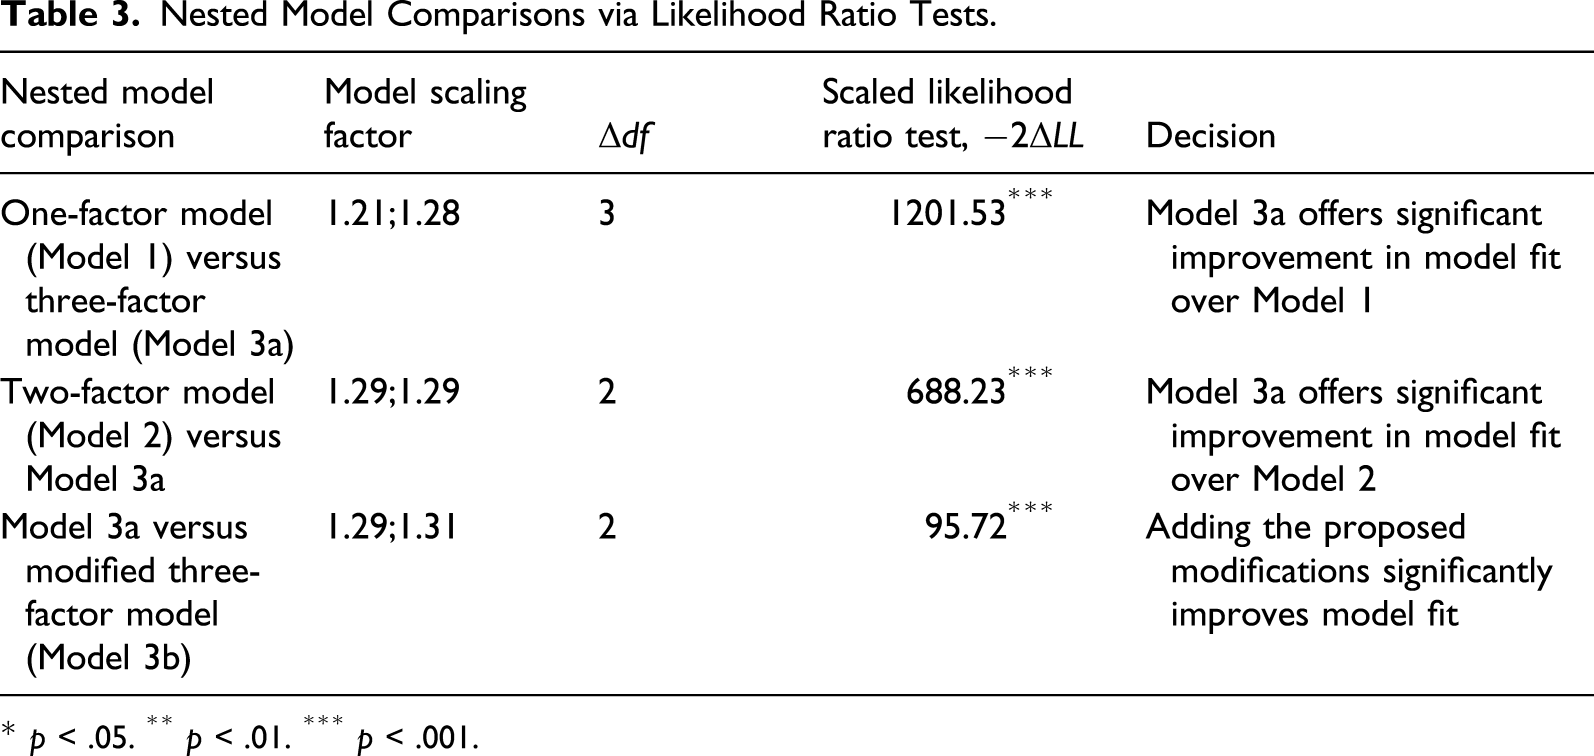
* p < .05. ** p < .01. *** p < .001.
Unstandardized (Standardized) CFA Parameter Estimates for the Modified Three-Factor Model.
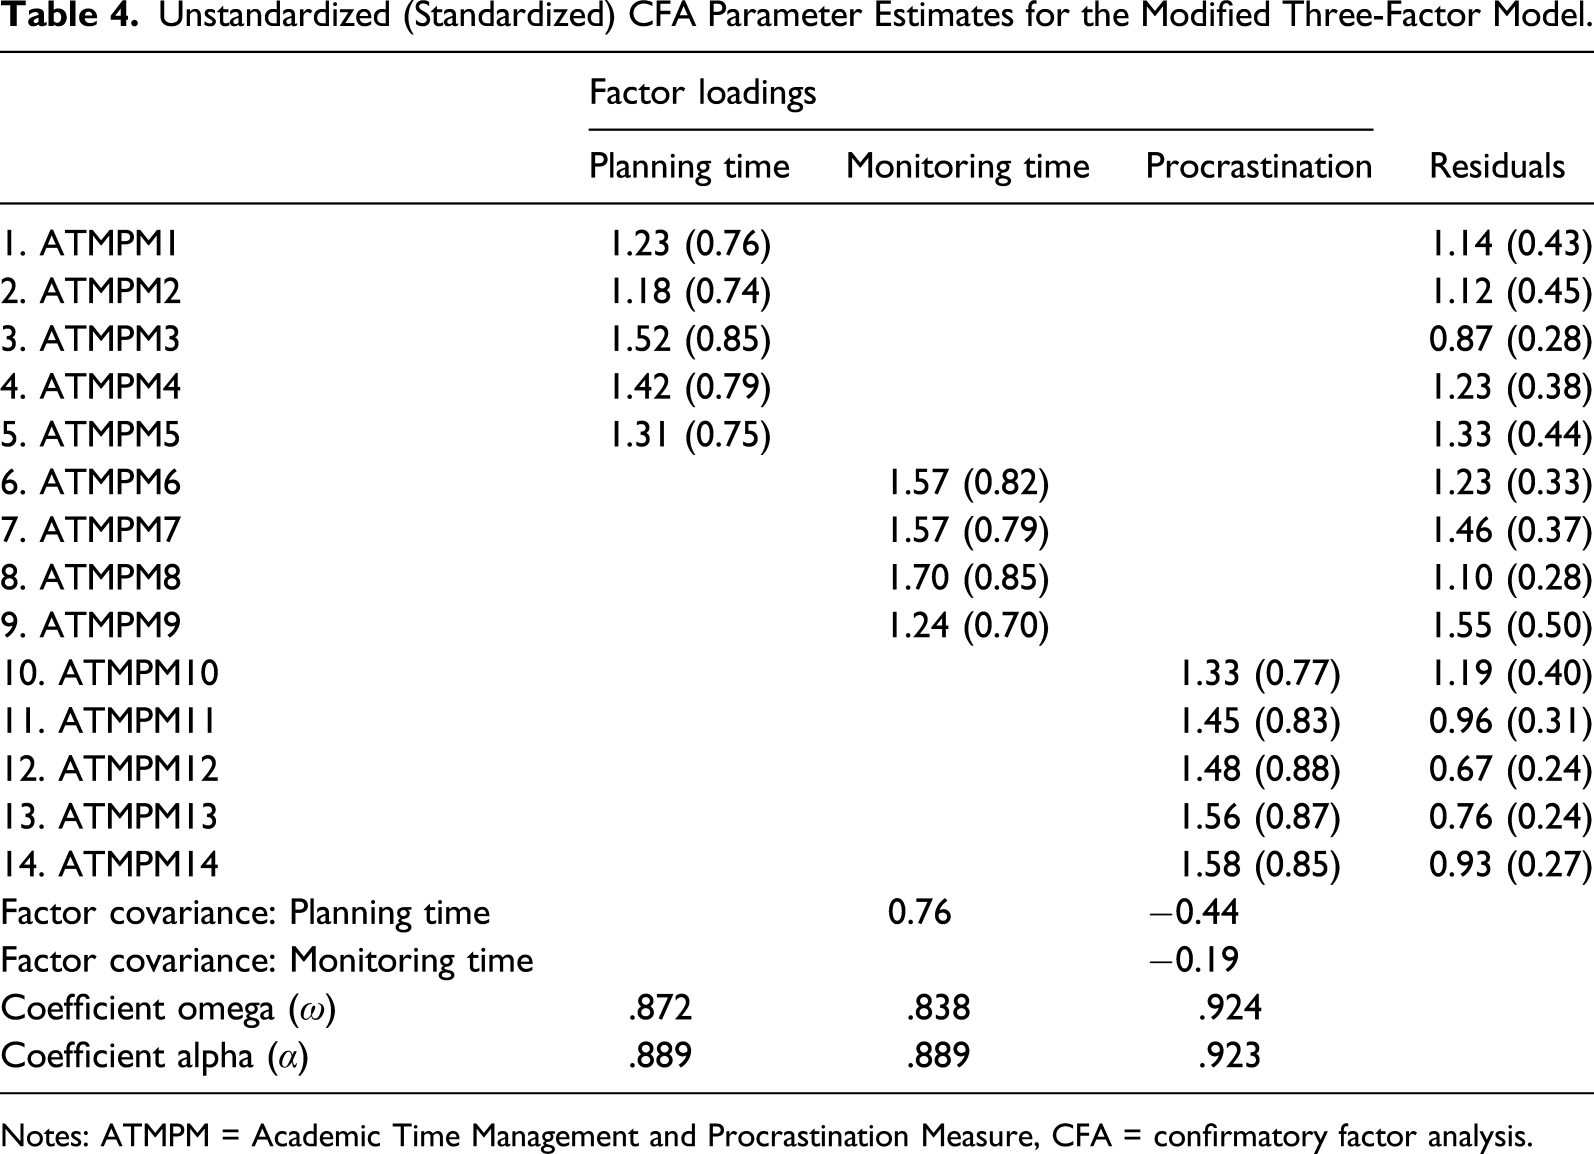
Notes: ATMPM = Academic Time Management and Procrastination Measure, CFA = confirmatory factor analysis.
Measurement Invariance Unstandardized (Standardized) Parameter Estimates.
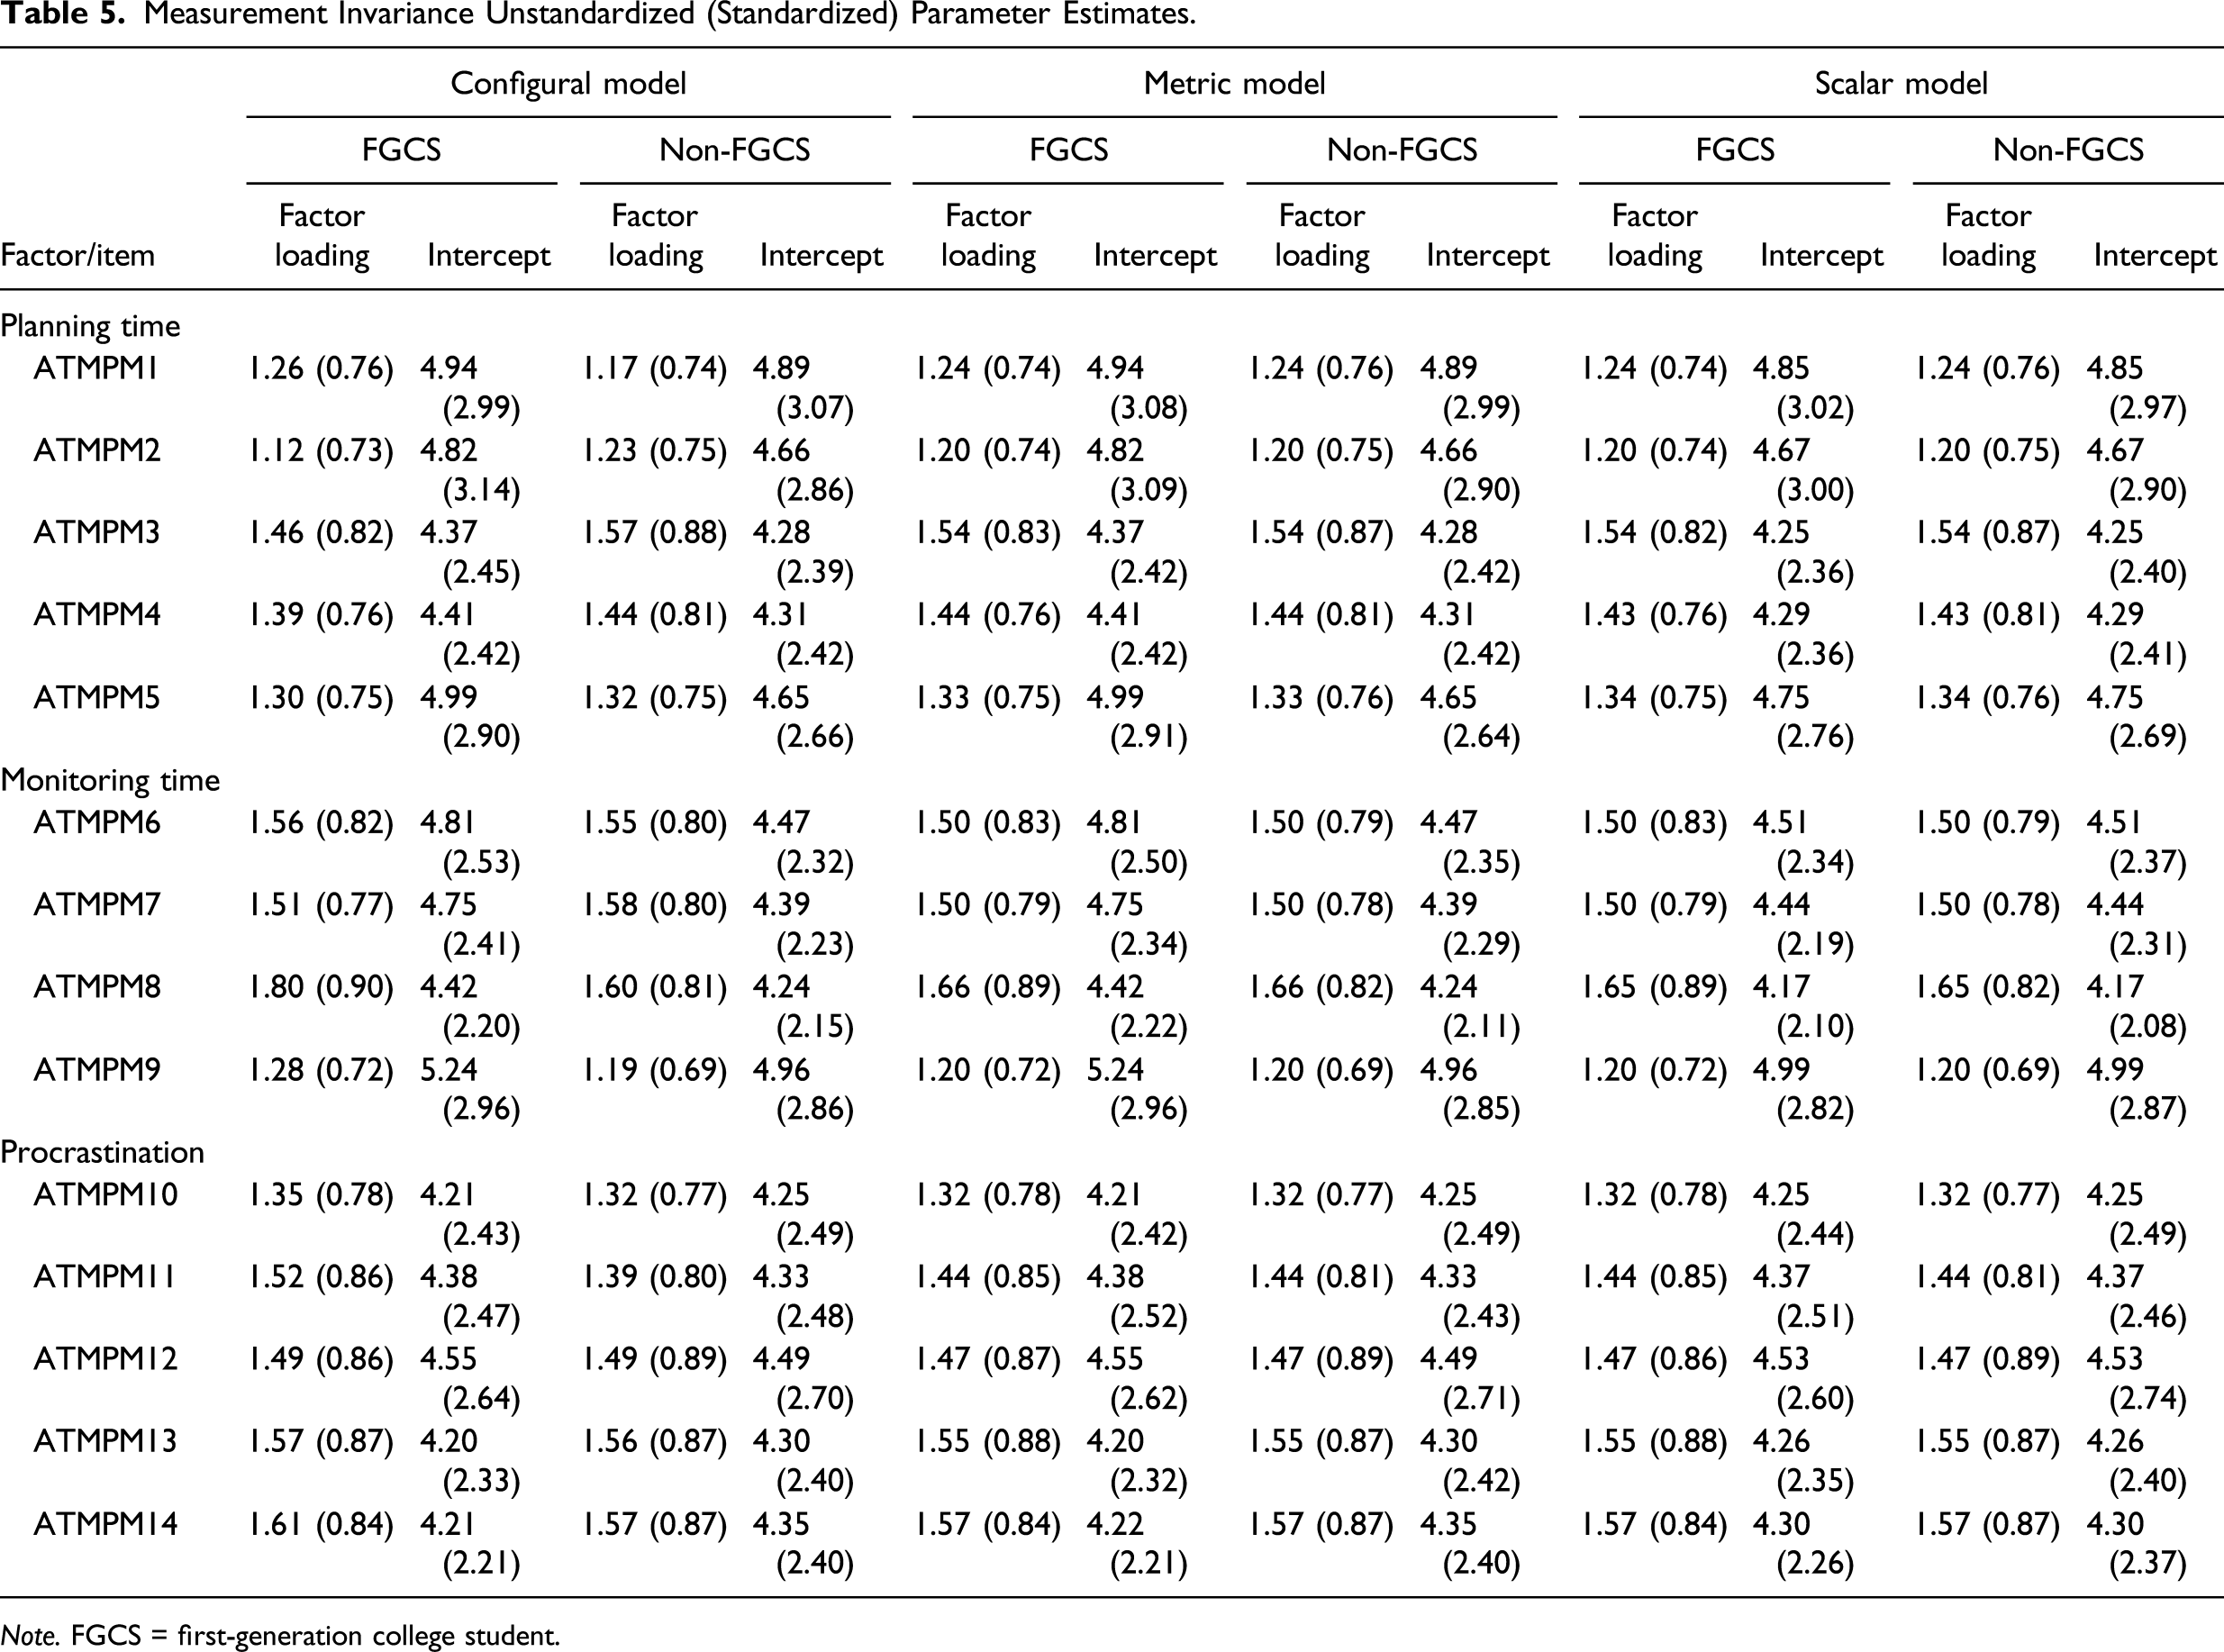
Note. FGCS = first-generation college student.
Discussion
The aim of this investigation was to investigate the factor structure, psychometric properties, and measurement invariance of the ATMPM. The results support a three-factor structure with two error covariance terms that reflect similarities in item wording. Invariance analyses provide evidence that the psychometric properties of the scale do not differ between FGCS and non-FGCS. All items were highly related to their respective factor, providing evidence for the structural validity of the scale. In addition, reliability was found to be robust according to two reliability indices. Our results align with previous findings that time management is not a unitary construct (Adams & Jex, 1997; Macan, 1994; Macan et al., 1990) and is negatively correlated with procrastination (Tuckman, 1991; Wolters, 2003).
We note limitations of this study. First, other measures of procrastination or time management were not administered to the sample. Despite evidence for the structural validity of the scale, the convergent and predictive validity of the ATMPM remains unknown and should be investigated in the future. Second, our sample consisted mainly of first- and second-year undergraduate students. It is possible that many students at this stage in their education are still exploring time management strategies and techniques that become more refined as their education progresses. Future studies should attempt to recruit students at various stages of their education to obtain a more holistic profile of the scale. Third, our invariance analyses were solely based on a first-generation versus non–first-generation dichotomy. It is of interest to evaluate the extent to which invariance holds for more narrowly defined groupings (e.g., first- and non–first-generation students who come from low- or high-income backgrounds).
Despite these limitations, this investigation has several strengths. In particular, this study is the first to examine the factor structure and psychometric properties of the ATMPM within a confirmatory factor analytic framework. This study also provides the first evidence backing the invariance properties of the ATMPM, supporting the use of the scale with different student populations, particularly among first-generation and non-FGCSs. These findings should provide practitioners with an extra level of confidence in the scores when working with these subpopulations. The scale may be particularly useful to educational specialists as a precursory method of identifying students who either lack effective time management skills or are at risk of engaging in procrastination. Identifying such students is especially crucial during the early stages of a student’s collegiate experience as it provides an opportunity to address deficiencies through interventions designed to increase the student’s ability to effectively plan and monitor their time or reduce procrastination (e.g., Malouff & Schutte, 2019; van Eerde & Klingsieck, 2018). University counselors wishing to utilize the scale with students further along in their education (e.g., students in their final semesters of college or graduate students) should interpret the results with caution as it remains unclear if the results generalize to such groups. Last, note that although the time management subscales were negatively correlated with the procrastination subscale (see Table 4), low (high) scores on the time management subscales do not necessarily imply students are high (low) on procrastination. Thus, we recommend utilizing the scale in its entirety along with supplemental student information (e.g., course load) to obtain a comprehensive student profile.
Footnotes
Declaration of Conflicting Interests
The author(s) declared no potential conflicts of interest with respect to the research, authorship, and/or publication of this article.
Funding
The author(s) received no financial support for the research, authorship, and/or publication of this article.

Appendix
Items in the Academic Time Management and Procrastination Measure.

| Latent variable/indicator |
|---|
| All items have seven response categories ranging from 1 = strongly disagree to 7 = strongly agree |
| Planning time |
| 1. I set deadlines for myself when I set out to accomplish an assignment |
| 2. I set short-term goals for the studying I want to accomplish in a few days or weeks |
| 3. I have a system for managing the time I spend on my academic work |
| 4. I have specific times set aside during the week to get my schoolwork done |
| 5. I often set goals or make lists regarding what I need to get done each day |
| Monitoring time |
| 6. I look at a planner, schedule, or calendar every day to see what I need to get done |
| 7. I frequently use a planner, schedule, or calendar to organize all my time commitments |
| 8. I make a list of things to do each day and check off each task as it is accomplished |
| 9. To make sure I don’t forget to do my schoolwork, I often write myself notes or reminders |
| Procrastination |
| 10. I often find excuses for not starting the work for my classes |
| 11. I promise myself I will do my schoolwork, then put it off anyway |
| 12. I frequently put off getting started on the readings and assignments for my classes |
| 13. I delay studying for my classes, even when it is important |
| 14. I postpone doing the work for my classes until the last minute |