






Abstract
The goal of the ESSY Whole Child Screener is to comprehensively and efficiently assess child and contextual factors that affect students’ success in schools. This study evaluated the initial psychometric properties of the screener, its internal factor structure, internal consistency reliability, and teacher perceptions of usability and potential consequences of use. Two large U.S. samples of third, fourth, and fifth grade teachers rated their students on the screener (n = 448 and 317). Exploratory and confirmatory factor analyses were conducted, and the final structure included five factors: Academic Skills, Behavior, Social and Emotional Well-Being, Physical Health, and Supports Outside of School. Scores evidenced strong reliability. All factors significantly correlated with each other, and magnitudes ranged from moderate to large. Within child and contextual items integrated across domains and several cross-loadings were allowed, which aligned with the whole child theoretical rationale of integrated domains that influence students’ functioning. Qualitative content analysis findings suggested overall positive perceptions of usability and potential positive and negative consequences to be considered.
Although tiered frameworks have long been advocated as a way to most effectively meet students’ academic (i.e., Response to Intervention; RtI) and behavioral (i.e., positive behavior intervention supports; PBIS) needs, increased emphasis has been placed in recent years on the importance of integrated multi-tiered systems of supports (I-MTSS; I-MTSS Research Network, 2023). Within an I-MTSS, both academic and social, emotional, and behavioral (SEB) supports are strategically integrated to both support students more comprehensively and maximize existing school resources (Majeika et al., 2024). At the base of any MTSS prevention model is the implementation of effective universal screening procedures to identify those students who may need additional supports (National Center for School Mental Health, 2023). This means not only collecting both academic and SEB screening data but also using these data together to inform decision making (Majeika et al., 2024). Unfortunately, however, national survey results have shown that although universal academic screening is conducted in the majority of elementary buildings (i.e., Reading = 99.5%, Math = 83%), only 12% of elementary school administrators report use of universal SEB screening (Briesch et al., 2021). Further, building administrators in the same survey indicated that whereas academic screening data were most often reviewed by a team (e.g., grade-level, multidisciplinary), SEB screening data were more likely to be reviewed by individual school staff. What these data suggest is that even when schools do collect screening data across multiple domains, they are not necessarily reviewing these data together, potentially causing a fragmented view of student functioning. Behavioral interventions, for example, may be put into place without acknowledgement of potential underlying reasons, such as academic skill deficits.
This fragmented approach to universal screening is also mirrored in the limited scope of available screening tools. Although validated screening tools are available to identify academic (e.g., curriculum-based measurement) and SEB (e.g., brief behavior rating scales) concerns, there are very few examples of screening tools that integrate across multiple domains. The need to use multiple screeners to comprehensively assess student needs raises concerns about access and feasibility (e.g., time), as well as interpretation and integration of data across measures. The few exceptions are rating scales that were primarily designed to assess student SEB functioning but include one or more subscales that also assess academic functioning. For example, both the Behavior Intervention Monitoring Assessment System-Second Edition (BIMAS-2; McDougal et al., 2011) and Social, Academic, and Emotional Behavior Risk Screener (SAEBERS; Kilgus & von der Embse, 2014) contain a subscale designed to assess academic functioning. As another example, the Social Skills Improvement System (SSIS) Performance Screening Guide (Elliott & Gresham, 2008) asks teachers to rate each of their students on three academically-oriented constructs (i.e., Motivation to Learn, Reading Skills, Math Skills). Such measures represent a step forward with regard to conducting more comprehensive, integrated universal screening; nevertheless, there are also drawbacks to the use of existing rating scales that are worth noting.
Although there are several practical advantages to the use of rating scales within a screening context (e.g., efficiency, minimal training requirements, ability to make normative comparisons), a notable limitation is that such measures do not typically consider contextual factors. That is, rating scales ask respondents to indicate how frequently they have observed particular behaviors of interest but stop short of considering the environmental variables that may help to explain those behaviors (Hayes et al., 1986). This is not surprising given that the origins of modern rating scale assessment lay in the measurement of relatively stable intra-individual traits (e.g., personality). The unfortunate consequence, however, can be the labeling of student problems as deficits that exist within the child, in contrast to more contextualized understandings that identify student challenges as a misalignment between student needs and environmental supports (Chafouleas et al., 2021; Sheridan & Gutkin, 2000). In turn, traditional screening instruments may lead to interventions that treat the symptoms, rather than the cause, of student challenges because they lack the contextual information needed to understand the root causes of student behaviors. For example, a student who presents as inattentive because they are coming to school hungry each morning would benefit less from a behavioral intervention than from being connected to needed supports to facilitate access to food. Yet, without assessing food insecurity, existing SEB screeners may cause educators to overlook this explanation. Because the impacts of contextual assets and barriers (i.e., social determinants of health, SDOH) on youth well-being are well-established (Prokosch et al., 2022; Shankar et al., 2017), screening for SDOH has increasingly been incorporated within pediatric healthcare settings (e.g., Henrikson et al., 2019). Such an approach to screening remains relatively rare, however, in schools (Koslouski et al., 2024b).
Expanding Screening to Support Youth (ESSY)
Although integrated, universal school-based screening appears to hold great promise for supporting student well-being, existing tools fall short of providing a more complete picture of the whole child in context. To address these gaps, our team has worked to develop a more comprehensive school-based screening instrument to assess both child and contextual indicators: the Expanding Screening to Support Youth (ESSY) Whole Child Screener. Rather than conducting separate screenings for each individual domain of student functioning (e.g., academic, SEB, physical health)—as is common practice in school settings—one central aim was to integrate assessment within a single measure. We drew upon Chafouleas and Iovino’s (2021) whole child conceptualization of childhood developmental pathways to develop our within-child domains of academic, social, emotional, behavioral, and physical health. We also aimed to incorporate assessment of contextual factors believed to influence school behavior to facilitate educators’ consideration of how within-child and contextual domains may intersect. We initially drew upon social determinants of health literature, identifying six potential domains of interest: economic stability, education, social and community context, health and clinical care, neighborhood and physical environment, and food (Henrikson et al., 2019). Finally, efficiency was a major consideration to maximize the feasibility of using a comprehensive whole child screener in schools. The efficiency of the ESSY Whole Child Screener is enhanced by a multiple gating approach (Severson et al., 2007). Using this approach, teachers rate a single broad item about each domain of interest (Gate 1). If no areas of concern are identified, screening concludes. For any domains identified as an area of concern, teachers complete specific items to further assess the area of concern (Gate 2).
Development of the ESSY Whole Child Screener has focused on centering the perspectives of intended users early in and throughout the measurement development process. We have used a mixed methods approach, intentionally emphasizing ongoing consideration of both the intended and unintended consequences of measure use (i.e., Consequential Validity-Centered Measure Development framework, CVMD; see Caemmerer et al., 2026). This includes the collection of qualitative data to gather intended users’ perspectives of the screener, alongside more traditional quantitative examination of the screener’s psychometric properties.
To begin, we consulted the existing literature, content experts, and intended users to identify constructs to assess and to develop items. We reviewed literature related to within-child domains traditionally incorporated in school-based screening (Academics, Social Skills, Internalizing Behaviors, and Externalizing Behaviors) as well as physical health and social determinants of health (SDOH; e.g., economic stability, food, social and community context). We also convened two advisory boards. A multidisciplinary advisory board was comprised of individuals with scholarly or clinical expertise across our domains of interest including screening, multitiered systems of support, family and community partnerships, whole child development, school health, mental health, trauma, and measurement. A school-based advisory board included school administrators, school psychologists, and other student support personnel (Caemmerer et al., 2026).
The ESSY Whole Child screener is a teacher-report measure for elementary school students. The initial hypothesized structure of the ESSY Whole Child Screener contained five domains focused on child-level characteristics and skills (academic skills, behavior, emotional well-being, social skills, physical health) as well as six domains focused on contextual influences (economic stability, education, social and community context, health and clinical care, neighborhood and physical environment, and food). Advisory board members provided qualitative feedback via synchronous advisory board meetings and Qualtrics surveys with open-ended questions about the relevance and appropriateness of items, as well as any missing items or constructs. For example, advisory board members recommended condensing the contextual domains and items to those that teachers could observe within the school day (Caemmerer et al., 2026). This led to reorganizing contextual items into four domains: access to basic needs, attendance, school experiences, and social supports.
Next, an initial draft of the screener was presented to a range of intended users. Although the measure was developed for use in elementary schools, data collection was focused on 3rd–5th grade in order to obtain more detailed and targeted feedback. As such, 18 teachers, administrators, school mental health professionals, and caregivers of students in 3rd–5th grade were interviewed to assess its perceived usability and to explore potential intended and unintended consequences of the screener (Koslouski et al., 2024a). Using reflexive thematic analysis (Braun & Clarke, 2021), we found that participants noted several potentially positive consequences of assessing the whole child including greater strengths-based focus, a potential to identify root causes of concerns, and a potential to increase home-school communication. Several concerns were also identified including potential discomfort of families with regard to contextual screening items, uncertainty regarding the ability of teachers to rate contextual items accurately, and questions regarding the ability of schools to connect students with appropriate supports (Koslouski et al., 2024a). The screener was revised in response to this feedback to adjust the wording of contextual items. For example, to reduce potential bias items were rewritten to assess indicators that are directly observable by teachers (e.g., “access to a sufficient amount of food” became “student reports being hungry [e.g., requests or stores food to take home, frequently asks for snacks/food]”), the domain “access to basic needs” was renamed to “access to material needs” to reduce the possibility of families feeling judged or shamed, and “living with relatives” was removed as an example of housing instability to avoid culturally-biased misclassifications of intergenerational families (Caemmerer et al., 2026).
Additional qualitative data was collected via interviews with a sample of nine 3rd–5th grade students to understand their perspectives of the information included within the screener (Lyon et al., 2025). Using reflexive thematic analysis (Braun & Clarke, 2021), we found that students endorsed most of the ESSY domains as relevant to their school success and generally wanted teacher support to build their own skills (e.g., academic, SEB), but students were more hesitant about relational or contextual support.
As a final step in the initial measure development phase, cognitive “think aloud” interviews were conducted with ten 3rd–5th grade teachers to understand if the instructions and items were interpreted as intended (Caemmerer et al., 2026). Data were analyzed using framework analysis (Gale et al., 2013) and findings prompted item wording and screener formatting changes (e.g., reversing the presentation of the response options as selection errors were observed). After multiple rounds of revisions based on the qualitative feedback of our advisory boards and intended users, which evaluated validity evidence related to the test content, response processes, and consequences, a large field test of the final draft of the screener was conducted. The purpose of the large field test was to collect and analyze quantitative and qualitative data gathered from teachers’ actual ratings of their students. The data from these field tests are the focus of this paper.
Purpose of Studies
Initial evaluations of validity and reliability evidence of the screener scores were examined in the two studies in this paper. The ESSY Whole Child Screener was hypothesized to measure nine domains, five within child domains and four contextual domains. Although the screener is not norm-referenced and domain-level composite scores are not calculated, a better understanding of the domains measured by the screener and how the items relate to those domains is needed to support the internal structure of the screener. In line with our mixed methods approach to the screener’s development, we also collected qualitative data about teachers’ perceptions of usability and potential positive and negative consequences of the screener’s use using open-ended survey questions. The combined information was used to refine the factor structure of the screener and identify items that were misplaced or mis-specified as well as candidates for removal.
Study 1
The goal of Study 1 was to evaluate initial internal structure and consequential validity evidence of the ESSY Whole Child Screener. Specifically, we aimed to answer the following research questions: (1) What is the factor structure of the ESSY Whole Child Screener? How many domains of student functioning are measured by the screener? (2) What are the characteristics of the factor solution of the ESSY Whole Child Screener, such as factor loadings, factor intercorrelations, and internal consistency? (3) How do teachers perceive the usability of the ESSY Whole Child Screener, and what positive and negative consequences of its use do they identify?
Method
Recruitment and Participants
Teachers were recruited through partnerships with three school districts in the Northeastern and Southeastern United States. A total of 24 schools participated, 17 Northeast and 7 Southeast schools. Following approval from the university and applicable district research review boards, study personnel contacted principals via email or phone to explain the study and seek permission to distribute recruitment flyers to teachers in their building. There were three study inclusionary criteria: teachers were (a) 18 years old or older, (b) 3rd, 4th, or 5th grade general or special education teachers, and (c) able to complete the screener in English.
Teacher Characteristics
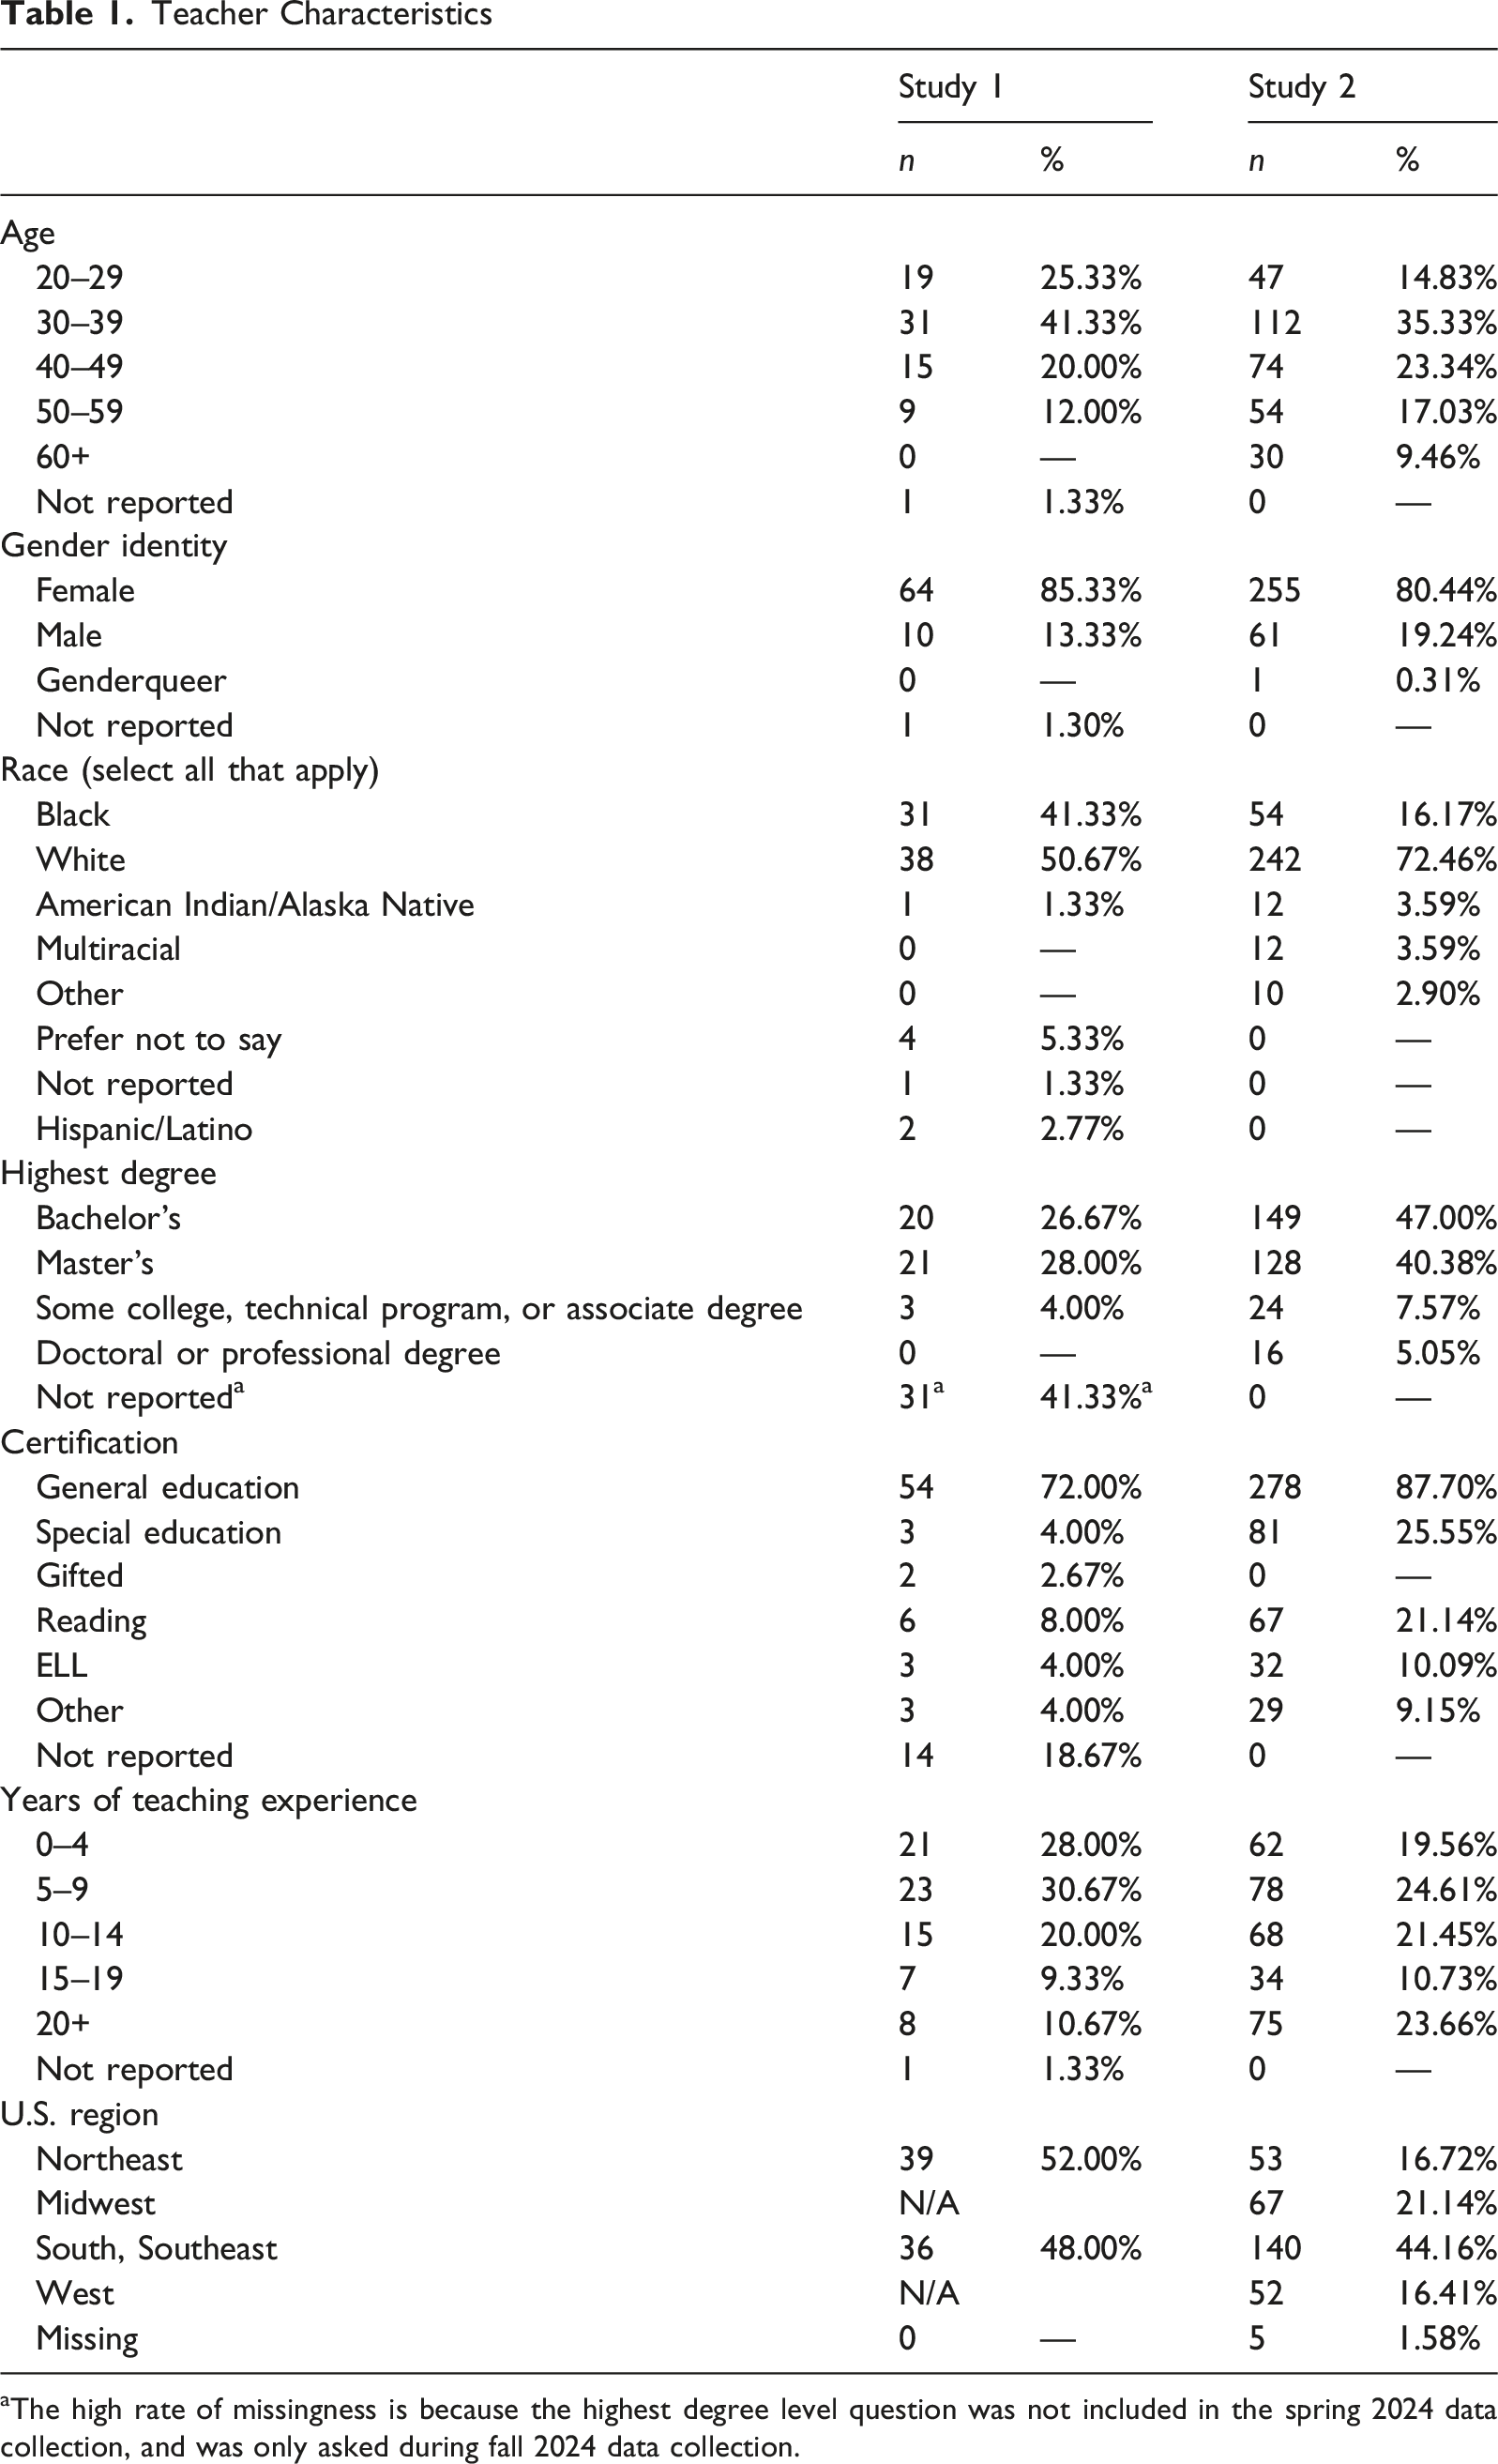
aThe high rate of missingness is because the highest degree level question was not included in the spring 2024 data collection, and was only asked during fall 2024 data collection.
Student Characteristics
Measures
The ESSY Whole Child Screener
The ESSY Whole Child Screener was initially designed to measure nine broad domains known to influence student functioning, encompassing both child-level and contextual-level considerations (Koslouski et al., 2024a). The hypothesized domains were academic skills, behavior, emotional well-being, physical health, social skills, attendance, access to material needs, school experiences, social supports. Each domain included one Gate 1 item, which was a broad representation of the domain, and 4 (social skills) to 12 (social supports) Gate 2 items which assessed specific behaviors, skills, characteristics, and experiences within each domain. Six of the social supports items were added in the fall 2024 data collection to include more contextual-level strengths in the screener.
The Gate 1 and Gate 2 item response scales were different, and Gate 1 items only contain one item per domain; thus, we focus specifically on the Gate 2 items in this study. Attendance was excluded from this study because attendance was only represented by one Gate 1 item and zero Gate 2 items. A total of 68 Gate 2 items were included across the eight hypothesized domains, with the intention to include more items at this stage than desired in the final screener, to allow quantitative tests to identify potential items for deletion (Bandalos, 2018; Boateng et al., 2018). Each Gate 2 item asked respondents to rate the frequency with which the student had either exhibited certain behaviors (e.g., reading, peer communication) or had particular experiences (e.g., bullied by others, adequate clothing) over the past 3 months. Teachers rated these items using a 5-point Likert-type scale (1 = Almost Never, 2 = Occasionally, 3 = Sometimes, 4 = Frequently, 5 = Almost Always).
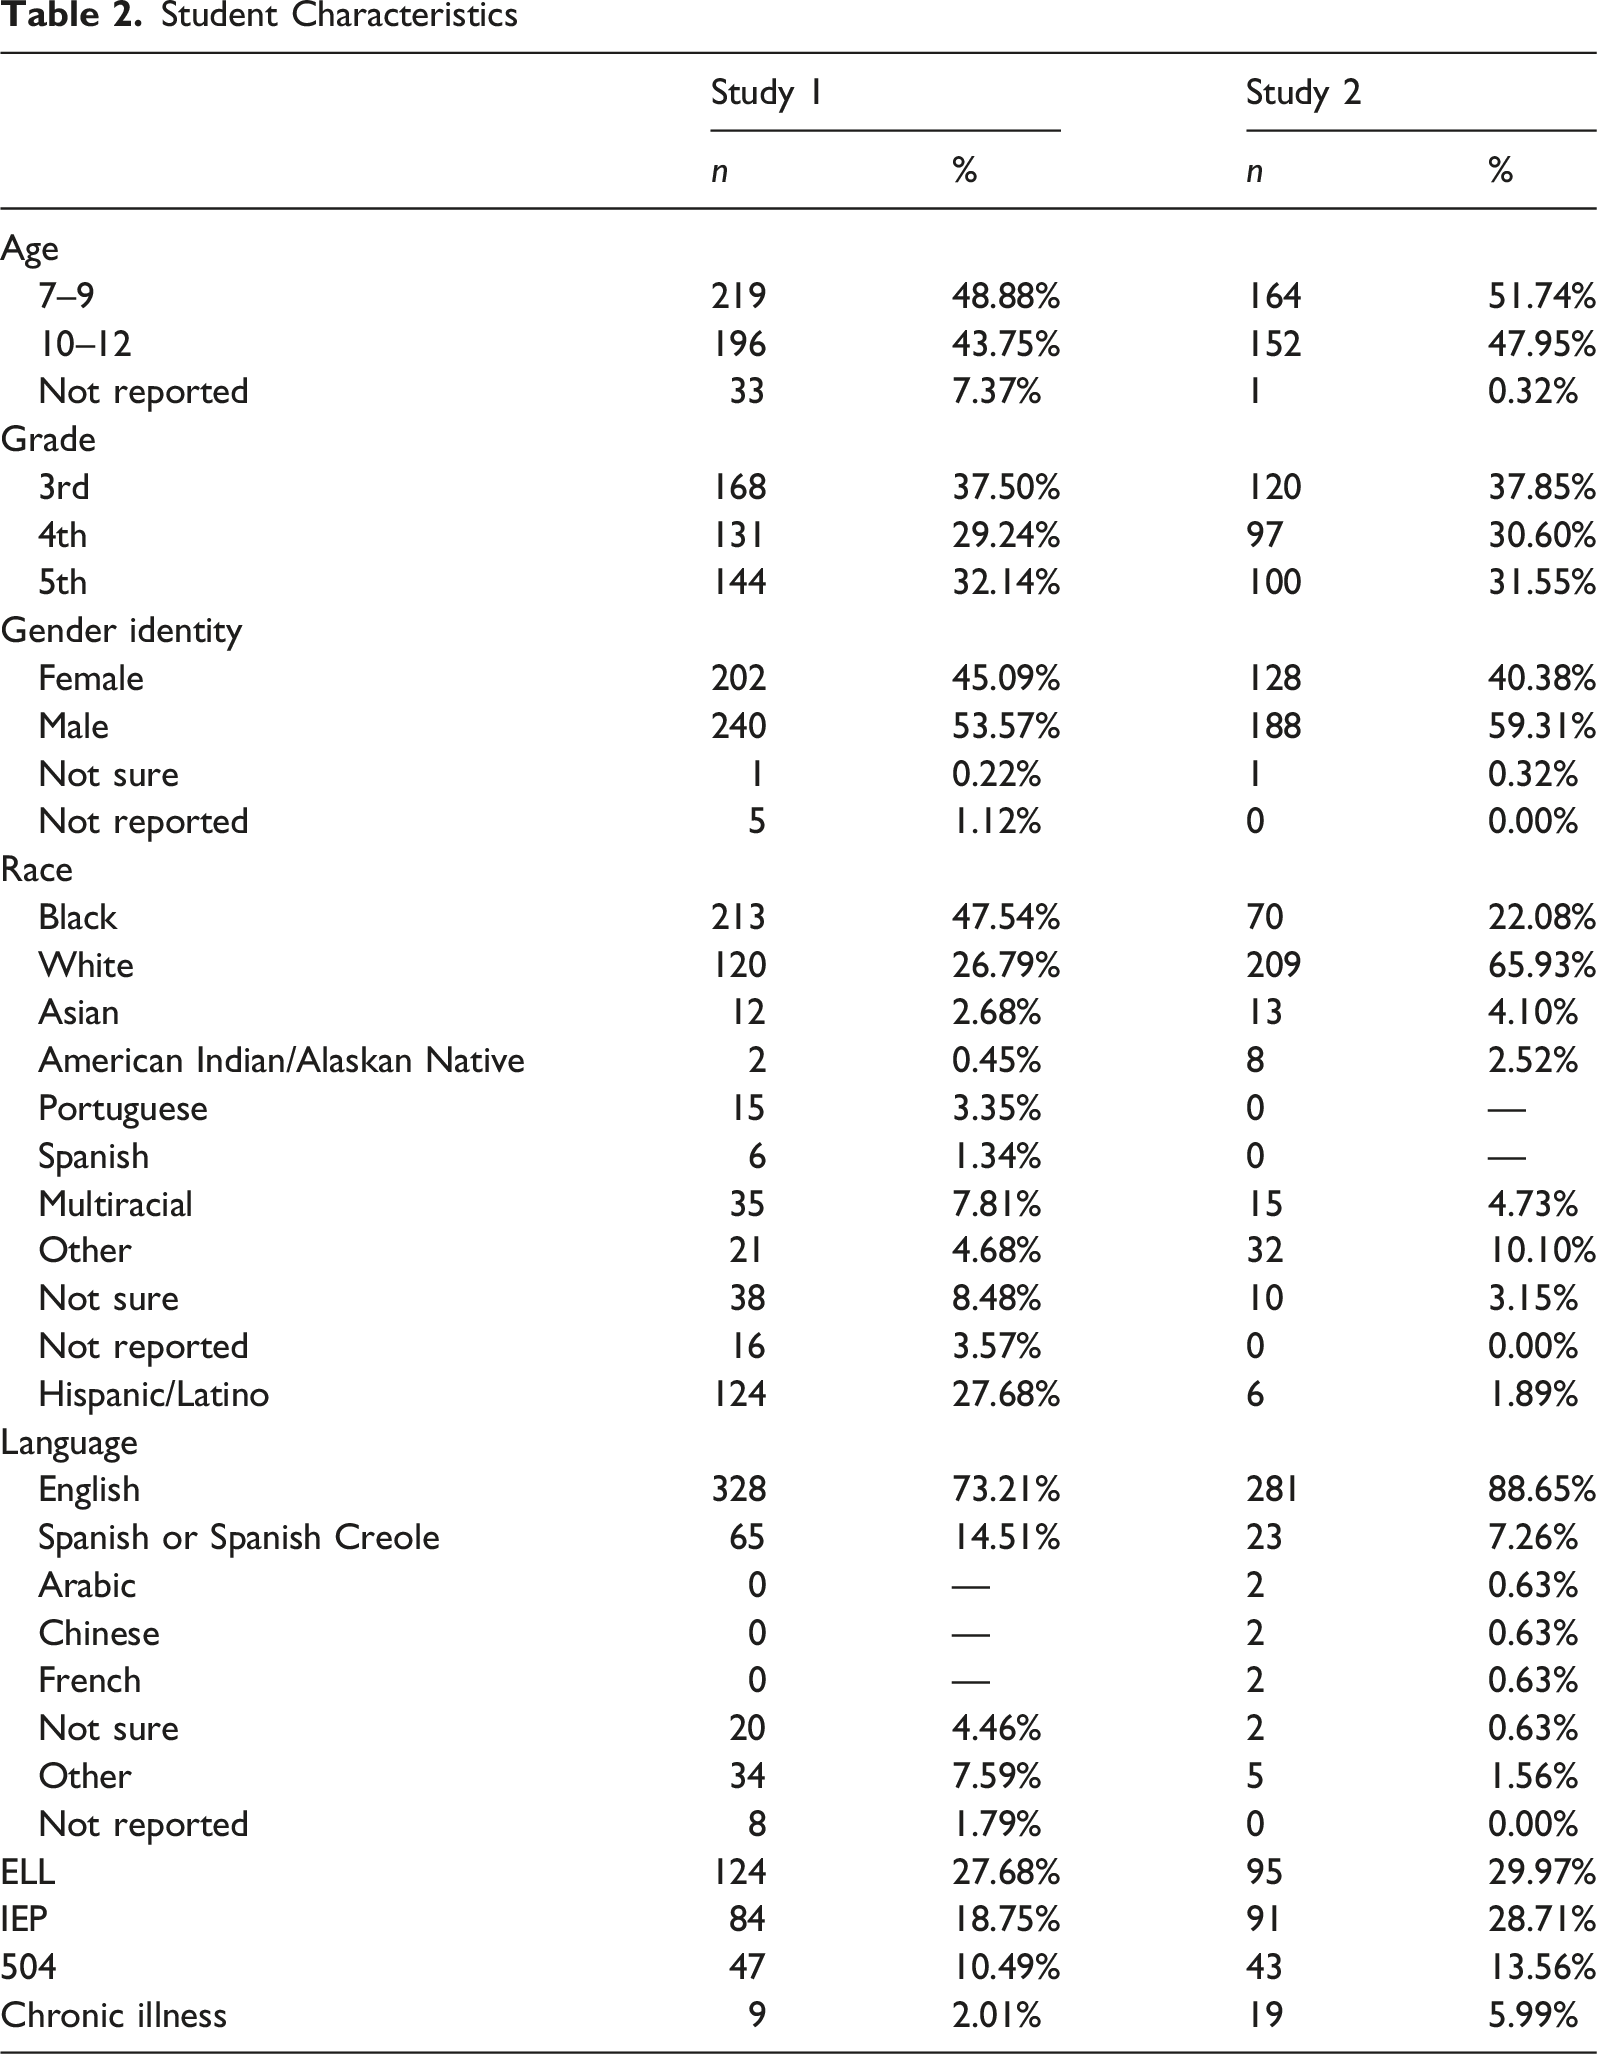
Additionally, demographic questions were included to collect information about each student’s age, grade, ethnicity and race, gender, primary language spoken, Individualized Education Program (IEP) status, 504 status, and presence of a diagnosed chronic illness (see Table 2). During an earlier step in the ESSY Whole Child Screener development, intended users recommended the inclusion of these demographic items within the screener to contextualize the ratings on other items (Koslouski et al., 2024a).
Demographic Form
For the purposes of this study, demographic information was also collected about teacher participants. Specifically, they were asked about their years of teaching experience, role, educational background, and other demographic details (see Table 1).
Open-Ended Survey Questions
Eight researcher-created questions asked participants for their perspectives on the usability of the measure, potential positive and negative consequences of its implementation, and suggestions for improving the survey format and content.
Procedure
All study procedures were approved by the University of Connecticut Institutional Review Board. Teachers who agreed to participate were instructed to distribute an opt-out flyer to all caregivers of students in their classroom. Following the opt-out period, teachers were emailed a Qualtrics survey link. Within a 3-minute instructional video, teachers were provided instructions for (a) omitting students whose caregiver had opted out, (b) randomly selecting six to eight students on their alphabetical class list to rate, and (c) conducting ratings. Teachers then proceeded to the ESSY Whole Child Screener wherein the order of Gate 2 items was randomized. To facilitate accurate responses, instructions at the top of each page provided anchors for each response option and reminded teachers to rate the student based on the past 3 months. After the teachers rated all Gate 2 items, teachers were then presented with a block of demographic questions about each student. Lastly, after the teacher rated all their students, they were presented with eight open-ended questions to gather qualitative feedback on the screener. Teachers were compensated $12 for each student they rated, up to a total of $96.
Data Analysis Plan
Quantitative Analysis
Data were prepared for analyses in R version 4.3.1. Multiple factor extraction methods (maximum likelihood estimation and parallel analysis) were used to determine the number of factors to retain (Auerswald & Moshagen, 2019; Bandalos, 2018; Watkins, 2006). Maximum likelihood estimation was conducted in Mplus version 8.11 (Muthén & Muthén, 2017). Maximum likelihood estimation accounted for the complexity of our data, including clustering and missingness. The maximum likelihood with robust standard errors estimator (MLR) was used with the TYPE = COMPLEX command to account for the clustering of data within the three school districts. Full-information maximum likelihood estimation (FIML) addressed missing data due to nonresponse. FIML does not discard incomplete data, rather missing variables are predicted from observed data, and missing data patterns are accounted for in the standard errors, thus improving the accuracy and power of model estimation (Enders, 2022; Schafer & Graham, 2002). FIML is considered an appropriate method for estimating model parameters when data are assumed to be missing at random (MAR; Enders, 2022; Rubin, 1987). An oblique rotation (geomin) was used because the factors were expected to correlate with one another.
We hypothesized the screener was comprised of eight domains: academic skills, behavior, emotional well-being, physical health, social skills, access to material needs, school experiences, and social supports. Attendance was excluded from this study because there are no Gate 2 attendance items. Nine potential factor solutions were examined, which ranged from one to nine factors. The likelihood ratio test (Δχ2) was used to compare models with different numbers of factors extracted. Statistically significant Δχ2 support the less constrained model with fewer degrees of freedom, which in these analyses had a higher number of factors. Mplus also provides fit statistics for each model. Although the use of fit statistics in exploratory factor analysis is less researched than in confirmatory factor analyses, similar model fit criteria may be appropriate, including root mean square of error of approximation (RMSEA <0.06), standardized root mean residual (SRMR <.08), comparative fit index (CFI >.95), and Tucker-Lewis index (TLI >.95; Hu & Bentler, 1999; Widaman & Helm, 2023).
Parallel analysis was the second factor extraction method used and was performed in R 4.3.1 using the fa.parallel function in the psych package (Revelle, 2025). Parallel analysis is a simulation technique which compares the eigenvalues of the observed data matrix to a random data matrix (Horn, 1965). Eigenvalues of the observed data matrix that are above the 95% percentile of the simulated eigenvalues are considered significant; the number of such eigenvalues is the recommended number of factors to extract in the EFA. The eigenvalues were generated using a principal axis factor analysis (fa = fa) and the factoring method was a principal factor solution (fm = pa). The correlation matrix was calculated using pairwise complete observations.
Factor loadings of 0.30 or higher were considered substantial loadings on a given factor (Bandalos, 2018). Cross-loadings were explored given the strong relations between many of the hypothesized domains of the ESSY Whole Child Screener; the theoretical rationale of the whole child approach supports the interrelatedness of multiple domains of children’s functioning (Chafouleas & Iovino, 2021). Furthermore, due to the screener’s multiple-gated approach teachers will only rate select Gate 2 items that correspond with the single broad Gate 1 item that was rated as a concern. Allowing Gate 2 items to cross-load on multiple domains may ensure important Gate 2 items are not missed because the endorsement of any of the corresponding domains at Gate 1 will result in their inclusion at Gate 2. Finally, the inclusion of cross-loadings will not complicate the interpretation of the ESSY Whole Child Screener scores because factor-based domain-level composite scores will not be calculated and cut-scores will not be used in the interpretation of the results.
Correlations between the factors were also examined. Effect sizes were interpreted as follows: .10 = small, .30 = medium, and .50 = large (Cohen, 1988). Internal consistency was estimated by coefficient alpha and omega for the retained factors.
Qualitative Analysis
Responses to the open-ended questions about perceived usability and potential positive and negative consequences were analyzed using directed content analysis (Hsieh & Shannon, 2005). Responses were read and grouped together related to perceived usability (effectiveness, efficiency, satisfaction; International Organization for Standardization, 2018), potential positive consequences of the measure’s use, and potential negative consequences.
Results
Descriptives
Study 1 Item Descriptive Statistics
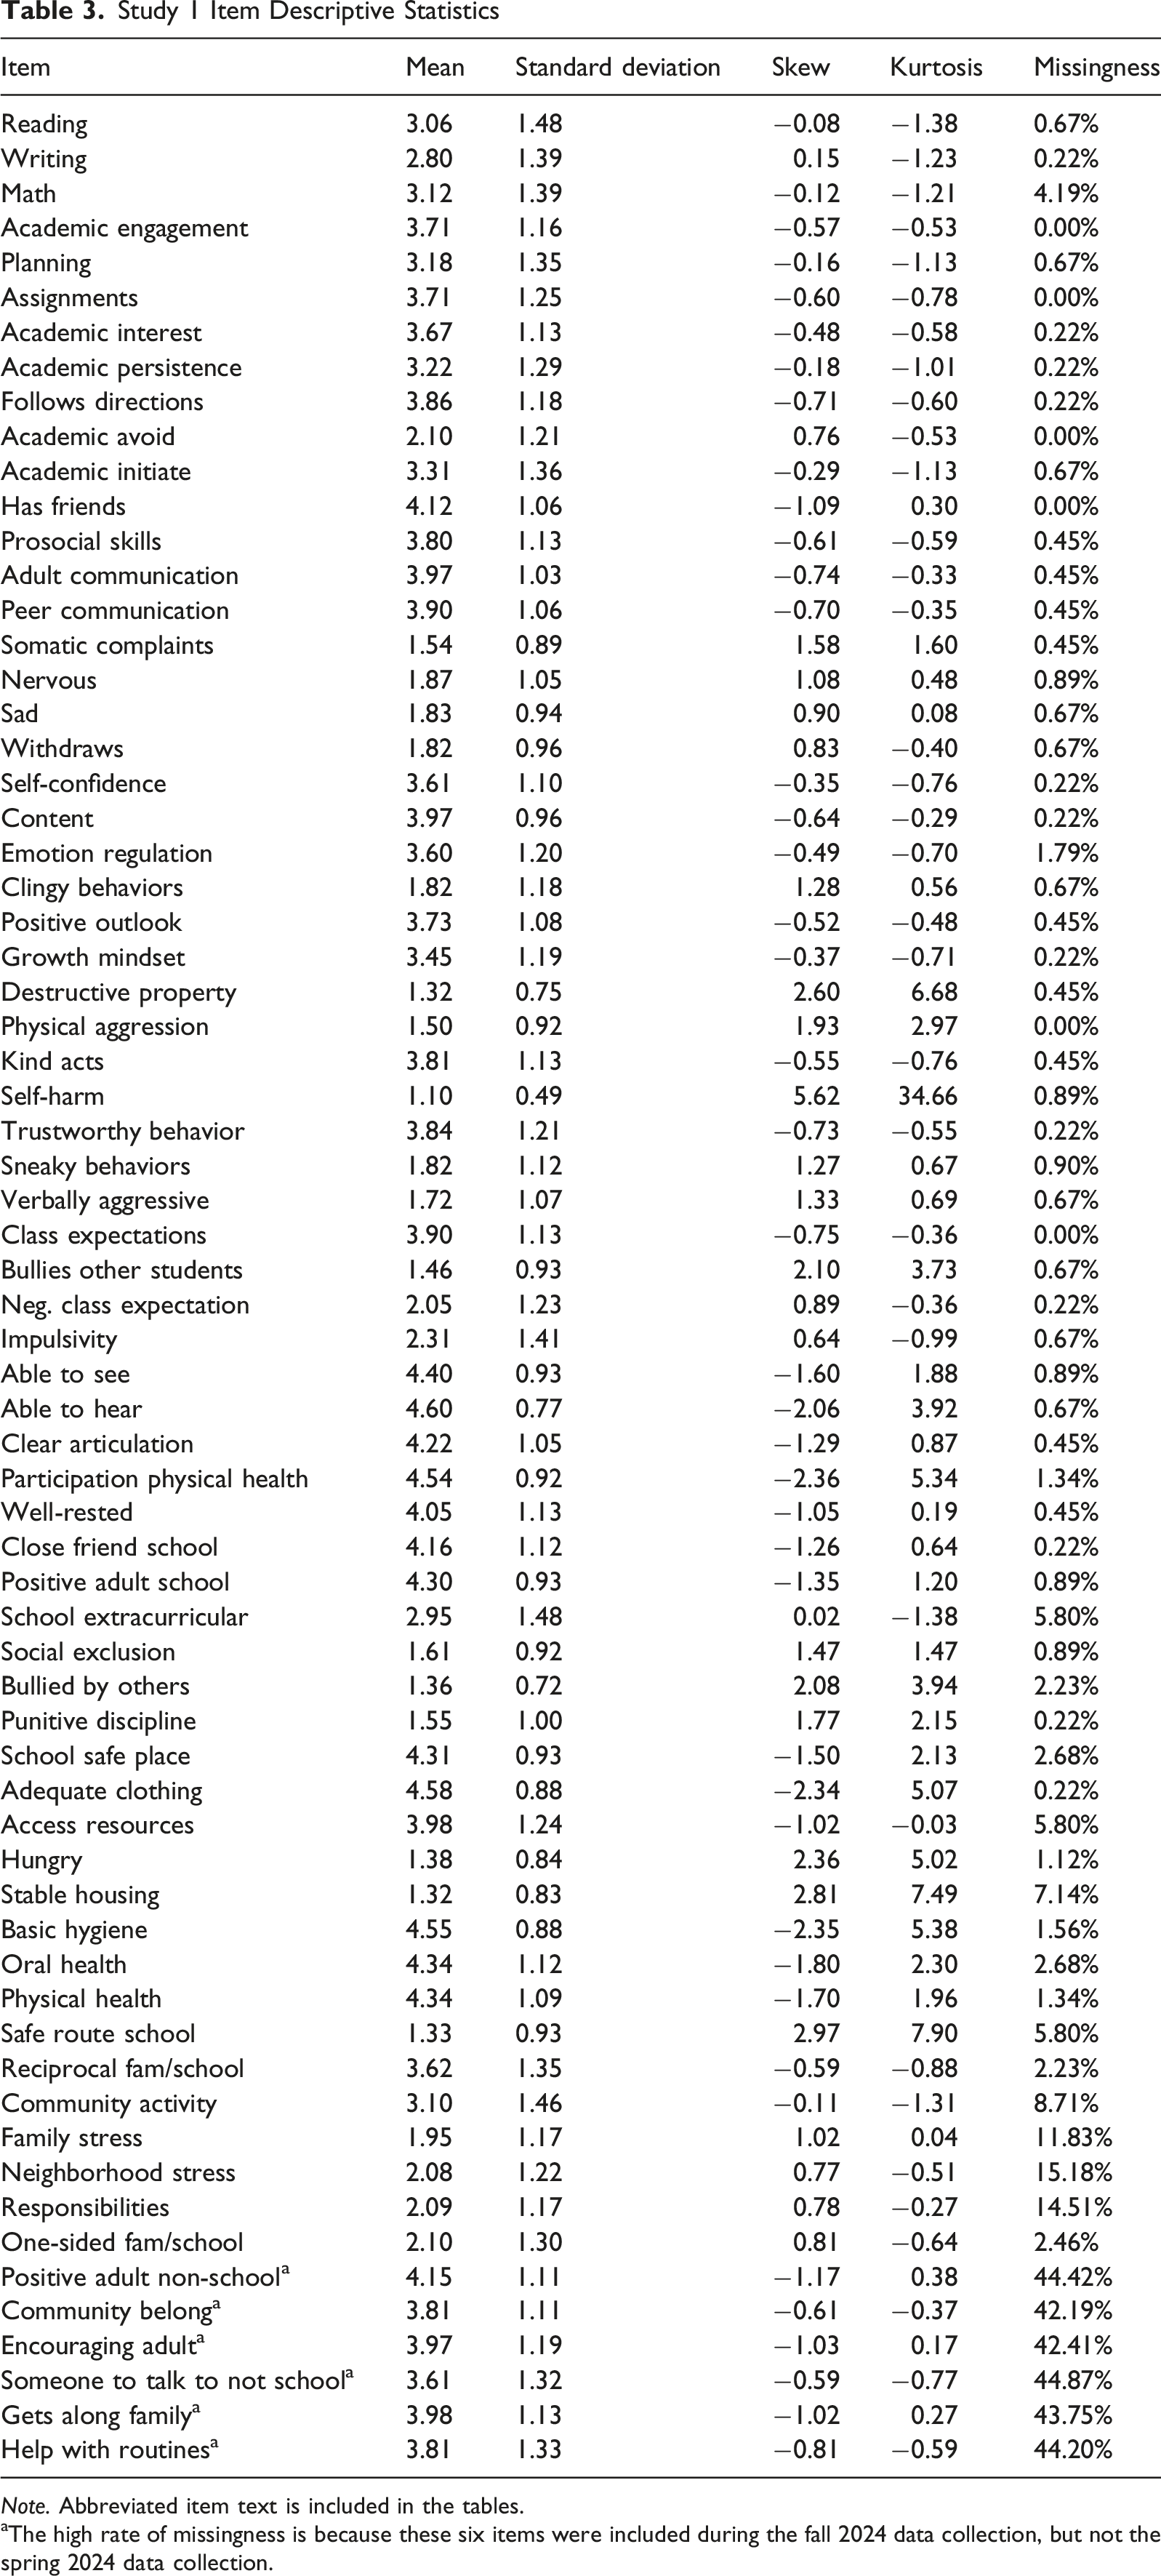
Note. Abbreviated item text is included in the tables.
aThe high rate of missingness is because these six items were included during the fall 2024 data collection, but not the spring 2024 data collection.
There were 97 missing data patterns present in the data. Missingness for most items ranged from 0 to 15%, but six items had 42–45% missingness because those items were added to the screener after data collection had begun in response to feedback from our advisory boards (see Table 3).
Exploratory Factor Analysis
Assumptions were examined to determine if the correlation matrix was appropriate for factor analysis. Bartlett’s test of sphericity was significant (χ2(2415) = 22788.13, p < .001), indicating that the correlation matrix of our variables significantly differed from the identity matrix and was acceptable for factor extraction. The Kaiser-Meyer-Olkin (KMO) test found that the measure of sampling adequacy (MSA) of the data was “marvelous” (MSA = 0.94) indicating that the data had significant relationships between items that could be extracted as distinct factors. As for the individual variables, all but one had acceptable MSA values; that is, nearly all items had relationships with other items and may be influenced by common factors. One item (responsibilities) had an MSA of 0.45, which is in the “unacceptable” range. This indicates that this item may not share common factors with the rest of the variables and should be considered for deletion. Overall, the data set was well-suited for exploratory factor analysis.
Parallel Analysis
Parallel analysis of the items supported the extraction of 8 factors. The significant eigenvalues were 22.75, 4.64, 2.44, 2.07, 1.73, 1.05, 0.84, and 0.67. Six eigenvalues were greater than 1.0.
Maximum Likelihood Estimation
Study 1 EFA Model Fit
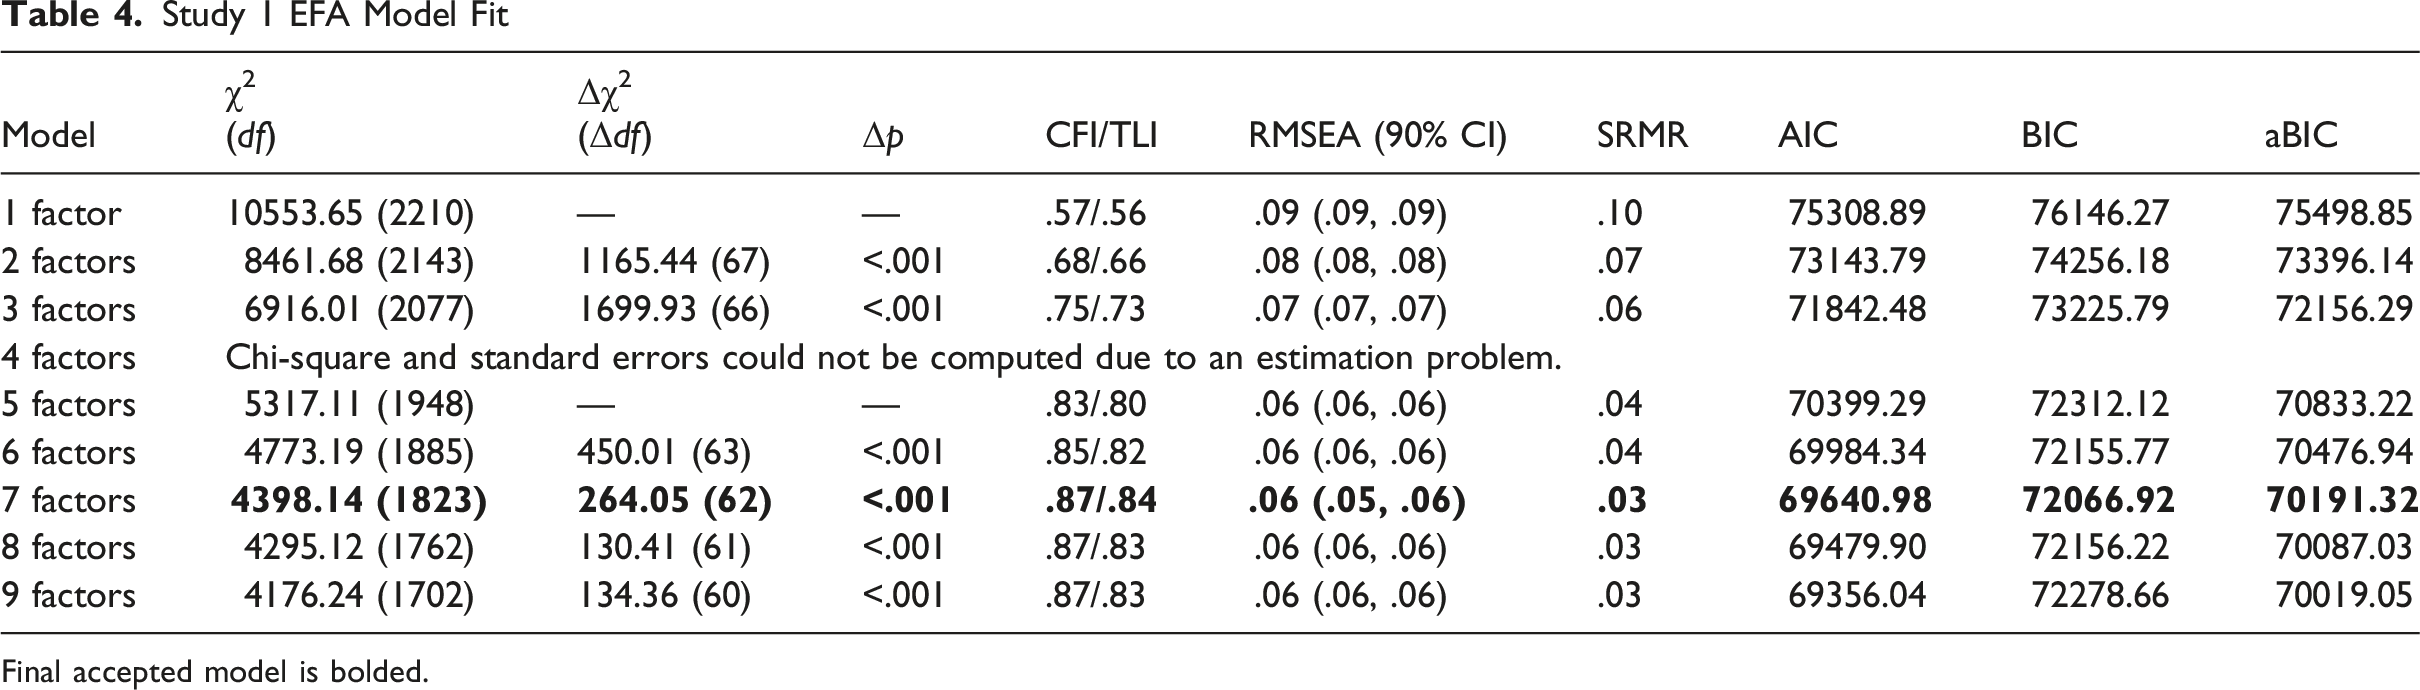
Final accepted model is bolded.
The geomin rotated factor loadings were examined to explore the adequacy of each factor. The 9-factor solution was deemed inadequate because only two items (i.e., the two extracurricular items) loaded on the last factor. The 8-factor solution was also deemed inadequate because the five items that loaded on the eighth factor were not theoretically meaningful. Next the 7-factor solution was examined. One factor included the three academic skills items, which was believed to be an artifact of the strong similarity of the item wording or rater effects such as the halo effect. This same minor academic skills factor was also present in the 6-factor solution. Furthermore, an examination of the factor loadings in the 6-factor solution found two other factors that were less theoretically meaningful than in the 7-factor solution. Similarly, the 5-, 4-, 3-, and 2-factor solutions were less theoretically meaningful than the 7-factor solution. Thus, the 7-factor solution was accepted as the most adequate internal structure representation of the ESSY Whole Child Screener and the 7-factor solution results are interpreted further.
Study 1 EFA 7-Factor Solution: Standardized Factor Loadings
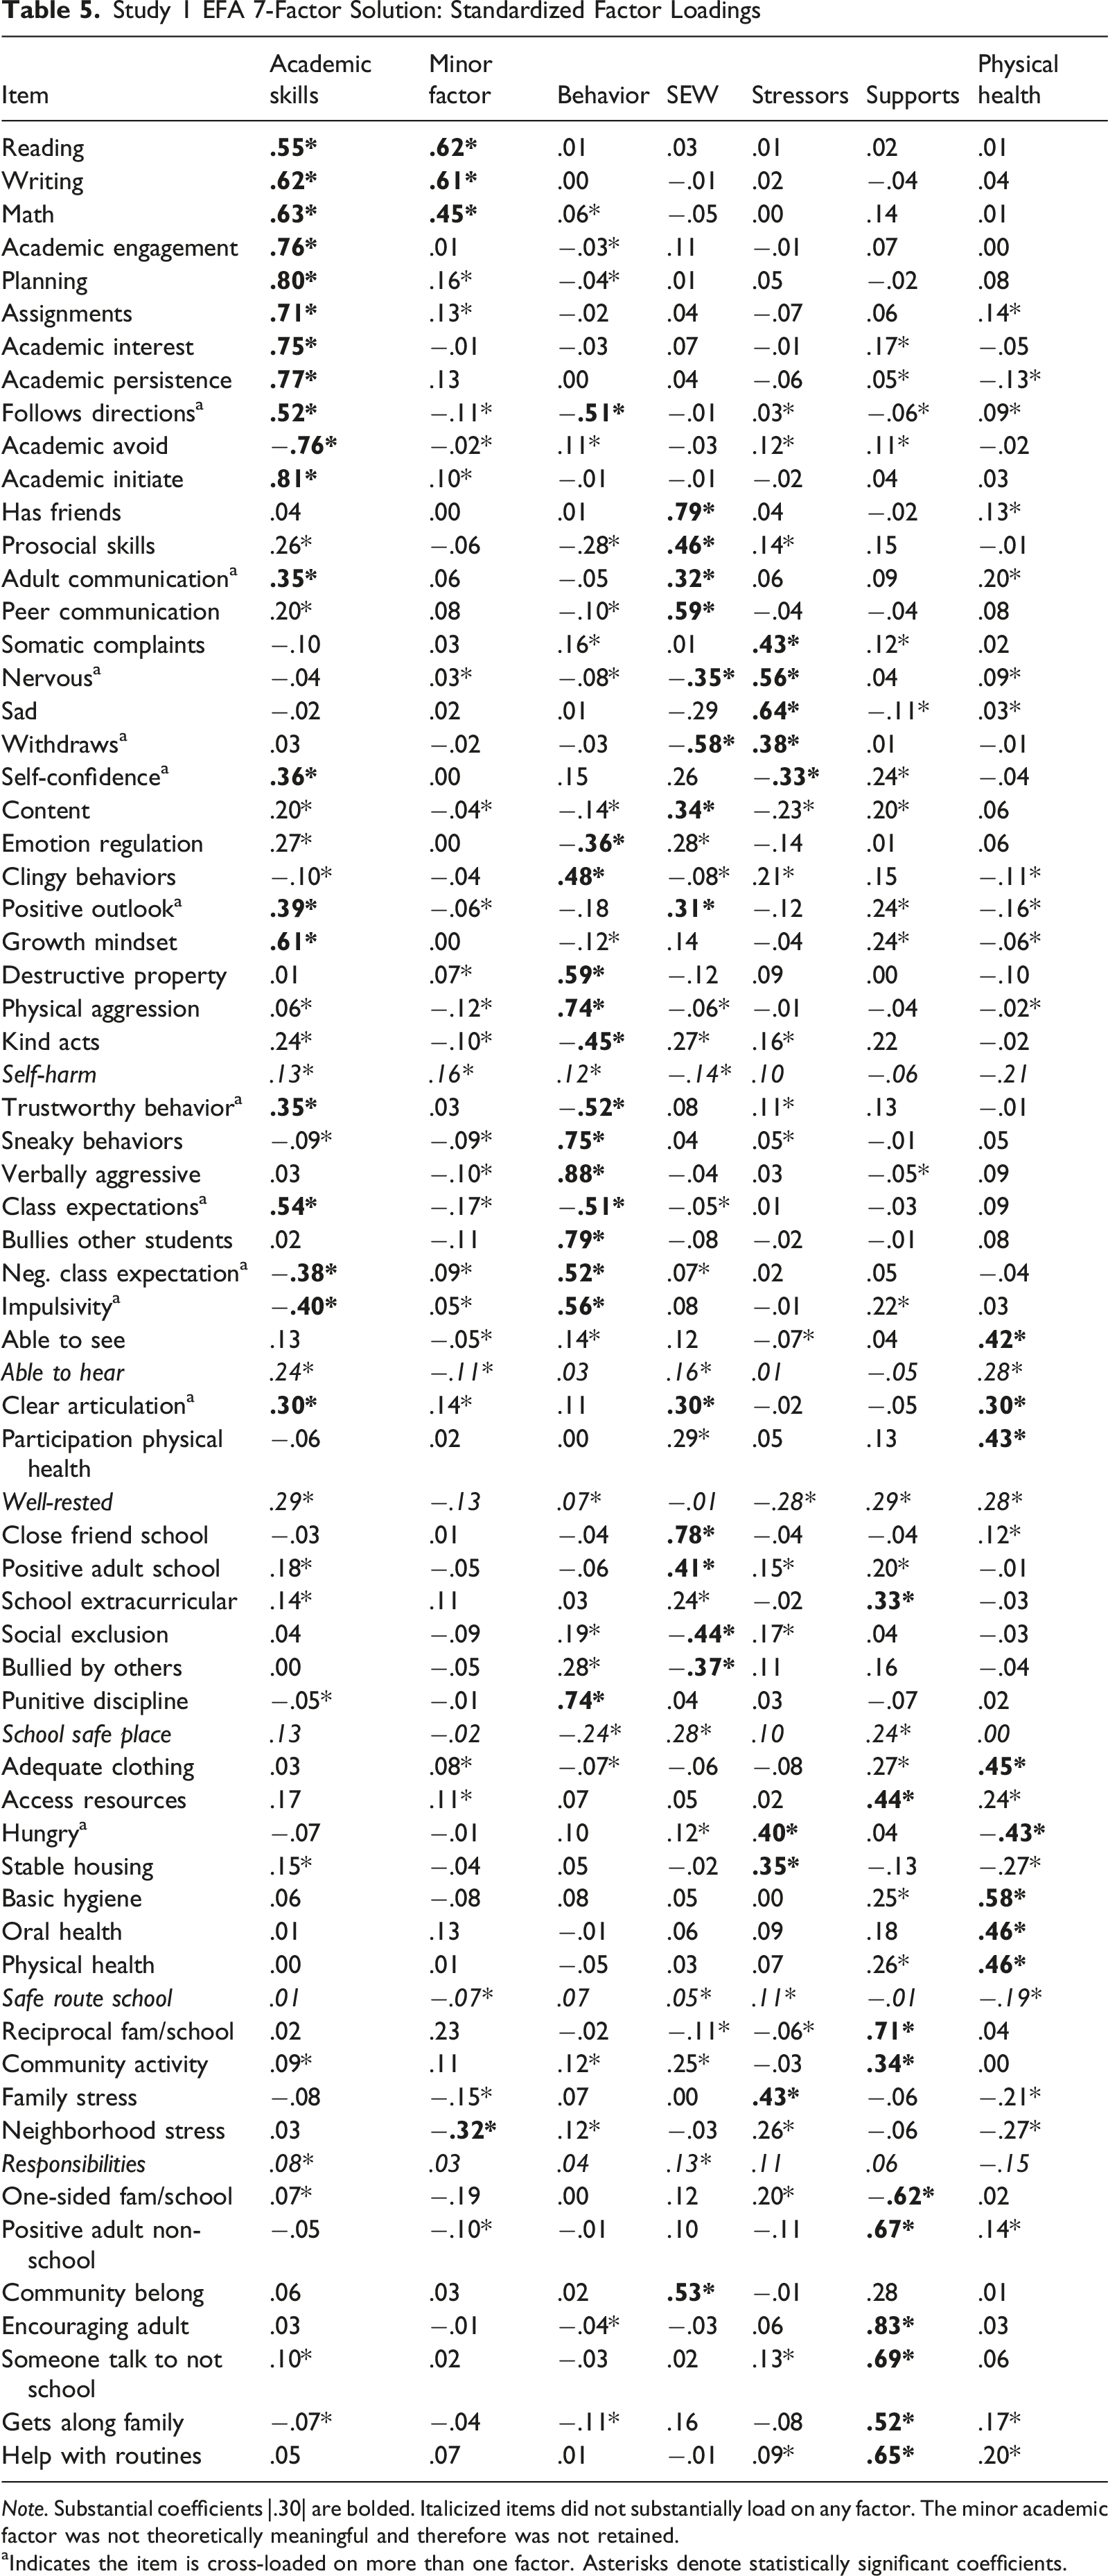
Note. Substantial coefficients |.30| are bolded. Italicized items did not substantially load on any factor. The minor academic factor was not theoretically meaningful and therefore was not retained.
aIndicates the item is cross-loaded on more than one factor. Asterisks denote statistically significant coefficients.
Factor Intercorrelations
Most of the factors significantly related with one another. Academic Skills statistically significantly correlated (p < .05) with Social and Emotional Well-Being (r = .53; large effect), Behavior (r = −.42; medium effect), Supports (r = .40; medium effect), and Physical Health (r = .32; medium effect). Unexpectedly, Academic Skills and Stressors were not significantly correlated (r = −.19). Behavior significantly correlated with most other factors, primarily in a negative direction: Social and Emotional Well-Being (r = −.34; medium effect), Supports (r = −.18; small effect), and Stressors (r = .17; small effect). Behavior and Physical Health were not significantly correlated (r = −.16). Social and Emotional Well-Being also significantly correlated with Supports (r = .39; medium effect) and did not significantly correlate with Physical Health (r = .33) or Stressors (r = −.18) Lastly, Supports and Physical Health significantly correlated (r = .33; medium). Stressors only correlated with Behavior (r = .17; small effect).
Item Cross-Loadings and Poorly Performing Items
Out of the 68 items, 12 items had substantial cross-loadings on more than one factor (≥0.30, see Table 5). We hypothesized that the inclusion of cross-loadings might be important for the ESSY Whole Child Screener due to the moderate to strong relations between most of the domains and the expected overlap between the constructs. As shown in Table 5, most of the cross-loaded items are central to constructs in the screener (e.g., nervous, withdraws, follows directions) and the elimination of those items could result in construct underrepresentation. In addition, feedback from our two advisory boards supported the inclusion of these cross-loaded items. Therefore, cross-loaded items were retained for further analysis in the CFA in Study 2.
Six items did not substantially load on any item (see italicized items in Table 5). Two of those items were removed from the screener and were not tested in Study 2 (i.e., school safe place and responsibilities). An EFA without these two items was re-run and results were nearly identical (some coefficients differed slightly in the hundredths place). Although the other four items (self-harm, able to hear, well-rested, safe route school) did not substantially load on any particular factor, they were deemed important to the constructs measured in the screener and were retained for further analyses in Study 2.
Internal Consistency Reliability
Although the ESSY Whole Child Screener ratings are intended to be interpreted holistically, and domain-level composite scores are not be computed, composites were created for the sole purpose of this study to estimate internal consistency reliability. Internal consistency estimates were good for most factors and were nearly identical with and without cross-loaded items: Academic Skills (α and ω = .96), Behavior (α and ω = .94−.95), Social and Emotional Well-Being (α and ω = .92−.95), and Supports (α and ω = .91−.92). Physical Health and Stressors had relatively lower, but adequate, internal consistency (Physical Health α and ω = .76−.78 and Stressors α and ω = .74−.81).
Qualitative Findings
Forty-seven participants provided qualitative responses to at least one of the open-ended questions. Overall, Study 1 participants expressed that the measure was easy to navigate and would identify students in need of additional supports. Participants identified several potential positive consequences of using the measure. Specifically, they stated it could help to identify the root cause of student academic or behavioral concerns; connect students with necessary supports across areas of functioning that affect academic success; and increase educator reflection on various factors influencing student learning and behavior. For example, one participant stated, “I believe this measure is a great way for teachers to be reflective of their students and their needs both inside and outside of school.” Another shared that it would generate positive consequences by “identifying necessary supports for students early in their educational journey, and more accurately identifying areas of need through comprehensive screening (e.g. noting that attendance, sleep, etc. might be the problem rather than a learning disability).”
Participants also raised concerns about some potential negative unintended consequences of using the measure. These included inadequate or inaccurate information provided by the teacher, and potential negative effects of teacher bias. Participants also raised concerns about overidentification (e.g., false positives and resulting negative consequences of labeling a student or unnecessary intervention) or misidentification of students (e.g., English language learners being specified as having academic difficulties). Participants also expressed concern about the potential for the measure to damage relationships with families or to cause teachers to lower their expectations. One participant explained, “I worry that learning more about a student’s external factors will negatively impact the high standards they are held to. If a student is going through stressors outside of school, they need extra compassion, but not pity.” Finally, participants raised concern about the amount of time needed to complete the screener for a full class of students.
Study 2
The purpose of Study 2 was to cross-validate the factor structure of the ESSY Whole Child Screener with a distinct sample. Again, we were also interested in this large sample’s perspectives on the usability and potential consequences of the measure’s use. Specifically, we sought to answer the following research questions: (1) How does the accepted factor solution from the exploratory factor analyses perform in a second sample? (2) What are the characteristics of the final CFA factor structure of the ESSY Whole Child Screener (i.e., factor loadings, correlations between factors, internal consistency)? (3) How does a second sample of teachers perceive the usability of the ESSY Whole Child Screener, and what positive and negative consequences of its use are identified?
Method
Recruitment and Participants
To achieve a broader national sample, 333 3rd, 4th, and 5th grade general or special education teachers were recruited through a Qualtrics research panel. Data were collected in late December 2024 and teachers reflected on approximately four or more months of instructional time, likely inclusive of breaks, with their students. Data collection began with a soft launch to ensure the measures functioned as intended with a small number of participants. Throughout data collection Qualtrics monitored the quality of participants’ responses. After identifying low quality responses (e.g., straight lining, unusually fast response times, responses with duplicate IP addresses, irrelevant written responses to open-ended questions), the final sample included 317 3rd–5th grade general or special education teachers. Each teacher rated one student in their classroom, resulting in 317 student ratings. Teacher and student characteristics are presented in Tables 1 and 2, respectively.
Measures
The ESSY Whole Child Screener
Study 1 findings resulted in small revisions to the ESSY Whole Child Screener. First, two items were deleted due to low EFA factor loadings. Second, five new items were tested in Study 2, most of which were revised versions of Study 1 items (i.e., not enough sleep, positively valenced safe route school, understands directions, extracurriculars (a combination of outside and inside school activities), misses activities). These changes resulted in a 71-item measure.
Demographic Form
Teacher participants were asked to provide information about their years of teaching experience, role, educational background, and other demographic details. Since participants in Study 2 were recruited from across the U.S., an additional question about the state in which they taught was included to determine their geographical region.
Open-Ended Survey Questions
To reduce survey burden, the eight open-ended survey questions used in Study 1 were streamlined into five researcher-created questions asking participants for their perspectives on the usability of the measure, potential positive and negative consequences of its implementation, and suggestions for improving the survey format.
Procedure
All study procedures were approved by the University of Connecticut Institutional Review Board. Similar to Study 1, participants recruited through the Qualtrics research panel were required to meet the same three eligibility criteria (i.e., 18+ years old, 3rd, 4th, or 5th grade general or special education teacher, and able to complete the ESSY in English). Teachers who met eligibility criteria also viewed a similar 3-minute instructional video; however, Study 2 participants were instructed to rate only a single student in their classroom (i.e., either the first or last student on their alphabetical class lists). Also, as in Study 1, the order of items was randomized. Student demographic information was collected last. Finally, participants were asked five optional open-ended questions to gather their perspectives on the perceived usability of the measure and potential positive and negative consequences of its implementation. Participants were compensated for their participation by Qualtrics.
Data Analysis
Quantitative Analysis
Data were prepared for analysis in R. Mplus version 8.11 (Muthén & Muthén, 2017) was used to test the confirmatory factor analysis (CFA) models. Similar to Study 1, the maximum likelihood with robust standard errors estimator (MLR) was used and full-information maximum likelihood estimation (FIML) was used to handle missing data (Enders, 2022; Schafer & Graham, 2002).
The initial model included 65 items and the six factors identified in Study 1 were examined (i.e., Academic Skills = 21 items (a cross-loading for well-rested was added based on theory); Social and Emotional Well-Being = 14 items; Behavior = 14 items; Stressors = 10 items (a loading to safe route to school was tested despite poor functioning in the EFA), Supports = 9 items (only one extracurricular item was tested at a time), Physical Health = 11 items (a loading to hearing was tested despite poor functioning in the EFA and the two new physical items [not enough sleep and misses activities] were tested). The minor academic factor extracted in the EFA, which included the three grade-level academic skills items (reading, writing, and math), was not modeled as a separate factor in the CFA models. Instead, three correlated residuals of those three items were included to account for the variance these items shared in common beyond their relation with the latent Academic Skills factor. The neighborhood stress item, which only loaded on the minor academic factor in the EFA, was loaded on Stressors in the CFA for theoretical reasons. The self-harm item was excluded from the CFA models because it did not substantially load on any factor in the EFA. The 12 cross-loadings supported by the EFA were included in these models (see Table 5).
Because some items performed poorly in Study 1, both the original and revised versions of the five items were tested separately in multiple CFAs to inform item retention and deletion (e.g., new not enough sleep item versus original well-rested item). Thus, the CFA models involved exploratory components and items were removed in steps. Furthermore, if model fit was deemed inadequate, the modification indices were examined to determine whether additional cross-loadings or correlated residuals were warranted.
Models were compared via the AIC, BIC, and aBIC. Smaller AIC, BIC, and aBIC indicate better fitting models (Keith et al., 2026). Nested models were also compared via the likelihood ratio test (Δχ2). Individual models were evaluated according to multiple measures of fit, including root mean square of error of approximation (RMSEA <0.06), standardized root mean residual (SRMR <.08), comparative fit index (CFI >.95) and Tucker-Lewis index (TLI >.95; Hu & Bentler, 1999). Internal consistency (i.e., coefficient alpha and omega) was estimated for the final accepted model.
Qualitative Analysis
Responses to the open-ended questions about perceived usability and potential positive and negative consequences were analyzed using directed content analysis (Hsieh & Shannon, 2005). Responses were read and grouped together related to perceived usability (effectiveness, efficiency, satisfaction; International Organization for Standardization, 2018), potential positive consequences of the measure’s use, and potential negative consequences.
Results
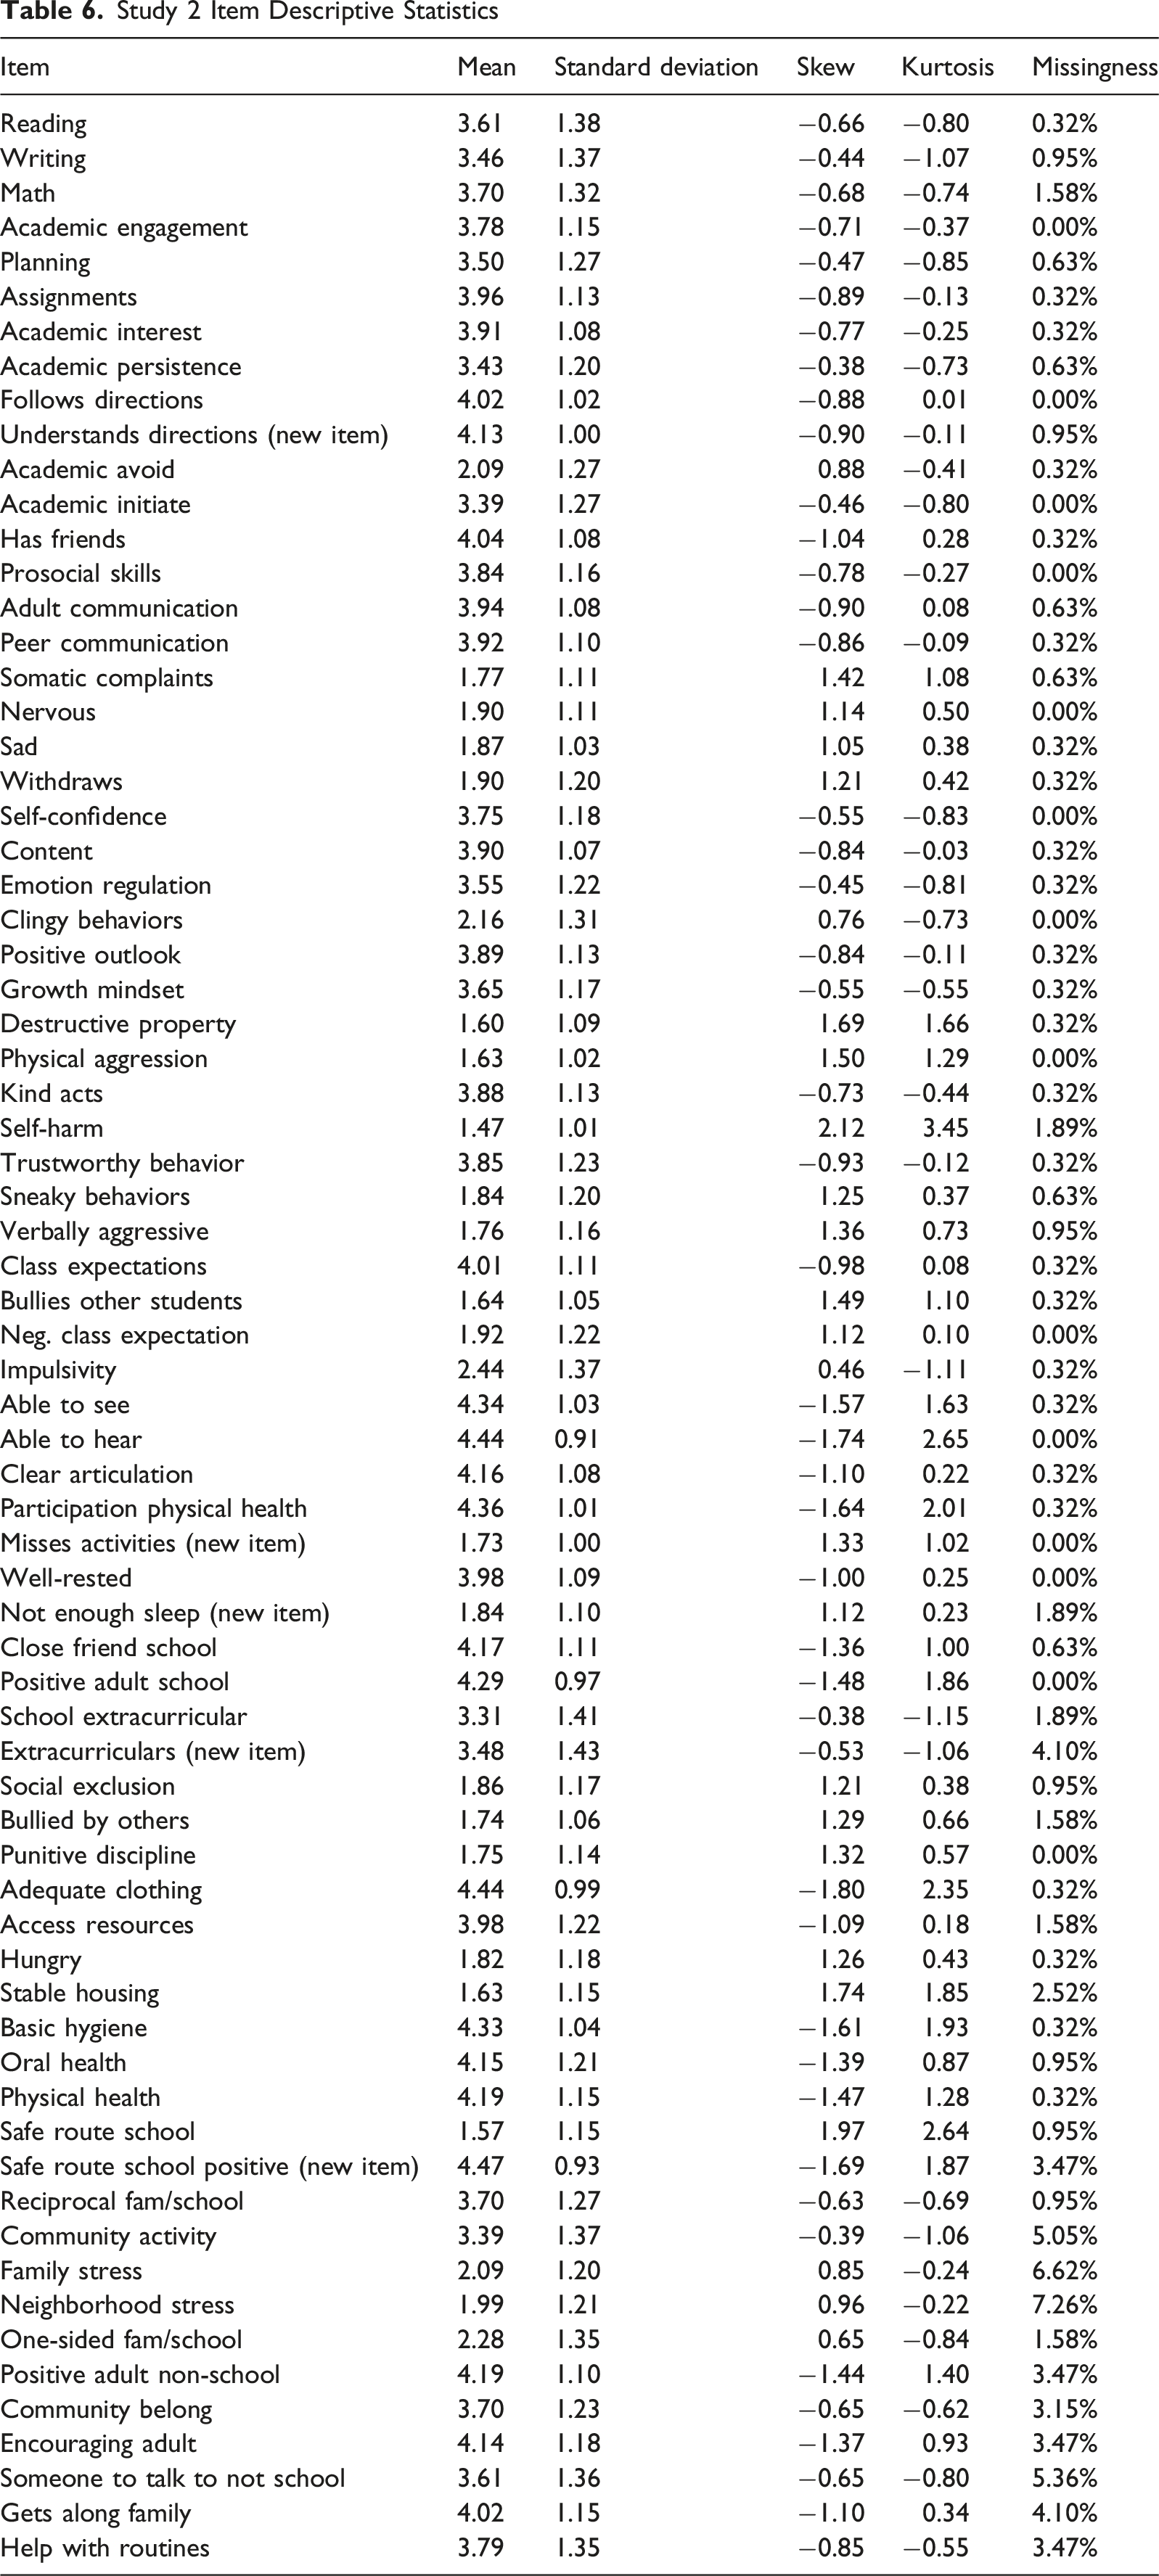
Descriptives
Study 2 Item Descriptive Statistics
Confirmatory Factor Analysis
Study 2 CFA Model Fit
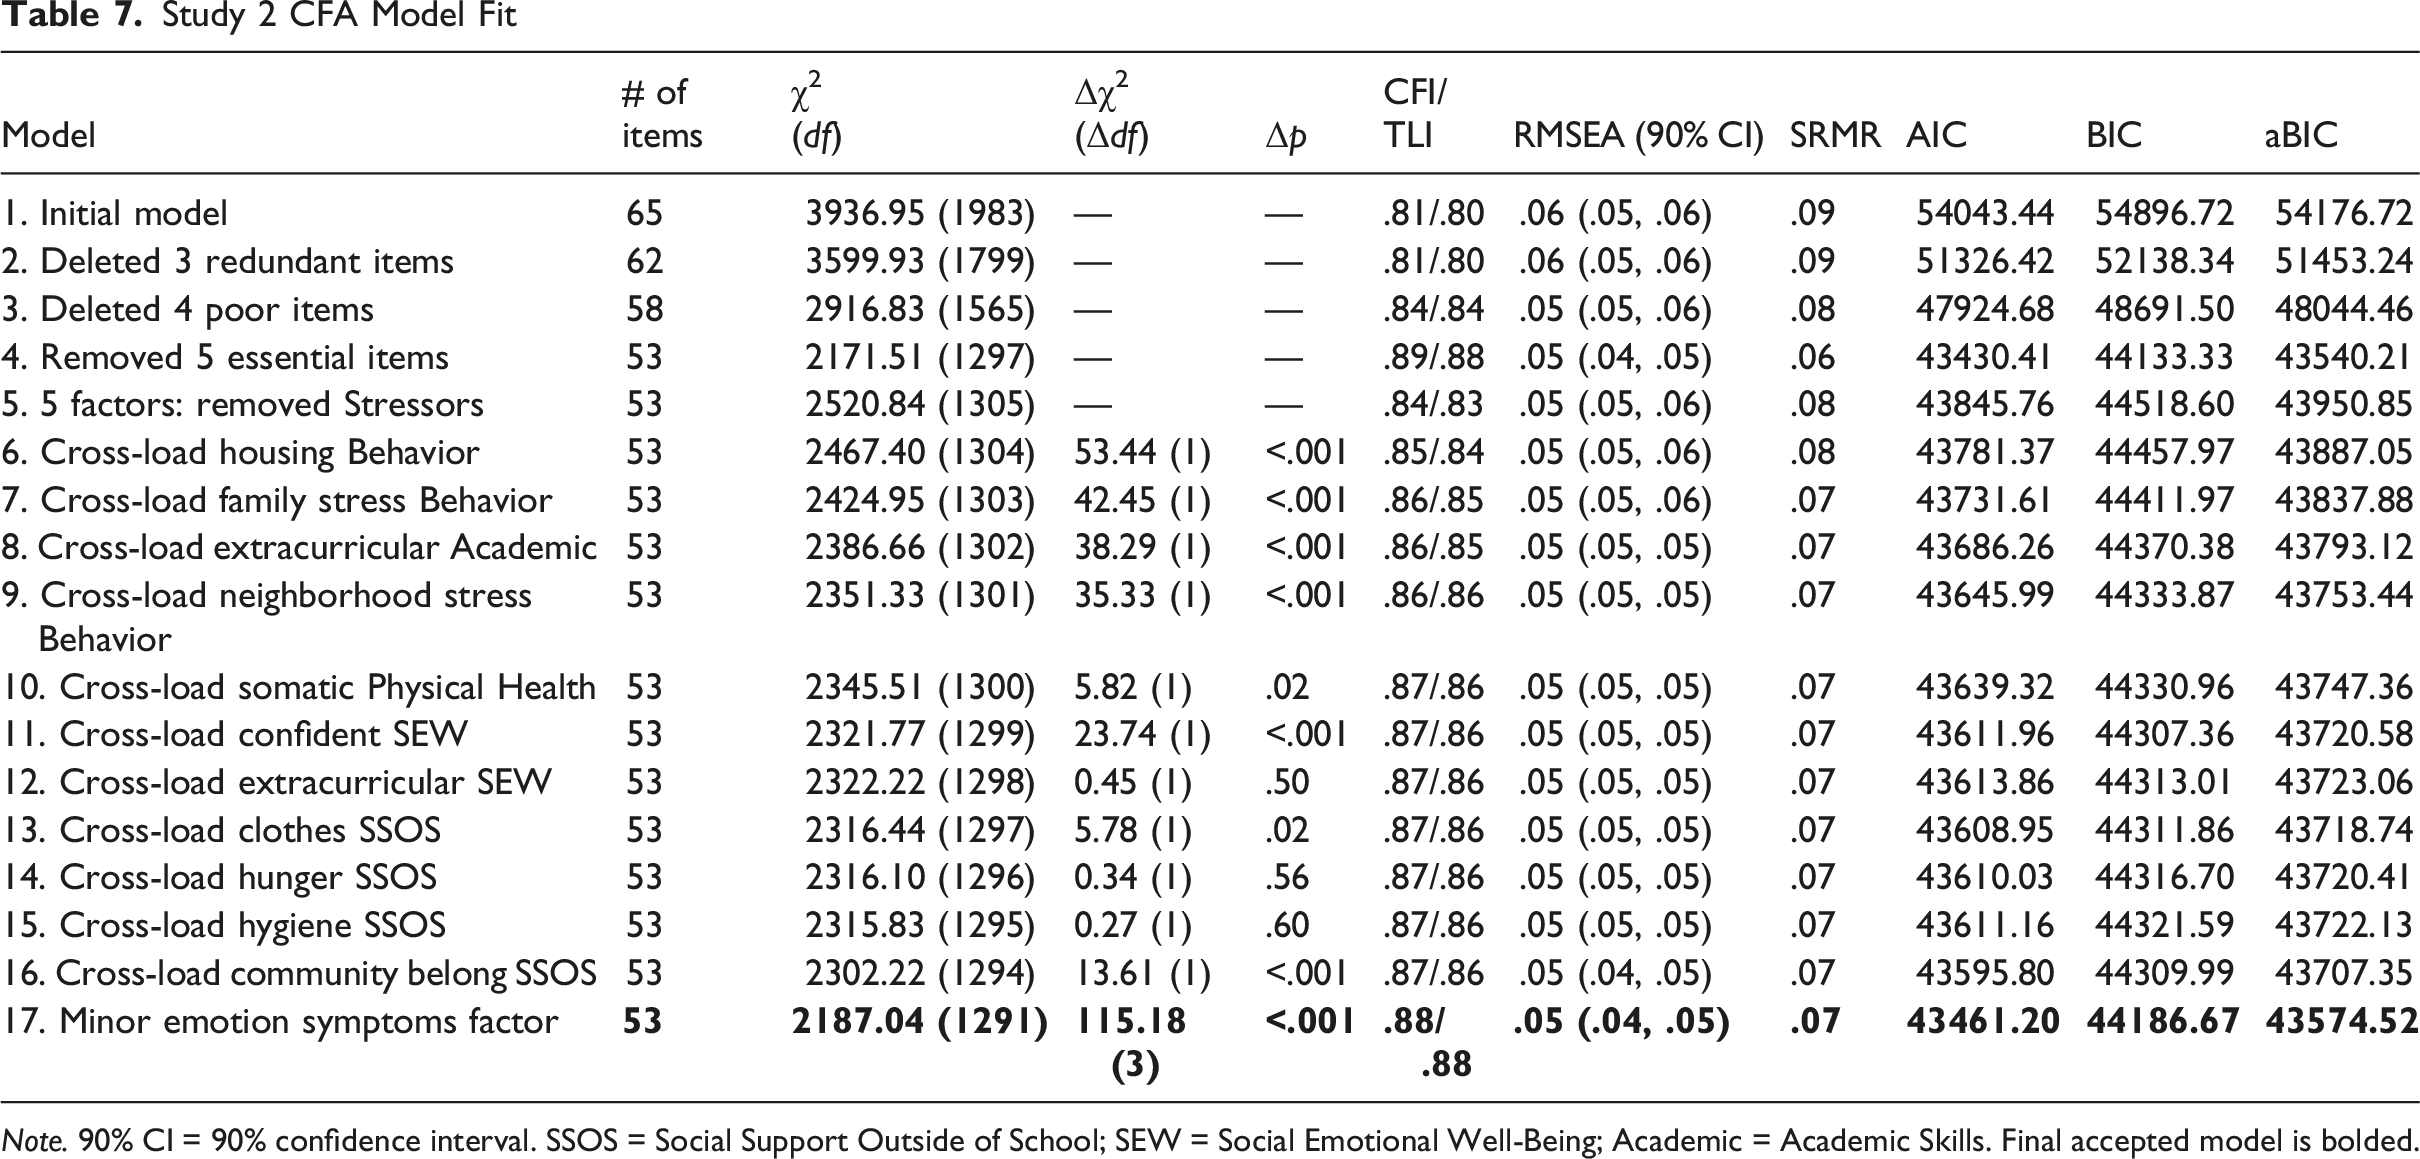
Note. 90% CI = 90% confidence interval. SSOS = Social Support Outside of School; SEW = Social Emotional Well-Being; Academic = Academic Skills. Final accepted model is bolded.
Item and Factor Deletion
Next, models were run to compare three pairs of redundant items (i.e., class expectations vs. neg class expectations, trustworthy vs. sneaky behavior, reciprocal vs. one-sided fam/school) and determine which item to retain from the pair. Results supported the inclusion of the positively valenced and strengths-based versions of the classroom expectations and family school communication items and the negatively valenced sneaky behavior item. The removal of the three duplicate items was supported by smaller AIC, BIC, and aBIC values (see Table 7 model 2).
Modification indices identified four potentially problematic items. Specifically, multiple cross-loadings were suggested for items that were either not supported by theory or the EFA results (i.e., kind acts, academic avoid, misses activities, safe route school). The removal of these four items resulted in an improvement in model fit and was supported by smaller AIC, BIC, and aBIC values (see Table 7 model 3).
The modification indices suggested five additional items loaded on multiple factors (i.e., bullied by others, social exclusion, emotion regulation, withdraws [this item had cross-loadings in the EFA], well-rested [all loadings for this item were below |.30| in the EFA]). The removal of these five items resulted in an improvement in model fit and was supported by smaller AIC, BIC, and aBIC values (see Table 7 model 4). The research team deemed these five items were essential, along with the self-harm item that did not load significantly on any factor in the EFA. These six items were removed from Gate 2 but will be rated by teachers with any concerns at Gate 1. Thus, these six items were relocated to a different gate and were not included in further CFA analyses of the Gate 2 items.
Finally, a model without the Stressors factor was tested. The theoretical rationale for the items on this factor was weak and the EFA results indicated Stressors was mostly uncorrelated with the other factors, in stark contrast to the other factors. The alternative model loaded the two emotional symptoms items (sad, somatic complaints) on the Social and Emotional Well-Being factor and the stable housing, family stress, and neighborhood stress items on the Supports factor. The remaining three items on the Stressors factor had cross-loadings in previous models; thus, those loadings were maintained (hungry on Physical Health, nervous on Social and Emotional Well-Being, and confident on Academic Skills). In comparison to model 4, model fit degraded, but in comparison to models 1–3 model fit improved (see Table 7 model 5). Furthermore, the factor loadings of the two items that were moved to the Social and Emotional Well-Being factor and the three items moved to the Supports factor were substantially sized (|<.30|) and statistically significant. Thus, this change to a five-factor structure was retained. Given the revised composition of the Supports factor, it was renamed to Supports Outside of School to better reflect the item content.
Additional Model Modifications
Cross-loadings are aligned theoretically with the expected overlap of the domains in the screener and the multiple-gated approach. Because no domain-level composite or cut-scores are computed or applied in the real-world application of the ESSY Whole Child Screener, cross-loadings are feasible. Modification indices were reviewed to determine if additional cross-loadings would improve model fit. The largest modification indexes (M.I.) were selected, and cross-loadings were tested one at a time (see models 6–9 in Table 7, M.I. ranged from 35.33 to 53.44). All of these cross-loadings were statistically significant and supported by model fit comparisons (see Table 7).
Next, cross-loadings that were theoretically supported were tested even if the associated modification index was not the largest value (see models 10–16 in Table 7, M.I. ranged from <4 to 23.74). Most of these additional cross-loadings were statistically significant and were supported by model fit comparisons, except for extracurriculars on Social and Emotional Well-Being (β = −.04, p = .80) and hunger and basic hygiene (β = .08, p = .57 and .43, respectively) on Supports Outside of School, but these cross-loadings were retained due to their theoretical support.
The model fit indices for model 16 ranged from poor to excellent (see Table 7). Although the modification indices did not support any other cross-loadings that were theoretically meaningful, the largest modification indices suggested correlated residuals between the three emotional symptoms items (nervous, somatic complaints, and sad, M.I. = 22.75, 37.39, 62.55). A minor emotional symptoms factor was supported by theory and model comparisons (see Table 7 model 17).
Final Factor Structure Results
Despite CFI/TLI values that were below the acceptable cut-off (.88), SRMR and RMSEA were adequate to excellent (see Table 7). Thus, model 17 was accepted as the final factor structure of the ESSY Whole Child Screener, which is illustrated in Figure 1. The final ESSY Whole Child Screener includes five factors and 53 items (reduced from 71 items), 16 of which cross-load across multiple factors: Academic Skills (18 items), Social and Emotional Well-Being (15 items), Supports Outside of School (15 items), Behavior (13 items), and Physical Health (10 items). Eight cross-loadings were not statistically significant: four on Supports Outside of School (extracurricular activities, neighborhood stress, hungry, basic hygiene), three on Social and Emotional Well-Being (clear articulation, somatic complaints, extracurriculars), and one on Behavior (understands directions). These cross-loadings were retained because they were theoretically supported, multiple gated procedures ensure the items will be presented only once, and factor-based domain-level composite scores are not computed in practice. All other factor loadings were statistically significant, and effect sizes mostly ranged from medium to large (see Figure 1). Notably, the magnitude of the Physical Health factor loadings was larger in model 17 than in Study 1. All five factors were significantly correlated with each other and the magnitudes ranged from medium to large (see Figure 1). The factor correlations between the Supports Outside of School factor and the other factors were larger than those found in Study 1, and unlike Study 1, Physical Health and Behavior and Physical Health and Social Emotional Well-Being significantly correlated and the magnitudes were larger (see Figure 1). ESSY whole child screener factor structure and standardized coefficients (CFA model 17)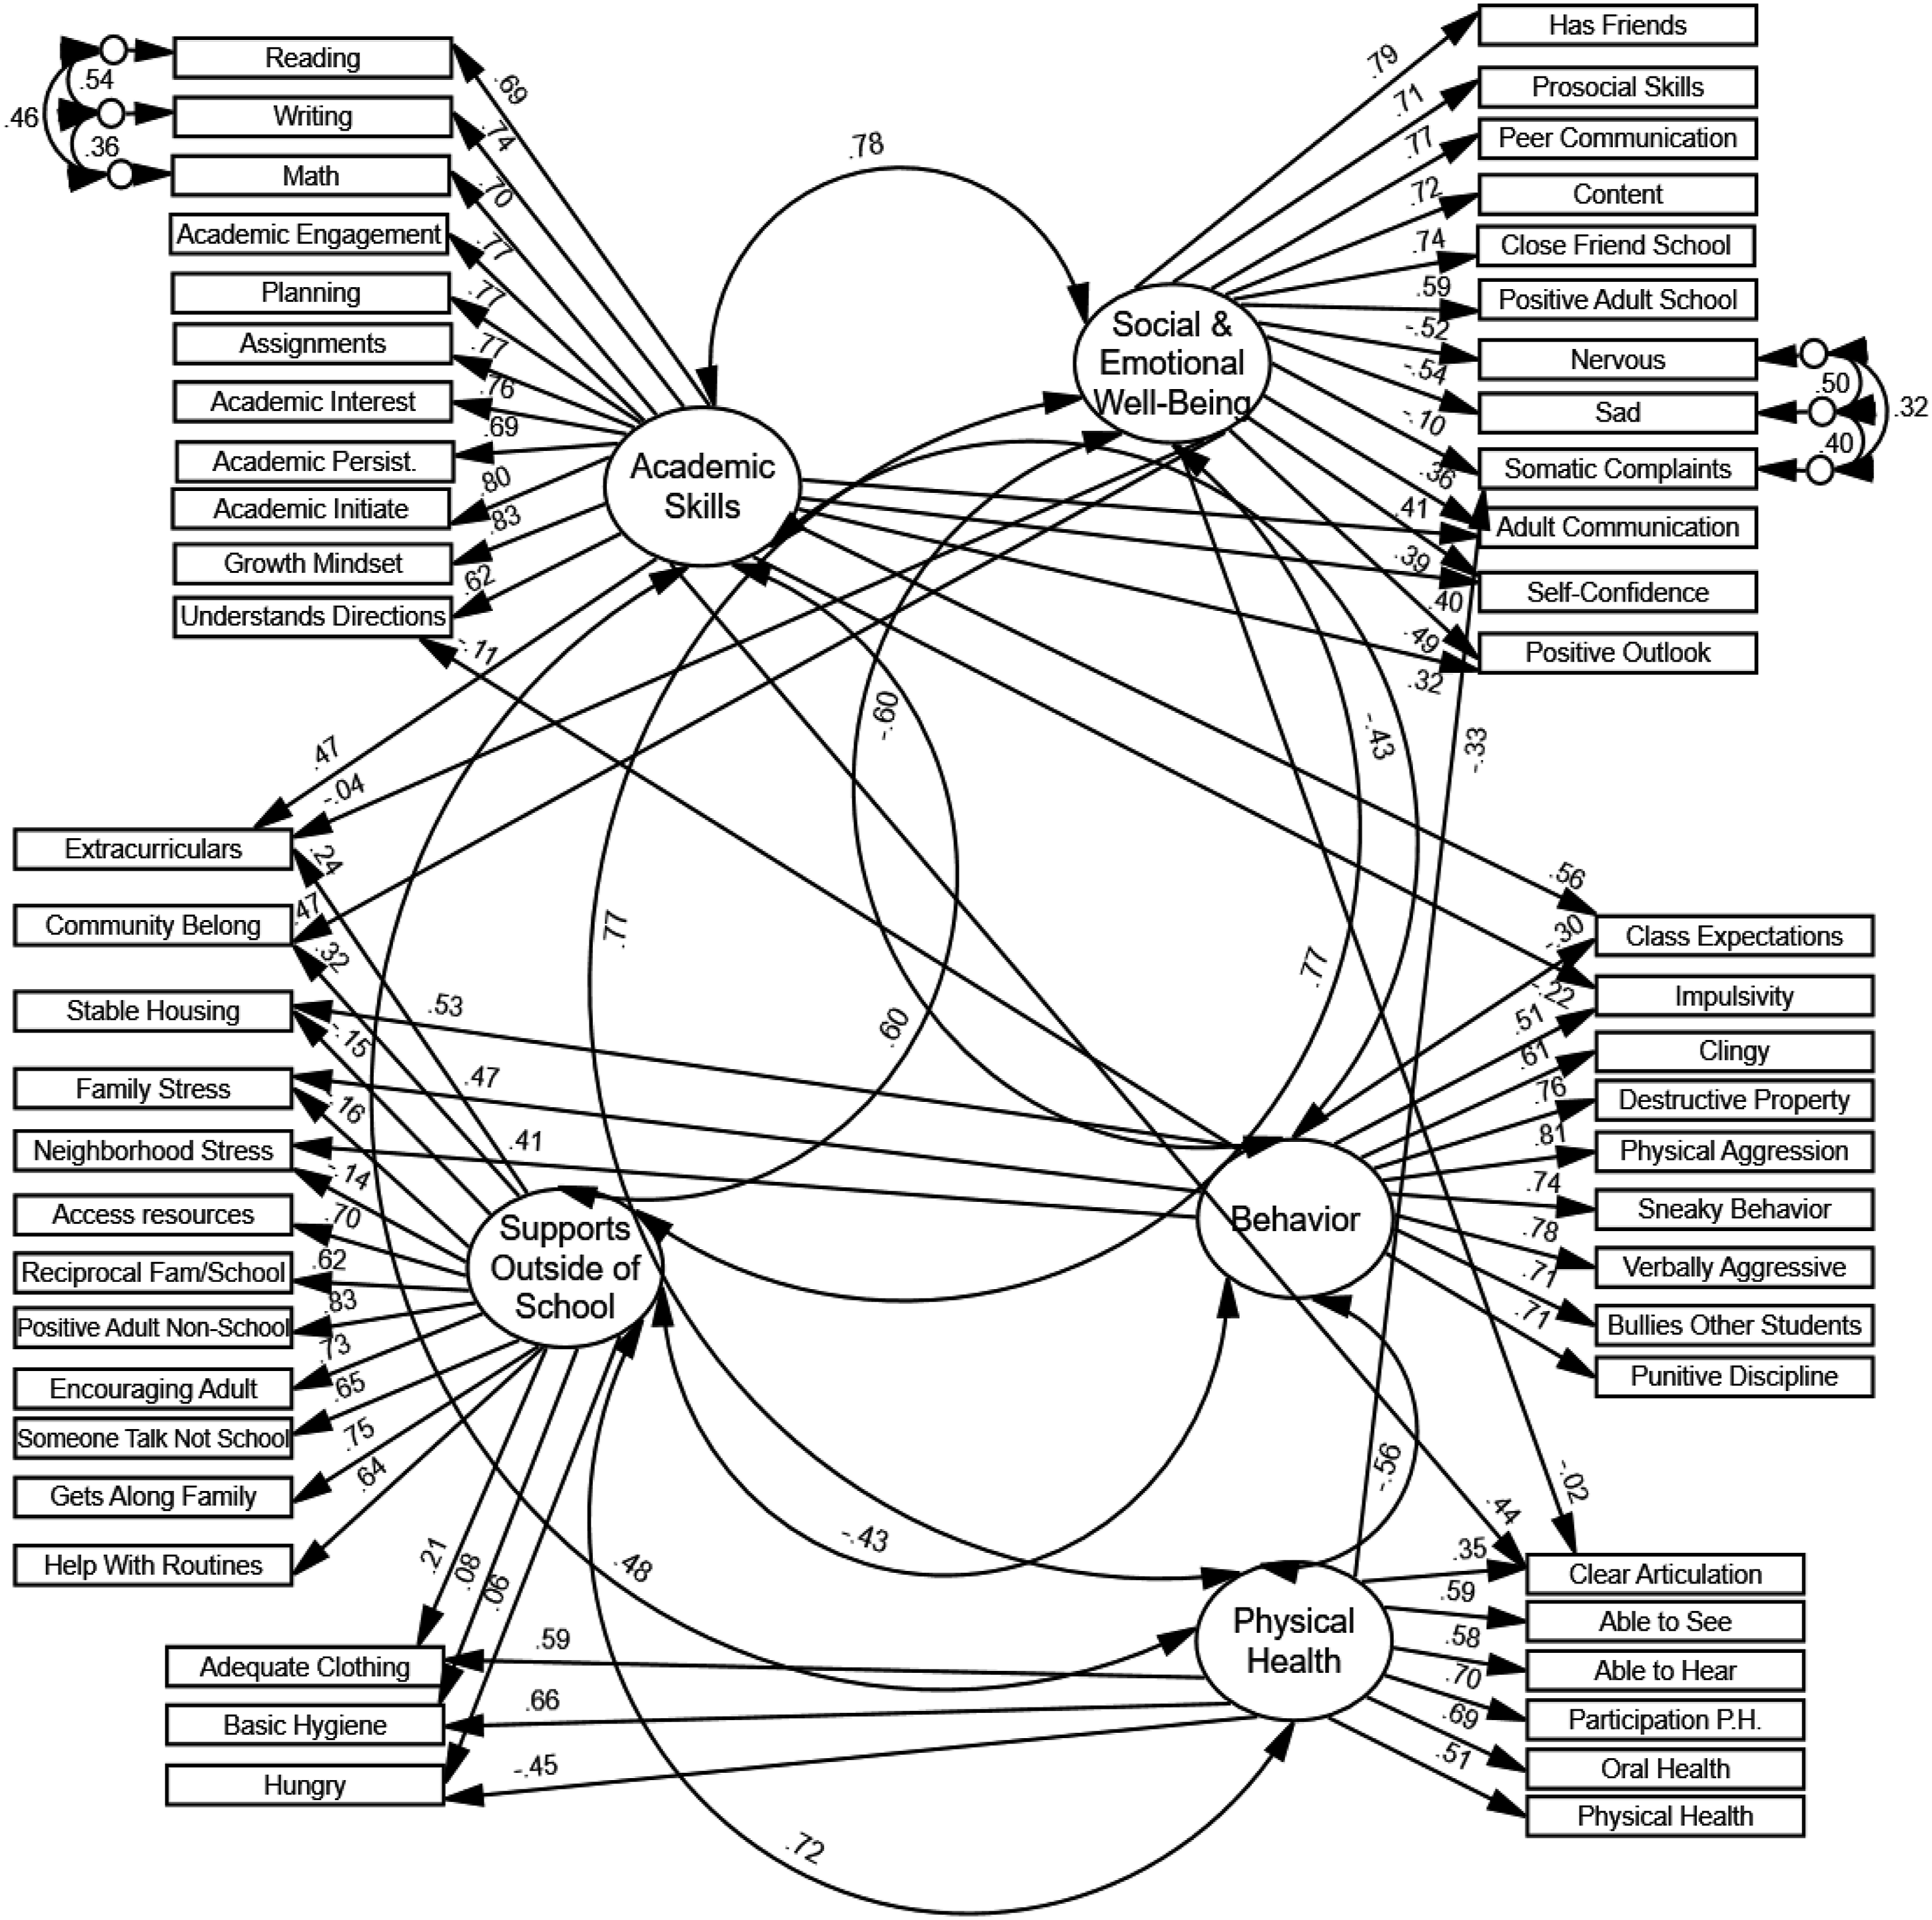
Internal reliability estimates were good for all factors: Academic Skills (α and ω = .95), Social Emotional Well-Being (α = .91, ω = .92), Behavior (α and ω = .90), Supports Outside of School (α = .89, ω = .88), and Physical Health (α and ω = .84).
Qualitative Findings
All 317 participants provided open-ended responses because Qualtrics encourages their participants to respond to all items. Study 2 participants commented that the screener included a greater focus on strengths and was more comprehensive than other school-based measures they had previously used. They also identified potential positive consequences of the measure’s use. These included identifying student strengths, a more holistic understanding of student strengths and challenges, and increased educator reflection. One participant explained, it “would allow me to understand students in many different areas.” Another shared that it can prompt “reflection on the student and drive a plan on how to address the needs of the student.”
Study 2 participants also identified some potential negative unintended consequences of the measure’s use. These included inaccuracy or bias in teacher ratings, overidentification or misidentification of students, labeling students, and intruding upon student and family privacy (i.e., too personal). One participant expressed, “the data could be inaccurate if the teacher does not have a solid connection to the family and what the student does outside of school. There are a lot of questions in this regard and teachers do not always have access to such information.” Participants also expressed concern that relevant supports might not be available to address identified concerns. For example, one participant shared it “focus[es] a lot on family and outside factors, which cannot be fixed or addressed 100% at school. It will offer insight, but not necessarily something teachers can control.” A few participants also expressed that teachers’ emotions might be negatively impacted as they considered the stressors in students’ lives. Similar to Study 1, participants also expressed concern that the screener would be time consuming to complete for a classroom of students.
Discussion
This two-part study involved tests of the psychometric properties of the newly developed ESSY Whole Child Screener along with qualitative examination of the perceived usability and potential consequences of the measure’s use. Evidence from two national samples suggests scores on the ESSY Whole Child Screener demonstrate adequate to good internal structure validity and internal consistency reliability, as well as positive perceptions of usability and potential positive and negatives consequences of use to be considered. The final ESSY Whole Child Screener includes 53 items that measure five domains: Academic Skills, Behavior, Social and Emotional Well-Being, Supports Outside of School, and Physical Health. Our cross-validation approach demonstrated that this factor structure generalized across two distinct samples. Additionally, the factor loadings and internal reliability estimates were similar across the two samples. The changes that were made to the internal structure in Study 2 resulted in some larger factor intercorrelations. The factor loadings and factor intercorrelations are well supported by theory and mostly range from moderate to large sized. The ESSY Whole Child Screener purposefully allows 16 items to cross-load on more than one factor, which aligns with the theory behind the screener that these domains of child development are interrelated and the multiple gated approach.
Our initial design of the measure separated items about child-level skills and characteristics (5 hypothesized factors) and the contextual influences surrounding the child (3 hypothesized factors) into separate domains; however, results of the EFA suggested that the child and contextual focused items merged to some extent across all domains. The factor that changed most substantially from the initial iteration was the factor we named Social and Emotional Well-Being. First, although we developed separate groups of items to assess social skills and emotional well-being, these items loaded on a single factor. Given increased focus on social-emotional learning in schools and helping students to develop skills to both manage their own emotions and interact effectively with others (Greenberg et al., 2017), the fact that these items loaded on a single factor is not altogether surprising. Additionally, many of the items hypothesized to measure contextual school experiences (e.g., relationships with adults and peers at school, experiences of social exclusion or bullying) loaded on the Social and Emotional Well-Being factor as well. We had initially conceptualized these items as contextual indicators of school climate and supportiveness; however, content did align with the identified factor given the interpersonal nature of the items. Additionally, the Social and Emotional Well-Being factor had a large correlation (r = .77) with the Supports Outside of School factor, further suggesting contextual influences and children’s social and emotional well-being are strongly related.
Notable changes from our initial hypotheses were also found for the other contextual domains. Specifically, although we initially conceptualized Supports Outside of School as two separate contextual domains—Access to Material Needs and Social Support Outside of School—both EFA and CFA data suggested these be merged into one construct. This construct now encompasses both material and relational supports outside of school, including the presence of a caring adult, a stable living situation, and family and community stressors. For children, the presence of a caring adult is one of the greatest buffers against long-term negative impacts of family and community stressors (e.g., potentially traumatic events; Cross et al., 2017; Hambrick et al., 2019). Assessing both material and relational supports can inform unique points for intervention, including referrals to mentoring programs (e.g., Big Brothers Big Sisters of America) in cases of limited social support; family therapy in cases of family stressors or strained relationships; or food or housing supports in cases of economic insecurity. Qualitative data suggested potential positive and negative consequences of collecting these data. Potential positive consequences identified across both studies included identifying the root cause of concerns and connecting students to associated supports and increasing educator reflection on various factors influencing student success. Potential negative consequences identified across both studies included teacher inaccuracy or bias leading to overidentification or misidentification of students in need of support, damaging relationships with families. Additional potential negative consequences were lowering teacher expectations (Study 1), not having supports available to address identified concerns, and negative impacts on teacher emotions (Study 2).
An additional finding of interest was that many items cross-loaded across domains. For example, although the strongest factor loadings within the Academic Skills factor were for those items assessing academic skills (e.g., reading, math performance) and enablers (e.g., academic engagement, academic persistence), items assessing related skills such as communication (e.g., adult communication, clear articulation) and self-efficacy (e.g., positive outlook, self-confidence) also demonstrated significant cross-loadings. The same was true of the Behavior and Physical Health factors, within which some of the contextual items that loaded on the Supports factor (e.g., stable housing, presence of stressors) also demonstrated significant cross-loadings on the Behavior and Physical Health factors respectively. The presence of cross-loadings has often been viewed as problematic in factor analysis given cross-loadings can complicate the interpretation of factor-based composite scores and what each factor uniquely assesses. The presence of cross-loaded items within the ESSY Whole Child Screener may actually be a unique strength. Factor-based domain-level composite scores are not computed. Instead, the ESSY data report presents all Gate 2 item-level ratings in color-coded categories labeled Strengths to Maintain, Areas to Monitor, and Concerns for Follow-Up (Koslouski et al., 2026). Users are encouraged to holistically interpret item-level ratings from all domains together to better understand the interaction between within child and contextual influences. In practice, the multiple gated procedure will be applied. It is very unlikely teachers will complete all 53 Gate 2 items. Teachers will only complete specific Gate 2 items for domains marked as areas of concern for a student within Gate 1. The fact that all of the domains traditionally thought of as measuring within-child behaviors or skills also include some contextual indicators (e.g., the Behavior factor asking about the presence of stressors outside of school, the Social Emotional Well-Being factor asking about the presence of supportive adults) means that teachers and teams will be guided to reflect on potential contextual explanations even if Supports Outside of School was not initially flagged. Exposure to chronic stressors can result in traumatic stress that causes students to exhibit aggression, impulsiveness, or attention-seeking behaviors, for example (Koslouski et al., 2023). Without assessment of the presence of stressors outside of school, these behaviors might be conceptualized as concerns to be addressed within the student. With recognition of co-occurring stressors outside of school, however, educators may be more likely to recognize these behaviors as a trauma response and respond accordingly. Additionally, the screener will maintain efficiency because teachers will only rate cross-loaded Gate 2 items once. For example, if a teacher reports concerns with the student’s Behavior and Supports Outside of School at Gate 1, the teacher will only be presented with the family stressors item once, despite the item loading on both factors. Although participants expressed concern about the length of time it will take to rate a classroom of students, in applied use, the multiple gated procedure will substantially reduce the length of the screener for most students.
Finally, six of the items that we initially expected to load on one of the primary factors did not operate as expected. These items either demonstrated low factor loadings (i.e., self-harm, not enough sleep) or cross-loadings on multiple factors (i.e., bullied by others, social exclusion, emotion regulation, withdraws) and therefore negatively impacted model fit. Within the Consequential Validity-Centered Measure Development framework (CVMD; Caemmerer et al., 2026), however, both quantitative and qualitative data are considered in tandem to evaluate potential consequences of measure use. Because qualitative data gathered from intended users earlier in the measure development process emphasized the importance of assessing these behaviors, we made the decision to retain these items as essential items that teachers would rate for any student that they expressed concern about at Gate 1.
Limitations and Future Directions
This is the first study to evaluate the psychometric properties of the newly developed ESSY Whole Child Screener. Although the two large national samples and cross-validation approach, exploratory and confirmatory factor analyses with two independent samples, are strengths of this study, additional research with new samples is necessary to determine if the reliability estimates and factor structure generalize. These additional analyses are particularly relevant given the modifications to the factor structure during the Study 2 CFA: the removal of the Stressors factor and the subsequent restructuring of the Supports Outside of School factor and the inclusion of additional cross-loadings. Different samples from different locations and demographic backgrounds are needed to strengthen the validity and reliability findings related to the ESSY Whole Child Screener. Additionally, as the current samples were limited to 3rd–5th grade teachers, additional evaluation is needed with K-2 teachers to ensure the screener operates similarly at the early elementary grades.
Additional future research directions include tests of the multiple gated approach of the screener and evaluations of other types of validity evidence. Future research must examine the classification accuracy—sensitivity and specificity—of the Gate 1 items in accurately identifying students with concerns who require a more detailed rating of domain-specific concerns via the Gate 2 items. Although the ESSY Whole Child Screener was designed to use a multiple-gated approach, only the Gate 2 items were evaluated in the current study. In addition to the five Gate 1 items to be finalized based on this study’s results, which correspond with the five factors in the final factor structure, we also intend to include a Gate 1 item to assess student attendance given the role of this variable in explaining student functioning. Attendance was excluded from this study because attendance has no Gate 2 items. Future research will need to explore the relation between attendance and the five factors examined in this study. Additionally, more data are needed to strengthen the validity evidence for scores generated by this screener. ESSY Whole Child Screener data should be examined in conjunction with scores on other screeners and outcomes related to functioning within schools to evaluate evidence related to convergent and divergent relations. Although this study offered insight into potential positive and negative consequences of the measure’s use, additional investigation of actual consequences (i.e., consequential validity) will need to be conducted alongside applied use in schools. Finally, studies of concordance between teacher and student or family caregiver ratings should be conducted to determine the agreement between different raters on the ESSY Whole Child Screener items. Additional studies can explore whether a multi-informant approach would be helpful, particularly for the contextual items.
Conclusions and Implications for Practice
Results from this study provide an initial contribution to the measurement of within child and contextual factors within school-based screening practices. To date, the majority of screening instruments in schools only measure 1–2 of the within-child domains included in the ESSY Whole Child Screener (e.g., academics; social and emotional well-being), whereas the ESSY Whole Child Screener comprehensively assesses a variety of domains that influence students’ success: Academic Skills, Attendance, Behavior, Social and Emotional Well-Being, Physical Health, and Supports Outside of School. This new measure shifts the focus of universal screening to the interrelated domains of child development and strength-based assessment.
Existing school-based screening tools rarely assess contextual assets or barriers, such as food insecurity, stable housing, or social support outside of school (Koslouski et al., 2024b). Contextual barriers, in particular, can have substantial impacts on student learning and behavior (e.g., Prokosch et al., 2022; Shankar et al., 2017). Yet, without accounting for these contextual assets and barriers in the problem identification process (e.g., screening), schools may overlook these root causes of concerns and opportunities to effectively intervene by connecting families with community resources, for example. Increasingly, schools employ school social workers or family liaisons who are well positioned to connect families with community resources that address such barriers—but this requires having data to indicate such need.
We recently studied school team decision making when teams were presented with data about the same fictional student using existing SEB screening tools and the ESSY Whole Child Screener (Koslouski et al., 2026). Findings suggested that school teams overwhelmingly wanted to collect more data but also recommended a small number of child-focused interventions (e.g., social skills intervention, counseling) when presented with traditional SEB screening data. When viewing ESSY Whole Child Screener data, however, teams were ready to intervene with both child-focused and contextual supports, such as repairing the family-school relationship or connecting the family with community resources (e.g., housing, food banks). By assessing a greater number of domains that include contextual factors in the home, school, and community, the ESSY Whole Child Screener may enable more precise and holistic understandings of student challenges and strengths that enable schools to more efficiently and effectively support students.
Footnotes
Acknowledgements
The authors are grateful to David Gertz and Kevin Melecio for assisting with data collection and the creation of tables, and to Scarlett (Sija) Xiong for assisting with the creation of tables.

Ethical Considerations
All study procedures were approved by University of Connecticut Institutional Review Board (protocol number B2024-0051).
Consent to Participate
All participants provided written informed consent prior to participating.
Funding
The authors disclosed receipt of the following financial support for the research, authorship, and/or publication of this article: The research reported here was supported by the Institute of Education Sciences, U.S. Department of Education, through Grant R305A220249 to University of Connecticut.
Declaration of Conflicting Interests
Jacqueline Caemmerer, Jessica Koslouski, Amy Briesch, and Sandra Chafouleas are co-inventors of the ESSY Whole Child Screener, which is owned by the University of Connecticut. This research study may result in improvements to the ESSY Whole Child Screener, which could have financial benefits for them.
Data Availability Statement
The datasets generated during and analyzed during the current study are not publicly available because public sharing was not included in the IRB approved data management plan.
Disclaimer
The opinions expressed are those of the authors and do not represent views of the Institute of Education Sciences or the U.S. Department of Education.