
Abstract
The psychometric properties of the Student Motivation and Learning Strategies Inventory (SMALSI) were examined using a sample of 404 Grade 6 students from an urban Canadian school system. Students completed the SMALSI and school factors included final school grades, attendance records, and language arts, mathematics, science, and social studies results from Provincial Achievement Tests (PATs). Confirmatory factor analysis of SMALSI demonstrated less than adequate fit for each individual SMALSI factor though with some covariance of similar items, the model fit approached acceptable limits for most factors. Results generally confirmed that the SMALSI subscales were significantly related to all of the achievement variables including PAT results and final school grades. Structural equation modeling demonstrated that writing and research skills, test-taking skills, low motivation, and test anxiety all contributed to the prediction of PAT results. Test anxiety was a significant predictor of achievement across all subject areas. Canadian Grade 6 students demonstrated lower motivation, less test anxiety, and fewer attention problems but were otherwise comparable with the U.S. sample. Results provide convergent evidence supporting the psychometric properties of the SMALSI with a Canadian sample; however, there is some room to improve the overall model fit in subsequent revisions of this measure.
Understanding and assessing the correlates of academic achievement in school-age children is a matter of uniform importance among school psychologists and other school professionals. Despite the role and importance of intellectual ability as a predictor of scholastic achievement (see Sattler, 2008), there remains a need to assess for other constructs that also show a predictive relationship with achievement and that have utility in intervention planning. Predictors of academic achievement that have been explored include, but are not limited to, learning strategies and other learning behaviours, as well as motivation, attention, and test anxiety (TANX; see Winne & Nesbit, 2010, for a review).
The concept of learning strategies encompasses a variety of constructs, each of which has shown some relationship to achievement, including note-taking and listening skills (Armbruster, 2000; Bygrave, 1994; Hughes & Suritsky, 1994), time management (Britton & Tesser, 1991), TANX (Cassady & Johnson, 2002), research strategies (Quarton, 2003), concentration/attention (Rabiner & Coie, 2000; R. E. Reynolds & Shirey, 1988), organizational techniques (Shapiro, DuPaul, & Bradley-Klug, 1998), test-taking strategies (Flippo, Becker, & Wark, 2000; Hong, Sas, & Sas, 2006), study strategies (Sweidel, 1996), and reading and comprehension strategies (Gersten, Fuchs, Williams, & Baker, 2001). In turn, measures for many of these constructs have been developed including several for the construct of motivation (for review, see Fulmer & Frijters, 2009), learning behaviours (see the Learning Behaviours Scale; McDermott, Green, Francis, & Stott, 1999), and study skills (see the Academic Competence Evaluation Scales; DiPerna & Elliott, 2000). However, no other instruments exist that have tried to examine all of these constructs simultaneously in one instrument. One of the instruments developed to capture motivation, learning behaviours, and study skills within a single measure is the Student Motivation and Learning Strategies Inventory (SMALSI; Stroud & Reynolds, 2006).
Development of the SMALSI
The SMALSI is a self-report measure for children aged 8 to 18 years. There is both a child version (ages 8-12) and an adolescent version (ages 13-18). There are several subtests within the SMALSI, seven of which focus on student strengths and three focus on student liabilities. The strengths scales include Study Strategies (STUDY), Note-Taking/Listening Skills (NOTE), Reading/Comprehension Strategies (RCOMP), Writing/Research Skills (WRITE), Test-Taking Strategies (TTAKE), Time Management and Organizational Techniques (TORG). The student liabilities scales include Low Academic Motivation (LOMOT), Test Anxiety (TANX), and Concentration/Attention Difficulties (INATTN).
Psychometric Properties
This measure has reported good initial psychometric properties including internal consistency with Cronbach’s alpha coefficients ranging from .75 to .80 for each scale (DeVellis, 2003). In addition, the SMALSI shows moderate to high correlations with similar measures (Jeary, 2007; Stroud & Reynolds, 2006). Based on preliminary examination of available data, it would appear that the student strength scales all have positive intercorrelations ranging from .50 to .74 and that the liabilities scales are also moderately interrelated in the range of .44 to .68 (Stroud, 2006).
The SMALSI has thus shown reasonable preliminary evidence of basic psychometric properties. However, these studies have been few in number, limited in terms of sample size, and have never explored the reported factor structure of this measure. In addition, all studies of the psychometric properties of the SMALSI have been limited to a U.S. sample. We feel that additional validation of this tool is needed and that psychometric data should be obtained from a Canadian population. This is especially the case if this measure is to be used by psychologists and educators in Canada. It can be argued that Canadian children come from a unique cultural and educational context and this could result in observed differences in terms of the variables assessed by the SMALSI. Certainly, a parallel here is found with ability tests. For example, Ford, Swart, Negreiros, Lacroix, and McGrew (2010) in comparing U.S. with Canadian performance on the Woodcock–Johnson III note how, There is a need to determine if the U.S. norms are “transportable” and applicable to Canadian populations and, if not, whether additional norming with a Canadian sample is needed, and/or if special adjustments are necessary to the norms for tests standardized in the United States to make them more applicable for Canadian populations. (p. 2)
This sentiment is in line with current standards for psychological and educational testing in the United States and in Canada (American Educational Research Association, American Psychological Association, & National Council on Measurement in Education, 1999; Canadian Psychological Association, 1996). Specifically, these standards indicate that the user of a test developed for something other than local only use must understand the applicability of the test to different groups. Thus, it appears necessary to gather data to examine the psychometric properties of the measure with a Canadian sample and to also collect additional information, as outlined below.
Additional Information
The authors of the SMALSI note that they found significant gender differences with girls tending to have higher scores on the strengths scales than boys (Stroud & Reynolds, 2006). In addition, the test authors report only a small, but statistically significant, relationship between SMALSI subscales and a measure of achievement—the Texas Assessment of Knowledge and Skills (TAKS). However, they highlight that the TAKS has a restricted range of scores, which may have precluded the relationship and they also had a very small sample size when comparing the Child version of the SMALSI with TAKS (N = 32; Stroud & Reynolds, 2006). Thus, it remains to be seen how the SMALSI will relate to a standardized test of achievement when a more comprehensive representation of school grades with a sizable sample is used.
Current Study
As the SMALSI is a relatively new test instrument, psychometric research with the SMALSI has been quite limited. However, this test is already being marketed and utilized in school systems for intervention planning. One intervention guide has already been produced (Vannest, Stroud, & Reynolds, 2011). One must understand the relationship between SMALSI subscales and actual achievement to make informed decisions about which students are in need of intervention. Moreover, a number of professional standards highlight the importance of adequate validity evidence being required to ensure appropriate use and interpretation of psychological and educational measures (American Educational Research Association, American Psychological Association, & National Council on Measurement in Education, 1999; Canadian Psychological Association, 1996). Thus, it seems important to further support the criterion and convergent validity of the SMALSI for its use with Canadian students.
The primary goal of this study was to produce additional psychometric evidence for the SMALSI with a Canadian sample in terms of its factor structure, examining potential gender differences and the relative distribution of scores, and the relationship between SMALSI constructs and a measure of academic achievement. The specific research questions to be addressed are as follows:
Method
Participants
Participants included 404 Grade 6 students (213 boys and 191 girls). All students were from an urban public school system within Alberta, Canada. This age group was chosen as the Provincial Achievement Test (PAT) is only administered to students in Grades 3, 6, 9, and 12. The total possible Grade 6 students available in this school system were n = 650 for Grade 6. Thus, this sample represents a fairly substantial proportion (62%) of the Grade 6 students within the entire school district. The urban statistics based on 2006 Census data from Statistic Canada suggest that this community is an expanding population with an increase of more than 20% in the past 10 years. The community has a largely European ethnic mix though there has been an increase in visible minorities and 4% of the population identify themselves as aboriginal. A total of 8.9% of people identified a language other than English as their first language. The community has reported an aggregate for unemployment rate of 6.9% from 1991 to 2006. As a result, there has generally been an increase in average household/family income in the area and reduction in low income families up to 2006.
Procedure
Following permission being granted from a Research Ethics Board, an information letter and informed consent form were sent home with identified Grade 6 students. All efforts were made to protect individual privacy of information collected from the study. A school staff person was responsible for collecting and entering relevant school information such as attendance records, school grades, and PAT results. Once consent was achieved, students who had consented were brought in large groups to a computer classroom where they were able to complete the SMALSI. PAT testing, and SMALSI assessments were completed within several weeks of each other at the end of the school year in June.
Measures and Variables
The SMALSI (Stroud & Reynolds, 2006) was simultaneously computer-administered to all six grades’ students who had agreed to participate in the study within a computer classroom at their school. This is a typical administration procedure for the SMALSI as the test manual permits large group administration via a computer where results can later be easily downloaded and exported for analysis.
School records that were available for participants included final school grades and attendance records. Final grades were recorded in terms of letter grades (i.e., A, B, C, or D). These grades were then converted to a 4.0 scale where A = 4.0, B = 3.0, C = 2.0, and D = 1.0. The primary achievement variable of interest in the present study was individual student performance on the PAT. The PAT is a standardized achievement examination that is routinely administered to all children and adolescents within the Alberta public education system in Grades 3, 6, 9, and 12. A separate PAT is available for each major subject area including English language arts (LA), social studies (social), science, mathematics (math), and physical education (PE). For this study, we were mainly interested in the relationship between SMALSI and the core academic subject areas. Thus, PE results were not included. For the LA PAT, there is both a reading and writing component. The social PAT has a multiple-choice and a written component to the test. There is a knowledge and skills component on both the science and the math PATs. As not every student was required to take the PAT, there was some variation in terms of final sample size. For our sample, there were n = 389 for LA, n = 341 for math, n = 345 for science, and n = 342 for social. Absences for the Grade 6 sample were the recorded full days absent. The number of times students were late for school were also recorded for the Grade 6 students.
Analytical Method
For the confirmatory factor analysis (CFA), the Mplus 7.1 (Muthén & Muthén, 2012a) was used. As the items are all categorical, the weighted least squares means and variance adjusted (WLSMV) were chosen as estimators (Muthén & Muthén, 2012b). The comparative fit index (CFI), the Tucker–Lewis index (TLI), and the root mean square error of approximation (RMSEA) were used for assessing goodness of the models. The assessment of relationship between SMALSI and measures of academic achievement was done in a structural equation modeling (SEM) framework where measures of academic achievement were regressed on SMALSI. The calculation of Cronbach’s alpha and gender differences were carried out by means of SPSS 22.
Results
Means and standard deviations for the SMALSI are presented in Table 1. This table shows that means and standard deviations for the Grade 6 students roughly paralleled the normal distribution expected for a T score with means near 50 and a standard deviation near 10. Visual inspection of the distribution also confirmed that the distributions closely approximated a normal distribution. An analysis was performed of whether the mean and standard deviation of each subscale of the SMALSI was significantly different from the expected mean of 50 and deviation of 10. The analysis revealed that reading comprehension, motivation, and TANX subtests were all significantly different from the expected mean but the effect size for this was small to moderate (d = 0.18, 0.15, and 0.34, respectively). Also, when comparing the Grade 6 results with U.S. standardization group (U.S. Grade 6 norm-Canadian Grade 6 mean), we found that the Canadian sample did not differ significantly from the U.S. Grade-6 group on any of the SMALSI Strengths subscales. However, there were significant differences where the Canadian sample had significantly lower scores on the LOMOT, the TANX, and the INATTN subscales. On these subscales, higher T scores indicate worse academic motivation, more TANX, and more INATTN. Thus, our Canadian sample reported significantly greater motivation, fewer anxiety concerns when taking tests, and fewer INATTN (p < .01) than the U.S. sample.
Descriptive Statistics for SMALSI Subscales and t-Test Comparison With Standardization Sample.
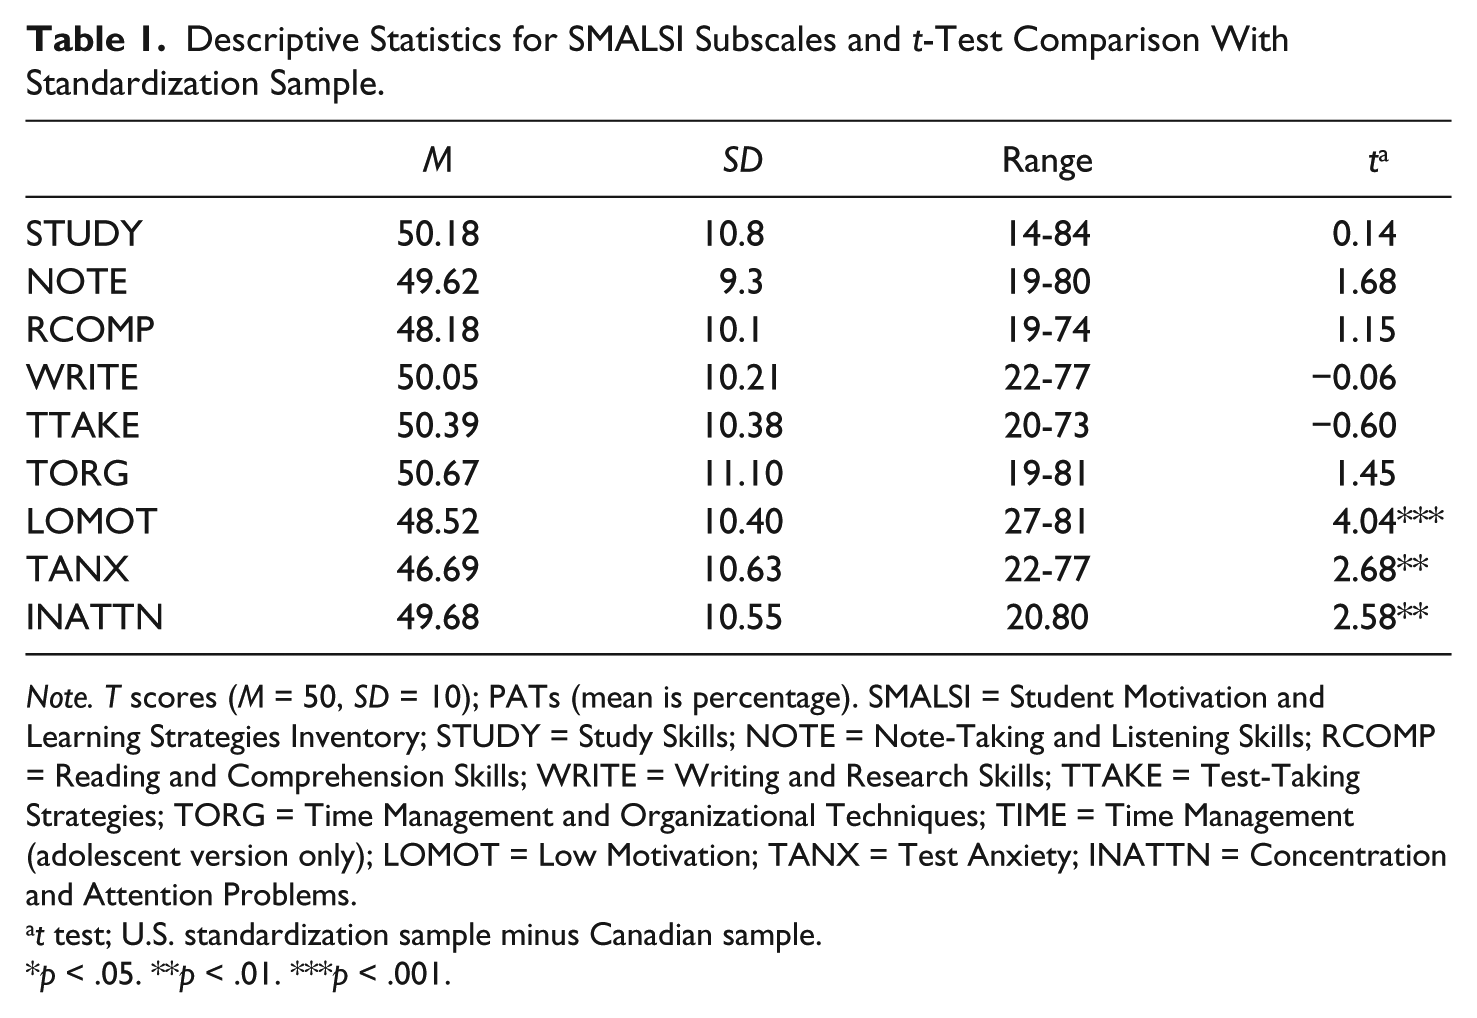
Note. T scores (M = 50, SD = 10); PATs (mean is percentage). SMALSI = Student Motivation and Learning Strategies Inventory; STUDY = Study Skills; NOTE = Note-Taking and Listening Skills; RCOMP = Reading and Comprehension Skills; WRITE = Writing and Research Skills; TTAKE = Test-Taking Strategies; TORG = Time Management and Organizational Techniques; TIME = Time Management (adolescent version only); LOMOT = Low Motivation; TANX = Test Anxiety; INATTN = Concentration and Attention Problems.
t test; U.S. standardization sample minus Canadian sample.
p < .05. **p < .01. ***p < .001.
Means and standard deviations for PATs (percentage), the final school grades, lates, and absences are presented in Table 2. From this table, one can see that there was considerable variability in the number of lates and absences from students within this cohort.
Descriptive Statistics for PATs, School Grades, Lates, and Absences for Each Sample.
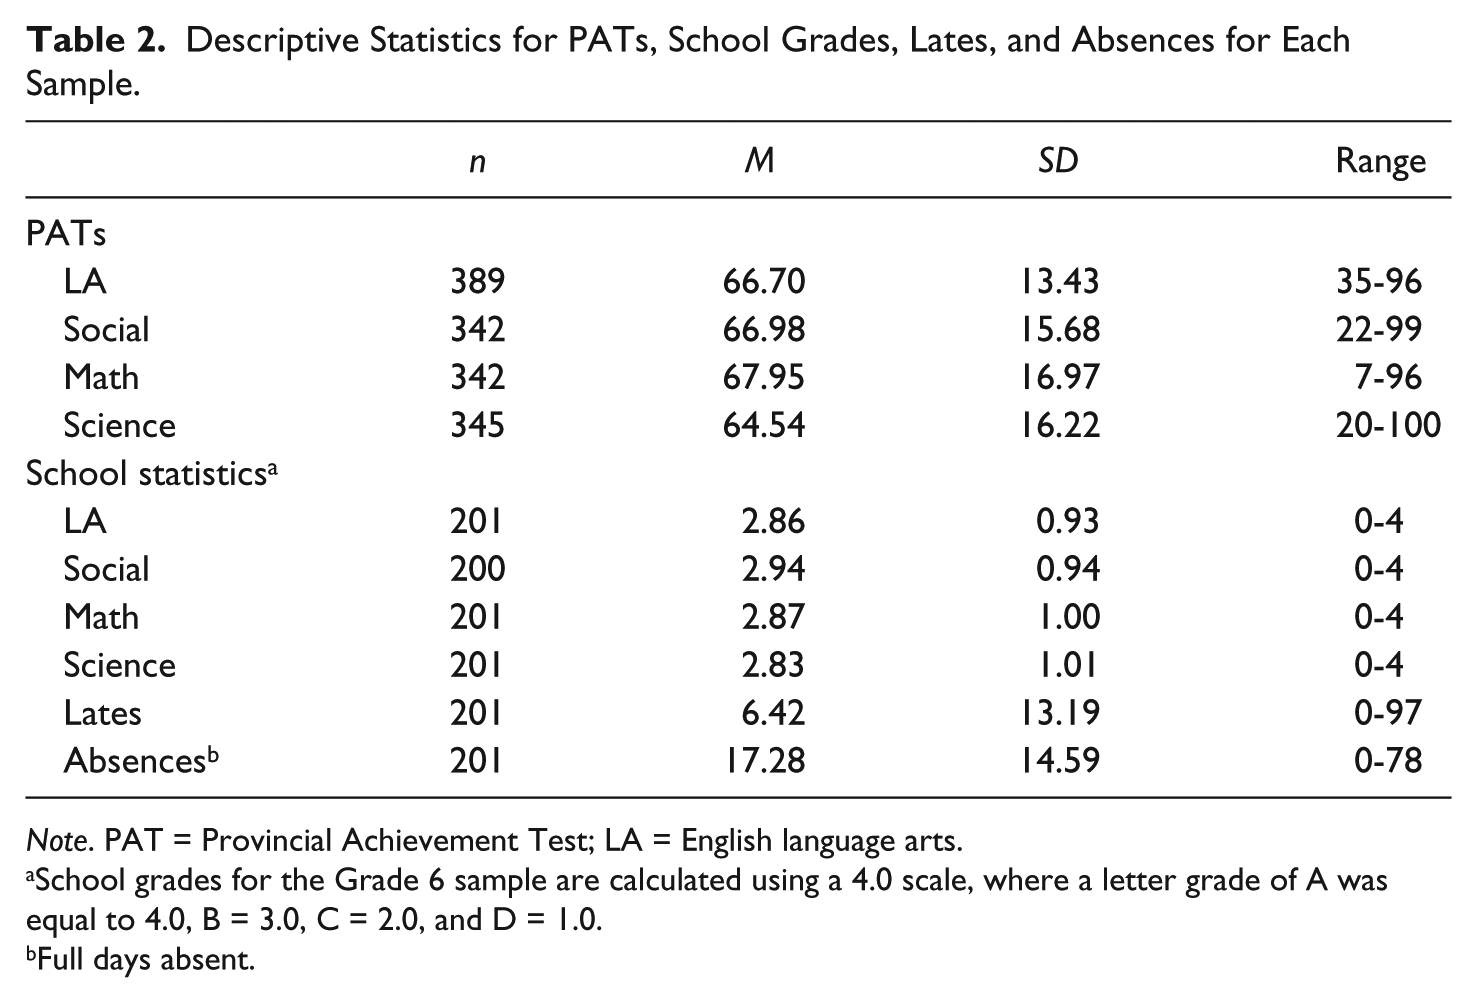
Note. PAT = Provincial Achievement Test; LA = English language arts.
School grades for the Grade 6 sample are calculated using a 4.0 scale, where a letter grade of A was equal to 4.0, B = 3.0, C = 2.0, and D = 1.0.
Full days absent.
Factor Structure of the SMALSI
As the test authors suggest that each of the nine scales represent a unique construct, each scale was tested individually for model fit. While the authors do mention that that the pattern of intercorrelations among scales suggests six scales that load on as part of Strengths factor and three that load as a Liabilities factor, they explicitly discourage the development and reporting of composite scores in favour of individual scales. They suggest that individual scales are more useful for identifying areas for targeting intervention (Stroud & Reynolds, 2006). However, a model comprising all the nine subscales was also analyzed as to provide information on the overall structure of SMALSI. The model fit statistics for each scale are reported in Table 3. Following the advice of Schreiber, Stage, King, Nora, and Barlow (2006), we are reporting the TLI, CFI, and the RMSEA. According to Schreiber et al., a TLI or CFI equal to 0.95 or greater is considered a good fit to the model, while a RMSEA below 0.06 is considered acceptable. In examining the various fit indices, there is generally unacceptable fit for all scales. The exception was where the RMSEA fell within acceptable limits on one scale and the full model. This was observed for the INATTN scale. A visual analysis of the covariance matrices and the standardized residuals revealed that model fit was negatively affected by considerable shared variance among test items for each scale. Some individual items also had low (below .5) to very low factor loadings.
Results of Confirmatory Factor Analysisa for Each SMALSI Variable.
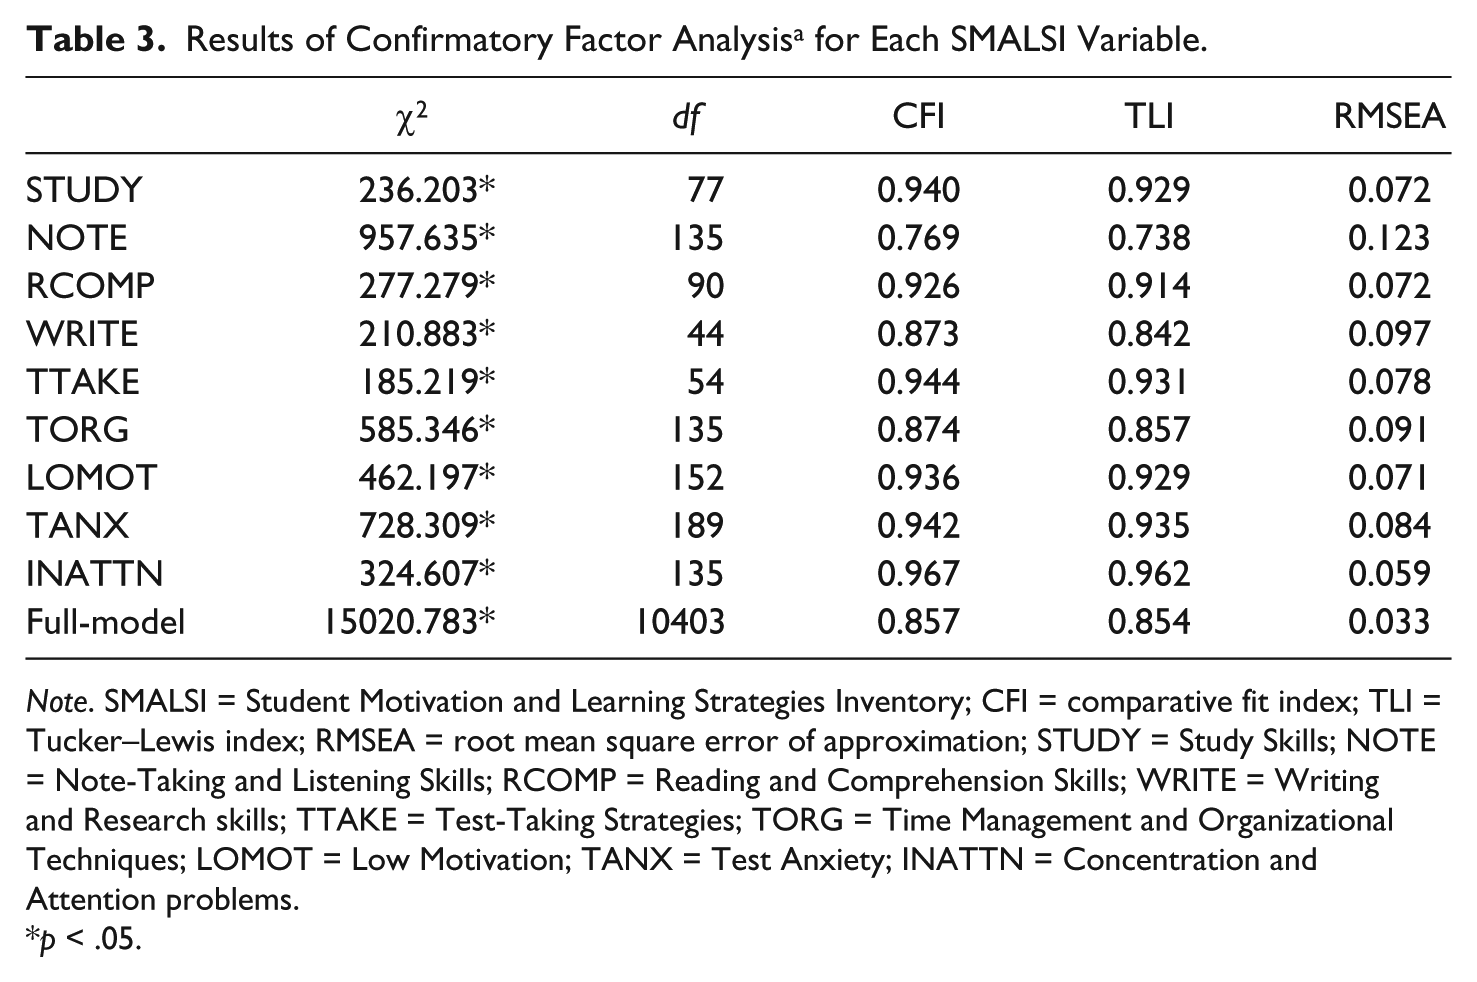
Note. SMALSI = Student Motivation and Learning Strategies Inventory; CFI = comparative fit index; TLI = Tucker–Lewis index; RMSEA = root mean square error of approximation; STUDY = Study Skills; NOTE = Note-Taking and Listening Skills; RCOMP = Reading and Comprehension Skills; WRITE = Writing and Research skills; TTAKE = Test-Taking Strategies; TORG = Time Management and Organizational Techniques; LOMOT = Low Motivation; TANX = Test Anxiety; INATTN = Concentration and Attention problems.
p < .05.
In examining the CFA results above, we discovered that in many cases there was considerable item overlap or covariation that might account for the poor model fit. Taking writing and research as an example, we explored the covariances of the error terms within the model. When doing this, we found that several pairs of items had considerable overlap that often contributed to poor factor loadings. We revised the model for writing and research skills by covarying the error terms for two pairs of items. The first was a pair of items relating to proofreading and the second was in regard to finding books in the library. After these modifications the model fit improved. Thus, with some adjustments for covariation, the model fit was acceptable on virtually every index. Repeating this analysis for the remaining scales showed that in every case we could improve the model fit with some strategic covariation of items that were very similar in content. It should be noted that in all cases, the RMSEA did reach acceptable limits (i.e., < .06) for all scales after similar item pairs had the error term covaried in the model. It should also be noted that even after covariation, there were still several items that had a weak (i.e., < .30) factor loading and where the removal of the item improved the model fit. This was seen for Item No. 51 on study skills, Item No. 57 on reading comprehension, and Item No. 22 on LOMOT. The factor loadings for each of these were .33, .13, and .21, respectively.
Given the relatively weak model fit for note-taking and listening skills, even after covariation of similar items, an additional analysis was conducted to determine whether a multifactor solution would result in a better model fit. Results for the full model containing nine factors showed an RMSEA of 0.033 but CFI/TLI indices were lower than 0.90. It should be noted that CFI and TLI are comparative fit measures meaning that these indices assess the fit between estimated model and baseline model (i.e., a model in which factor loadings are fixed to one, error variances are fixed to zero and indicators assumed to be uncorrelated). In contrast, RMSEA is an exact fit measure that evaluates the approximate fit of the model to the population variance-covariance matrix (Schermelleh-Engel, Moosbrugger, & Müller, 2003). Large values for CFI/TLI show an acceptable improvement of model fit for almost all subscales by using hypothetical models. However, RMSEA values suggest that the specified measurement model for almost all domains is miss-specified. In case of the full model, a low RMSEA suggests that a nine-correlated factors model is a good approximate of the population variance-covariance matrix. In contrast, higher RMSEA values for individual subscales indicate a poor approximation of the population variance-covariance matrix. This finding suggests that subscales should be used with caution when considered individually. An investigation of the intercorrelations among SMALSI subscales, presented in Table 4, revealed that there are five correlation coefficients greater than .90 between some subscales. This means that those subscales share considerable variance and could be merged or represent a single construct. There are very similar questions within highly correlated factors. The same conclusion is applicable to factors with intercorrelations between .80 and .90. Analysis of individual subscales for internal consistency was conducted using Cronbach’s alpha. Cronbach’s alpha coefficients for each scale were as follows; study strategies (.82), note-taking/listening skills (.83), reading/comprehension strategies (.83), writing/research skills (.76), test-taking strategies (.84), organizational techniques and time management (.87), LOMOT (.88), TANX (.92), and concentration/attention difficulties (.90). These values either met or exceeded the internal consistency estimates for the Grade 6 standardization sample, which ranged from .72 (writing/research) to .92 (TANX).
Intercorrelations Between SMALSI Subscales.
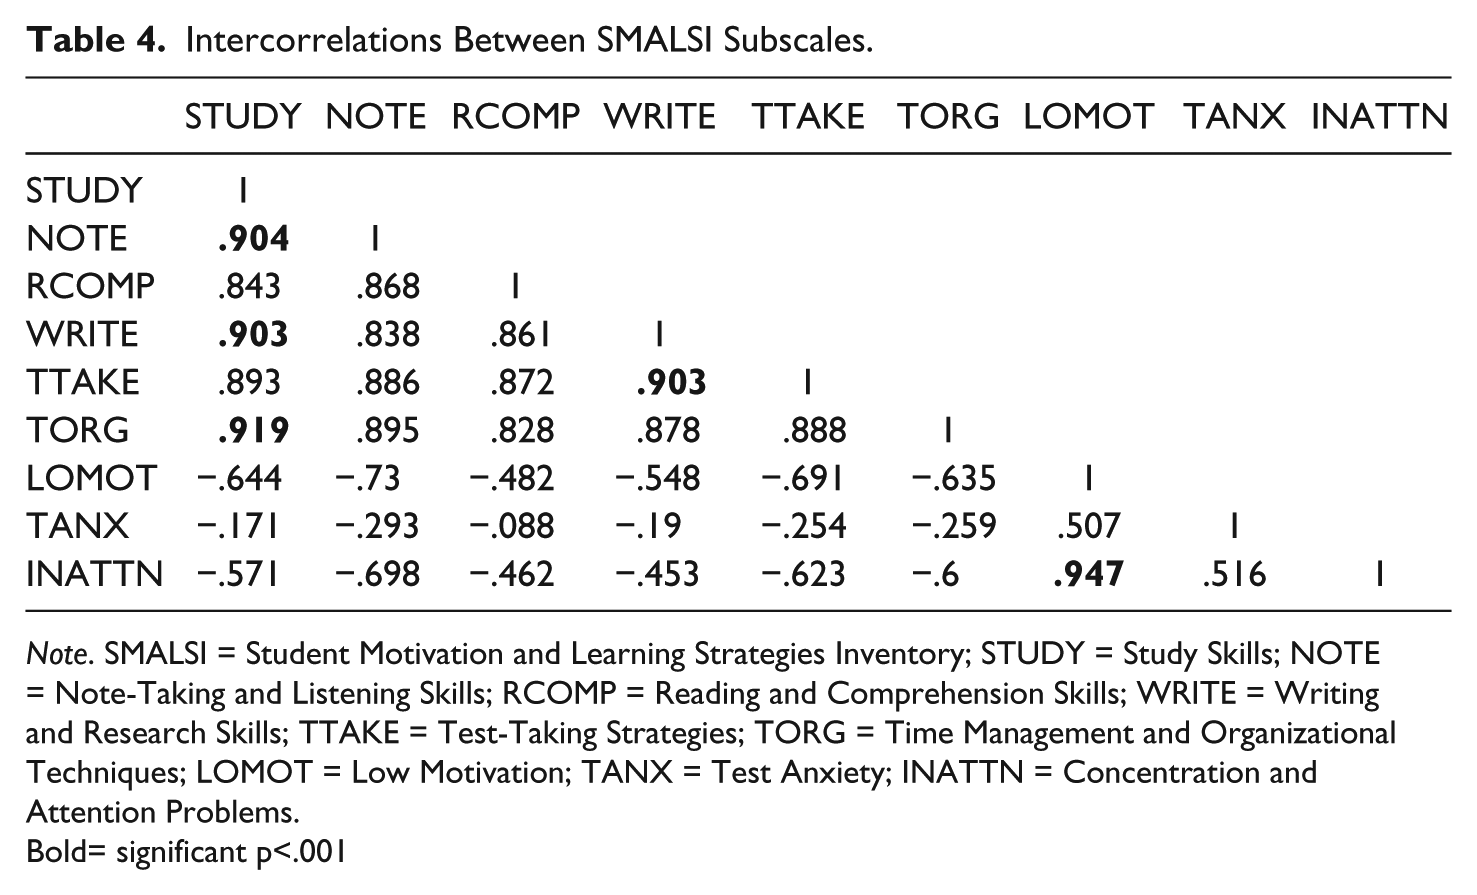
Note. SMALSI = Student Motivation and Learning Strategies Inventory; STUDY = Study Skills; NOTE = Note-Taking and Listening Skills; RCOMP = Reading and Comprehension Skills; WRITE = Writing and Research Skills; TTAKE = Test-Taking Strategies; TORG = Time Management and Organizational Techniques; LOMOT = Low Motivation; TANX = Test Anxiety; INATTN = Concentration and Attention Problems.
Bold= significant p<.001
Gender Differences
SMALSI means and standard deviations by gender along with t-test results comparing genders are presented in Table 5. From this table, one can observe that girls had a significant advantage over boys for all of the strengths scales. Girls also reported lower scores on LOMOT indicating significantly greater academic motivation than boys. They also reported less attention and concentration problems. The one exception was for TANX, where girls reported significantly greater TANX than boys. These results were consistent with gender differences reported by the test authors (Stroud & Reynolds, 2006).
Descriptive Statistics and Independent Samples t Tests for SMALSI Subscales by Gender.
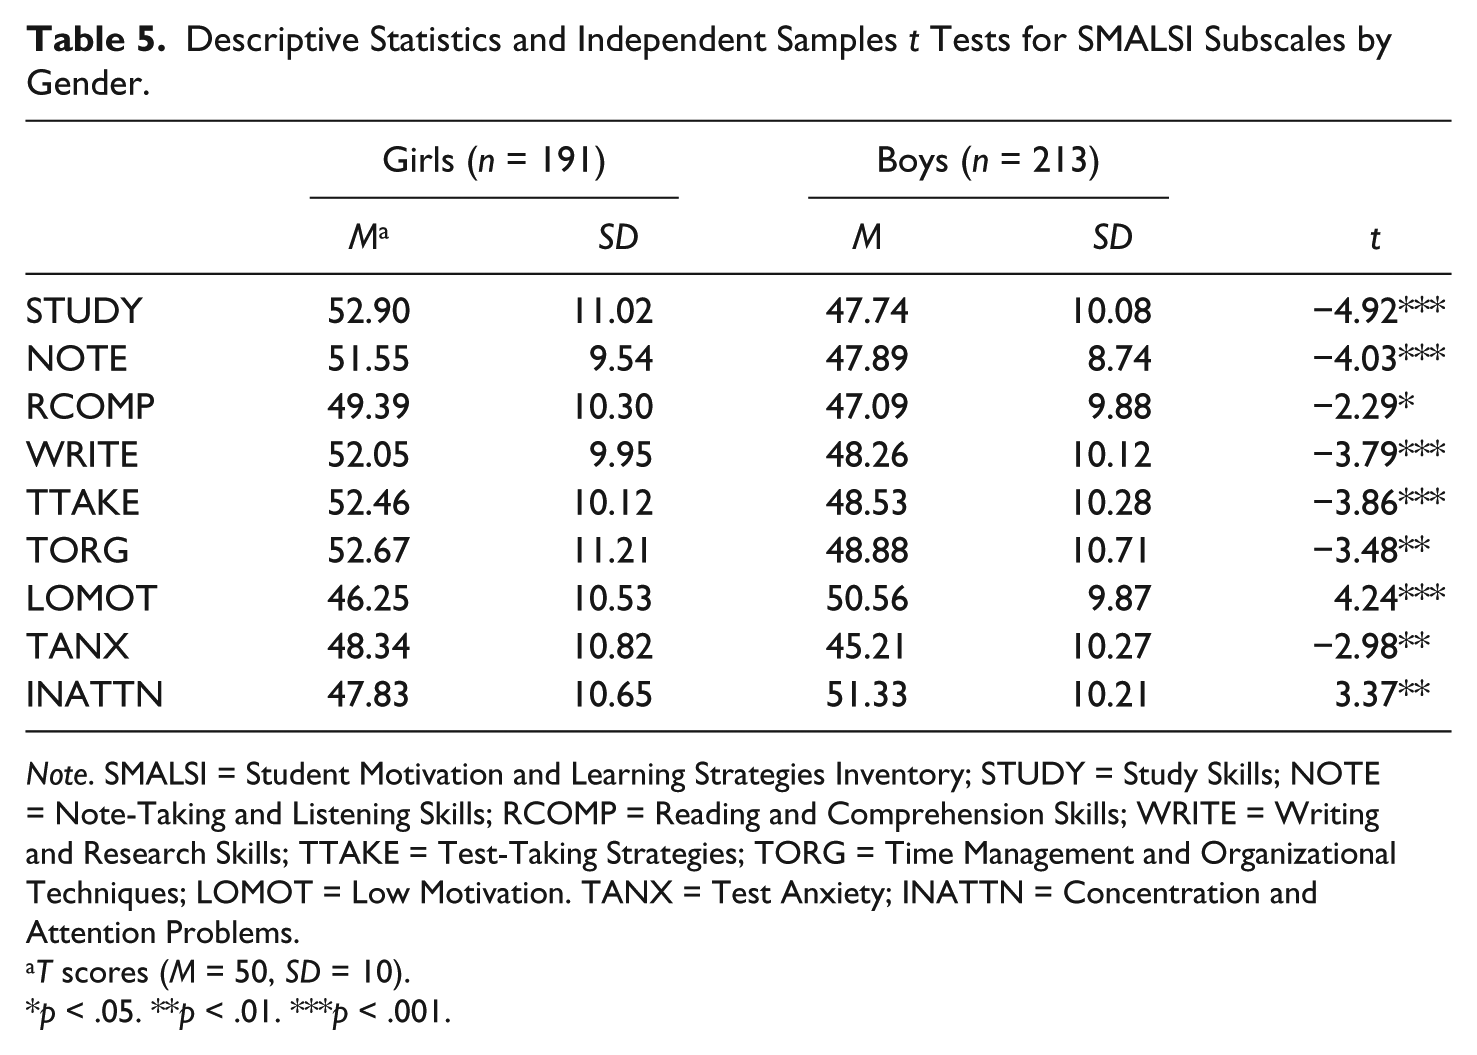
Note. SMALSI = Student Motivation and Learning Strategies Inventory; STUDY = Study Skills; NOTE = Note-Taking and Listening Skills; RCOMP = Reading and Comprehension Skills; WRITE = Writing and Research Skills; TTAKE = Test-Taking Strategies; TORG = Time Management and Organizational Techniques; LOMOT = Low Motivation. TANX = Test Anxiety; INATTN = Concentration and Attention Problems.
T scores (M = 50, SD = 10).
p < .05. **p < .01. ***p < .001.
Gender differences were also examined for achievement variables. In terms of the PAT tests, girls performed significantly better than boys for language arts, t(1, 387) = −3.24, p = .001, especially for the written portion of the test, t(1, 392) = −4.85, p < .001. There was no significant difference between genders on the social PATs or math PATs in terms of total score. However, girls did significantly outperform boys on the written portion of the social PAT, t(1, 340) = −4.56, p < .001. Last, the girls outperformed boys on the science PAT in terms of total score, t(1, 343) = 2.13, p < .05. In this case, their science knowledge was significantly greater than the boys, t(1, 343) = 2.89, p < .05, although there was no significant difference between genders for science skills.
Predictive Validity of SMALSI
A SEM was performed to assess predictive validity of SMALSI subscales. Table 6 presents goodness-of-fit information of SEM models, where SMALSI subscales were set as predictors of each PAT subject area. The PAT in Tables 6 and 7 is a latent variable, where the four subject areas (i.e., LA, math, social, and science) were considered as its indicators. Results in Table 6 suggest not very good model fit in terms of CFI/TLI for all models. Although RMSEA values are showing a good fit, this doesn’t warrant overall acceptable model fit. This finding is in line with CFA results. Regression coefficients for each SEM model in addition to estimated R2 are presented in Table 7. There are some consistent patterns of significant regression coefficients. The Study Skills (STUDY), Note-Taking and Listening Skills (NOTE), Reading and Comprehension Skills (RCOMP), Writing and Research Skills (WRITE), Time Management and Organizational Techniques (TORG), and INATTN subscales are not significant predictors of individual subject areas of PAT. The TANX is a significant predictor for all four subject areas and PAT as overall academic achievement. Science is the only subject area that has only one significant predictor (i.e., TANX) but other subject areas have two significant predictors except math which has three significant predictors. As for PAT, there are four significant predictors (i.e., WRITE, Test Taking Skills (TTAKE), LOMOT, and TANX). The INATTN subscale was a significant predictor only for math. The R2 values range from .291 for science to .5 for PAT. The social studies has the highest R2 among subject areas with a value of .496. These findings were expected due to the high intercorrelations among some SMALSI subscales.
Fit Indices of SEM Analysis on Predictive Validity of SMALSI.
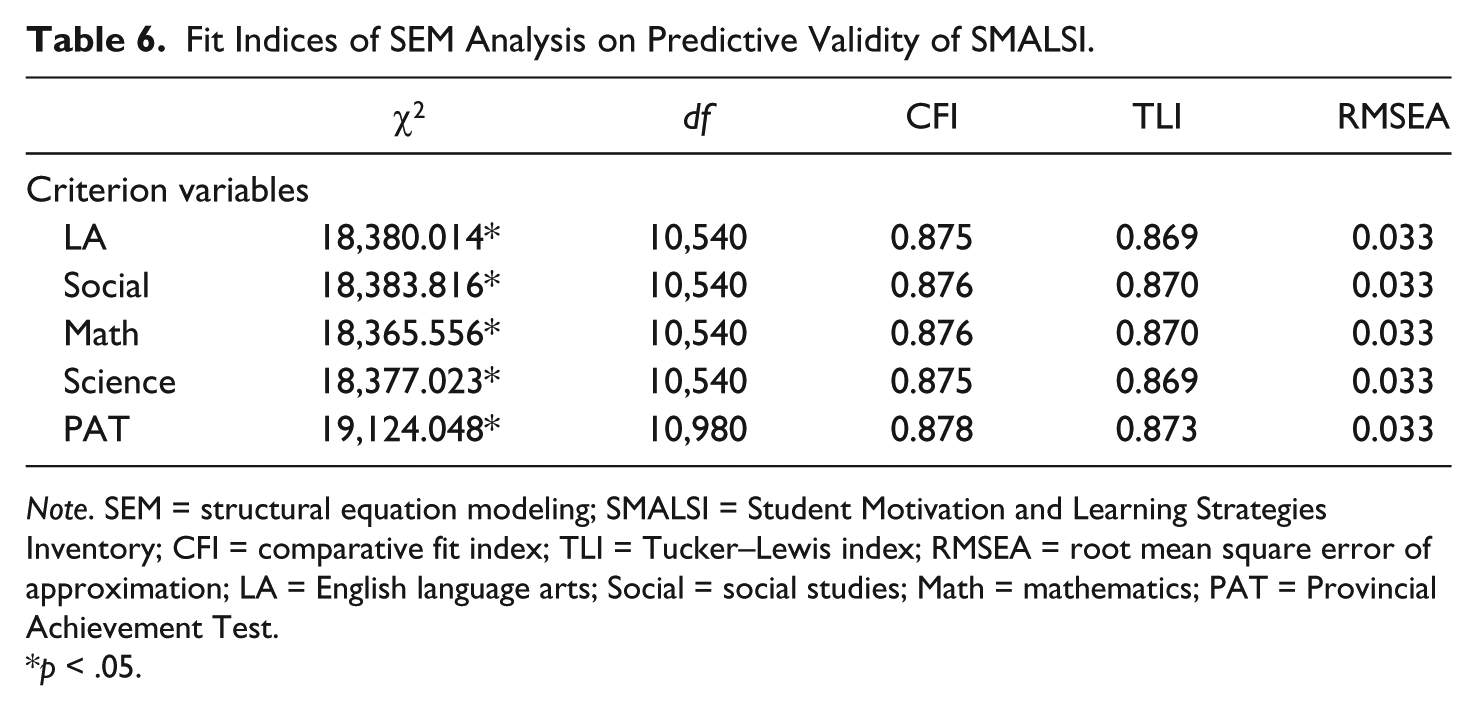
Note. SEM = structural equation modeling; SMALSI = Student Motivation and Learning Strategies Inventory; CFI = comparative fit index; TLI = Tucker–Lewis index; RMSEA = root mean square error of approximation; LA = English language arts; Social = social studies; Math = mathematics; PAT = Provincial Achievement Test.
p < .05.
Results of Predictive Performance SMALSI Subscales of Academic Achievement.
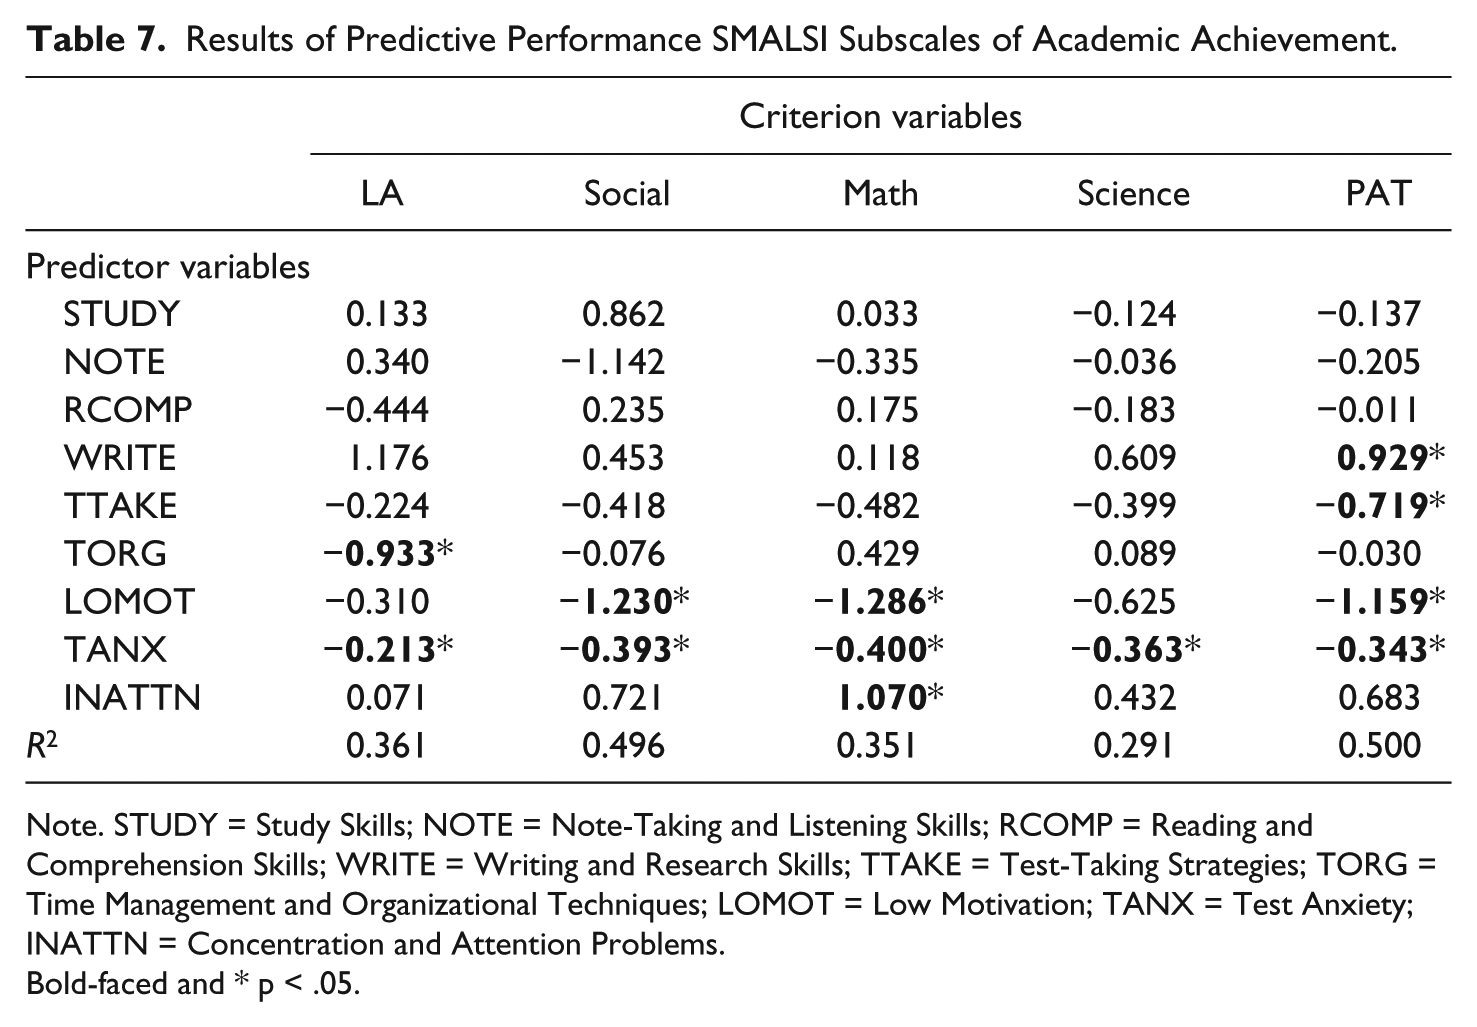
Note. STUDY = Study Skills; NOTE = Note-Taking and Listening Skills; RCOMP = Reading and Comprehension Skills; WRITE = Writing and Research Skills; TTAKE = Test-Taking Strategies; TORG = Time Management and Organizational Techniques; LOMOT = Low Motivation; TANX = Test Anxiety; INATTN = Concentration and Attention Problems.
Bold-faced and * p < .05.
Discussion
This study provided the first independent investigation of the psychometric properties of an instrument that measures student motivation and a broad range of learning strategies. The variables assessed by the SMALSI have always been considered important to school achievement; however, there are few instruments that cover such a broad range of learning strategies and assess these in both elementary and secondary students (Stroud & Reynolds, 2006). The current study was able to establish the content, criterion, and convergent validity of the SMALSI in relation to achievement with a Grade 6 sample.
Internal consistency of test items ranged from .76 to .92 for each subtest. The lowest coefficient was for the Writing and Research subtest (.76) and this is considered “acceptable” while the remaining were “good to excellent” (Cronbach & Shavelson, 2004). Cronbach’s alpha coefficients and split half coefficients were as high as, or higher than, those reported within the test manual. This shows that the SMALSI is generally a reliable instrument for both U.S. and Canadian samples in Grade 6.
Regarding the content and construct validity, CFA generally demonstrated inadequate initial support for each of the individual constructs and for the overall model. Generally, the reasons for the poor fit related to the high covariance among various items that were quite similar in content and some items that had low to very low factor loadings. The model fit was substantially improved when the model permitted item pairs of very similar content to covary. However, there were also several items that showed poor fit to the model as evidence by low factor loading (i.e., below .4). This included an item on study skills about taking breaks when studying (No. 33), an item on reading comprehension about using your finger when reading (No. 57), and an item on LOMOT about needing good grades to get a job (No. 22). These items may be suspect and the authors may wish to reconsider their inclusion in subsequent revisions.
Also, the Note-Taking and Listening scale had the worst model fit and did not reach acceptable limits even after attempting to covary items with similar content. The revised CFA revealed that a two-factor solution resulted in a better initial fit and, after covarying similar items, was able to reach acceptable limits. In this case, the results seem to support that note-taking and listening are actually two individual yet related constructs as represented by the items on this test. The cognitive task of listening has defied definition and measurement but it is clear that it requires attention, verbal comprehension, as well as short-term, long-term, and working memory resources (Bostrom & Waldhart, 1980). Note-taking, in contrast, is an output function and requires abilities like handwriting speed, along with working memory and language comprehension skills (Peverly et al., 2013). The new CFA, with a two-factor solution certainly supports viewing the items on the SMALSI for these constructs as representing two constructs rather than a unitary construct. The poor fit to the model for the initial CFA also suggests that the construct validity for this scale may be insufficient. On the contrary, this scale did show a moderate but significant relationship with achievement variables although it did not contribute significantly to the prediction in SEM.
Regarding the relationship of SMALSI subscales to achievement, we found that a majority of the SMALSI subscales were moderately and significantly correlated with measures of achievement such as the PAT. The highest magnitude correlates were observed between mainly the Liabilities factors and the various PAT results. This means that low achievement is related to lower academic motivation, higher TANX, and more INATTN among Grade 6 students. TANX in particular was revealed as a strong predictor of achievement across LA, social, math, and science. Other researchers have shown that TANX hinders students’ ability to clearly answer questions and negatively affects performance (Cassady & Johnson, 2002; Hong et al., 2006). Our results are not surprising as several other studies have confirmed a strong relationship between achievement and motivation, (Henderlong, McClintic-Gilbert, & Hayenga, 2009; Yu & Patterson, 2010), TANX (see Bodas & Ollendick, 2005), and INATTN (see Fletcher, Lyon, Fuchs, & Barnes, 2007).
Motivation is defined broadly in the literature with distinctions made between such things as intrinsic and extrinsic motivation (Harlen & Crick, 2003; Ryan & Deci, 2000). Within the SMALSI, motivation is broadly defined as “the desire to acquire information” (Stroud & Reynolds, 2006, p. 9) and as reflecting “a student’s investment in the process of learning” (p. 9). The authors do not strongly link their model of motivation to any of the dominant models of motivation such as self-determination theory (Ryan & Deci, 2000). The test authors suggest that the student’s own attributions for success and failure, their specific achievement goals, and how they perceive incentives are all part of academic motivation. When examining the item content of the scale, it seems apparent that the authors include aspects of both intrinsic and extrinsic motivation. There does not seem to be a strong link to self-efficacy on this scale. Rather, items seem more linked to attitude to school (e.g., No. 133, I don’t like to come to school). Despite the weak linkage of the SMALSI motivation scale to dominant models or theories of motivation, our study confirms the utility of this measure of a student’s academic motivation in that it relates strongly to achievement. In particular, social studies and math performance was significantly predicted by motivation. Those low in motivation (i.e., T score >40) are much more likely to experience achievement failure in all subject areas.
Based on our SEM analysis, the combination of low motivation and high TANX is predictive of a high incidence of achievement failure within our sample, especially in social studies and math. This suggests that the LOMOT and TANX subscales might be the first place that school intervention specialists should look to identify students at-risk for achievement failure. At least this was certainly supported in our findings for Grade 6 students. Our findings also suggest that interventions that focus on motivation and on reduction of TANX might be the first place to address self-identified liabilities among students. Toward this end, there is a manual to accompany the SMALSI, which reports to include evidence-based methods to address motivation along with the other SMALSI subscales (Vannest et al., 2011).
Regarding the relationship of strengths factors to achievement, our results demonstrated that the Strengths factors of the SMALSI were significantly correlated with measures of achievement. This implies that problems in any of these measures may indicate a possible risk for low achievement. In this sample, SEM revealed that Writing and Research and Test-Taking Skills were both significant predictors of the latent PAT variable. The test authors define Writing and Research as “the ability to gather information from a variety of resources, develop an organized plan, integrate ideas, make appropriate revisions, and complete increasingly complex research tasks . . . ” (Stroud & Reynolds, 2006, p. 8). Examination of test items reveals that finding information in the library is also included in this construct. Test-taking skills are behaviourally defined and involved things like allocating time during testing, eliminating unlikely choices in multiple-choice tests, and reviewing answers (Stroud & Reynolds, 2006). The SMALSI Test-Taking Skills subscale includes time-use strategies, error avoidance through review, and using deductive reasoning. As achievement is primarily determined through various tests, it is clearly important to understand student’s skills in this area and to provide opportunities to develop these skills (Vannest et al., 2011). For example, learning-disabled individuals who use test-taking strategies do better on exams, measured by test performance grades over those who do not (Carter et al., 2005; Holzer, Madaus, Bray, & Kehle, 2009; Kretlow, Lo, White, & Jordan, 2008).
Reading Comprehension on the SMALSI is actually more about reading strategies that promote comprehension rather than the student’s perception of their comprehension ability per se. The authors argue that comprehension strategies are “arguably the most important” (Stroud & Reynolds, 2006, p. 8) of the learning strategies for academic success. Although our results would concur that reading comprehension strategies on the SMALSI is correlated with achievement measures, the SEM did not suggest a strong predictive influence on achievement. Possibly, the strong intercorrelation between RCOMP and the other strength scales (r = .82 or higher) can account for the lack of contribution to the model. The finding that reading comprehension does not have significant relationship with math has been reported elsewhere (Imam, Abas-Mastura, & Jamil, 2013).
The test authors note that gender differences are usually observable in terms of study habits, motivation, INATTN, and TANX (C. R. Reynolds & Kamphaus, 2004; C. R. Reynolds & Richmond, 1985). They note that it should be expected that girls tend to self-report significantly better study habits, learning strategies, motivation, and fewer INATTN than boys (Stroud & Reynolds, 2006). They also note that most research will show that girls tend to report significantly more problems with anxiety than boys. The present research confirmed these gender differences in our sample. This supports the idea that SMALSI subscales are sensitive to gender differences. The test authors argue that although gender differences are significant, there is little clinical utility in examining these differences as the overall magnitude of the difference is so small. In our sample, the differences between genders were as high as T = 4.92 (e.g., Study Skills) which is nearly a half a standard deviation. Thus, gender differences may need to be considered or calculated and this is not currently possible with the SMALSI scoring software.
Conclusion
Overall, the SMALSI is a test that demonstrates good reliability and demonstrates some relationship with achievement. The TANX subscale, in particular, seems to have a consistent and important relationship with all aspects of achievement. However, our CFA also shows that the SMALSI had poor model fit. This poor fit can best be explained by high covariance among subscales, among items within subscales, and items that have poor factor loadings. This test shows some promise in terms of providing a self-report tool that includes aspects of student strengths, motivation, TANX, and INATTN. However, further analysis and test refinement could improve this measure.
Limitations
This study did have some important limitations. First, this study was only with a Grade 6 urban sample of Canadian children in Alberta. Thus, it is not certain whether the relationships between these SMALSI subscales would hold true with other age groups or with samples from other provinces, nations, or with a more rural sample. This would be a matter for future research. We did not include any concurrent measures of motivation or other concurrent measures of the other constructs of the SMALSI. This would have permitted further analysis of the content and construct validity of these measures. This is certainly recommended for future research.
Footnotes
Acknowledgements
The authors thank the Board, staff, and students of the Red Deer Public School Division for their support in making this research possible.
Declaration of Conflicting Interests
The author(s) declared no potential conflicts of interest with respect to the research, authorship, and/or publication of this article.
Funding
The author(s) received no financial support for the research, authorship, and/or publication of this article.