
Abstract
Objective:
Currently, there are no objective metrics included in the intensive care unit (ICU) discharge decision making process. In this study, we evaluate Rothman Index(RI) data for a possible metric as part of a quality improvement project. Our objectives were to determine whether RI could predict adverse events occurring within 72 hours of ICU discharge decision, the optimal clinical cutoff value for this metric, and to determine whether there is a relation between the RI warning alert 24 hours prior to discharge and adverse events postdischarge.
Design:
Retrospective observational study.
Setting:
Single center tertiary hospital.
Patients:
Adult medical ICU patients discharged from the ICU between January 20, 2015 and March 14, 2015.
Interventions:
None.
Measurements and Main Results:
A total of 194 patients were studied with mean age of 62.74 (18.37) years. Data collection included RI at the time of decision-making for ICU discharge and the presence of any warning signals in the previous 24 hours. A 72-hour follow-up chart review recorded any adverse events, including readmission to a higher level of care, discontinuation of discharge due to clinical status change, emergency department visit if discharged home, rapid response activation, or cardiopulmonary arrest postdischarge. Adverse events after ICU discharge were observed in 31 (16%) patients with 9 events being ICU readmission (4.6%). Based on an age-adjusted multivariate model, a higher RI was associated with lower odds of an adverse event (odds ratio [OR] = 0.969, P = .006, confidence interval [CI]: 0.9487-0.9911). An RI value ≥ 50 was associated with 72% lower odds of an adverse event (OR = 0.2887, 95% CI = 0.1278-0.6517 and P = .003) compared to RI < 50. This RI cutoff value was associated with the largest decrease in odds of events. As expected, patients with a very high-risk warning alert had a higher proportion of adverse events compared to patients who did not. (31.75% vs 12.65%, P = < .02).
Conclusions:
Patients who have an RI < 50 or a very high-risk warning alert have a higher risk of adverse events postdischarge from the ICU. Rothman Index may be a useful metric for ICU discharge decision-making.
Introduction
The ICU admission, discharge and triage (ADT) guidelines on optimal criteria and timing for ICU discharges is based on ungraded best practice recommendations. 1 Premature discharge of patients from medical and surgical intensive care units (ICUs) can lead to readmission, which occurs at a rate averaging 7% 2,3 and is associated with higher hospital mortality. 3 Length of stay for these readmissions is, on average, 2 to 3 times longer than the original ICU stay. Even if not readmitted, patients prematurely discharged are susceptible to other adverse outcomes, such as clinical deterioration or cardiopulmonary arrest. Conversely, a delay in ICU discharge causes less efficient use of hospital resources and delays admissions for other critical patients. Therefore, it is important to have standard and accurate guidelines to determine the length of ICU stay and to have metrics that predict the occurrence of adverse events after ICU discharge, which are key quality indicators that hospitals strive to minimize. These metrics would take into account the severity of illness and unstable vital signs at the time of ICU discharge, but there is no agreement on how to make optimal use of these factors.
The Rothman Index (RI) is an acuity metric that provides a clinical snap shot of a patient at any given time but also trends over a period of time regardless of disease processes. The RI is unique in incorporating 26 variables, including physiological measures, clinical assessments, and laboratory results into one composite index ranging from negative values to 100 (Table 1). 4,5 The RI can then be graphed as a function of time, continuously incorporating new information as it is updated on the electronic medical record (EMR) to display it in a manner that is easy to understand and communicate. The resulting graph is segmented into 3 color zones which represent acuity of illness. The blue zone represents least acuity (RI > 65), yellow indicates moderate acuity (RI = 41-65), and red represents high acuity of illness (RI < 40). Data are represented by a dot on a vertical axis, posted hourly as new results are entered into the EMR. There is also a graded warning alert system that advises for escalation of clinical care. Medium risk warning alert is fired when RI drops more than 30% in less than 6 hours, high alert for greater than 50% in less than 24 hours and finally very high alert for RI absolute value of less than 20. A representative graph of an RI trend is displayed in Figure 1.
Variables That Are Inputs to the Rothman Index Score.a
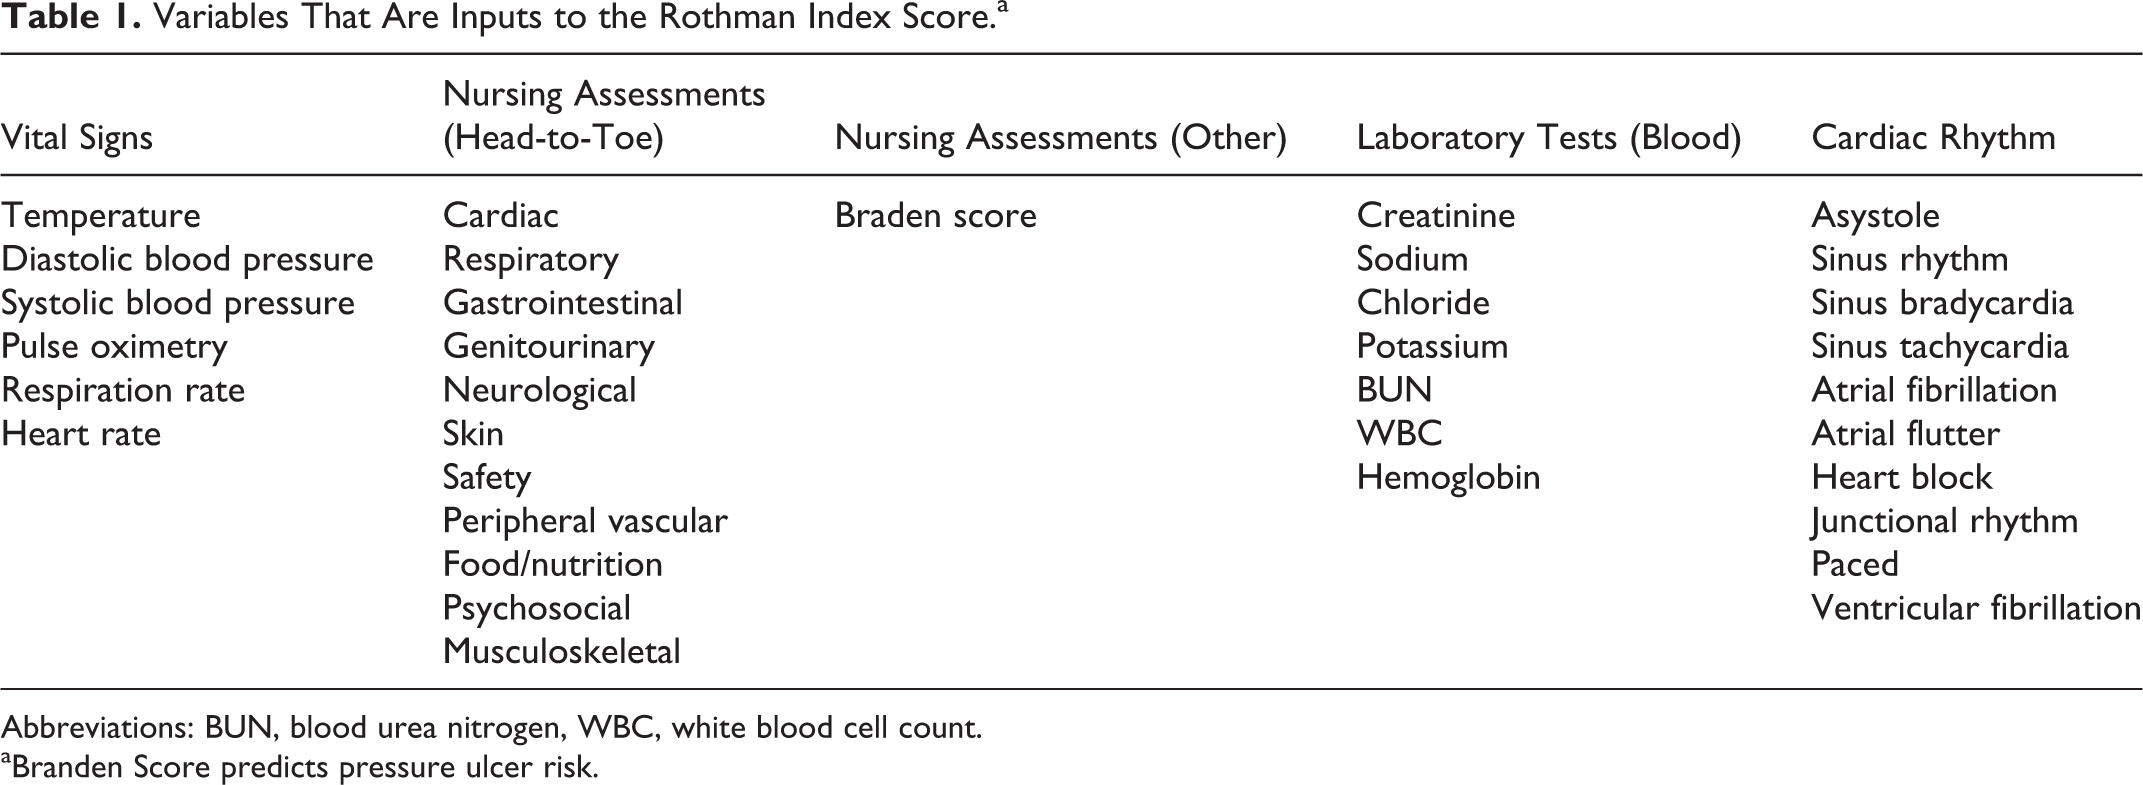
Abbreviations: BUN, blood urea nitrogen, WBC, white blood cell count.
aBranden Score predicts pressure ulcer risk.
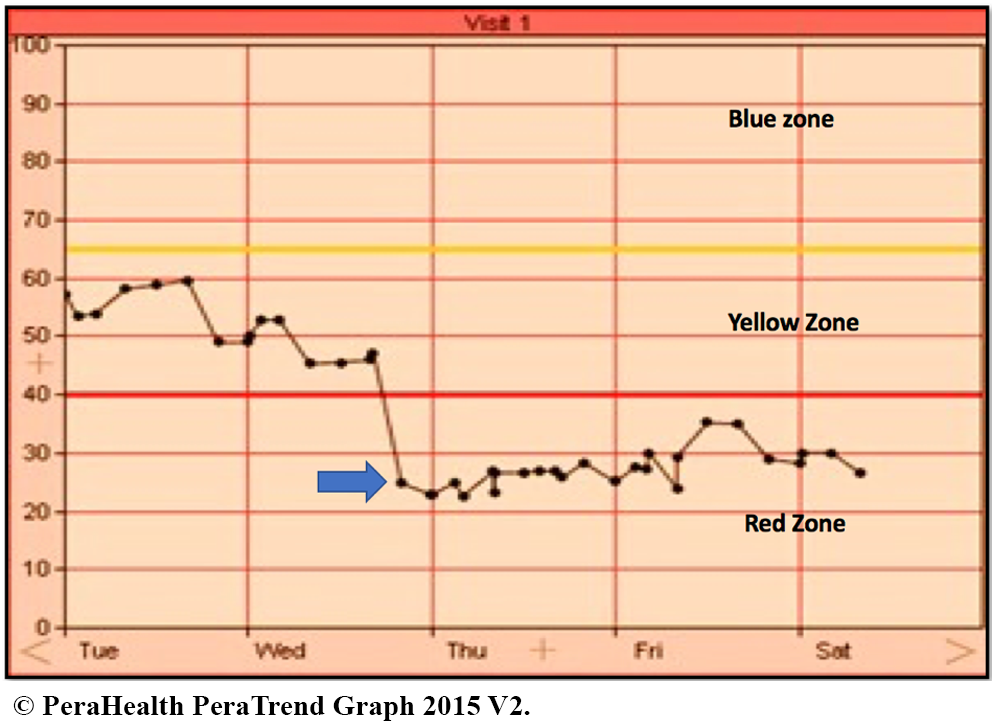
This graph represents a patient’s Rothman Index that has trended down from higher scores in the yellow zone to the red zone over a period of 2 days. The arrow represents a warning signal that would appear on the graph displaying the sudden drop in the RI of >20% over a short period of time.
In a study by Finlay et al, evaluating RI versus Modified Early Warning Score, RI demonstrated superior discrimination of 24-hour mortality. 6 Rothman Index also correlates with APACHE III (Acute Physiology, Age, Chronic Health Evaluation) in the ICU. 5 While RI is primarily used for escalation of clinical care when there is a drop in the index, its use for the ICU discharge decision process is not routine. In the study by Bradley et al, RI was strongly associated with unplanned readmission within 30 days of hospital discharge. 7 In a surgical ICU study, readmitted patients had more variable RI trends from ICU admission to ICU discharge, and 40.74% of readmitted patients actually had a decreased RI score at the time of discharge. 8
The goals for our study were to analyze retrospective data of daily ICU discharges in relation to RI status and 72-hour event rates and determine whether RI and RI warning signals 24 hours prior to ICU discharge were reliable predictors of adverse events. Other aims of the study were to find a clinical cut point for the RI that can predict these events and estimate preventable events defined as an event which has an RI warning signal 24 hours prior to ICU discharge.
Materials and Methods
Patients transferred out of the medical ICU (MICU) between January 20 and March 14, 2015 were included. Death of a subject while in the MICU and hospice discharges were excluded, as these discharges are not at risk of readmission to the ICU. As part of quality improvement, the following data were collected: age, gender, co-morbidities, RI at the time of ICU discharge decision, RI zone, and any warning alerts in the prior 24 hours. A chart review 72 hours after ICU discharge decision was done to record any adverse events and was used as the primary outcome of this study. The types of events recorded were readmission to ICU or higher level of care (intermediate care unit), aborted discharge determined by the discharge orders discontinued by providers due to clinical status change while patient physically remained in ICU, emergency department visit to the same institution if patient discharged home, rapid response service activation post ICU discharge, and cardiopulmonary arrest post-ICU discharge. In order to make this study more sensitive, the aborted discharge was included as an adverse event, as a clinical decision for discharge has already occurred, and if timely resources were available, logistically the patient could have been placed in a non-ICU bed. Hence, a clinical status change after the discharge decision would have triggered any of the other events mentioned above in this situation. Our study was approved by the institutional review board, and they waived the need for informed consent.
Statistical Analysis
Continuous variables were calculated as means (standard deviation) and categorical variables as frequencies (percentages). Tests for group differences were based on χ2 (Fisher exact test) for categorical variables and the t test for continuous variables. To estimate crude association between each factor and event within 72 hours, a univariate logistic regression analysis was conducted for each predictor variable. The following variables were considered as possible predictors: age, number of comorbidities, and the Rothman Index. Variables with a P value of < .20 in the univariate logistic regression analysis were entered into a multivariate model. All statistical analysis was conducted using STATA version 14 (College Station, Texas) and P < .05 was considered significant.
Results
A total of 219 patients were initially evaluated in this study. Twenty-one of these patients were excluded from further analysis, as they were discharged to hospice or palliative care settings and not exposed to the outcome of our study. Four of the 219 patients did not have complete data available and hence were also excluded in the study (Figure 2).
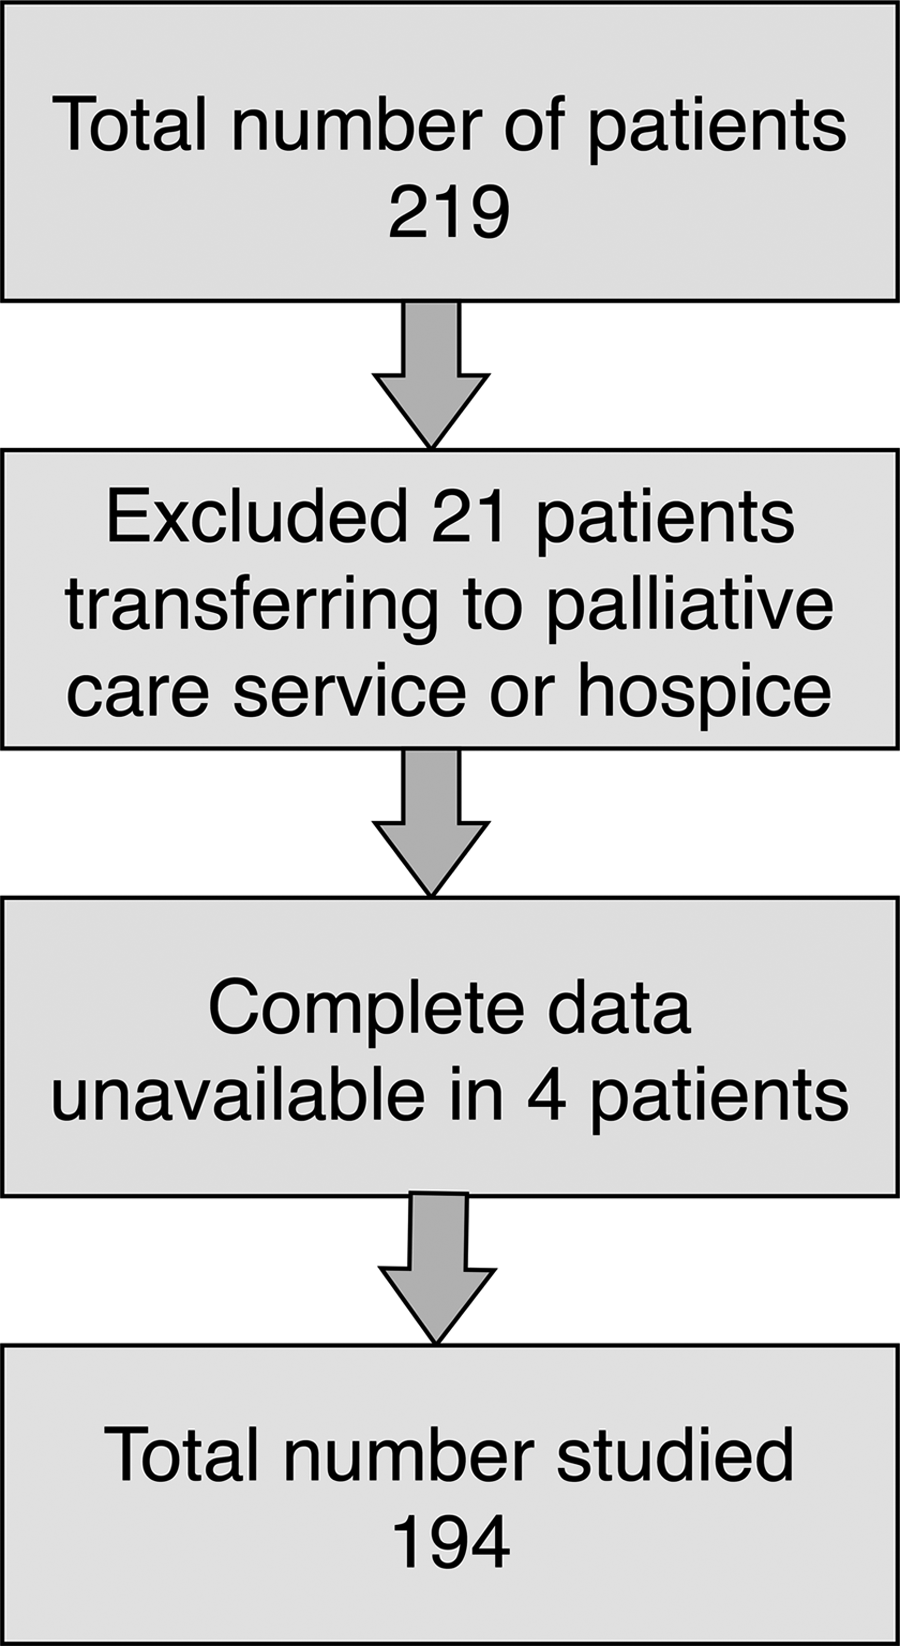
Flow of patients in analysis of Rothman Index data to predict post discharge adverse events.
One hundred and ninety-four patients were included in the analysis with mean age of 62.74 (18.37); 50.68% males and the mean RI at the time of ICU discharge was 55.23 (18.82). A warning signal was present in 64 (33%) patients in the 24 hours prior to discharge decision, 17 with medium risk, 20 with high risk, and 27 with very high-risk signals. Further charateristics of the study population is as detailed in table 2. Adverse events after ICU discharge were observed in 31 (16%) patients with 9 events being ICU (4.6%) readmission (Supplemental appendix). Patient distribution in the RI zones at the time of ICU discharge is shown in Figure 3. Sixteen of the 31 patients with adverse events had a warning signal in the 24 hours prior to ICU discharge. Based on an age-adjusted multivariate model, a higher RI was associated with lower odds of an adverse event (odds ratio [OR] = 0.969, P = .006, confidence interval [CI] 0.9487-0.9911). For every 5-unit increment in the RI, the odds of having an adverse event was lowered by 15%. An RI value ≥ 50 was associated with 72% lower odds of an adverse event (OR = 0.2887, 95% CI = 0.1278-0.6517, and P = .003) compared to RI < 50. This RI cutoff value was associated with the largest decrease in odds of events. As expected, patients with a very high-risk warning alert had a higher proportion of adverse events compared to patients who did not (31.75% vs 12.65%, P = .02).
Patient Characteristics.
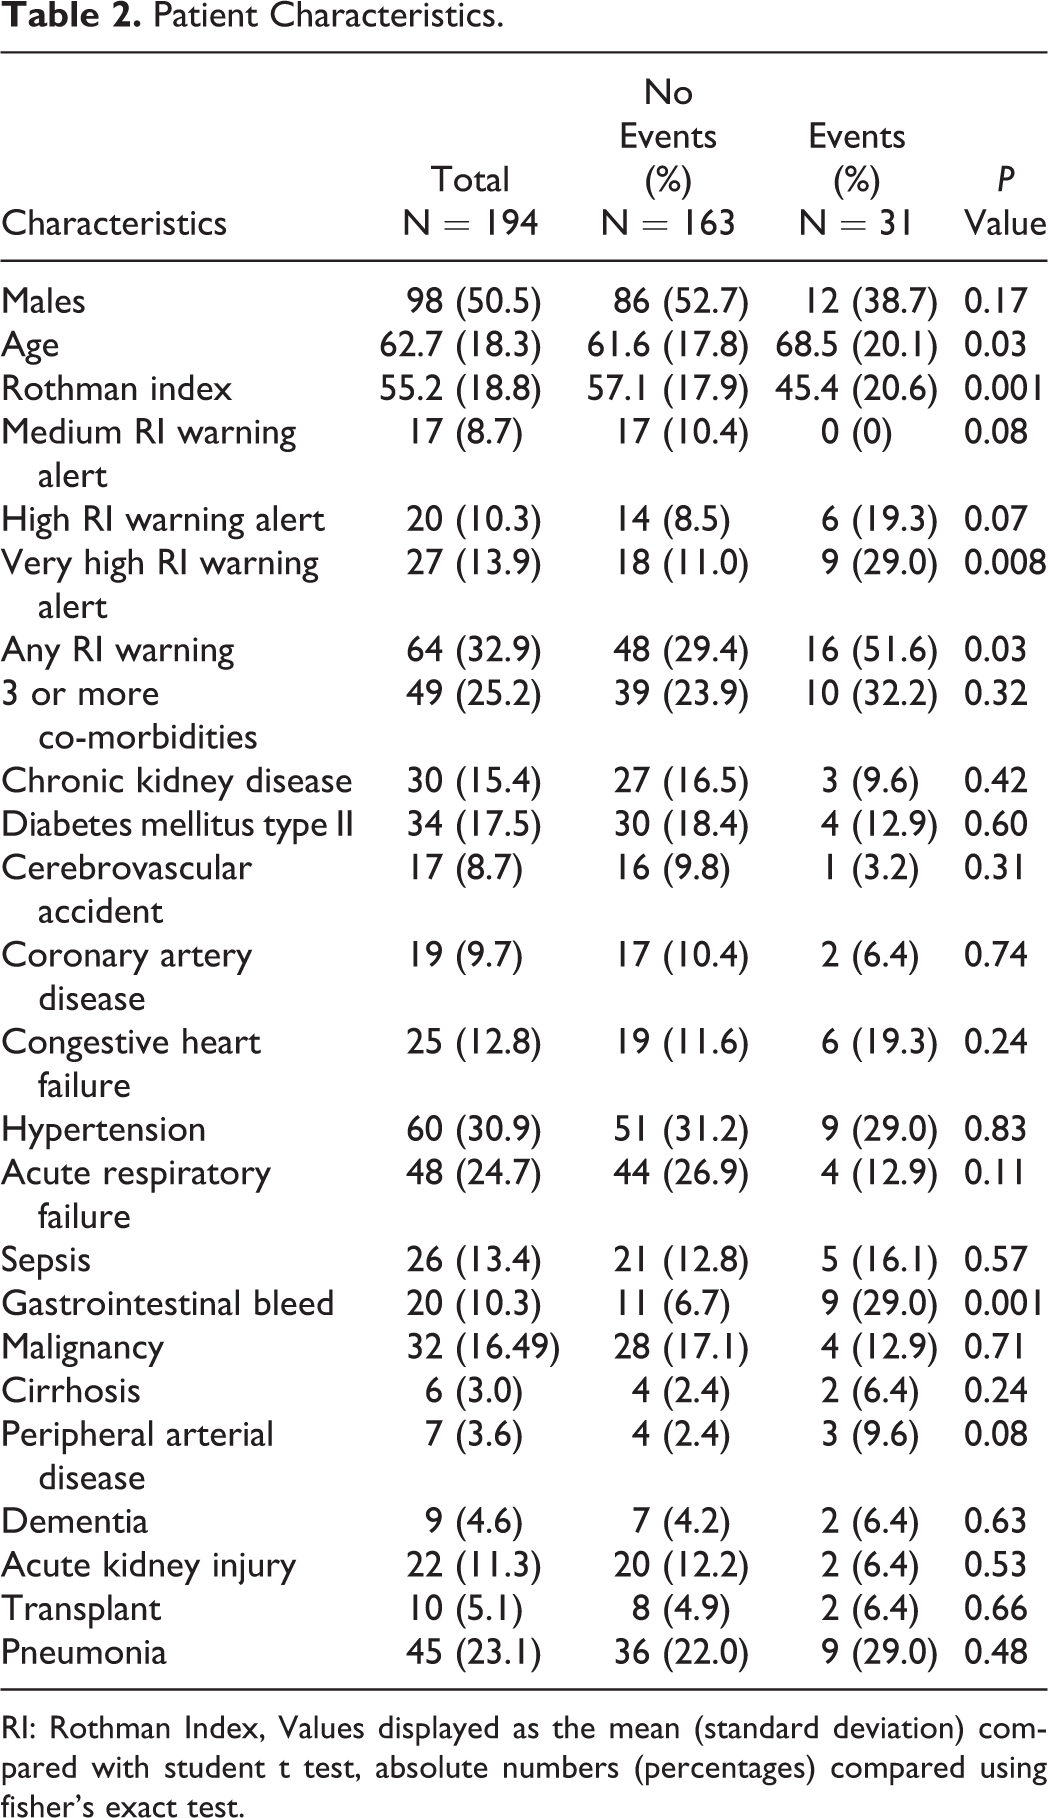
RI: Rothman Index, Values displayed as the mean (standard deviation) compared with student t test, absolute numbers (percentages) compared using fisher’s exact test.
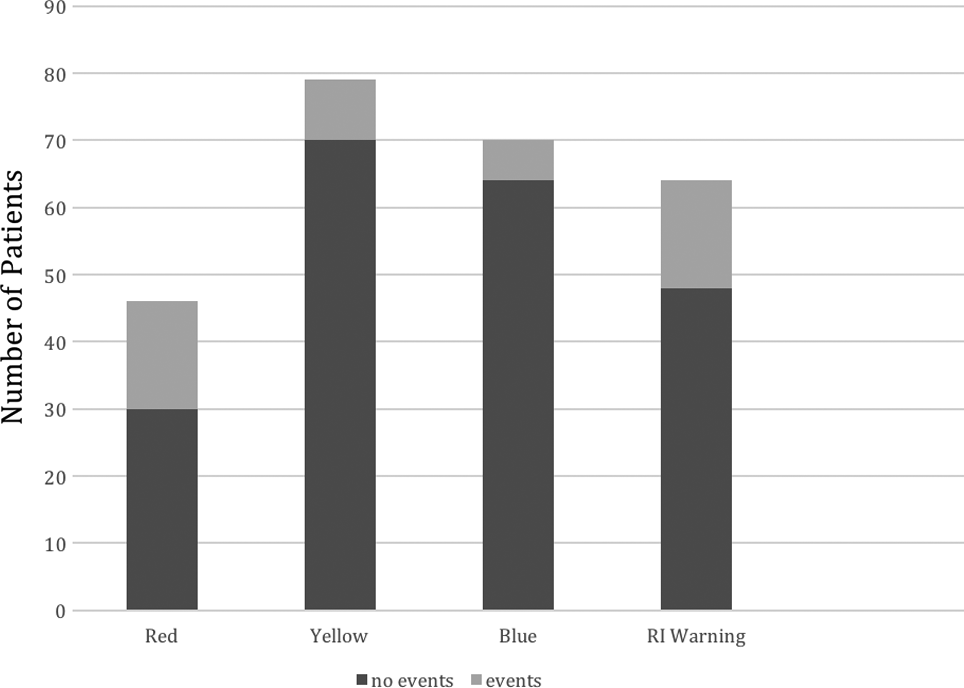
Patient distribution over the Rothman Index zones.
Discussion
From this study, we determined that RI data are useful in the ICU discharge decision-making process. When RI trends down a warning alert occurs, indicating a higher risk of adverse events, as seen in our cohort with 16 of the 31 patients having these alerts. This raises the possibility of prevention of the resulting adverse events if the alerts were acted on. If interventions led to improvement of the clinical condition, adverse events could potentially be preventable 50% of the time. Although we determined that an RI cutoff point of 50 is a good indicator of potential adverse events, and especially readmissions, we do not have enough data to ascertain the effects of solely using RI for the ICU discharge decision-making process. In their study of a surgical population by Piper et al, 8 they found that a score less than 82.90 correlated with readmissions, while our study found 50 as a clinical cut point. This can be explained by the fact that our patient population was medical patients with higher acuity. Retaining a patient in the ICU until their score reaches such a high level may be unachievable and unreasonable as it could extend the ICU length of stay unnecessarily. There could also be clinical circumstances that preclude patients from being discharged from the ICU despite a good RI score. Hence, we suggest that RI be used as an adjunct to clinical assessment for the ICU discharge decision-making process.
Resource utilization of critical care beds can be challenging both up and down stream in relation to admissions to ICUs as well as availability of general ward beds for ICU discharges. Even when there is a delay in the availability of a ward bed, there is a risk of prolonged hospitalization. 9 Premature discharges from the ICU lead to increased readmission rates as well as significantly impact on mortality. 10 Several key measures and benchmarks have been investigated for making this clinical decision, such as the APACHE IV with new variables added to the APACHE III. While it can provide ICU length of stay predictions, the accuracy and utility is limited for individual patients. 11 Hence, we believe that RI may hold promise here.
There are several limitations in our study. First, this was a single-center observational study in an adult MICU, and results may not be generalizable to other ICU patient populations. Second, RI was initially designed for predicting clinical deterioration 6 and assessment of acuity and mortality risks, 12,13 but its use for ICU discharge decision-making has yet to be validated. Regardless, there is no current scoring system in use to prevent readmissions, and RI shows promising results. More evidence in the form of randomized trials comparing ICU discharges based on clinician decisions and RI-supported decisions is needed. This enhanced decision-making process will have to be specific to various ICU populations.
Conclusion
Timely ICU discharges and preventing ICU readmissions and adverse effects is a key aspect in caring for critically ill patients. No definitive guidelines exist to this date that is reliable and reproducible. Rothman Index could potentially be used to support the ICU discharge decision-making process, but further research is needed to extend the results of our study.
Supplemental Material
Supplemental Material, Supplementary_appendix - Analysis of Rothman Index Data to Predict Postdischarge Adverse Events in a Medical Intensive Care Unit
Supplemental Material, Supplementary_appendix for Analysis of Rothman Index Data to Predict Postdischarge Adverse Events in a Medical Intensive Care Unit by Deepa Bangalore Gotur, Faisal Masud, Jaya Paranilam and Janice L. Zimmerman in Journal of Intensive Care Medicine
Footnotes
Acknowledgments
The authors acknowledge Johnique Atkins, PhD, Senior Scientific Writer, Department of Heart Center Research Administration, Houston Methodist Research Institute for help in editing and formatting the manuscript.
Declaration of Conflicting Interests
The author(s) declared no potential conflicts of interest with respect to the research, authorship, and/or publication of this article.
Funding
The author(s) received no financial support for the research, authorship, and/or publication of this article.
Supplemental Material
Supplemental material is available for this article online.
References
Supplementary Material
Please find the following supplemental material available below.
For Open Access articles published under a Creative Commons License, all supplemental material carries the same license as the article it is associated with.
For non-Open Access articles published, all supplemental material carries a non-exclusive license, and permission requests for re-use of supplemental material or any part of supplemental material shall be sent directly to the copyright owner as specified in the copyright notice associated with the article.