
Abstract
In this study, we used electrical impedance spectroscopy (EIS) to analyze dispersion and distribution states of CNT conductive nanoparticles in poly(butylene adipate-co-terephthalate) PBAT. We also used field-emission scanning electron microscopy (FE-SEM), Raman spectroscopy, and rheology along with EIS, to investigate how CNT surface chemistry affects dispersion and electrical response in PBAT/CNT nanocomposites. PBAT nanocomposites containing 1.5 vol% of pristine CNTs, hydroxylated CNTs (CNT-OH), or carboxylated CNTs (CNT-COOH) were prepared by melt mixing. FE-SEM and Raman analyses showed considerably better dispersion for the PBAT/CNT-COOH sample. Rheological measurements further supported this observation; the rheological Cole–Cole plots of the PBAT/CNT-COOH composite exhibited a pronounced tail at low frequencies, indicative of strong CNT–polymer interactions and the formation of a bound polymer layer. The EIS results revealed a cutoff frequency of 70 Hz for PBAT/CNT-COOH, compared to 403 Hz for the other samples which implies that CNT interparticle distance is larger in the former. Fitting the Nyquist data with a modified Randles circuit yielded a parallel resistance of 694 Ω for PBAT/CNT-COOH, whereas the other two composites exhibited a considerably lower resistance of approximately 70 Ω. We attribute these electrical and rheological signatures to stronger interactions between COOH groups of CNT and ester groups of PBAT, which promote the adsorption of a bound polymer layer around the nanotubes. This interfacial layer effectively increases the average interparticle distance and polymer interlayer thickness, leading to higher electrical resistance and reduced capacitance. These findings of EIS are applied to the behavior of the whole bulk of the nanocomposite while other methods such as SEM only characterize tiny limited areas of the samples. The dispersion state, interparticle distance, bond polymer layer on CNTs and several electrical properties are detectable by EIS which all are the bulk characteristics of conductive polymer nanocomposites.
Introduction
Conductive polymer composites have versatile applications in industrial sector, including energy storage, electromagnetic interference (EMI) shielding, and electrostatic discharge.1–3In parallel, owing to growing concerns over electronic waste (e-waste), there has been an increasing academic focus on biodegradable polymers, such as polyethylene glycol (PEG), polylactic acid (PLA), and polybutylene adipate terephthalate (PBAT). 4 Among them, PBAT has been found to have superior mechanical properties, primarily because of its appropriate elongation at break compared to other biodegradable counterparts such as PLA, 5 making it a potential material for biodegradable conductive composites and their use in wearable electronic applications.6,7 Consequently, PBAT-based conductive composites have recently attracted significant attention from the research community.8–10
Many factors influence the final physical and mechanical characteristics of biodegradable conductive composites, including the dispersion level of the conductive particles within the polymer matrix. In this regard, a study focused on graphene nanoplatelets (GNPs) in two biodegradable polymers, PLA and PBAT, revealed that above the percolation threshold, PLA/GNP exhibited higher electrical conductivity than PBAT/GNP, despite having a poorer dispersion level. This result was attributed to agglomeration-induced improvements in the creation of conductive pathways within the PLA matrix. 11
Recently, it has been shown that the dispersion quality of SWCNTs in a PBAT matrix—which is significantly affected by melt-processing conditions—controls the rheological and conductive properties of the resulting nanocomposites. More specifically, higher temperatures (190°C) and higher mixing rates (200 r/min) led to significantly enhanced SWCNT dispersion, as revealed by scanning electron microscopy. This enhanced dispersion caused an increase in the solid-like rheological response, a significant reduction in the rheological percolation threshold to $0.18$ wt%, and an increase in the apparent yield stress. Notably, optimized SWCNT dispersion led directly to significantly enhanced direct current (DC) electrical conductivity, characterized by a reduced electrical percolation threshold of 0.45 wt%. 12
The rapid accumulation of electronic waste presents a significant environmental challenge, driving the need for sustainable materials in electronic manufacturing. By utilizing biodegradable PBAT (polybutylene adipate terephthalate) composites, we can create eco-friendly alternatives to traditional, non-degradable plastics. To make these materials viable for widespread industry use, it is critical to optimize both their processability and electrical conductivity. Successfully refining these properties will enhance the large-scale manufacturing of biodegradable electronics, offering a practical and scalable solution for mitigating global e-waste.
To optimize these rheological and electrical properties, we must evaluate the parameters that influence them. A critical factor in this regard is the state of dispersion and distribution of the conductive particles. In fact, in a system with well-distributed conductive particles, or when the distribution state remains constant, an improved dispersion of nanoparticles results in a lower percolation threshold and higher conductivity. Conversely, at a constant dispersion level, a decrease in the distribution uniformity—or an increase in the segregation of the conductive particles—also leads to a lower percolation threshold and higher electrical conductivity. 13 This trend has been exploited by developing immiscible polymer blend conductive composites or by using foaming techniques to benefit from segregation, which leads to very low percolation thresholds. This is widely known as the double percolation phenomenon.14–19 Double percolation occurs as the result of volume exclusion of conductive particles through blending immiscible polymer blends or foaming a polymer both containing conductive particles. 20
Manipulating dispersion by altering processing conditions presents several practical limitations and disadvantages. For instance, higher temperatures and prolonged mixing times can induce polymer degradation, particularly in biodegradable polymers. 21 Another approach, in addition to altering processing conditions, involves modifying the surface chemistry of the conductive particles by incorporating various functional groups, which can affect dispersion state. 22
Variations in the dispersion state resulting from changes in surface chemistry are more difficult to detect than those controlled by varying processing conditions; therefore, a sensitive analytical technique is required to identify these subtle differences. Electrical impedance spectroscopy (EIS) is exceptionally well-suited for analyzing the microstructure of conductive nanocomposites, as it offers greater sensitivity to microstructural variations than DC electrical conductivity measurements and provides more detailed insight into the internal structure of the material.23–27 It is noteworthy that the center point of the semicircle in Nyquist plots, obtained by EIS analyses, would serve as a convenient criterion in determining the state of dispersion, with less variation between samples, based on the fact that it is a measure of the mean interparticle distance. 28
To the best of the authors’ knowledge, no prior study has systematically investigated the effect of CNT surface functionalization on dispersion within a PBAT matrix using EIS as the primary diagnostic tool, nor has the relationship between surface chemistry, EIS response, and rheological behavior been simultaneously characterized in a biodegradable nanocomposite system.
This research examines how the chemical functionalization of carbon nanotubes (CNTs) affects their dispersion within a PBAT matrix. Three types of conductive CNTs with similar geometries but distinct surface chemistries and energies were evaluated: unfunctionalized CNTs (CNT), hydroxyl-functionalized CNTs (CNT–OH), and carboxyl-functionalized CNTs (CNT–COOH). CNT dispersion is primarily governed by the balance between CNT–CNT and PBAT–CNT interactions, both of which are altered by surface chemistry and the resulting surface energy. EIS is employed as a sensitive probe of microstructural variation to elucidate how functionalization influences dispersion, EIS response, and rheological behavior. These findings provide guidance for designing biodegradable, conductive PBAT nanocomposites with tailored electrical and rheological properties.
Materials and Method
Materials
PBAT, HF101, Zhejiang company, density of 1.23 g/cm3, melt flow index of 5.14 g/10 min at 190°C, load of 2.16 kg, and melting temperature range of 105–155°C was used.
Unfunctionalized carbon nanotubes (CNTs) and carboxylated CNTs with 2 wt% COOH were supplied by Chengdu Company, China. The density diameter, and length of these CNTs are 2.1 g/cm3, 10–20 nm and 30–100 µm, respectively. Hydroxylated CNTs, 2 wt% OH, were provided by Artin Tejarat Oxir (Iranian company) and had similar physical properties to those of CNTs from Chengdu Company. Analyses of the surface area and chemistry of the CNTs are shown in Figures S1 and S2 in the Supplementary Information section.
Sample Preparation
To remove moisture, drying of all materials was performed in a drying oven (model D-H, manufactured by Fanazma Gostar Company). The drying process was conducted at a temperature of 60°C for a period of 12 hours. CNTs at a concentration of 1.5 vol% were melt-mixed with PBAT using a laboratory internal mixing machine (Misaghafzar Company, Iran), with a capacity of 60 cm3 and a filling level of 0.8, with a rotor speed of 60 r/min, and 190°C for a period of 10 minutes. All specimens were molded using a hot press at a temperature of 190°C, with a preheating period of 5 minutes and a press period of 150 bar and 3 minutes. Immediately after molding, the specimen was quenched for 5 minutes inside a cold-water bath.
Samples for characterization were molded with a 10-ton hot press supplied by the Uranus Caspian Company in Iran, employing the following geometries and dimensions: (A) Rectangular specimens measuring 40 × 10 × 1 mm3, suitable for scanning electron microscopy (SEM) and Raman spectroscopy; (B) circular disks 25 mm in diameter and 1.5 mm thick, intended for rheological and mechanical spectroscopy studies; (C) circular disks 25 mm in diameter and 0.1 mm thick, used for electrochemical impedance spectroscopy (EIS).
Characterization
Fourier Transform Infrared Spectroscopy (FTIR)
Infrared spectroscopy was employed to confirm the functional groups present in the nanoparticles. Samples of pristine CNTs and the modified CNTs (CNT-COOH and CNT-OH) were analysed using a Bruker Fourier-transform infrared spectrometer (Equinox 55, USA).
BET Surface Area Analysis
To assess how surface functional groups influence the microstructure of the nanomaterials, we measured the specific surface areas of pristine CNTs, CNT-COOH, and CNT-OH using a Micromeritics TriStar II Series instrument for Brunauer–Emmett–Teller (BET) analysis.
Rheometric Mechanical Spectrometer
We measured the bulk rheological properties of PBAT/CNT nanocomposites across a range of frequencies while in the molten state. The measurements were taken on a Physica MCR300 rheometer (Anton Paar) using an oscillatory frequency sweep. An initial strain-sweep experiment defined the linear viscoelastic region (LVR). Subsequently, a frequency sweep was performed at 1 % strain from 0.01 to 600 Hz at 190°C.
Electrical Impedance Spectroscopy (EIS)
EIS was employed to investigate the inductive-capacitive properties of the samples, with data collected using a potentiostat-based impedance spectrometer (IRASOL, Solar Sharif Company, Iran) covering a frequency range of 0.01–1 MHz under an applied voltage of 20 mV.
Field Emission Scanning Electron Microscopy (FE-SEM)
The microstructure of the nanocomposites was investigated by scanning electron microscopy (MIRA3, TESCAN). The specimens for scanning electron microscopy studies were prepared according to the following procedure: specimens were compression molded into 1 × 10 × 10 mm3 bars at 190°C and 100 bar pressure for 5 minutes of preheating and then 3 minutes at compression. The specimens were then immersed in liquid nitrogen for 5 minutes and subsequently fractured. The fracture surfaces were then coated with a thin layer of gold in liquid nitrogen for improved electrical conductivity.
Raman Spectroscopy
Raman spectroscopy was performed using a Bruker SENTERRA microscope to evaluate the dispersion of CNTs within the polymer matrix. Thin-film samples were analyzed at three random locations using a laser power of 10 mW.
Results and Discussion
FE-SEM Microstructure Evaluation of PBAT/CNTs Nanocomposites
FE-SEM analysis was conducted to investigate the dispersion of functionalized CNTs within the PBAT matrix. Figure 1 presents FE-SEM images of the unfunctionalized, hydroxylated, and carboxylated CNTs melt-mixed with PBAT. High-magnification images reveal that the CNT diameters in the PBAT matrix range from 60 to 150 nm. PBAT/CNT-COOH sample shows better CNTs dispersion than the PBAT/CNT-OH and PBAT/CNT samples. The superior dispersion of CNT-COOH is attributed to the enhanced interaction between the -COOH groups and the PBAT chains compared to the other samples. This observation is also consistent with other studies that used polyesters as the matrix. For example, Kim et al showed that PLA composites containing CNT-COOH exhibited better dispersion in SEM images, as the presence of carboxyl groups increased the wettability of the CNTs and enhanced their interactions with the ester groups of the polyester matrice.
29
FESEM images of PBAT and PBAT/CNT samples at 5 µm (top row), and 500 nm magnification (bottom row): (a, d) PBAT/CNT, (b, e) PBAT/CNT-COOH, (c, f) PBAT/CNT-OH.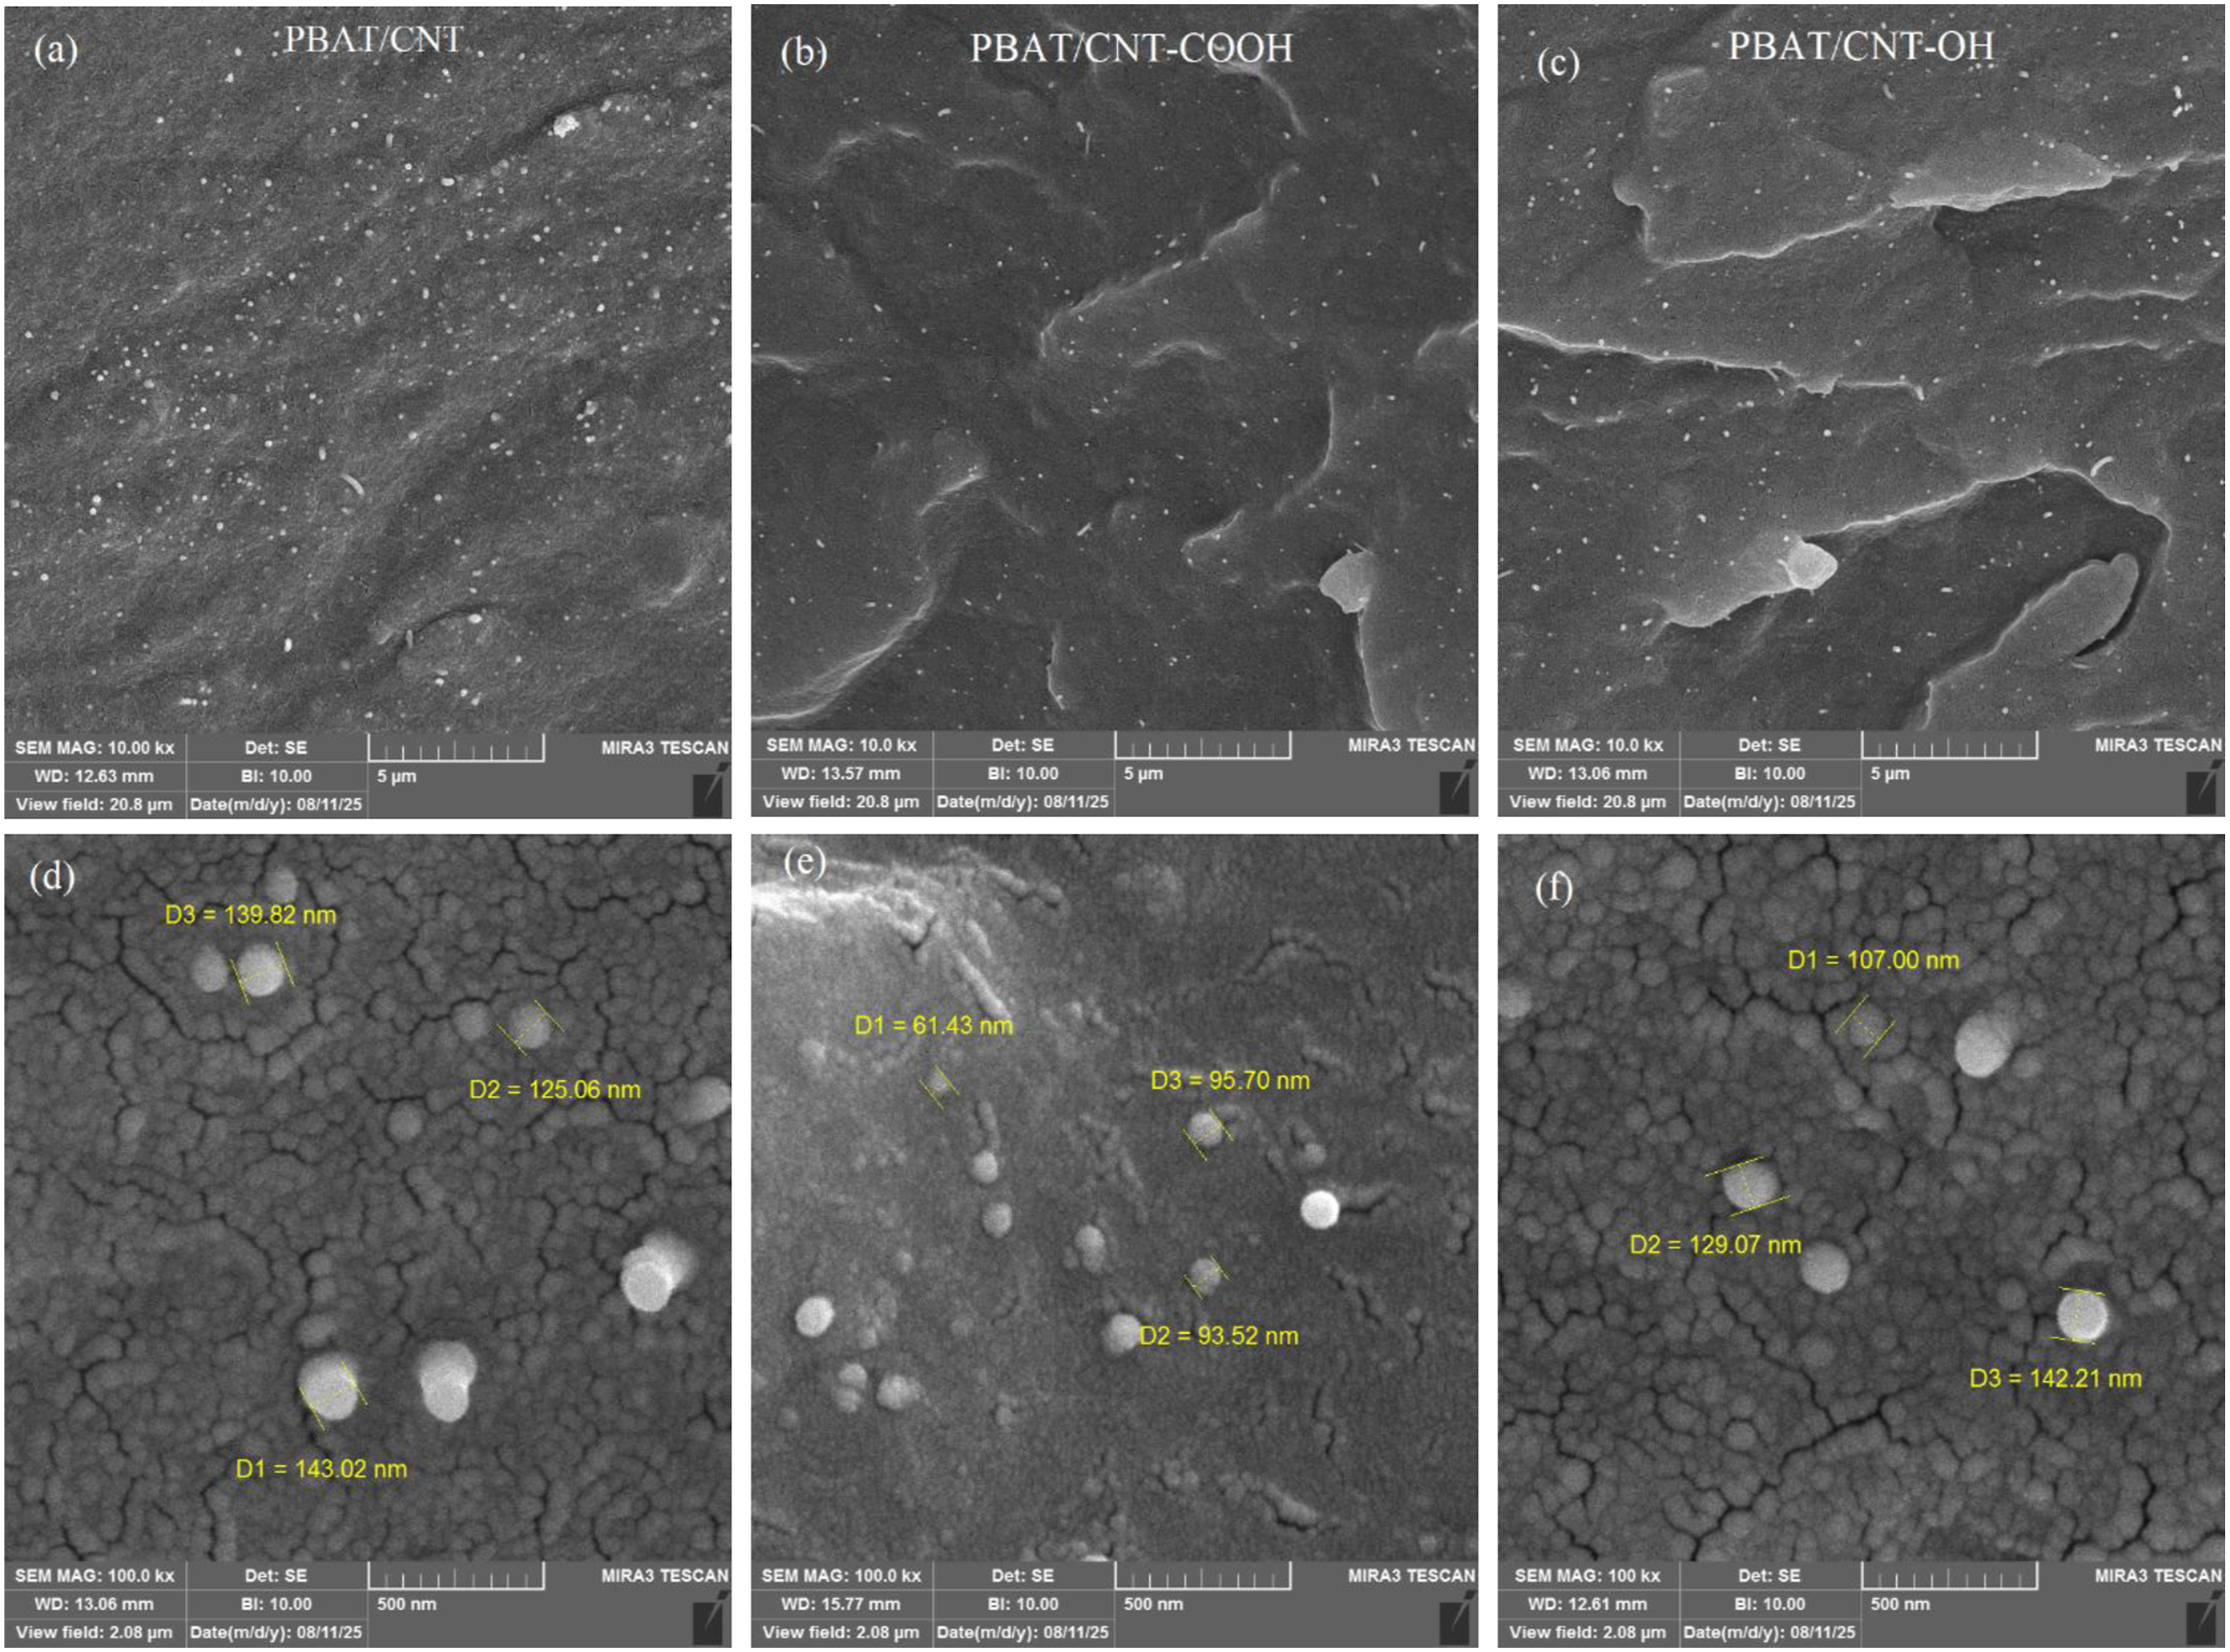
Raman Spectroscopy Evaluation Results
To investigate the distribution and dispersion of nanoparticles within the polymer matrix, Raman spectroscopy was performed at three random locations on each specimen. Figure 2 shows the Raman test results for PBAT-based samples. Raman spectrums from different random points for (a) PBAT/CNT, (b) PBAT/CNT-COOH, (c) PBAT-CNT-OH samples.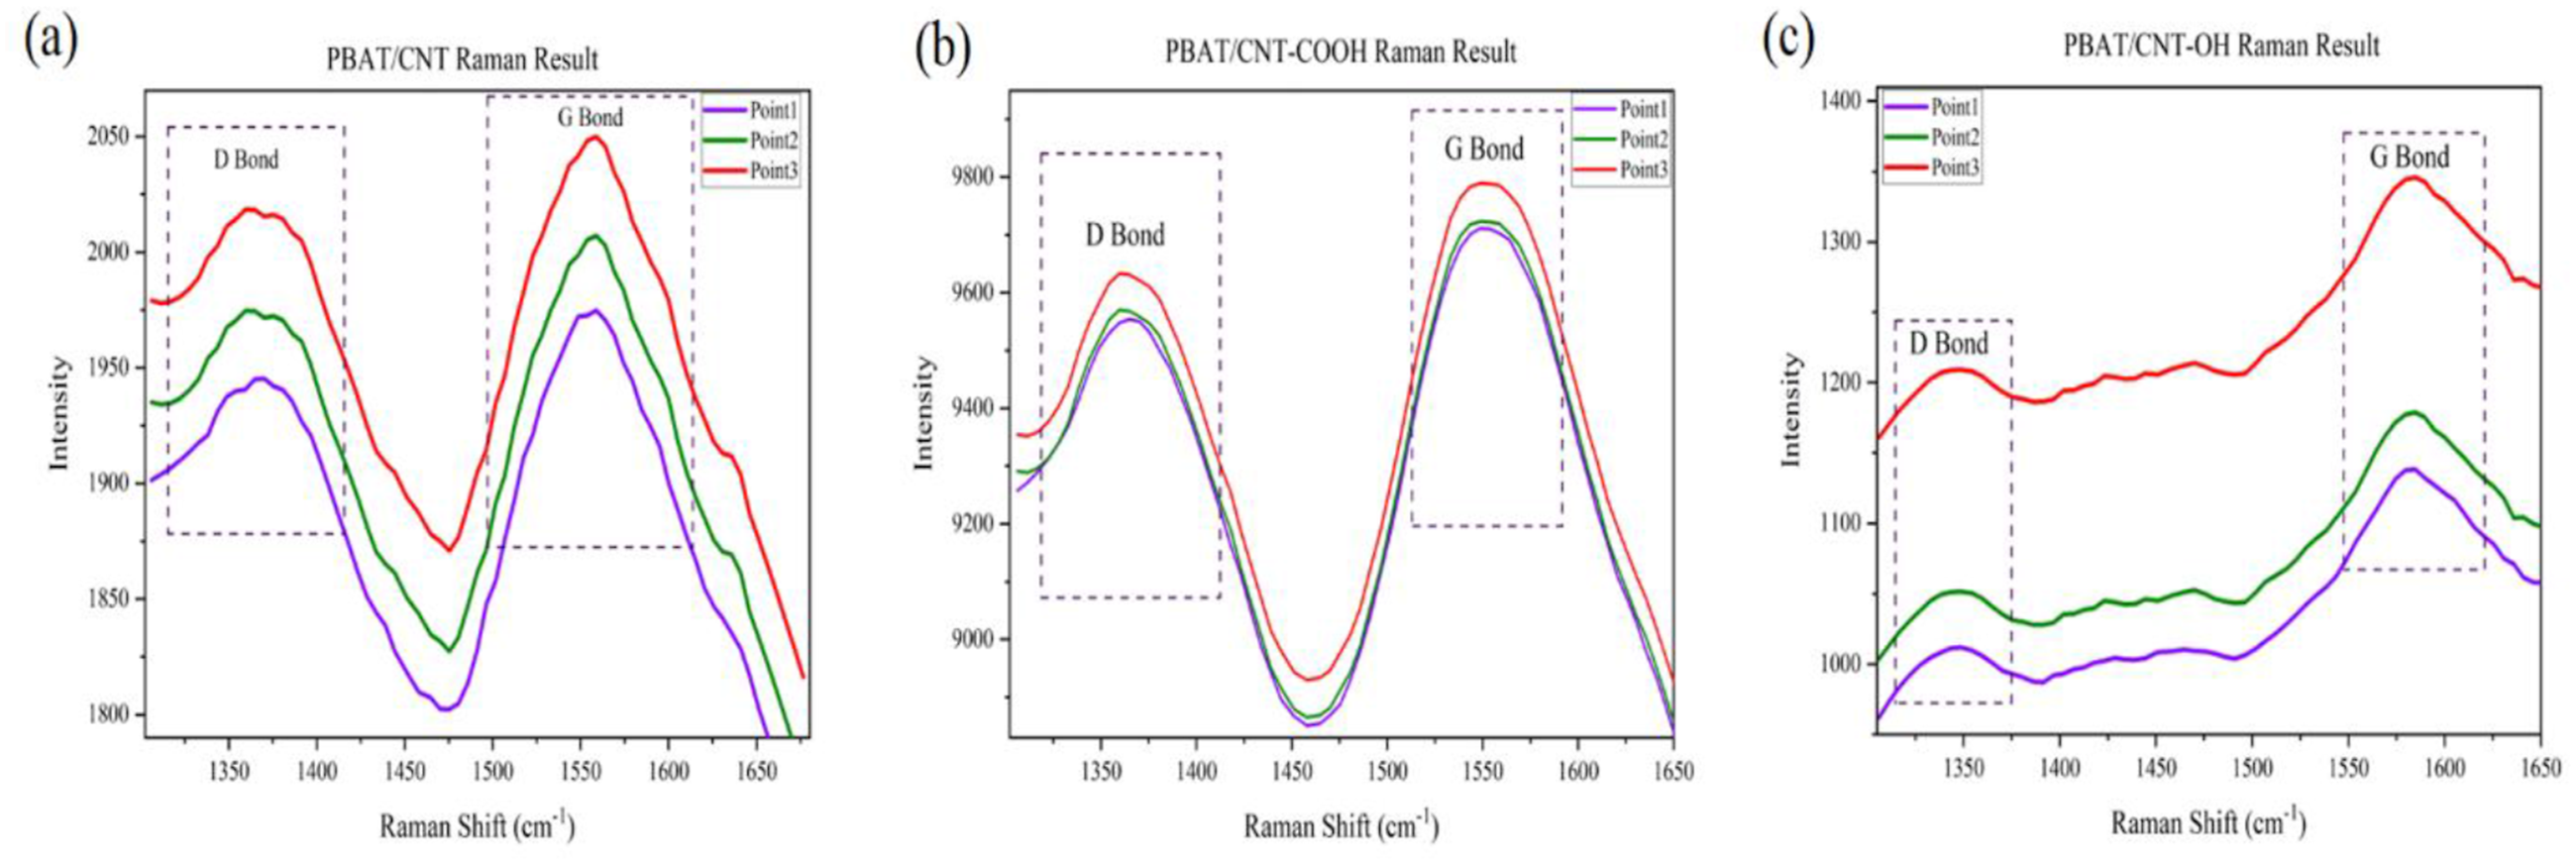
For all samples, two strong peaks are observed; the first peak is around 1300–1400 cm−1 and the second peak is around 1450–1650 cm−1, where the first peak is related to the defects of carbon nanotubes, known as D Band, and the second peak is related to the tangential vibrations of carbon atoms, known as G Bond. 30
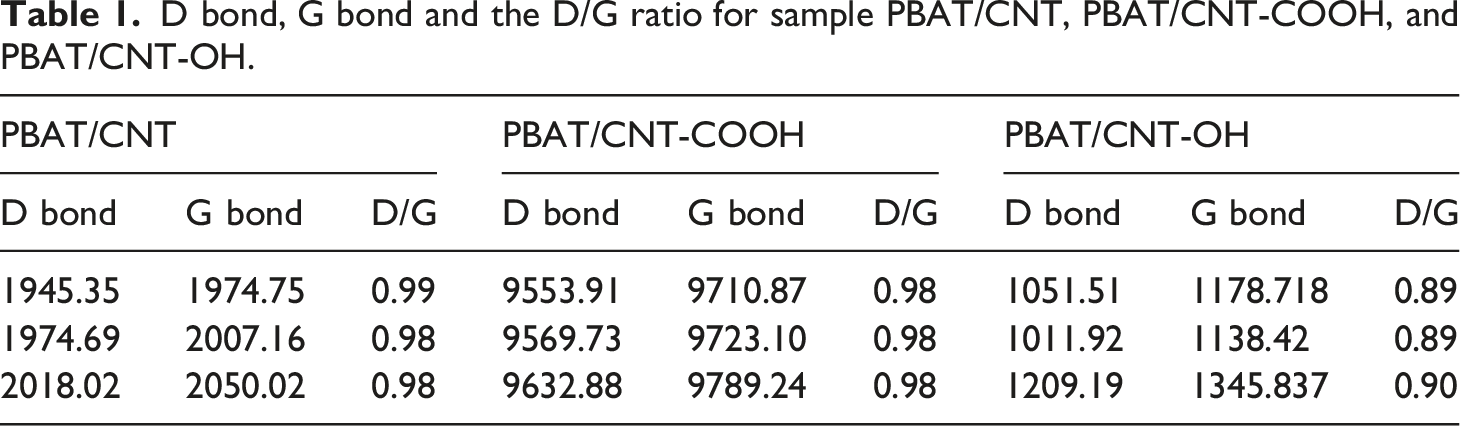
D bond, G bond and the D/G ratio for sample PBAT/CNT, PBAT/CNT-COOH, and PBAT/CNT-OH.
Electrical Impedance Spectroscopy (EIS)
EIS was used to investigate the variation of the real and imaginary part of impedance of PBAT/CNTs nanocomposites with frequency. Figure 3 shows the results of the real and imaginary parts of the impedance versus frequency. Plots of (a) real and (b) imaginary part of impedance versus frequency for samples PBAT/CNTs composites.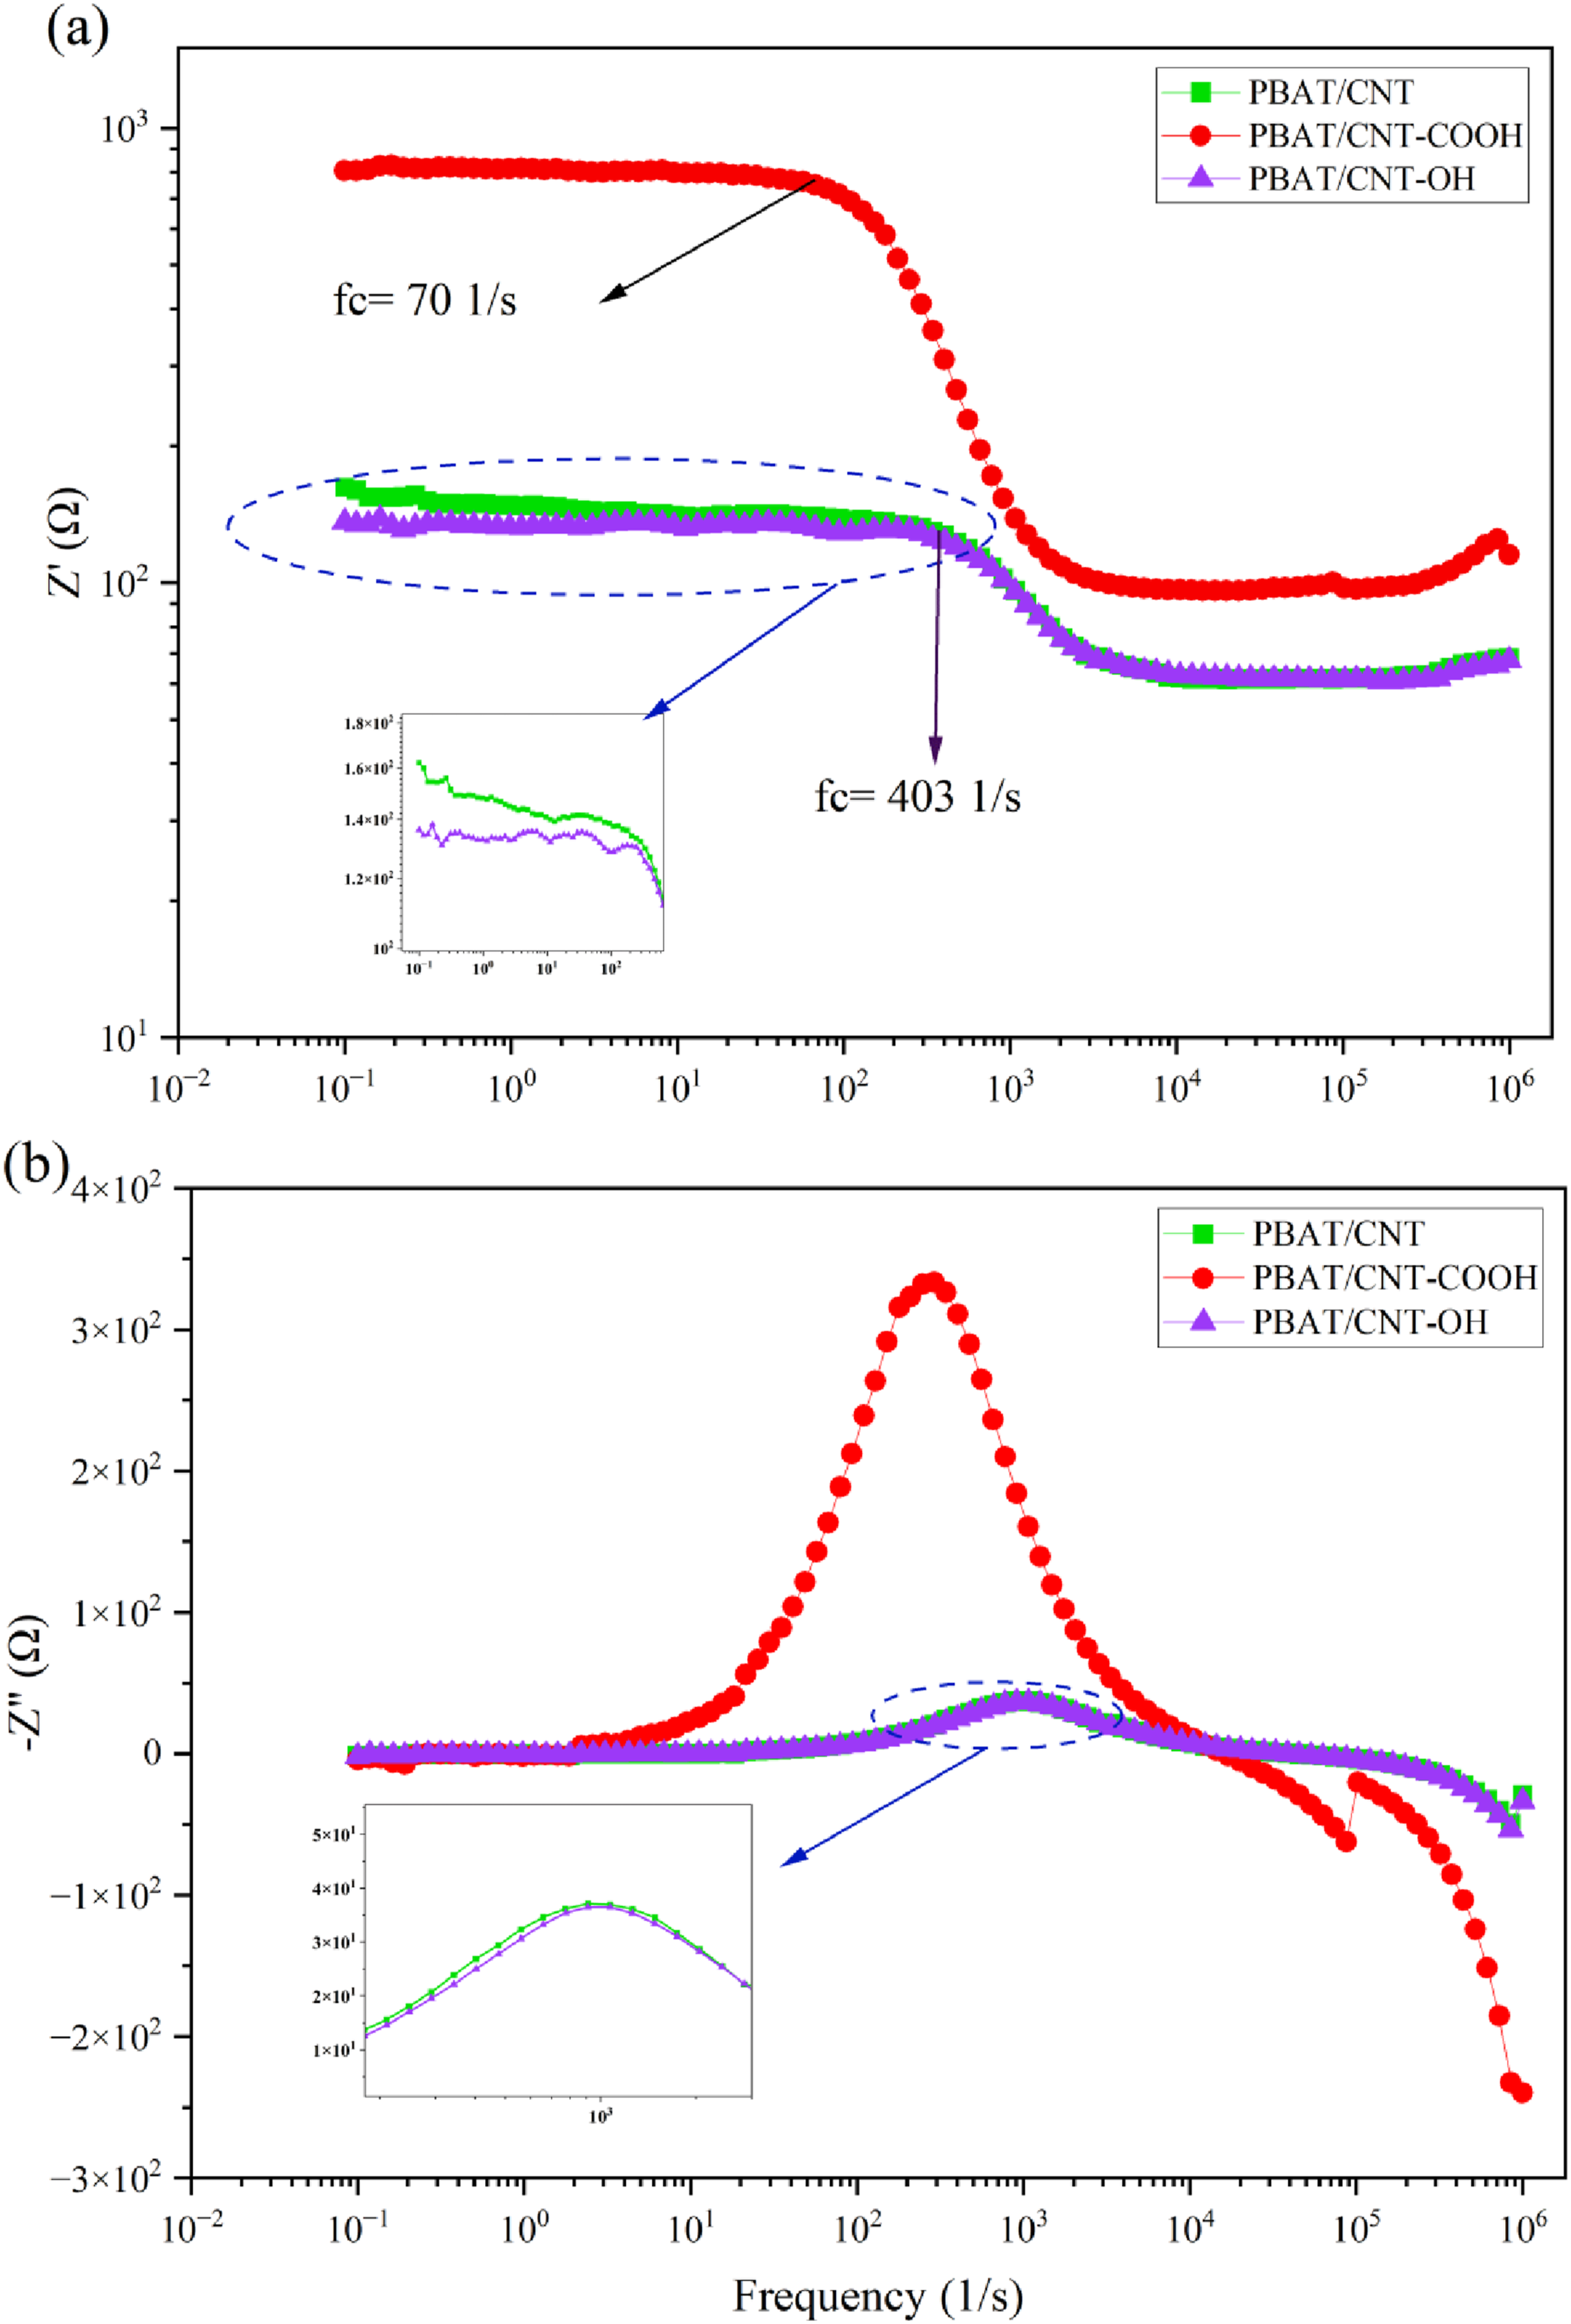
Figure 3(a) shows that up to a critical frequency, referred to as the cutoff frequency (fc), the real part of the impedance is frequency-independent. This plateau is attributed to the resistive behavior of the samples. Conversely, the decrease in the real part of the impedance beyond the cutoff frequency is due to the capacitive behavior of the nanocomposites.23–25
The frequency-independent behavior of the samples indicates ohmic electrical conduction, where charge transfer occurs through direct contact between conductive particles. This mechanism depends significantly on the presence of continuous conductive pathways within the nanocomposite.23–25 The decrease in impedance beyond the cutoff frequency is attributed to the electron tunneling conduction mechanism between conductive nanoparticles. Consequently, a steeper slope of impedance reduction indicates a stronger contribution of the electron tunneling mechanism within the polymer matrix.23,25,31
According to Figure 3(a), the PBAT/CNT-COOH sample has the highest real part of the impedance and the lowest frequency cutoff. The lowest frequency cutoff is due to the good interaction between the PBAT and CNT-COOH in the nanocomposite, while the highest impedance level indicates the lower continuous conductive pathways compare to other samples.; at low frequencies the conduction mechanism is direct contact between nanoparticles, which is directly related to the lower interconnected conductive networks due to the more uniform distribution of CNT-COOH nanoparticles in PBAT. In fact, it can be stated that the improved interaction between PBAT and CNT-COOH nanoparticles has resulted in a very fine dispersion of nanoparticles within the polymer matrix, which has prevented the formation of additional interconnected conductive networks or say segregated structures leading to an increase in the impedance. On the other hand, the decrease in impedance with a high slope after the frequency cutoff indicates the effect of the electron tunneling mechanism resulting from the very fine dispersion of nanoparticles in the polymer matrix.24,25
According to Figure 3(a), the PBAT/CNT and PBAT/CNT-OH samples exhibit nearly identical cutoff frequencies (fc), which are higher than that of the PBAT/CNT-COOH composite. This indicates weaker interactions between the nanoparticles and the polymer matrix in these two samples. Furthermore, the impedance level of the PBAT/CNT composite is slightly higher than that of PBAT/CNT-OH, suggesting the formation of more continuous and better-defined conductive pathways in the latter. Consequently, the PBAT/CNT-OH sample features the highest density of conductive paths among the three composites due to the comparatively weaker polymer-nanoparticle interactions.
Figure 3(b) shows the imaginary part of the impedance. The peaks occurring in Figure 3(b) are related to dielectric relaxation in nanocomposites. When the electric field is imposed on the samples, an electric dipole develops due to the movement of the charge carriers.23,25,31 The time taken for the creation or disappearance of the electric dipole after the imposition or removal of the electric field is referred to as the dielectric relaxation time. This parameter plays an important role in explaining the frequency-dependent properties of materials. With an increase in frequency, the response of the charge carriers decreases, and as a result, the impedance behavior alters.
As seen in Figure 3(b), the peaks of the PBAT/CNT and PBAT/CNT-OH nanocomposites occur at a higher frequency and thus have shorter dielectric relaxation times. Conversely, the peak of the PBAT/CNT-COOH nanocomposite occurs at a lower frequency; this interprets to a longer dielectric relaxation time. Additionally, the magnitude of the peak in the imaginary impedance curve is proportional to the electrical resistance of the nanocomposite. A lower magnitude of the peak represents lower resistance. Based on the magnitude of the peaks in the imaginary impedance curve, PBAT/CNT-COOH has the highest electrical resistance.
A pivotal plot to study the electrical characteristics of the prepared samples is the Nyquist plot.23,25,31 This plot is advantageous for understanding the equivalent electrical circuit of the nanocomposite and evaluating its overall electrical performance for practical applications. Figure 4 displays the Nyquist plots of the prepared samples, where the imaginary part of the impedance is plotted against the real part. The single semicircle observed for all samples signifies a single relaxation process. The diameter of the semicircle corresponds to the electrical resistance of the material. As expected, PBAT/CNT-COOH exhibits the largest semicircle, representing the highest electrical resistance. Furthermore, the position of the semicircle’s center provides an indication of the average interparticle distance within the polymer matrix. A higher center position for the semicircle reveals a greater interparticle distance for the PBAT/CNT-COOH composite.
23
Nyquist plots of PBAT/CNT, PBAT/CNT-COOH, and PBAT/CNT-OH samples.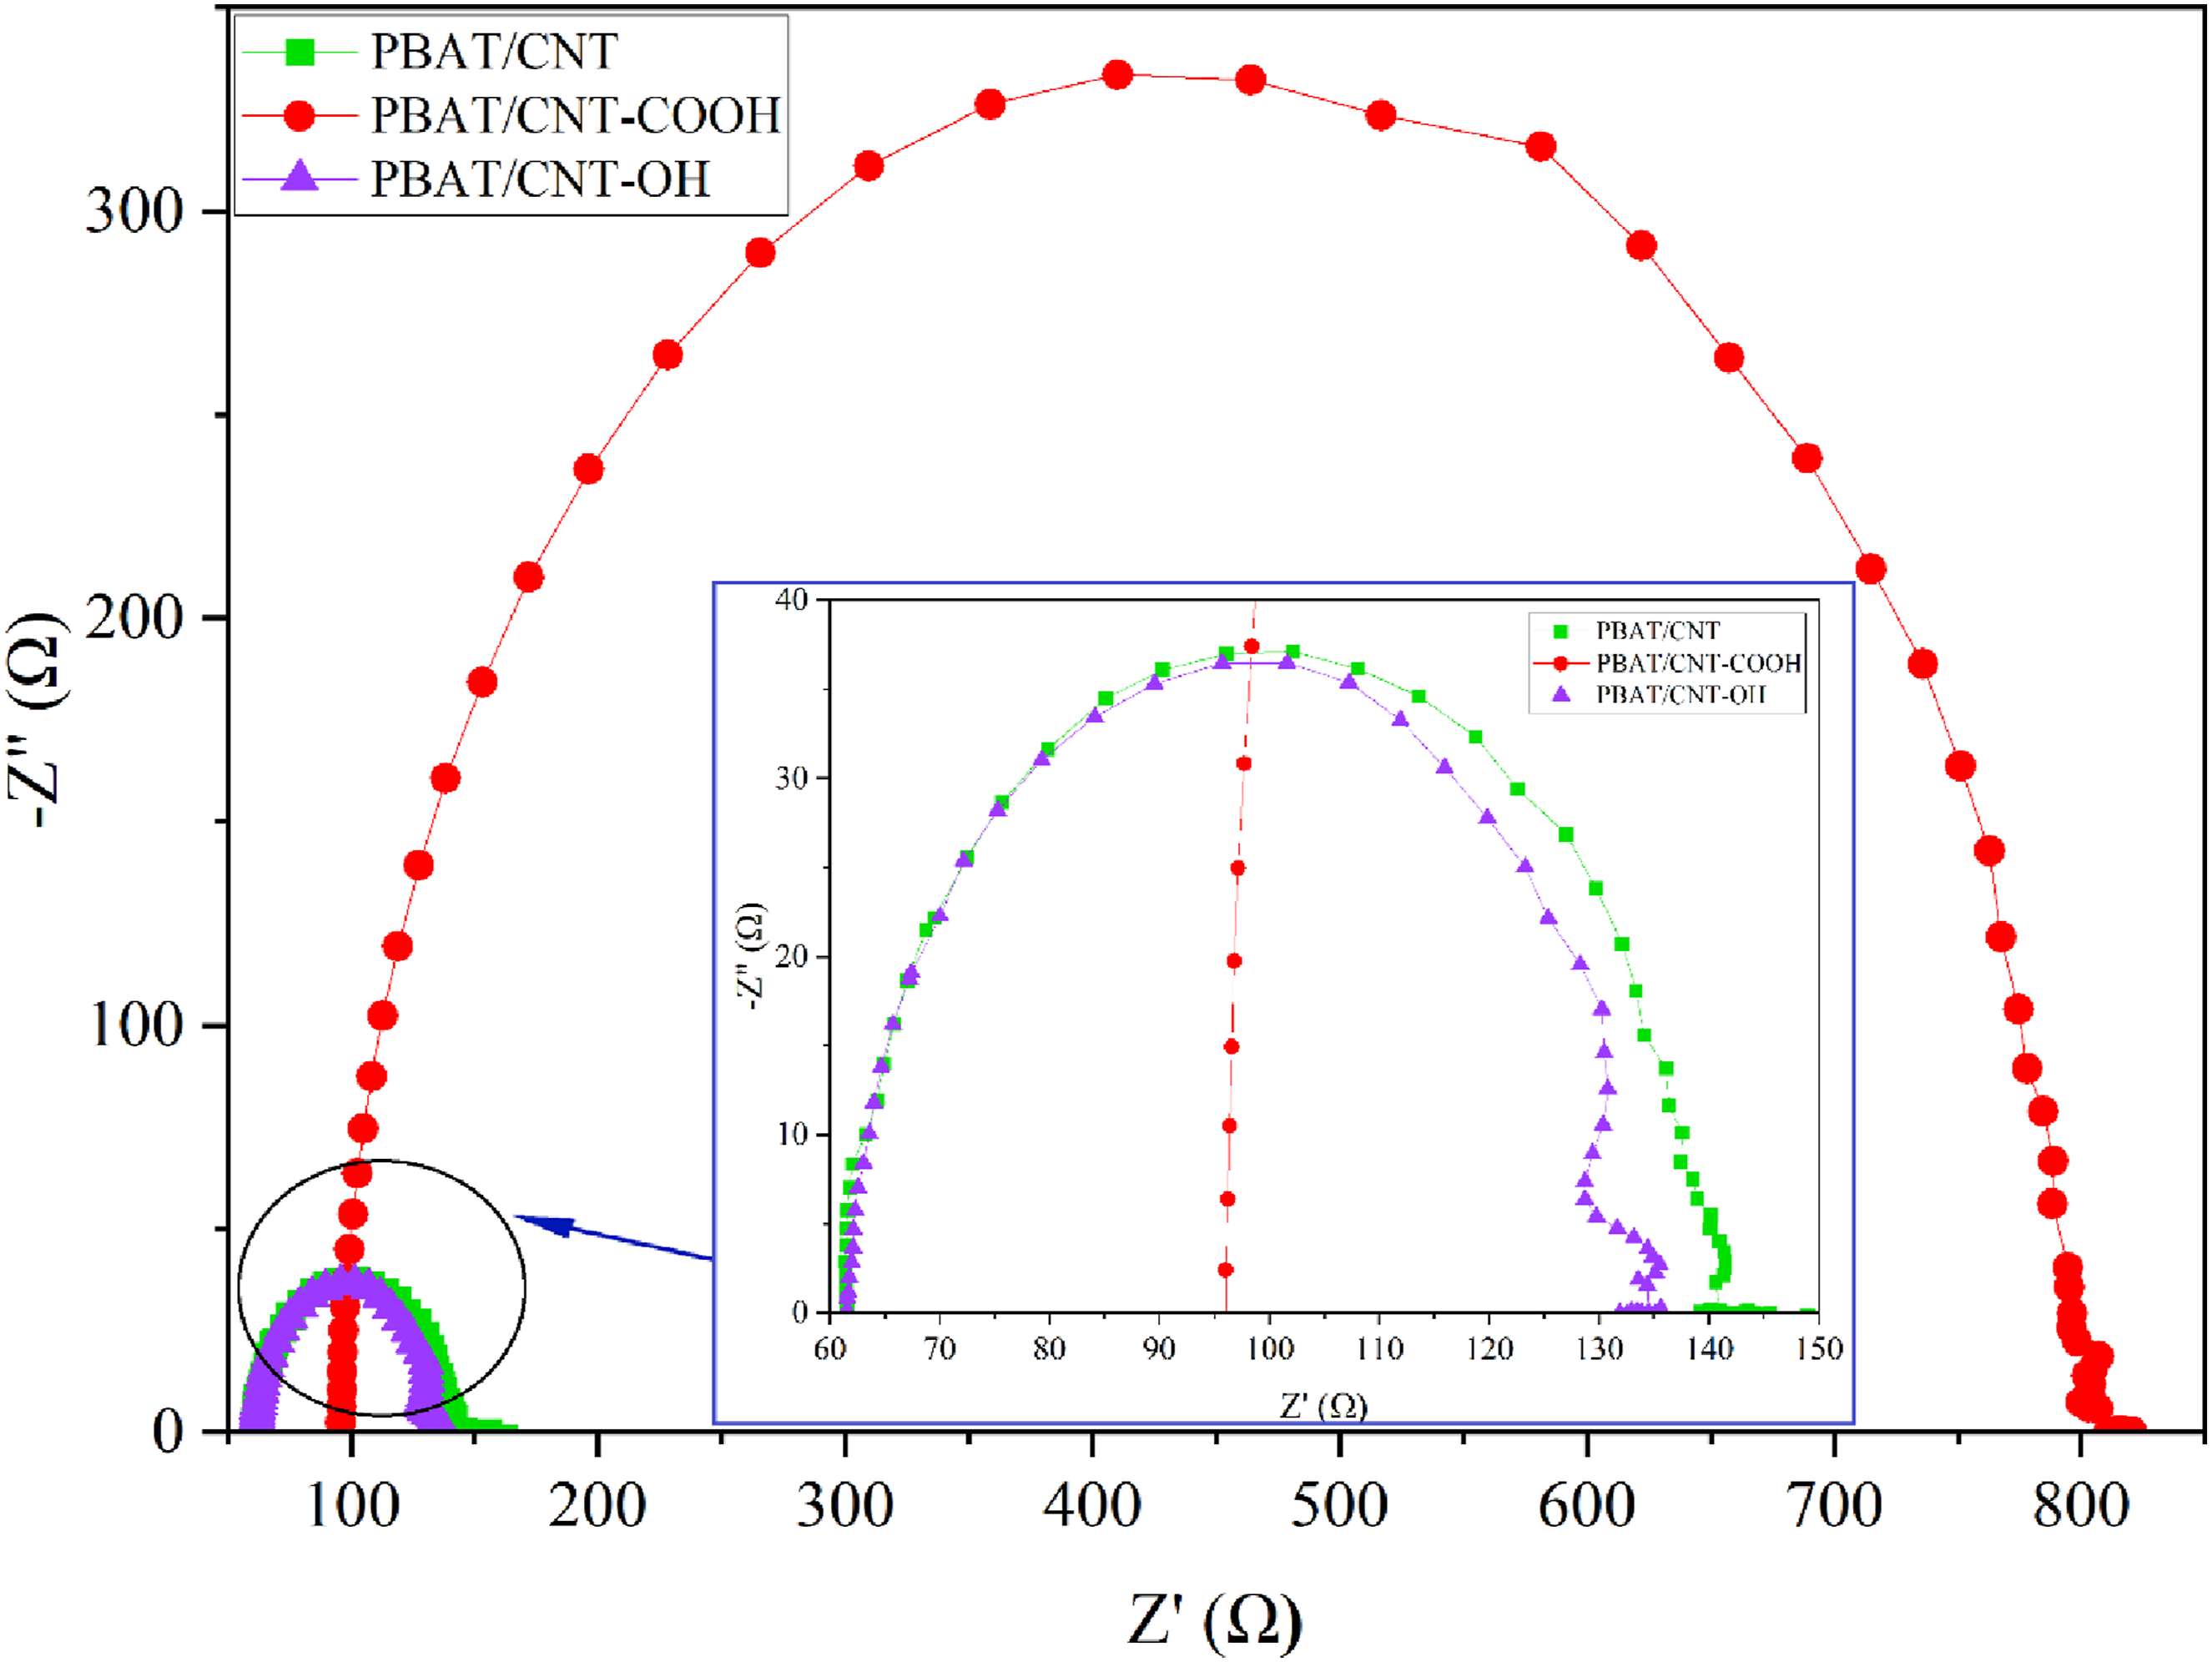
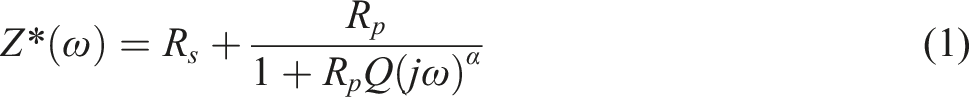
To better understand their application potential, a theoretical analysis of impedance using an equivalent electrical circuit was conducted to evaluate the data. The impedance of the conductive composites was analyzed using a modified Randles circuit and expressed according to equation (1), from which the total impedance is calculated. The model includes a series resistance (Rs) and a parallel combination of a network resistance (Rp) and a constant phase element (CPE).
32
The model parameters were acquired by fitting the equivalent circuit to the experimental EIS data, as demonstrated in Figure 5. Excellent agreement was attained for all samples, with coefficients of determination ( Fitting of the modified Randles model to experimental EIS data for Nyquist and Bode plots of (a, b) PBAT/CNT, (c, d) PBAT/CNT-COOH, and (e, f) PBAT/CNT-OH samples. Panels (a), (c), and (e) show the Nyquist plots, while panels (b), (d), and (f) show the Bode plots.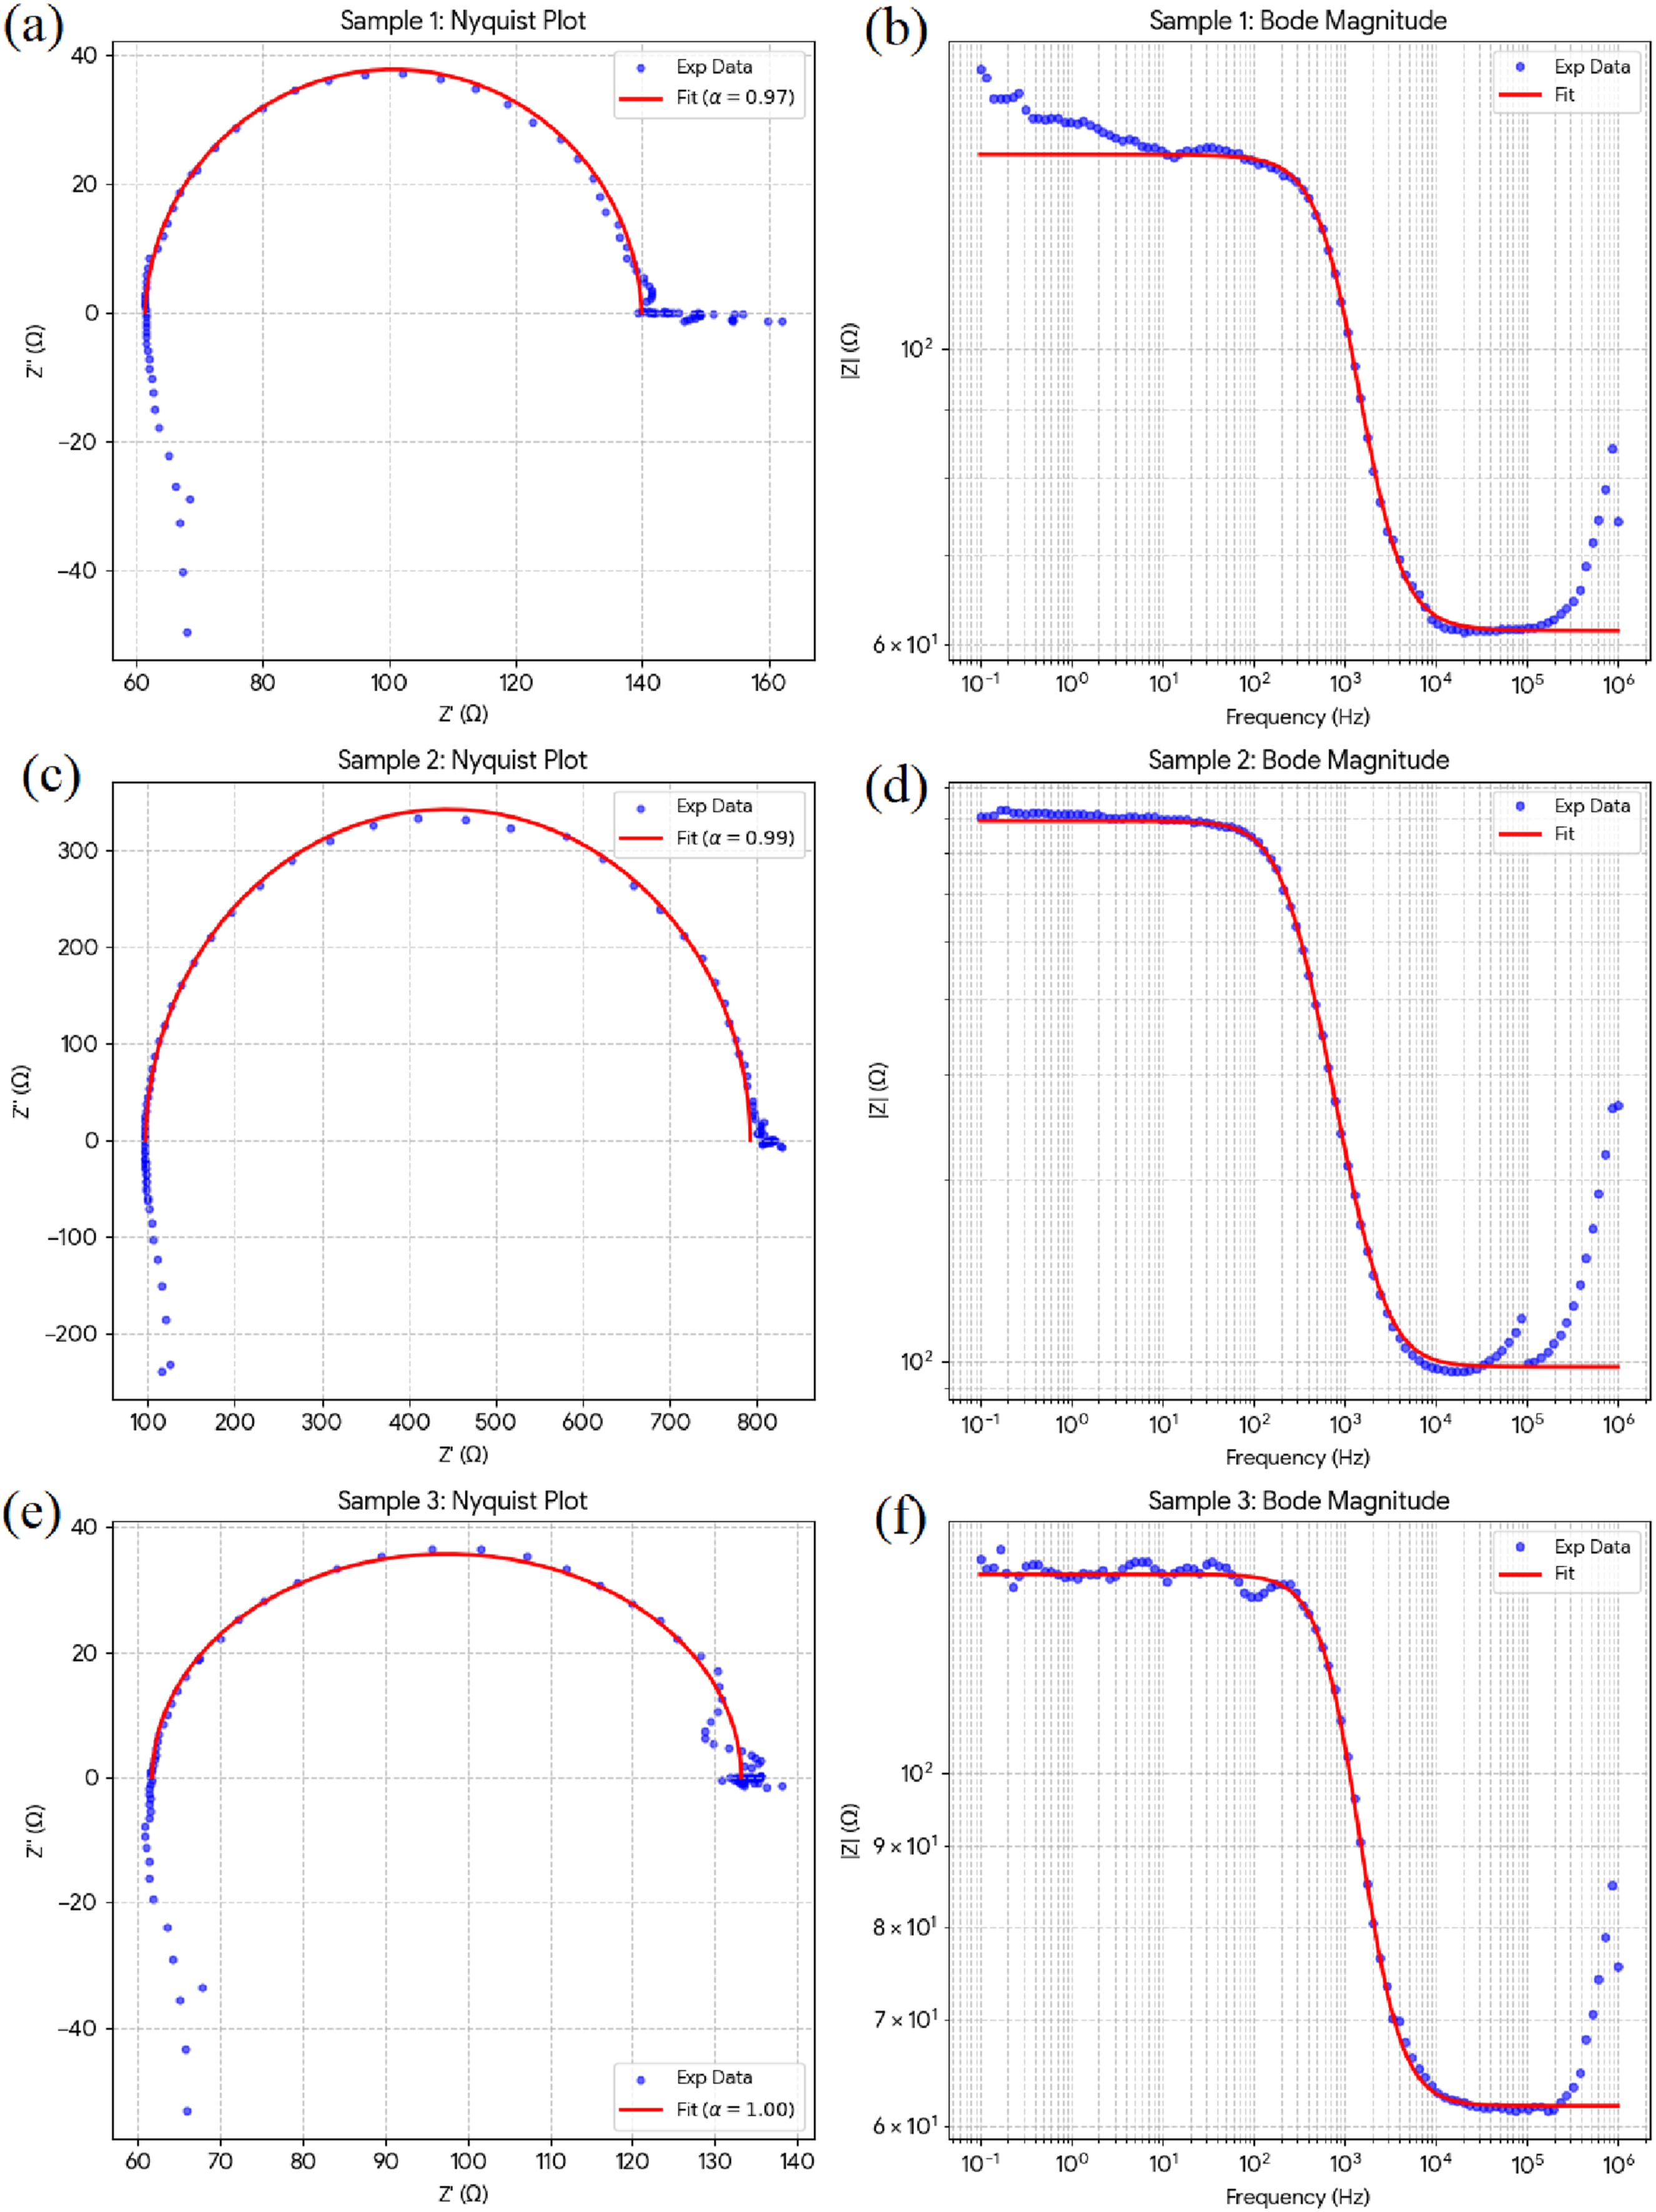
Parameters of modified Randles circuit for PBAT/CNT, PBAT/CNT-COOH, and PBAT/CNT-OH.
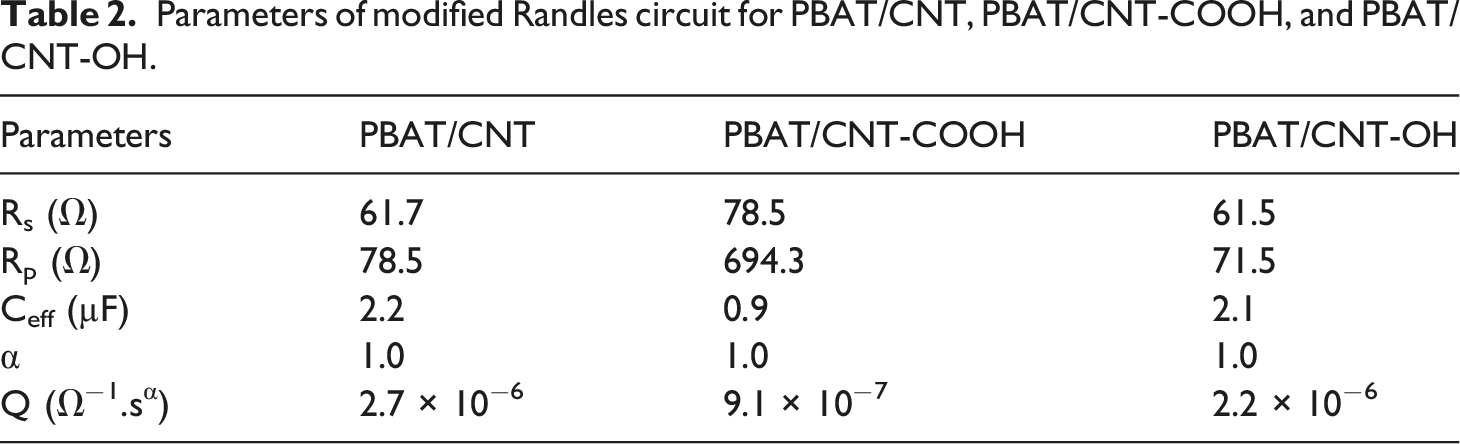
Physically, Rs accounts for the intrinsic resistance of the bulk polymer matrix and the contact resistance at the electrode-sample interface. In our findings, Rs values remained relatively low across all samples suggesting that the macro-scale electrode contact remained stable and that the change in electrical properties is primarily driven by internal microstructural changes rather than external contact variations. 33
The Network Resistance (Rp), which corresponds to the diameter of the Nyquist semicircle, is the most critical indicator of the internal connectivity of the carbon nanotubes. A significantly higher Rp in PBAT/CNT-COOH serves as evidence of a “well-dispersed” state. At this condition, a high interaction between nanotubes and polymer chains leads to the individualization of CNTs, where each tube is effectively encapsulated by an insulating polymer layer. This wrapping increases the tunneling distance between conductive elements, forcing electrons to overcome a much higher energy barrier at every junction, which manifests as a higher bulk resistance despite the superior dispersion.
To account for the non-ideal capacitive behavior of the PBAT/CNT interfaces, a Constant Phase Element (CPE) model was applied, defined by the magnitude Q and the ideality exponent α. The parameter Q represents the effective interfacial capacitance and is sensitive to the total surface area of the nanotubes and the thickness of the polymer interlayers. The observed decrease in capacitance for PBAT/CNT-COOH indicates that the individual nanotubes are dispersed further apart throughout the matrix volume, increasing the average gap distance between conductive sites. This supports the conclusion that the CNT-COOH sample exhibits better dispersion and a more uniform distribution.
The CPE Exponent (α) functions as a quantitative measure of the homogeneity of the dispersion state. A value of (α) close to 1.0 indicates a fully uniform distribution and a homogeneous interface, while lower values suggest less dispersion caused by the presence of CNT agglomerates. PBAT/CNT-COOH exhibited the highest α value (0.992), providing definitive mathematical evidence that the nanotubes are distributed with more uniformity. Consequently, the combination of a high α (high homogeneity) and a high Rp (high tunneling barrier) affirms the interpretation that PBAT/CNT-COOH represents the most individualized and well-dispersed state, where the conductive network is perfectly controlled by the polymer matrix. 34 α value for CNT composite is very close to that of CNT-COOH composite meaning that it behaves near-ideal capacitive behavior and indicating a more homogeneous interfacial environment.
AC Electrical Conductivity
The AC electrical conductivity for polymer nanocomposites based on PBAT containing carbon nanotubes was calculated from equation (2), where t and A are the thickness and area of the sample, respectively.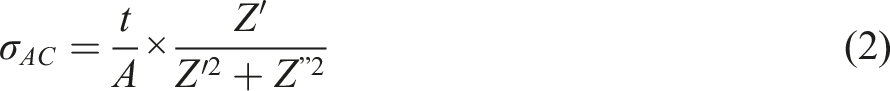
As observed from the frequency dependence of the AC conductivity, the conductivity remains almost independent of the frequency up to a critical frequency. Beyond this point, a distinct increase in electrical conductivity is observed. This behavior in polymer nanocomposites containing conductive nanoparticles is generally explained by the Maxwell–Wagner–Sillars (MWS) interfacial polarization mechanism, which arises from the significant difference in electrical conductivity between the conductive fillers and the insulating polymer matrix. 23
In accordance with the MWS model, the interfaces play a principal role in controlling the AC electrical conductivity in nanocomposite systems. The interface between the carbon nanotubes and the PBAT matrix behaves as a nanocapacitor. 23
With increasing AC frequency, electron hopping throughout the PBAT/CNT interfaces becomes more regular. Simultaneously, the capacitor-like behavior of the interface leads to charge accumulation at these interphase regions. As the frequency keeps to increase, the amount of charge stored at the interfaces reduces which leads to a significant increase in AC electrical conductivity, as observed in Figure 6. AC electrical conductivity for PBAT/CNT, PBAT/CNT-COOH, and PBAT/CNT-OH samples.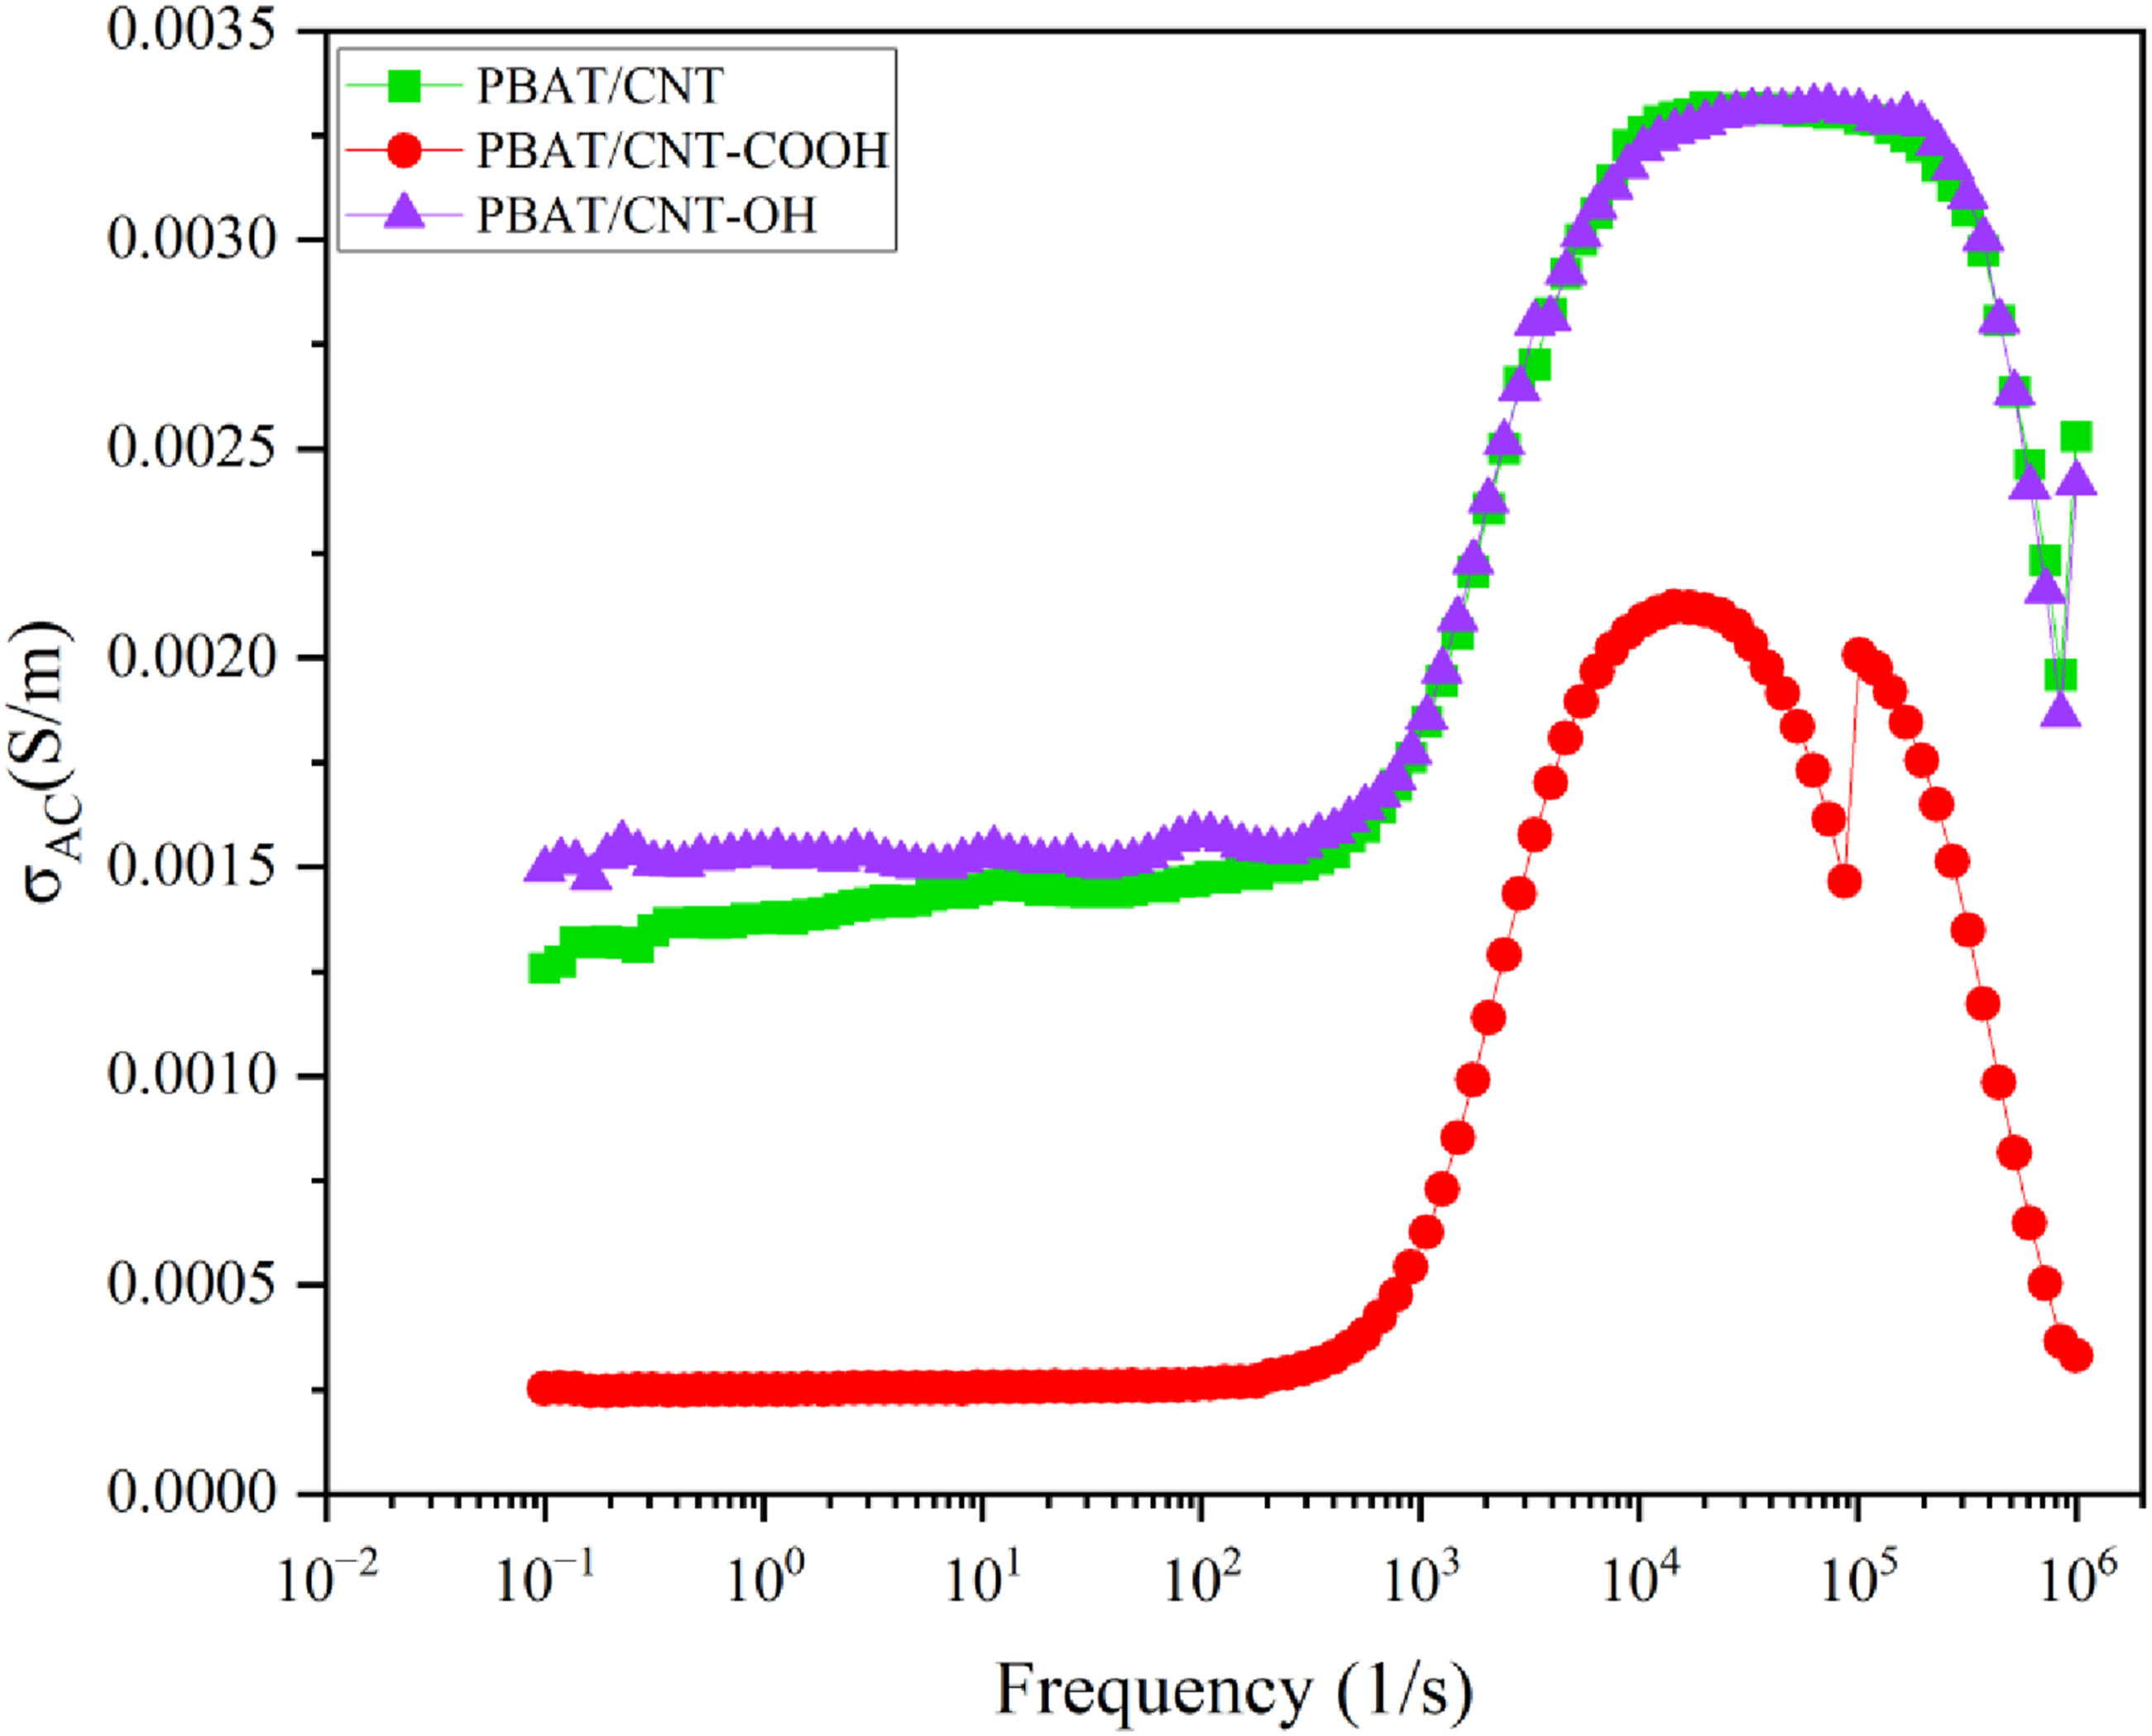
At sufficiently high frequencies, however, the rapid alternation of the electric field prevents the effective synchronization of charge carriers between the PBAT matrix and the conductive CNT network. Consequently, charge transfer across the interfaces becomes less efficient, leading to a noticeable reduction in the AC electrical conductivity.
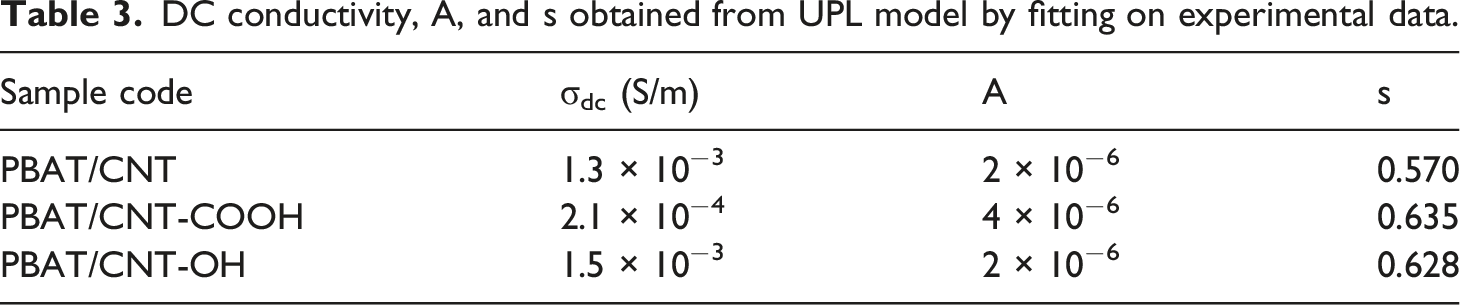
The frequency-dependent AC conductivity (σAC) data were analyzed using Jonscher’s universal power law (UPL) model (equation (3)) to investigate the charge transport mechanisms in the PBAT/CNT nanocomposites. The frequency-independent DC conductivity is represented by $/sigma_{DC}$, while the parameters A and s depend on the degree of correlation and the polarizability of charge carrier hopping, respectively.
35

While the value of the exponent s essentially describes the AC dispersions and reflects values between 0 and 1, indicating that the conductivity mechanism is dominated by the hopping of charge carriers between PBAT/CNTs interfaces, the DC conductivity parameter results from the large-scale transport of charge carriers over the infinite percolation path created by the arrangement of CNTs.
Determining the degree of filler dispersion and interpreting the interface role on electrical properties can be done with the help of the previously mentioned parameters.
DC conductivity, A, and s obtained from UPL model by fitting on experimental data.
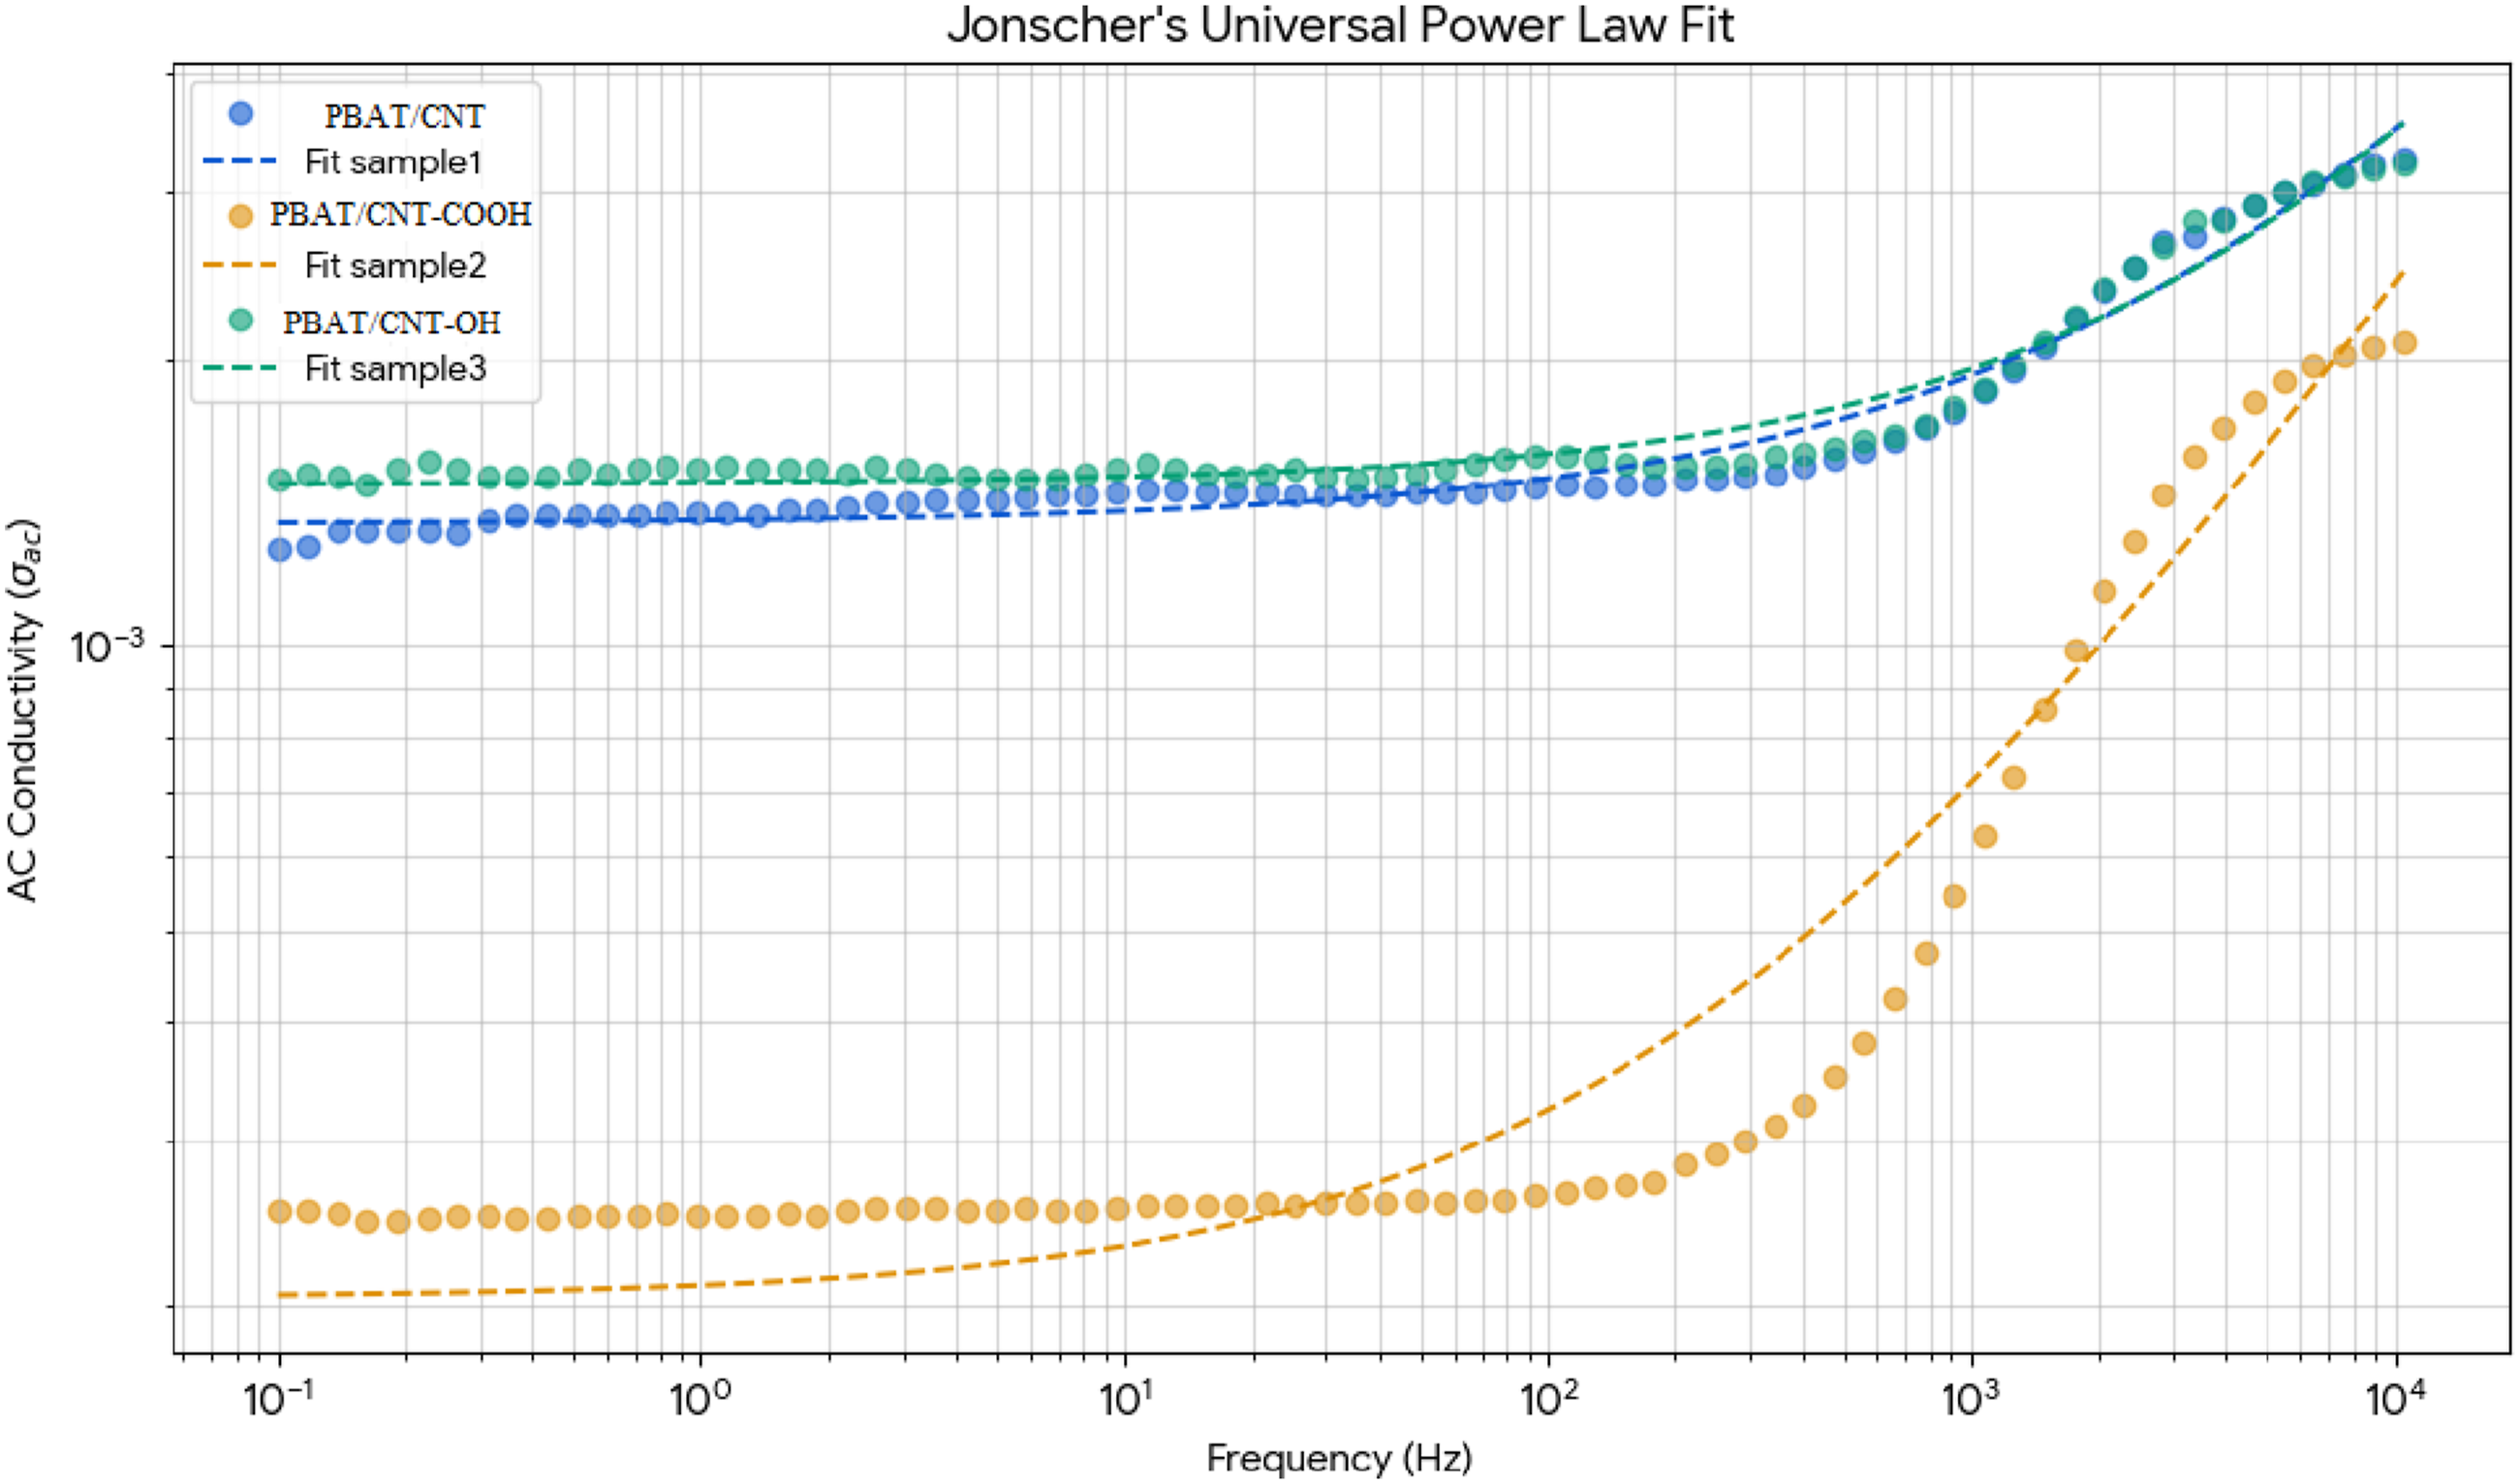
Plots of comparison of UPL model with experimental AC conductivity versus frequency for PBAT/CNT, PBAT/CNT-OH, and PBAT/CNT-COOH samples.
The fitting results show that the PBAT/CNT-COOH sample behaves differently in terms of electrical conductivity than PBAT/CNT and PBAT/CNT-OH. With values of 1.34 × 10⁻³ S/cm and 1.48 × 10⁻³ S/cm, respectively, PBAT/CNT and PBAT/CNT-OH exhibit comparatively higher DC conductivities, whereas PBAT/CNT-COOH exhibits a much lower DC conductivity of 2.05 × 10⁻⁴ S/cm. This decrease in
This behavior is explained physically by the increased dispersion and distribution of CNT-COOH in the PBAT matrix. Effective polymer wrapping around the CNTs are promoted by the carboxylic functional groups on the nanotube surfaces, which improve interfacial interactions with the polymer chains. Consequently, the Dispersion state is enhanced, which suppresses direct metallic-like contacts and increases the average interparticle distance between individual nanotubes.
The charge transport mechanism changes from a percolation-dominated regime to a hopping-dominated conduction process as a result of this enhanced dispersion. The frequency exponent s, which reaches its maximum value for PBAT/CNT-COOH (s = 0.635), provides additional support to this interpretation. A more dispersed conductive network and a more limited hopping environment, where charge carriers must overcome greater potential barriers between spatially separated nanotubes, are indicated by a higher s value. 35
Rheological Properties
To better understand the formation of CNT networks and their dispersion within the PBAT matrix, rheological analysis was performed. Rheological measurements are a powerful tool for investigating the microstructure of polymer nanocomposites, offering critical insights into interfacial interactions and filler dispersion.36–39
The rheological behavior of the PBAT/CNT nanocomposites is shown in Figure 8. Particularly, Figure 8(a) displays the complex viscosity for each system as a function of frequency. The PBAT/CNT-COOH nanocomposite shows a noticeable viscosity upturn at low frequencies. In comparison to the other samples, this behavior suggests improved interfacial interactions between CNT-COOH and the PBAT chains, resulting in the formation of a more dispersed and even distributed CNT network.
40
This finding aligns with the findings of the FE-SEM, Raman, and impedance spectroscopy. Plots of (a) complex viscosity as a function of frequency, (b) storage modulus as a function of frequency, (c) loss modulus as a function of frequency, and (d) Cole–Cole plots for PBAT/CNT, PBAT/CNT-COOH, and PBAT/CNT-OH nanocomposites.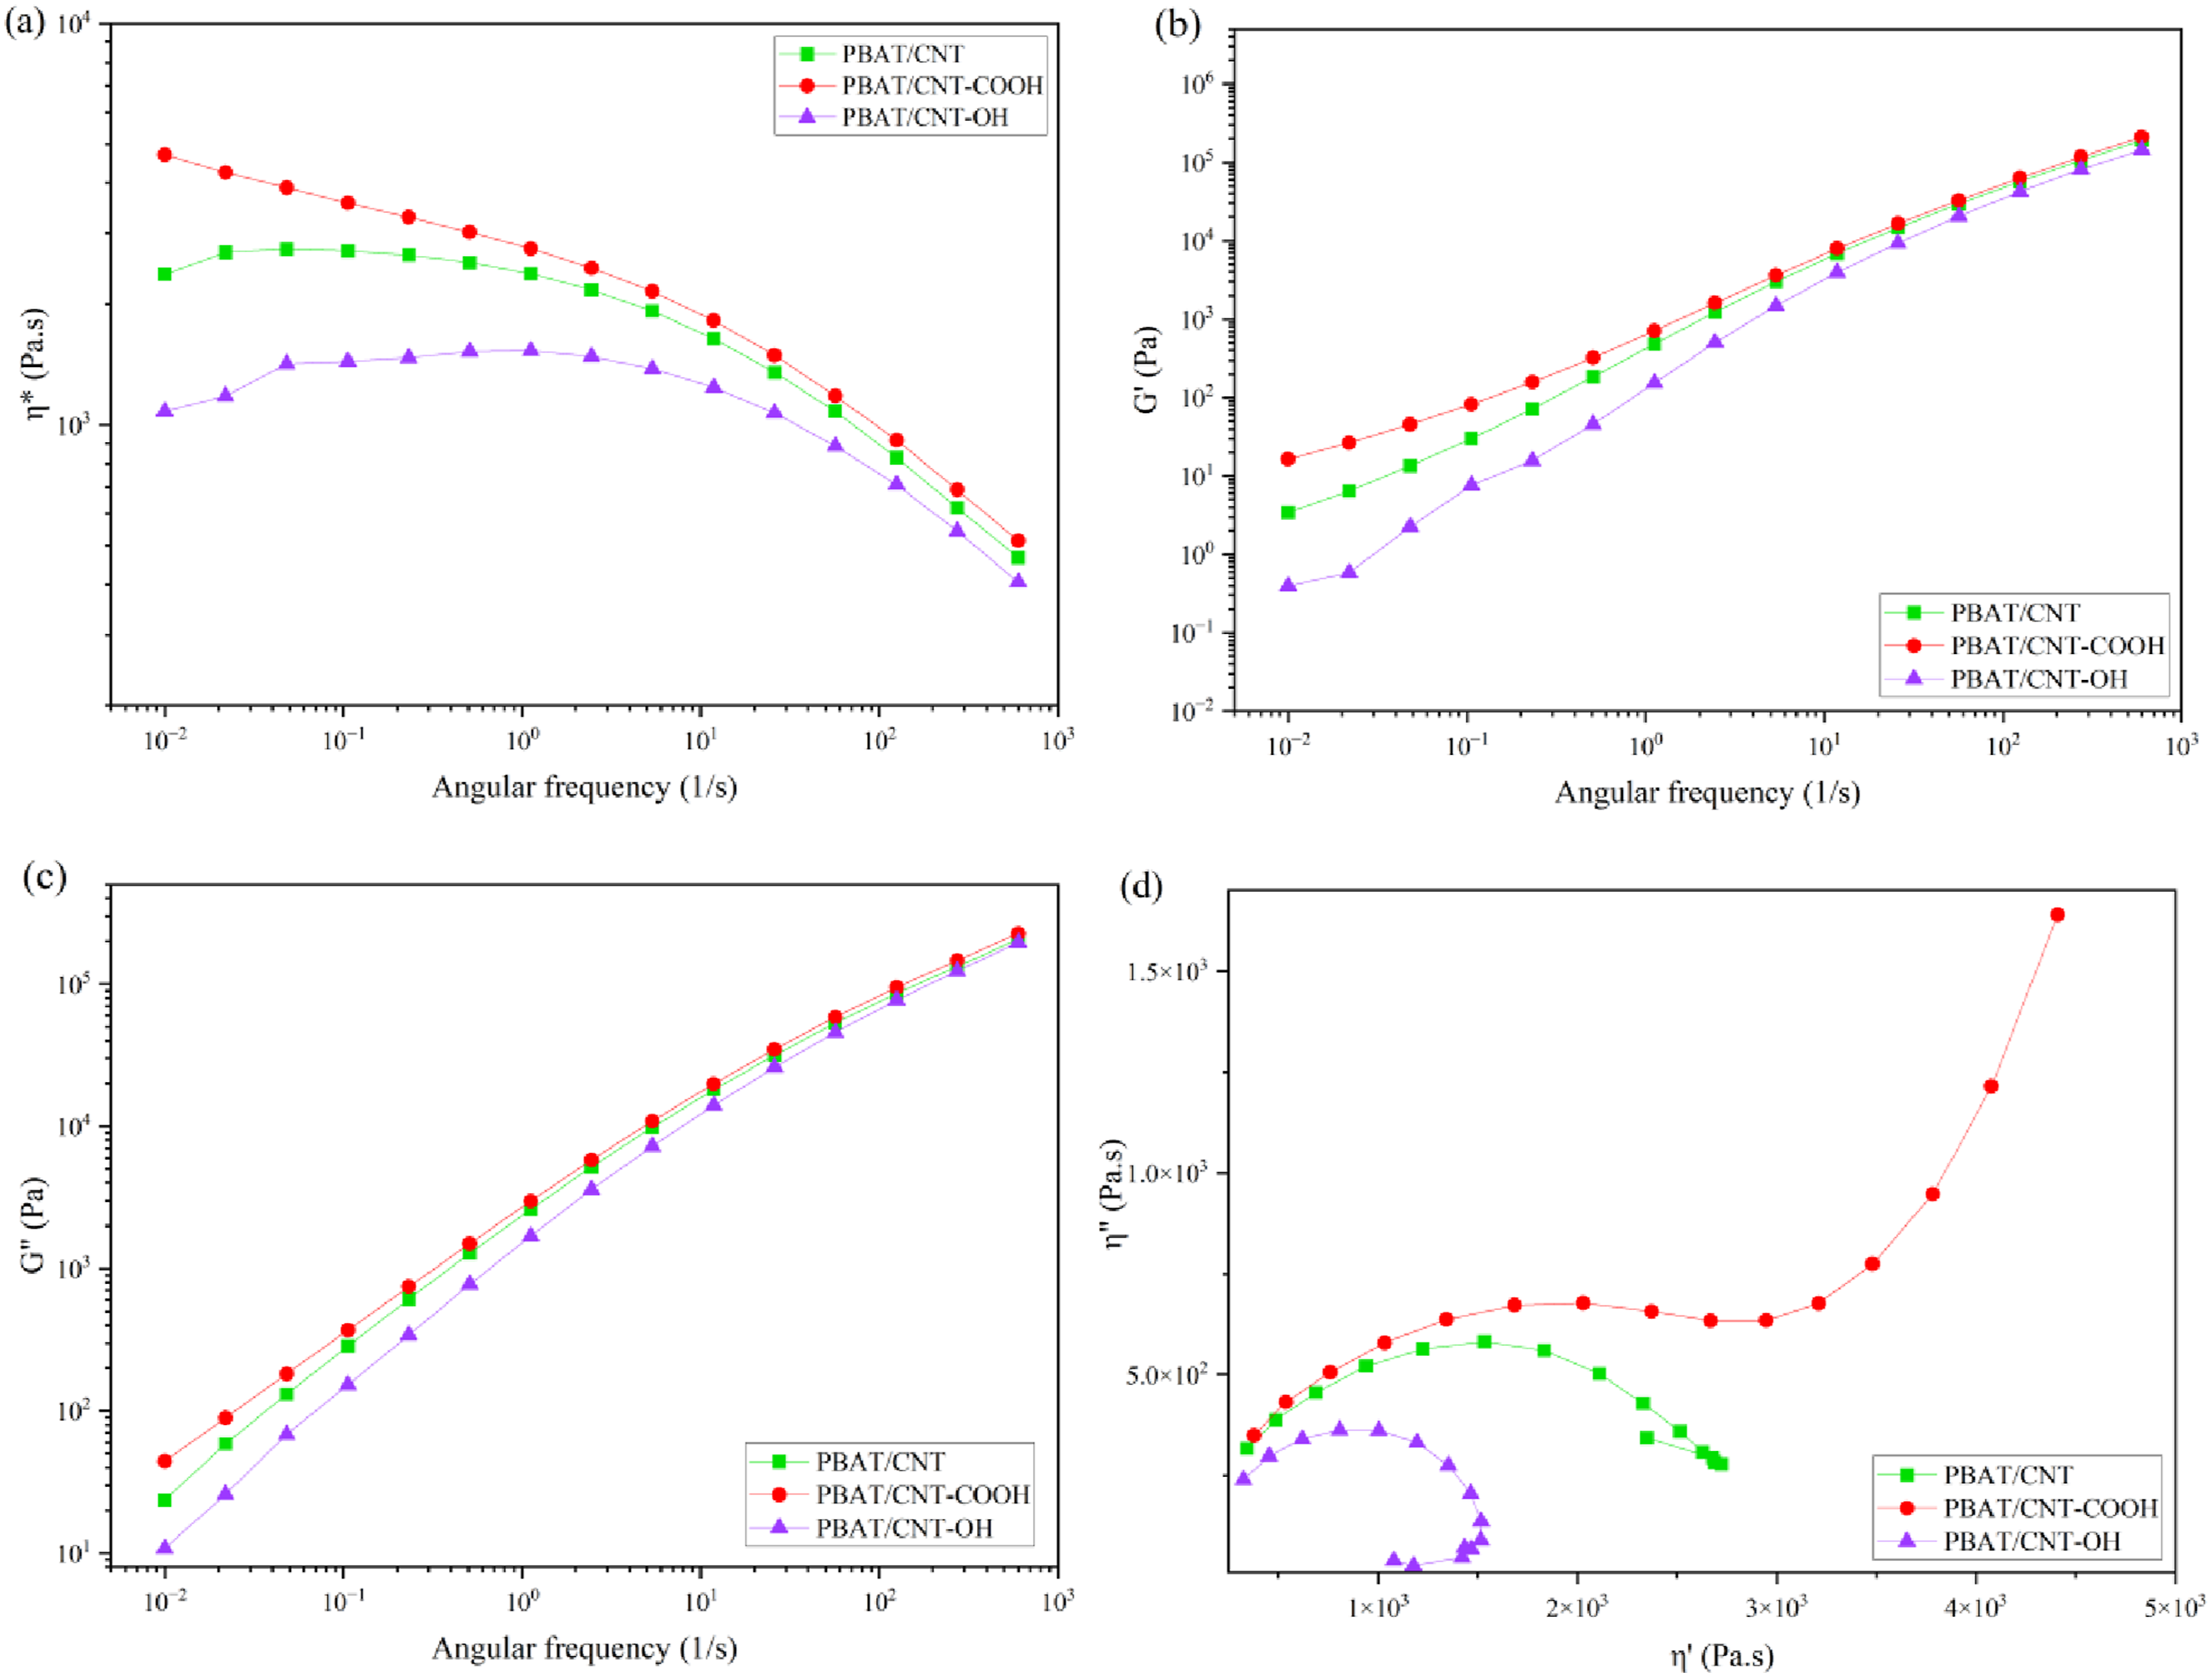
Storage modulus and loss modulus as functions of frequency are displayed in Figure 8(b) and (c). The storage modulus at low frequencies is another indication of better dispersion and network formation. As shown in Figure 8(b), PBAT/CNT-COOH shows a lower slope at low frequencies compared to the other samples, which is due to stronger interfacial interactions and slower relaxation dynamics originating from more restrictions on PBAT chains by CNT-COOH nanoparticles. 40
Cole–Cole plots are shown in Figure 8(d) to further investigate interfacial interactions and dispersion. At higher viscosities, the PBAT/CNT-COOH sample shows a noticeable tail, which is often explained by the existence of a bound polymer layer encircling the CNTs. This attribute indicates that PBAT and CNT-COOH have stronger interactions than the other nanocomposites. 41
Interestingly, the viscosity of the PBAT/CNT-OH sample is lower than that of the PBAT/CNT system. The balance between CNT–CNT and PBAT–CNT interactions, which overall determine the final dispersion state, can be used to clarify this behavior.
Functional groups introduced into CNTs have the potential to decrease the PBAT–CNT interfacial energy while elevating the CNT–CNT surface energy. When it comes to CNT-COOH, the decrease in PBAT–CNT interfacial energy surpasses CNT–CNT interactions, leading to increased dispersion.
Conclusion
The dispersion states of PBAT/CNT, PBAT/CNT-COOH, and PBAT/CNT-OH nanocomposites were systematically investigated using EIS and rheological analysis, with findings validated through Raman spectroscopy and FE-SEM imaging. FE-SEM micrographs demonstrated superior dispersion and distribution in the PBAT/CNT-COOH samples, attributed to the enhanced interaction between the carboxyl (-COOH) groups of CNTs and the ester groups of the PBAT matrix. In contrast, the dispersion states for the pristine PBAT/CNT and PBAT/CNT-OH samples were found to be nearly identical. Raman spectroscopy further supported these observations; results from three random sampling points showed significantly less variation for the PBAT/CNT-COOH sample compared to the others, confirming a more homogeneous distribution. EIS measurements revealed that the real part of the impedance and the frequency cutoff for PBAT/CNT-COOH were 900 Ω and 70 Hz, respectively. For the PBAT/CNT and PBAT/CNT-OH samples, these values were significantly different, centering around 150 Ω, and 450 Hz. These results indicate fewer interconnected pathways in the carboxylated sample compared to its counterparts. Analysis of the imaginary part of the impedance further confirmed that the PBAT/CNT-COOH sample exhibited a higher dielectric relaxation time. Nyquist plots showed a higher semicircle center position for the PBAT/CNT-COOH sample, signifying increased interparticle distance due to the formation of a thicker bound polymer layer around the CNT-COOH. The experimental Nyquist data were successfully fitted to a modified Randles model, revealing that the PBAT/CNT-COOH sample behaves as a near-ideal capacitor with an α value of 0.992. Notably, the PBAT/CNT-OH sample exhibited the highest effective capacitance at 2.13 µF. The Universal Power Law (UPL) model provided an excellent fit for the AC conductivity data up to 10,000 Hz. The PBAT/CNT-COOH sample demonstrated a DC conductivity of 2.05 × 10⁻⁴ S/m and an s value of 0.63, reflecting a highly dispersed structure. This was followed by CNT-OH (s = 0.62) and pristine CNT (s = 0.57). Finally, rheological analysis corroborated the electrical and morphological findings. The Cole-Cole plots for the PBAT/CNT-COOH sample displayed a distinct sharp tail, and viscosity plots showed a notable viscosity upturn. These features confirm the formation of a robust bound layer and “wrinkles” around the CNT-COOH surfaces, driven by the superior interfacial interaction between the carboxylated nanotubes and the PBAT matrix.
Supplemental material
Supplemental Material - Dispersion characterization of nanoparticles in polymer matrices by EIS: PBAT/CNT, PBAT/CNT-OH and PBAT/CNT-COOH
Supplemental Material for Dispersion characterization of nanoparticles in polymer matrices by EIS: PBAT/CNT, PBAT/CNT-OH and PBAT/CNT-COOH by Parsa Dadashi, Mohammad Miri, Ghodratollah Hashemi Motlagh in Journal of Thermoplastic Composite Materials
Footnotes
Acknowledgements
The authors are grateful to Azmoon Dana Plastic for providing the EIS equipment.
Author contributions
Declaration of conflicting interests
The authors declared no potential conflicts of interest with respect to the research, authorship, and/or publication of this article.
Funding
The authors received no financial support for the research, authorship, and/or publication of this article.
Data Availability Statement
The datasets analyzed during the current study are available from the corresponding author upon reasonable request.
Supplemental material
Supplemental material for this article is available online.
References
Supplementary Material
Please find the following supplemental material available below.
For Open Access articles published under a Creative Commons License, all supplemental material carries the same license as the article it is associated with.
For non-Open Access articles published, all supplemental material carries a non-exclusive license, and permission requests for re-use of supplemental material or any part of supplemental material shall be sent directly to the copyright owner as specified in the copyright notice associated with the article.