
Abstract
The development of flexible polymer nanocomposites with enhanced functional properties is of considerable interest for modern optoelectronic and sensing technologies. This study investigates a (Poly (vinyl alcohol) (PVA) - Polyvinyl pyrrolidone (PVP)) blend doped with hybrid (titanium nitride (TiN) - silicon dioxide (SiO2)) nanofillers as a promising material for improving optical, dielectric, and capacitive pressure-sensing performance. The prepared films were characterized by FTIR spectroscopy, optical microscopy, UV-Vis spectroscopy, and LCR measurements. The polymer matrix and the additional nanoparticles interact physically, according to FTIR spectra. The absorbance (A), refractive index (n), and optical conductivity (σop) of the empty PVA-PVP matrix all go up in a regular way when the amount of (TiN-SiO2) nanoparticles goes up. In parallel, the optical band gap for permitted transitions decreases from 4.73 to 4.38 eV, whereas the optical band gap for prohibited transitions decreases from 4.44 to 3.80 eV. These changes demonstrate that the produced nanocomposites are suitable for a variety of optoelectronic devices, including solar cells, transistors, electronic switches, photovoltaic modules, lasers, and diodes. Urbach energy (Eᵤ), the nonlinear refractive index (n2), the linear susceptibility (χ(1)), and the third-order nonlinear susceptibility (χ(3)). In contrast, a consistent reduction is observed in the average oscillator strength (S0), the dispersion energy (Ed.), and the single-oscillator energy (Eosc). Dielectric characterization shows that adding more (TiN-SiO2) nanoparticles to the mix raises the real part of the permittivity (ε′), dielectric loss (ε″), and alternating-current conductivity (σa.c) compared to pure PVA-PVP. Also, pressure-sensing tests show that the PVA-PVP-TiN-SiO2 nanostructure films have great pressure sensitivity, high mechanical flexibility, and great environmental durability. This suggests that they might make excellent advanced active layers for pressure sensor technologies of the future.
Keywords
Introduction
Polymers have existed in our lives from the beginning of time, and they make up all of life’s foundations (building blocks). Until the middle of the twentieth century, humans did not completely know the true nature of polymers. Polymers have infiltrated every aspect of our life. It’s difficult to imagine today’s society without man-made polymeric materials, with all of its luxury and convenience. Increased understanding of polymer structure property correlations, development of revolutionary polymerization methods, and availability of novel and low-cost monomers have all contributed to the concept of a completely tailor-made polymer becoming a reality in recent years. 1 Polymers with corrosion resistance, low weight, and strong hardness are used to make a wide variety of products, including home-made plastics, automobile internal and external components, biomedical equipment, and satellite applications. 2 When two or more separate polymers are combined together, they produce a new material with physical characteristics that are different from those of the original polymers. 3
Poly(vinyl alcohol) (PVA) is considered a very important polymer that is used in a lot of important technical and industrial areas, such as electro chromic devices, fuel cells, biomedical systems, and many types of sensing platforms. 4 This material has many good qualities, including being biodegradable, chemically stable, environmentally friendly, able to hold a lot of charge, resistant to wear and tear, able to stretch and hold its shape, flexible, able to withstand heat, easy to make into films, and cheap to make. PVA is also a synthetic polymer that dissolves in water, is not very poisonous, and works very well in biological settings. This makes it a great choice for use in wound dressings and other biomedical applications.5,6
Polyvinyl pyrrolidone (PVP), a non-ionic polymer, has been used across a wide range of industries including paper, fibers and textiles, ceramics, and pharmaceuticals owing to its exceptional qualities. 7 PVP has garnered particular interest among conjugated polymers due to its superior environmental resilience, ease of processing, and remarkable transparency. PVP is a promising material characterized by a high charge storage capacity and dopant-dependent electrical and optical characteristics. Chemically, PVP has been shown to be inert and non-toxic, and notably, its melting point ranges from 150 to 180°C. 8
TiN is a significant material distinguished by several exceptional features, including exceptional hardness, great chemical and thermal stability, commendable thermal and electrical conductivity, and suitability for use in demanding situations. 9 Recently, TiN nanoparticles (NPs) have gotten a lot of interest as a new plasmonic platform that might be used instead of traditional noble-metal systems. In most plasmonic nanostructures, silver usually has absorption/scattering resonance in the ultraviolet range about 410 nm, whereas gold usually has its resonance in the visible range at 520–550 nm. In contrast, TiN NPs have a plasmonic response that is clearly red-shifted. The resonance band is between 670 and 700 nm, and the spectral tail goes beyond 800 nm. 10
The industry employs fumed (SiO2) nanoparticles as nanofillers in thermoplastic polymers and electronic packaging. Silica, a fine white powder, is characterized by high heat stability, improved mechanical properties, and a large specific surface area. Furthermore, SiO2 is a non-toxic, amorphous substance that may be incorporated with polymers containing nanopores and fabricated into nanocomposite materials for use in optoelectronic devices.11,12 By functioning as an effective plasticizer, the SiO2 particles improve the composite polymer’s mechanical, chemical, and dimensional stability. 13
The structural, optical, electrical, and dielectric characteristics of polymer nanocomposites are interconnected and crucial in determining the performance of the device. While optical properties like absorbance, refractive index, and optical band gap are crucial for regulating light absorption and photon-driven processes in optoelectronic applications, structural features shed light on filler dispersion, interfacial interaction, and phase compatibility within the polymer host. Similarly, charge transport and switching behavior depend on electrical conductivity, and polarization mechanisms, energy storage capacity, and capacitive sensing response are closely related to dielectric characteristics. For applications like pressure sensors, flexible electronics, energy-storage components, and other cutting-edge optoelectronic devices, it is therefore very desired to improve these characteristics in a single flexible nanocomposite system.14–16
Despite the progress reported in polymer nanocomposites, the available studies still show some shortcomings, including the frequent use of single-filler systems, limited multifunctional evaluation, and insufficient exploration of hybrid nanofillers capable of simultaneously tuning optical, dielectric, and sensing properties. These limitations motivated the present work, in which hybrid TiN-SiO2 nanofillers were introduced into a PVA-PVP blend to obtain a flexible nanocomposite with improved multifunctional performance. Recent studies have confirmed the increasing importance of polymer nanocomposites due to their ability to exhibit enhanced structural, optical, electrical, and dielectric properties, which make them attractive for a wide range of advanced applications such as flexible electronics, 17 energy storage, 18 optoelectronic devices, 19 sensors, 20 and biomedical applications. 21 Motivated by these developments, the present work focuses on a PVA–PVP blend reinforced with hybrid TiN–SiO2 nanofillers. The unique scientific contribution of this study lies in demonstrating that this hybrid nanofiller system can simultaneously tailor multiple functional properties of the host matrix while also providing experimentally verified capacitive pressure-sensing behavior. In this way, the present work extends beyond general material characterization and offers a clearer structure–property–application correlation compared with many previously reported systems.
The PVA-PVP-TiN-SiO2 nanocomposite system was selected on the basis of the advantageous properties of its individual components, as described above. These characteristics were the main reason for choosing this combination, since they provide a suitable basis for developing flexible nanocomposite films with enhanced optical, electrical, dielectric, and pressure-sensing performance.
Materials and methods
An aqueous casting solution was prepared by dissolving 1 g of the PVA–PVP blend in 80 mL of deionized water under magnetic stirring at room temperature until a fully homogeneous mixture was obtained. Subsequently, TiN–SiO2 nanofillers (0.02, 0.04, and 0.06 g) were introduced into separate portions of the polymer solution, followed by an additional 30 min of stirring to promote uniform filler dispersion. The resulting dispersions were cast onto glass Petri dishes and left to dry at room temperature for 72 h, producing free-standing films with an average thickness of ∼112 μm and comparable lateral dimensions. The fabricated polymer nanocomposite (PNC) films were then characterized using complementary analytical techniques. FTIR spectroscopy (Bruker, Germany) was employed to examine the chemical structure and possible interactions within the PNCs, while surface morphology was inspected using an Olympus-73346 optical microscope at 10× magnification. Optical measurements were performed using a Shimadzu UV-1800 spectrophotometer across the 200–780 nm wavelength range. Dielectric properties were evaluated using an LCR meter (HIOKI TESTER 3532/50). For pressure-sensing evaluation, the parallel capacitance was recorded between two electrodes placed on the top and bottom surfaces of the sample under applied pressures from 80 to 160 bar using the same LCR meter.
The values of Tr, α, and A were obtained by applying the following mathematical expressions.22,23
A is the measured absorbance; Io, IA, and ITr refer to the incident, absorbed, and transmitted light intensities, respectively; and d is the thickness of the prepared film.
The optical band-gap analysis was carried out using the indirect-transition (non-direct) model expressed in equation (4).
24

The formula between Urbach tail energy Eu and absorption coefficient α is.
25

Wemple and DiDomenico’s single-effective-oscillator model offers a robust framework for examining the dependence of the refractive index on photon energy.
26
Eosc (single oscillator’s energy), and Ed. (dispersion energy).
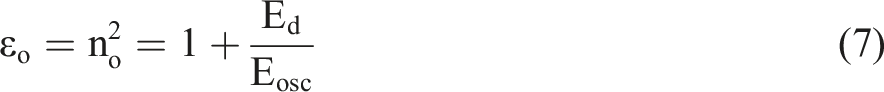
The well-established mathematical relationship between Ed. and Eosc is crucial for establishing the zero-frequency dielectric constant (ε0) and related refractive index (n0).
27
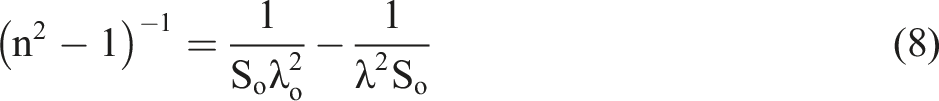
The extended wavelength approximation of the single-term Sellmeier equation maintains the physical relevance of oscillator parameters, making it an alternate dispersion parameter method. Relationship is shown via equation.
26
Miller’s rule provides a practical semi-empirical route for estimating the third-order nonlinear susceptibility χ(3) and the nonlinear refractive index n2 from readily derived optical parameters. In this approach, the evaluation of χ(3) and n2 is performed using quantities obtained from the Wemple–DiDomenico single-oscillator formalism, particularly the (linear) refractive index, the dispersion energy Ed. and the effective/single-oscillator energy Eosc. The governing relations used for these calculations are given in the following equations.
28
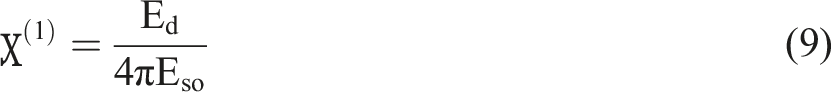
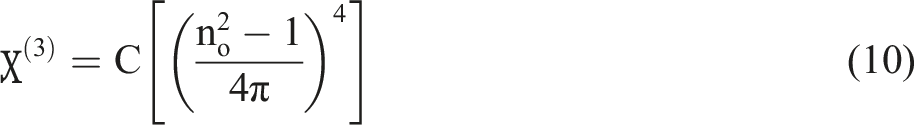
The symbols χ(3), χ(1), n0, and C correspond to the third-order nonlinear susceptibility, linear susceptibility, the zero-frequency refractive index, and a material-independent constant taken as 1.7 × 10⁻¹⁰ esu, respectively. In the present treatment, these parameters are assumed to be essentially invariant among different materials and are considered frequency-independent within the adopted approximation.
Formulas are used to calculate refractive index (n), extinction coefficient (K), optical conductivity, and dielectric constants (ε1 and ε2).29,30


c: the light speed (3x10⁸ m/s)
The alternating current electrical conductivity (σa.c), dielectric constant (ε'), and loss (ε”) come from.31,32
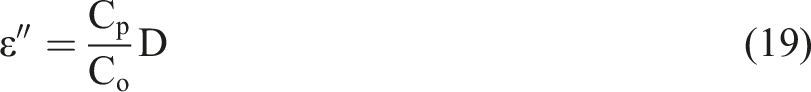
D, Cp, and Co denote displacement, angular frequency, and vacuum capacitors, respectively.
Results and discussion
FTIR analysis of PVA-PVP-TiN-SiO2 PNCs
Atomic/ionic interactions inside the PVA-PVP-TiN-SiO2 nanocomposites were investigated using Fourier-transform infrared (FTIR) spectroscopy since these interactions might show up as quantifiable changes in the materials’ vibrational signatures. Figure 1 displays FTIR transmittance spectra for films with varying TiN-SiO2 nanoparticle loadings, gathered spanning the 500-4500 cm−1 wavenumber range. The large bands at 3248 cm−1 in the figure can be attributed to -OH groups. At around 2883 cm−1, the band linked to the asymmetric stretching vibration of CH2 is visible. The C = C stretching vibration has been identified as the source of the peaks observed at 1647 cm−1. The symmetric bending vibration of CH2 is associated with the strong absorption at around 1573 cm−1. The band at 1153 cm−1 is associated with a C–O bond. FTIR spectra of (PVA-PVP-TiN-SiO2) PNCs.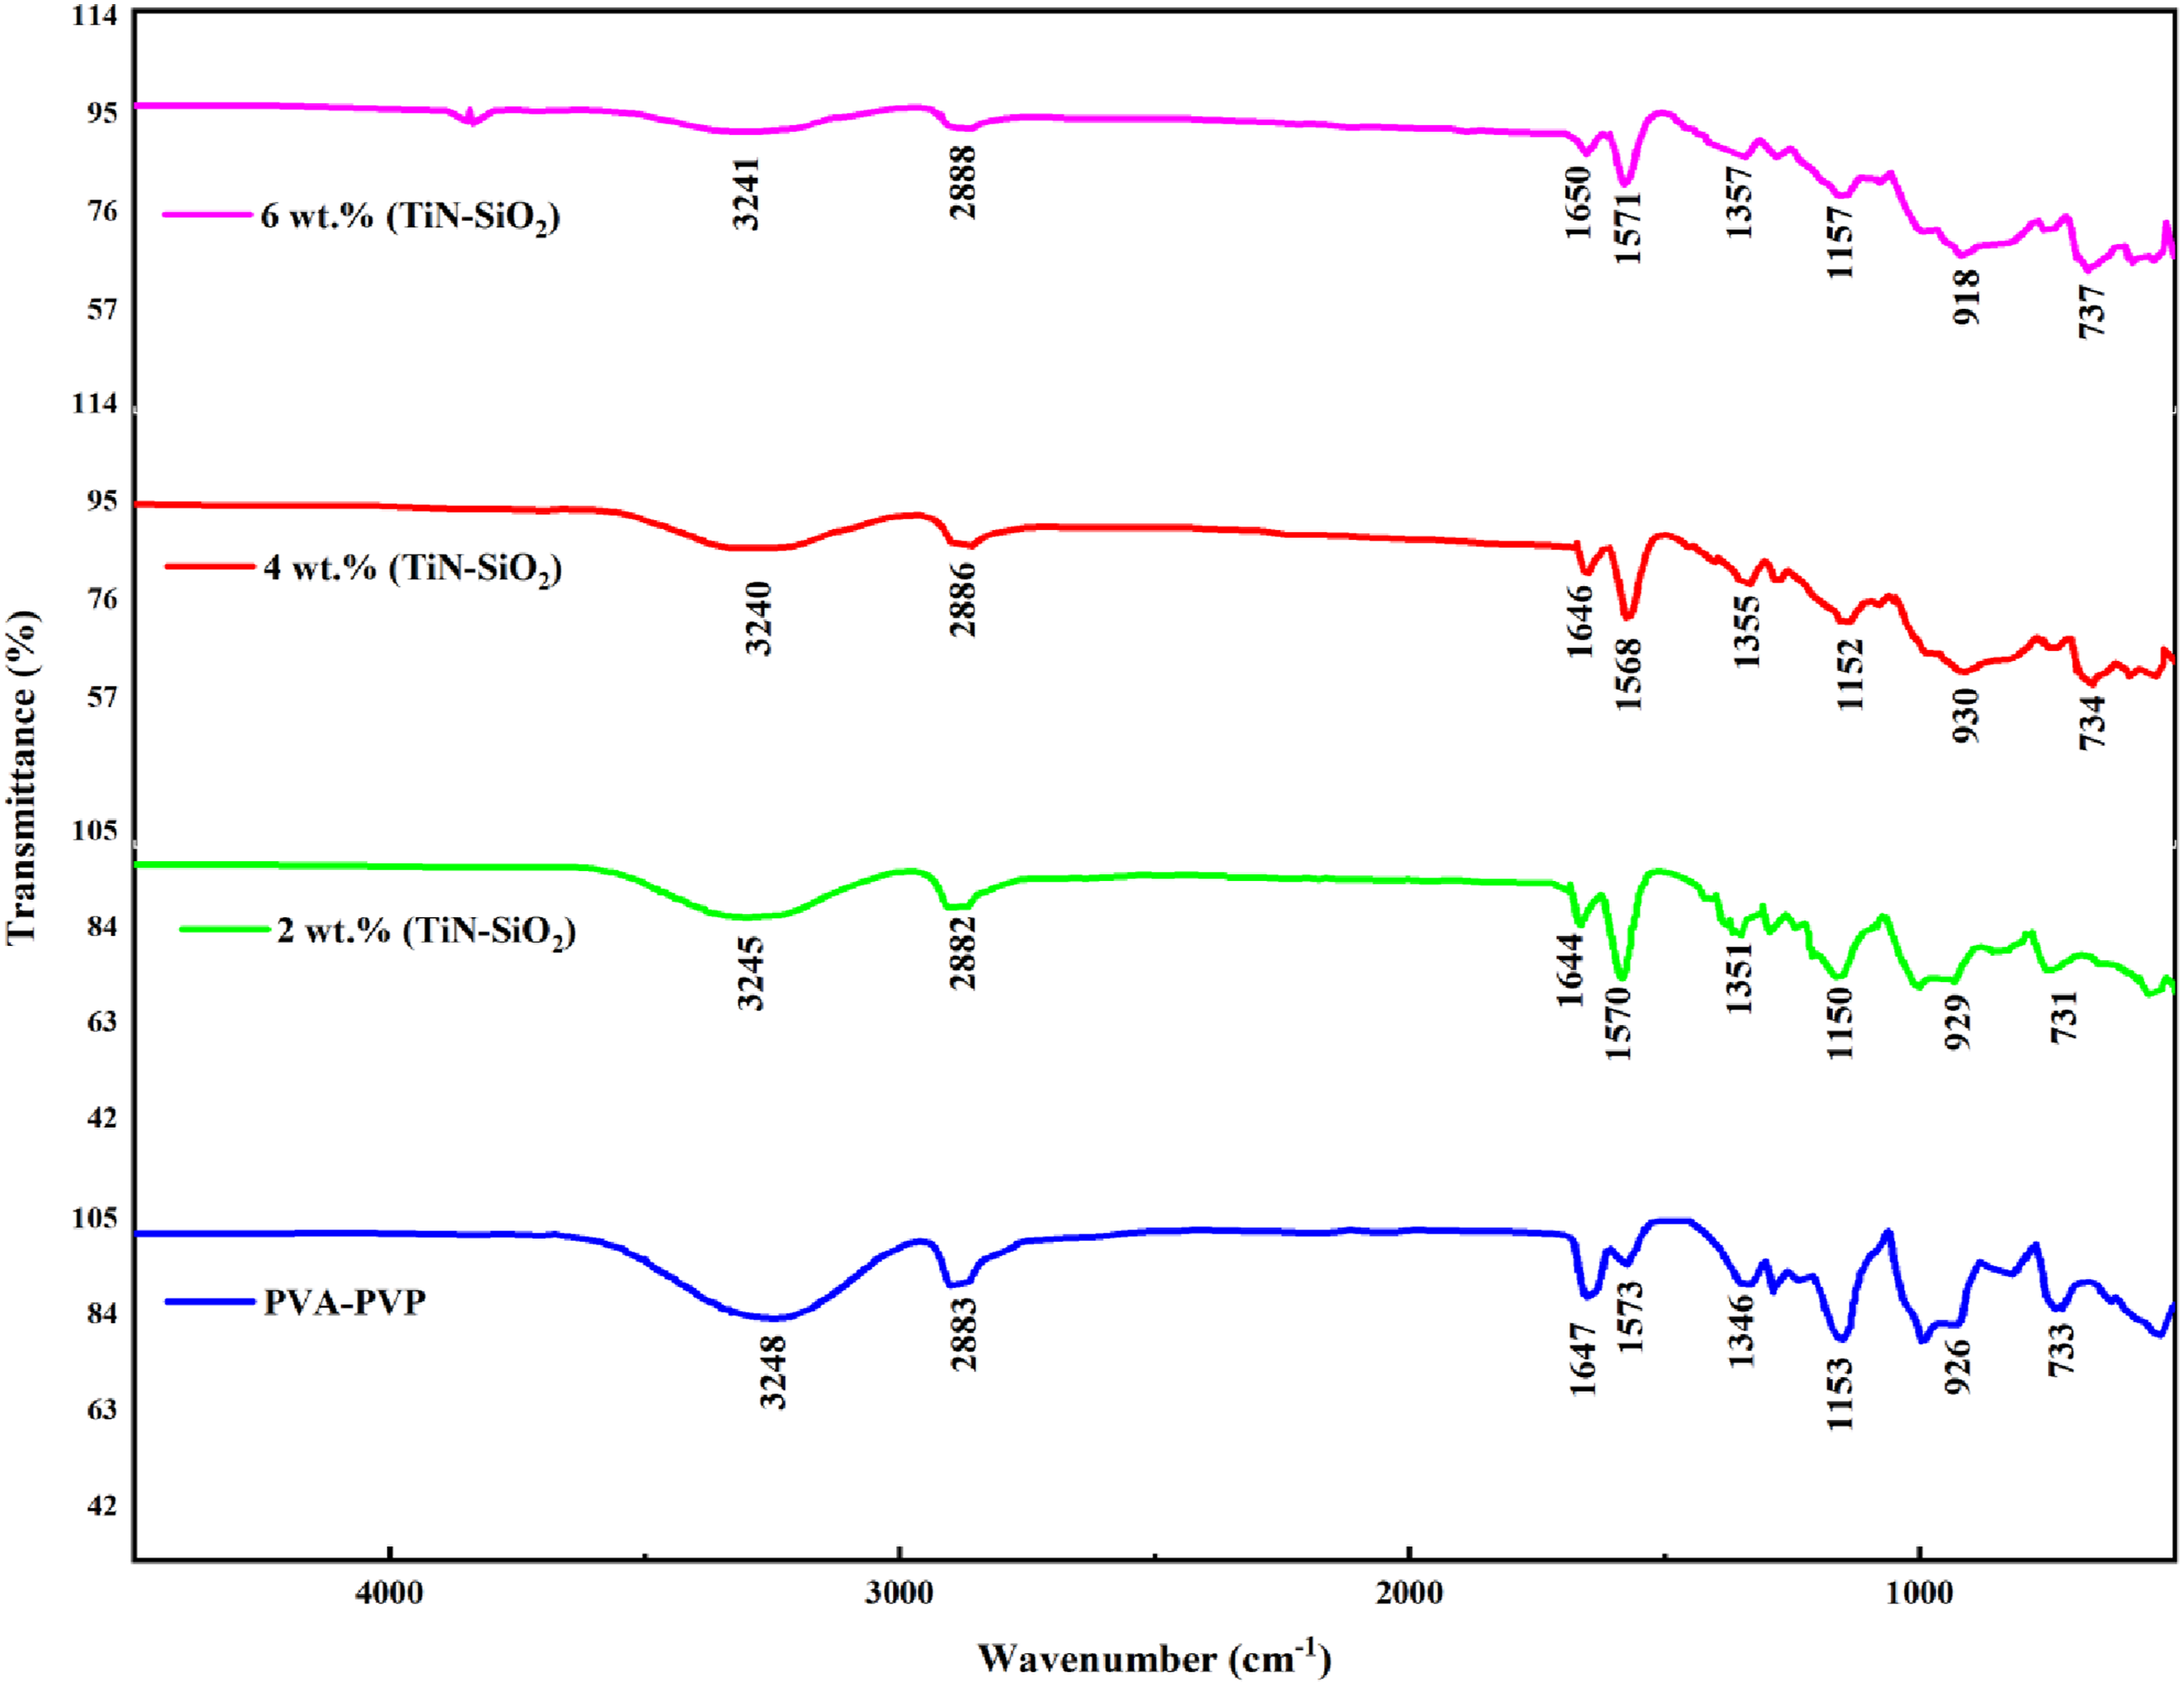
In the PVA-PVP-TiN-SiO2 nanocomposites, varying the TiN-SiO2 content leads to observable shifts in FTIR peak positions as well as changes in band intensity and profile compared with the pure PVA-PVP blend. Such spectral modifications suggest the presence of interfacial interactions between the polymer chains and the added nanofillers, which alter the local bonding environment and, consequently, the vibrational characteristics of the composite system.33,34
The FTIR spectra indicate physical interactions between the polymer blend and the TiN-SiO2 nanofillers. These interactions modify the local structure of the matrix, which can create localized states, reduce the optical energy gap, and facilitate charge transport, thereby increasing the electrical conductivity of the nanocomposite films.
Optical microscope of (PVA-PVP-TiN-SiO2) PNCs
Figure 2 displays optical microscopy pictures of (PVA-PVP-TiN-SiO2) nanocomposites with varying ratios at a specified magnification level (10X). The surface morphology of the polymer blend film seen in figure (A) demonstrates a uniform phase devoid of phase separation, indicating excellent miscibility between PVA and PVP at this particular blend ratio. When the concentrations of (TiN-SiO2) grow inside the (PVA-PVP) mix, the nanoparticles tend to aggregate into clusters within the polymer matrix. At elevated concentrations of (TiN-SiO2) nanoparticles, these particles establish interconnected network pathways that facilitate the passage of charge carriers, resulting in changes to the material characteristics, as seen in images (B, C, and D).35,36 This demonstrated an effective preparation procedure that establishes appropriate conditions for the fabrication of these nanocomposite films. Optical micrographs (10×) of PVA–PVP–TiN–SiO2 polymer nanocomposite (PNCs) films at different nanoparticle loadings: (a) neat PVA–PVP (0 wt% TiN–SiO2), (b) 2 wt% TiN–SiO2, (c) 4 wt% TiN–SiO2, and (d) 6 wt% TiN–SiO2.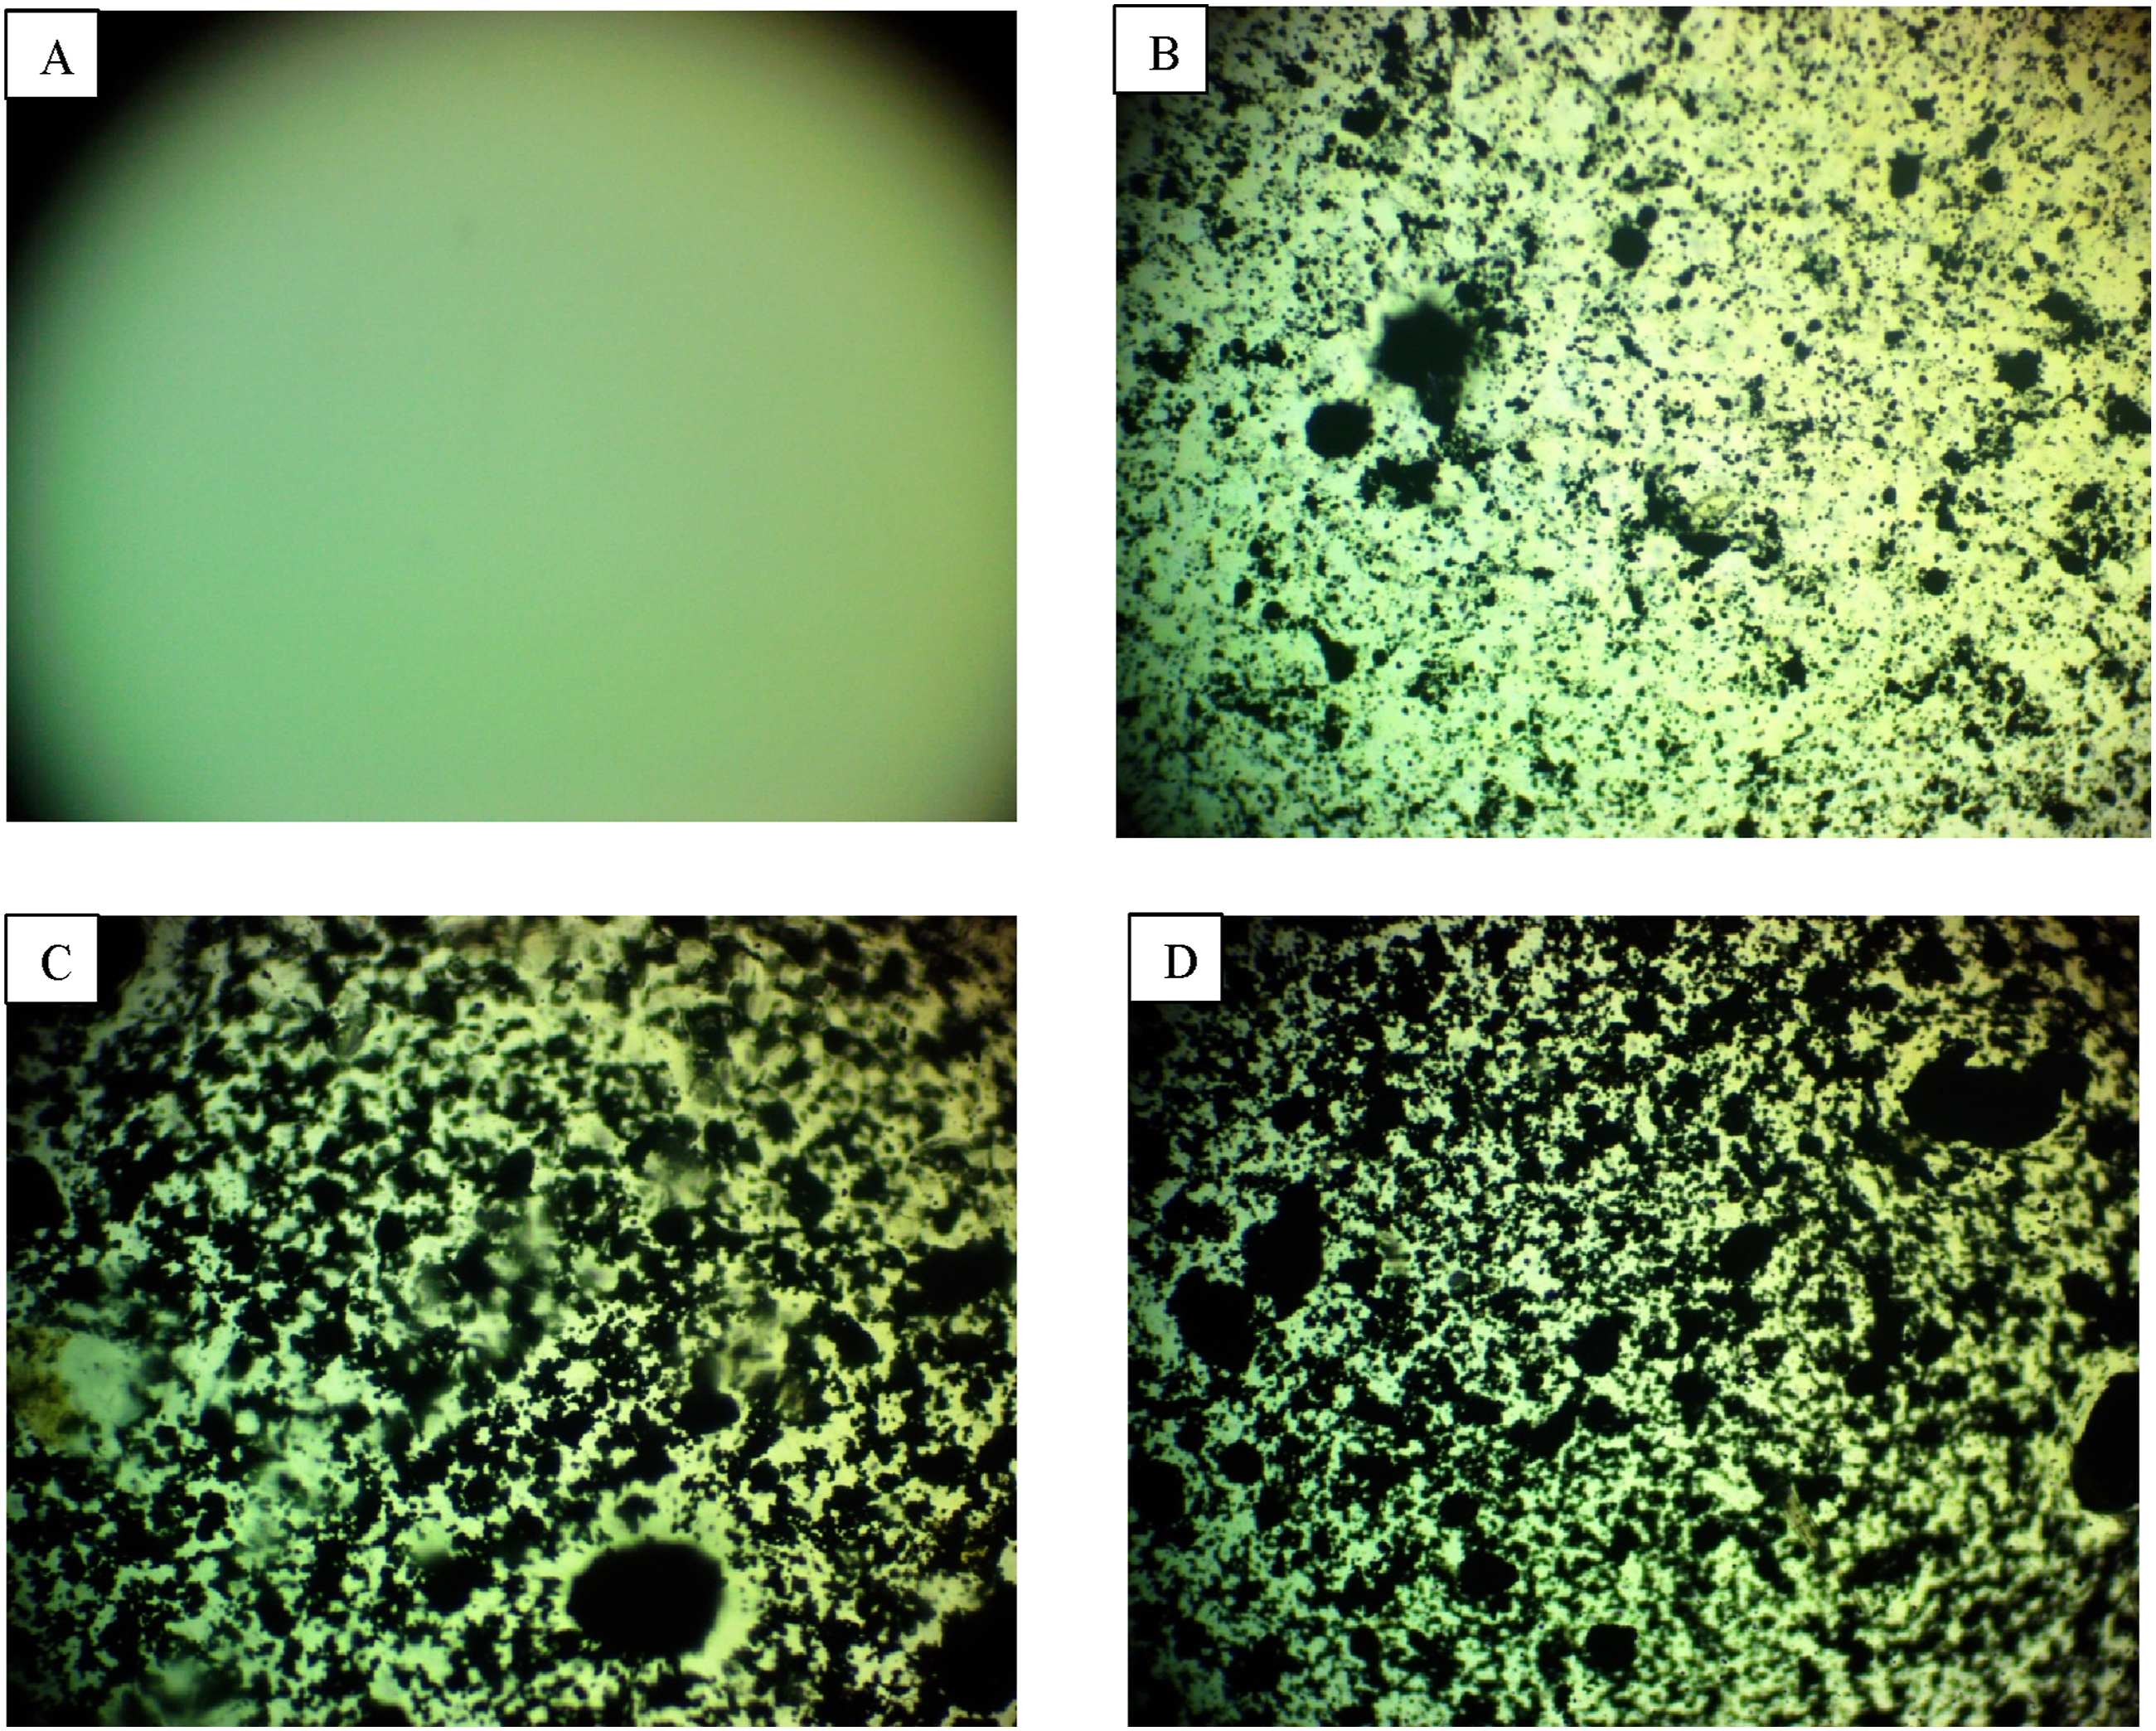
The Optical Properties of (PVA-PVP-TiN-SiO2) PNCs
Figure (3) shows how the PVA-PVP-TiN-SiO2 nanocomposite films absorb light at different wavelengths. All samples exhibit significant absorption in the UV region, indicating that photons contain enough energy to facilitate electronic transitions from lower to higher energy states. In contrast, absorbance stays low in the visible and near-infrared ranges because the photons that hit these areas usually don’t have enough energy to generate similar electronic changes.37,38 In general, the films absorb more strongly at shorter wavelengths and less effectively as the wavelength gets longer. Also, adding more TiN/SiO2 nanoparticles makes the absorbance go up in a systematic way. This is because there are more charge carriers and more localized states (impurity-related levels) emerge in the gap between the valence and conduction bands. These localized states function as intermediary stepping stones that promote electron transitions, allowing absorption to occur even when the photon energy is below the intrinsic optical band-gap threshold.39,40 Absorption spectra of wavelength-dependent PVA-PVP-TiN-SiO2 NCs.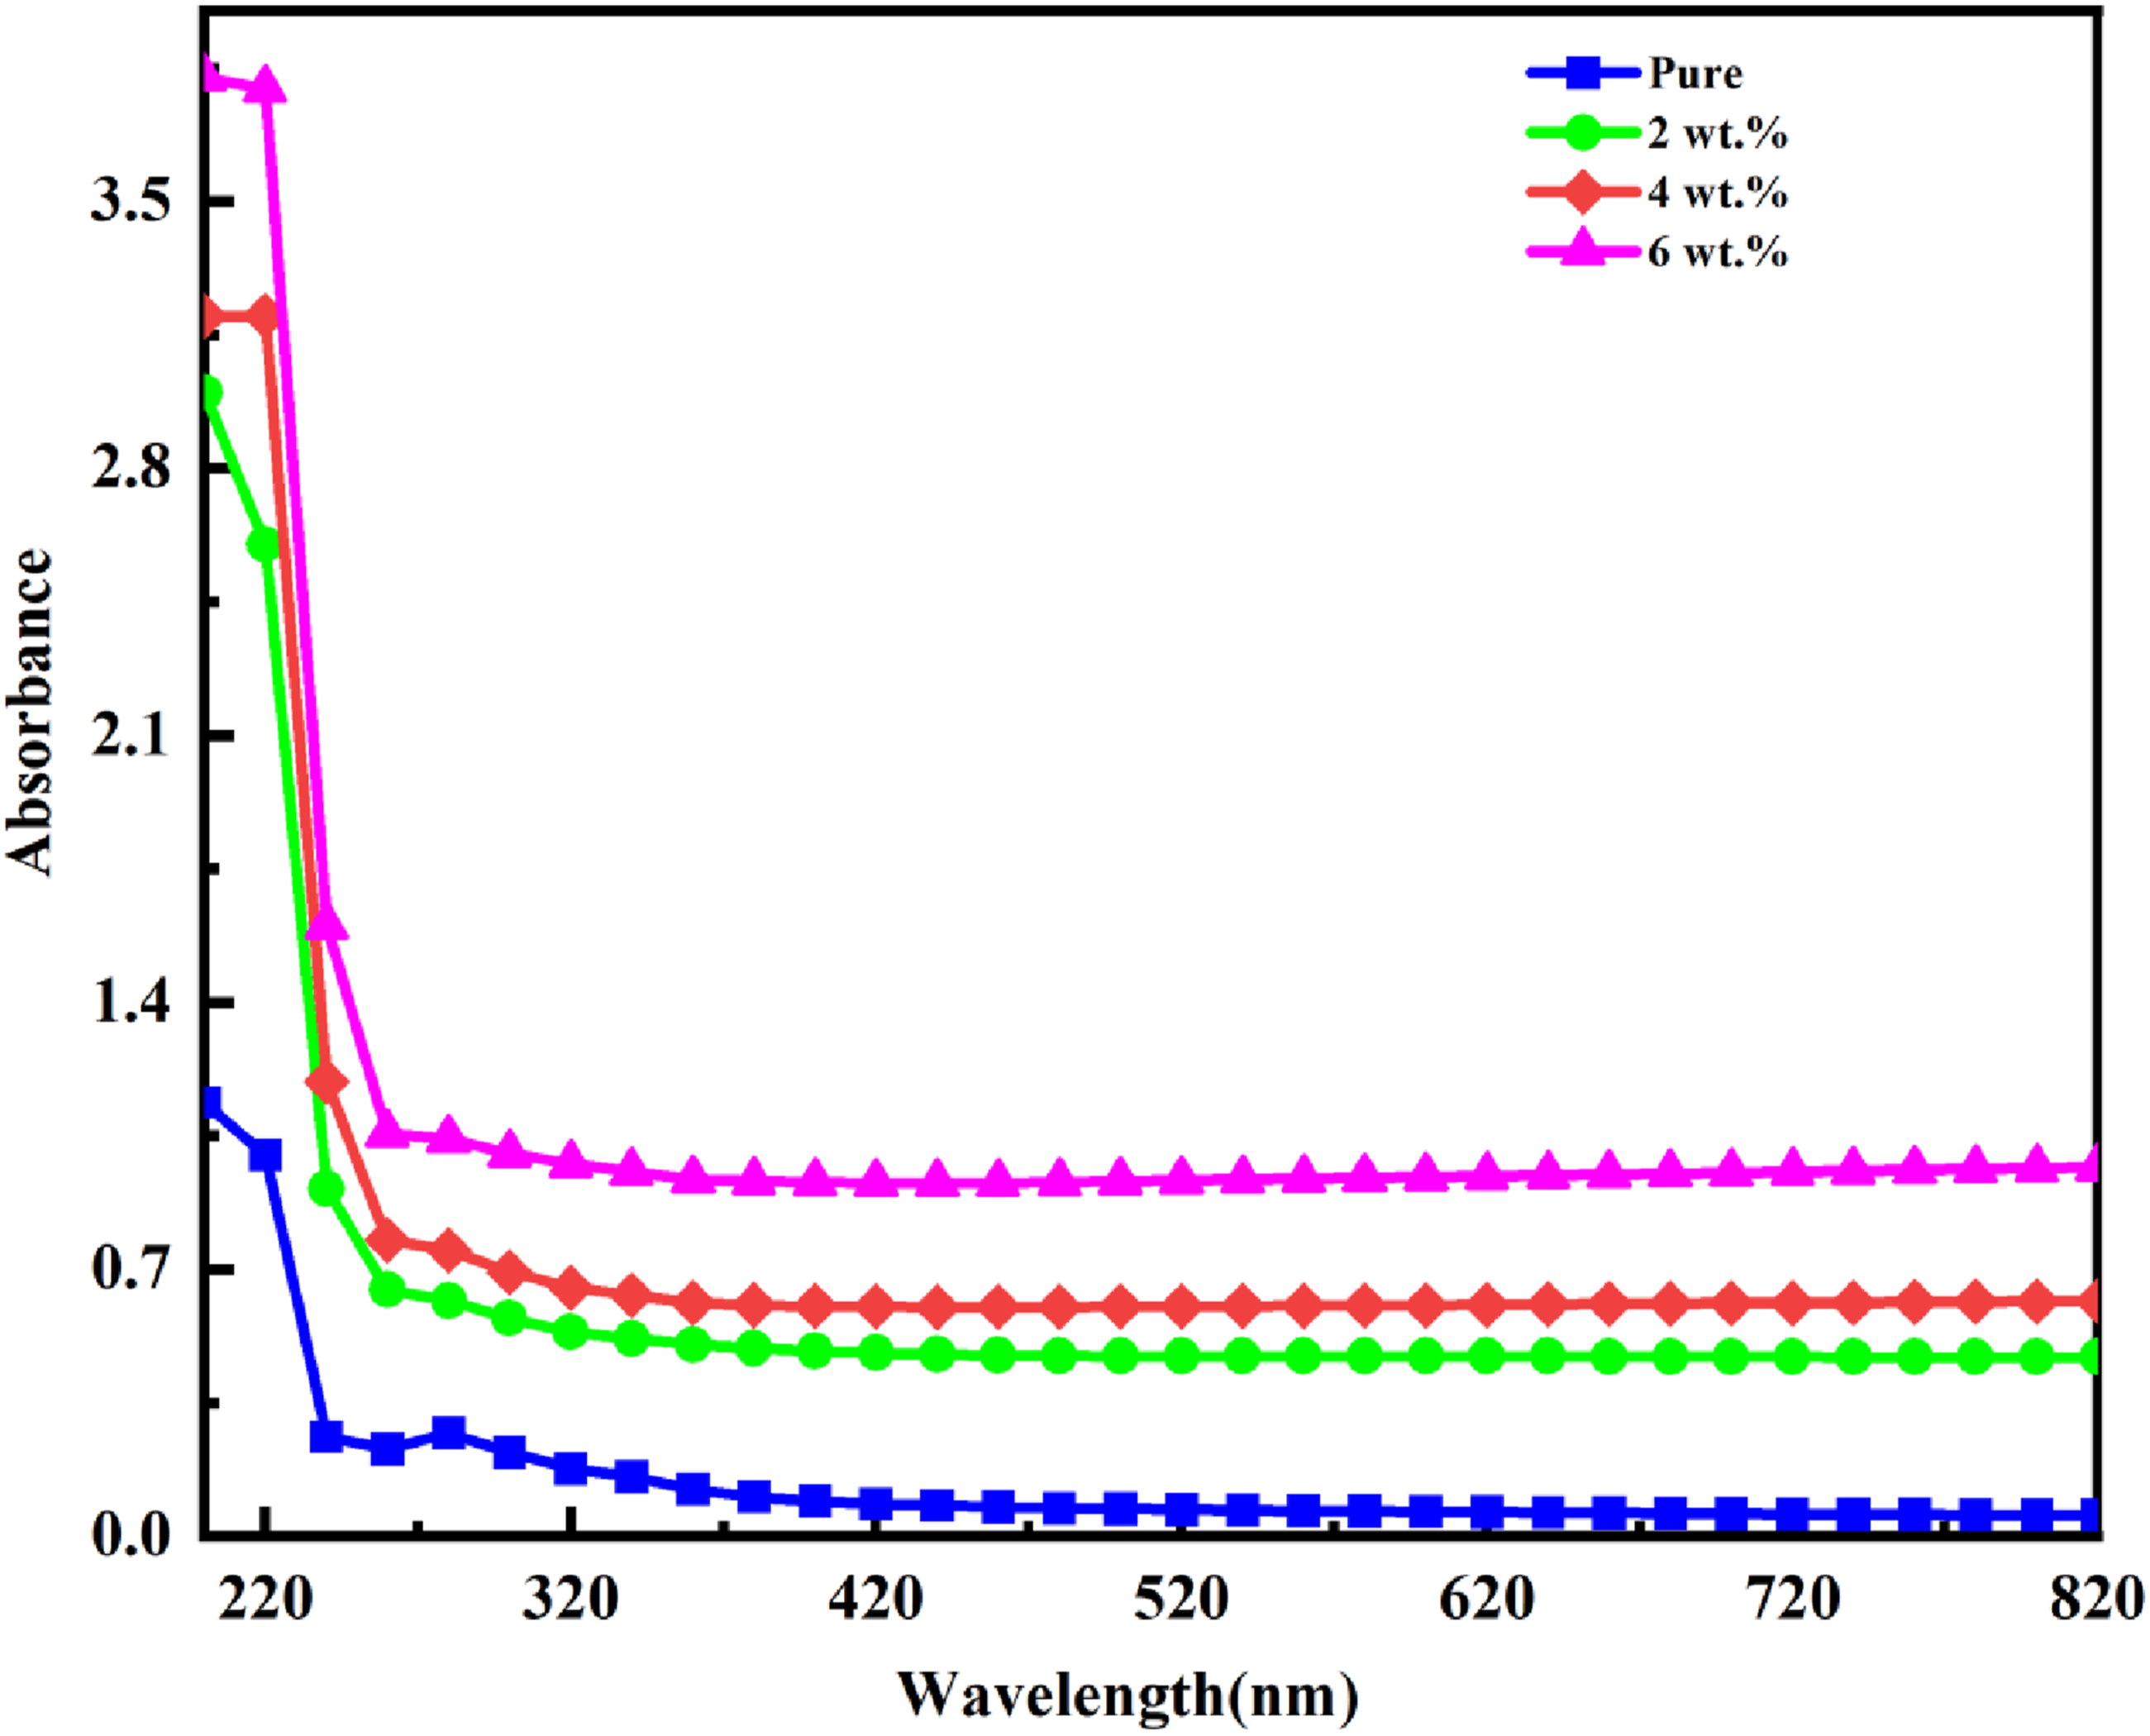
Figure (4) displays the transmittance spectrum of (PVA-PVP-TiN-SiO2) nanocomposites as a function of wavelength. The figure demonstrates that the transmittance of all sample nanocomposites is at its lowest at short wavelengths and progressively rises with longer wavelengths. The transmittance spectrum diminishes as the doping percentage increases, owing to the presence of impurity atoms and the associated formation of localized energy levels within the gap between the valence and conduction bands. Consequently, these localized levels cause fluctuations in absorbance, leading to variations in transmittance.41,42 The wavelength dependency of PVA-PVP-TiN-SiO2 NCs’ transmission spectra.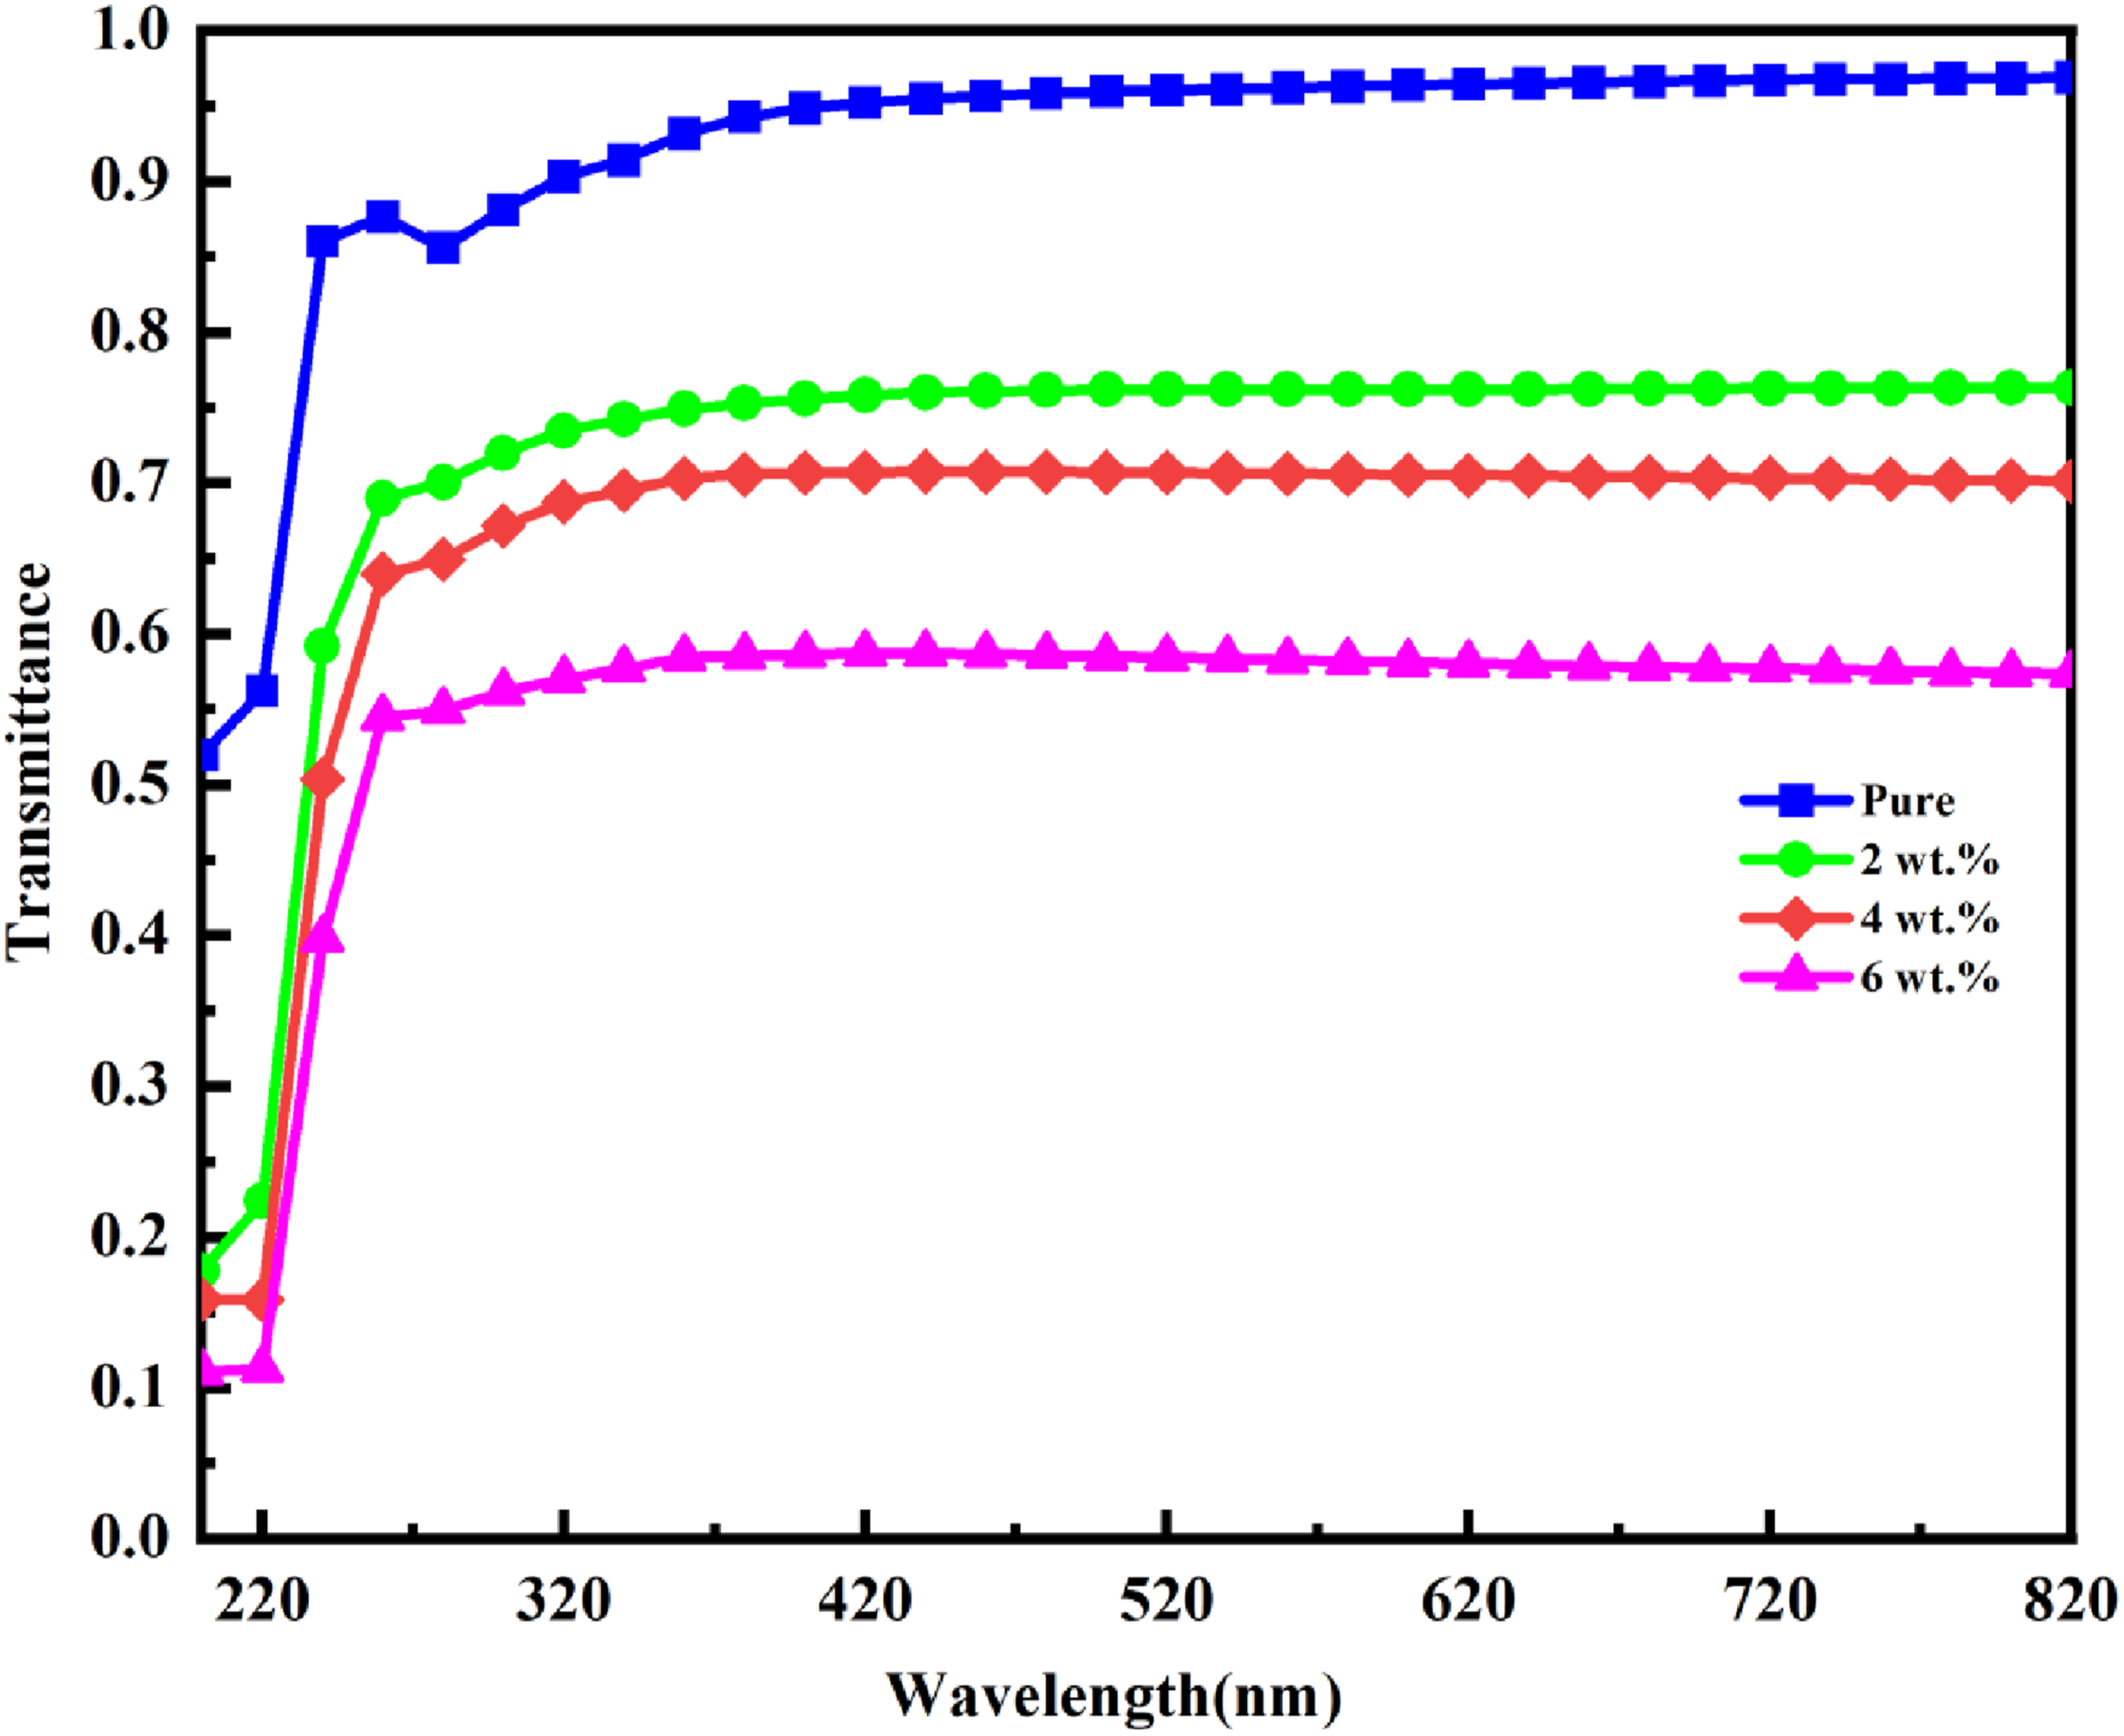
Figure 5 illustrates the absorption coefficient of (PVA-PVP-TiN-SiO2) nanocomposites as a function of wavelength. The absorption coefficient facilitates the characterization of the electron transition. It is evident that the absorption coefficient rises proportionally with the rising concentration of (TiN-SiO2) nanoparticles. The rationale for this is that when the number of charge carriers rises, both the absorbance of (PVA-PVP-TiN-SiO2) and the absorption coefficient both increase. Conversely, the absorption coefficient is minimal at higher wavelengths, as shown (low energy). This indicates that the probability of electron transfer is low, as the energy of the incident photon is insufficient to excite the electron from the valence band to the conduction band. However, at higher energies, the incident photon possesses adequate energy to facilitate this transition from the valence band to the conduction band.43,44 Absorption coefficient of PVA-PVP-TiN-SiO2 PNCs that depends on photon energy.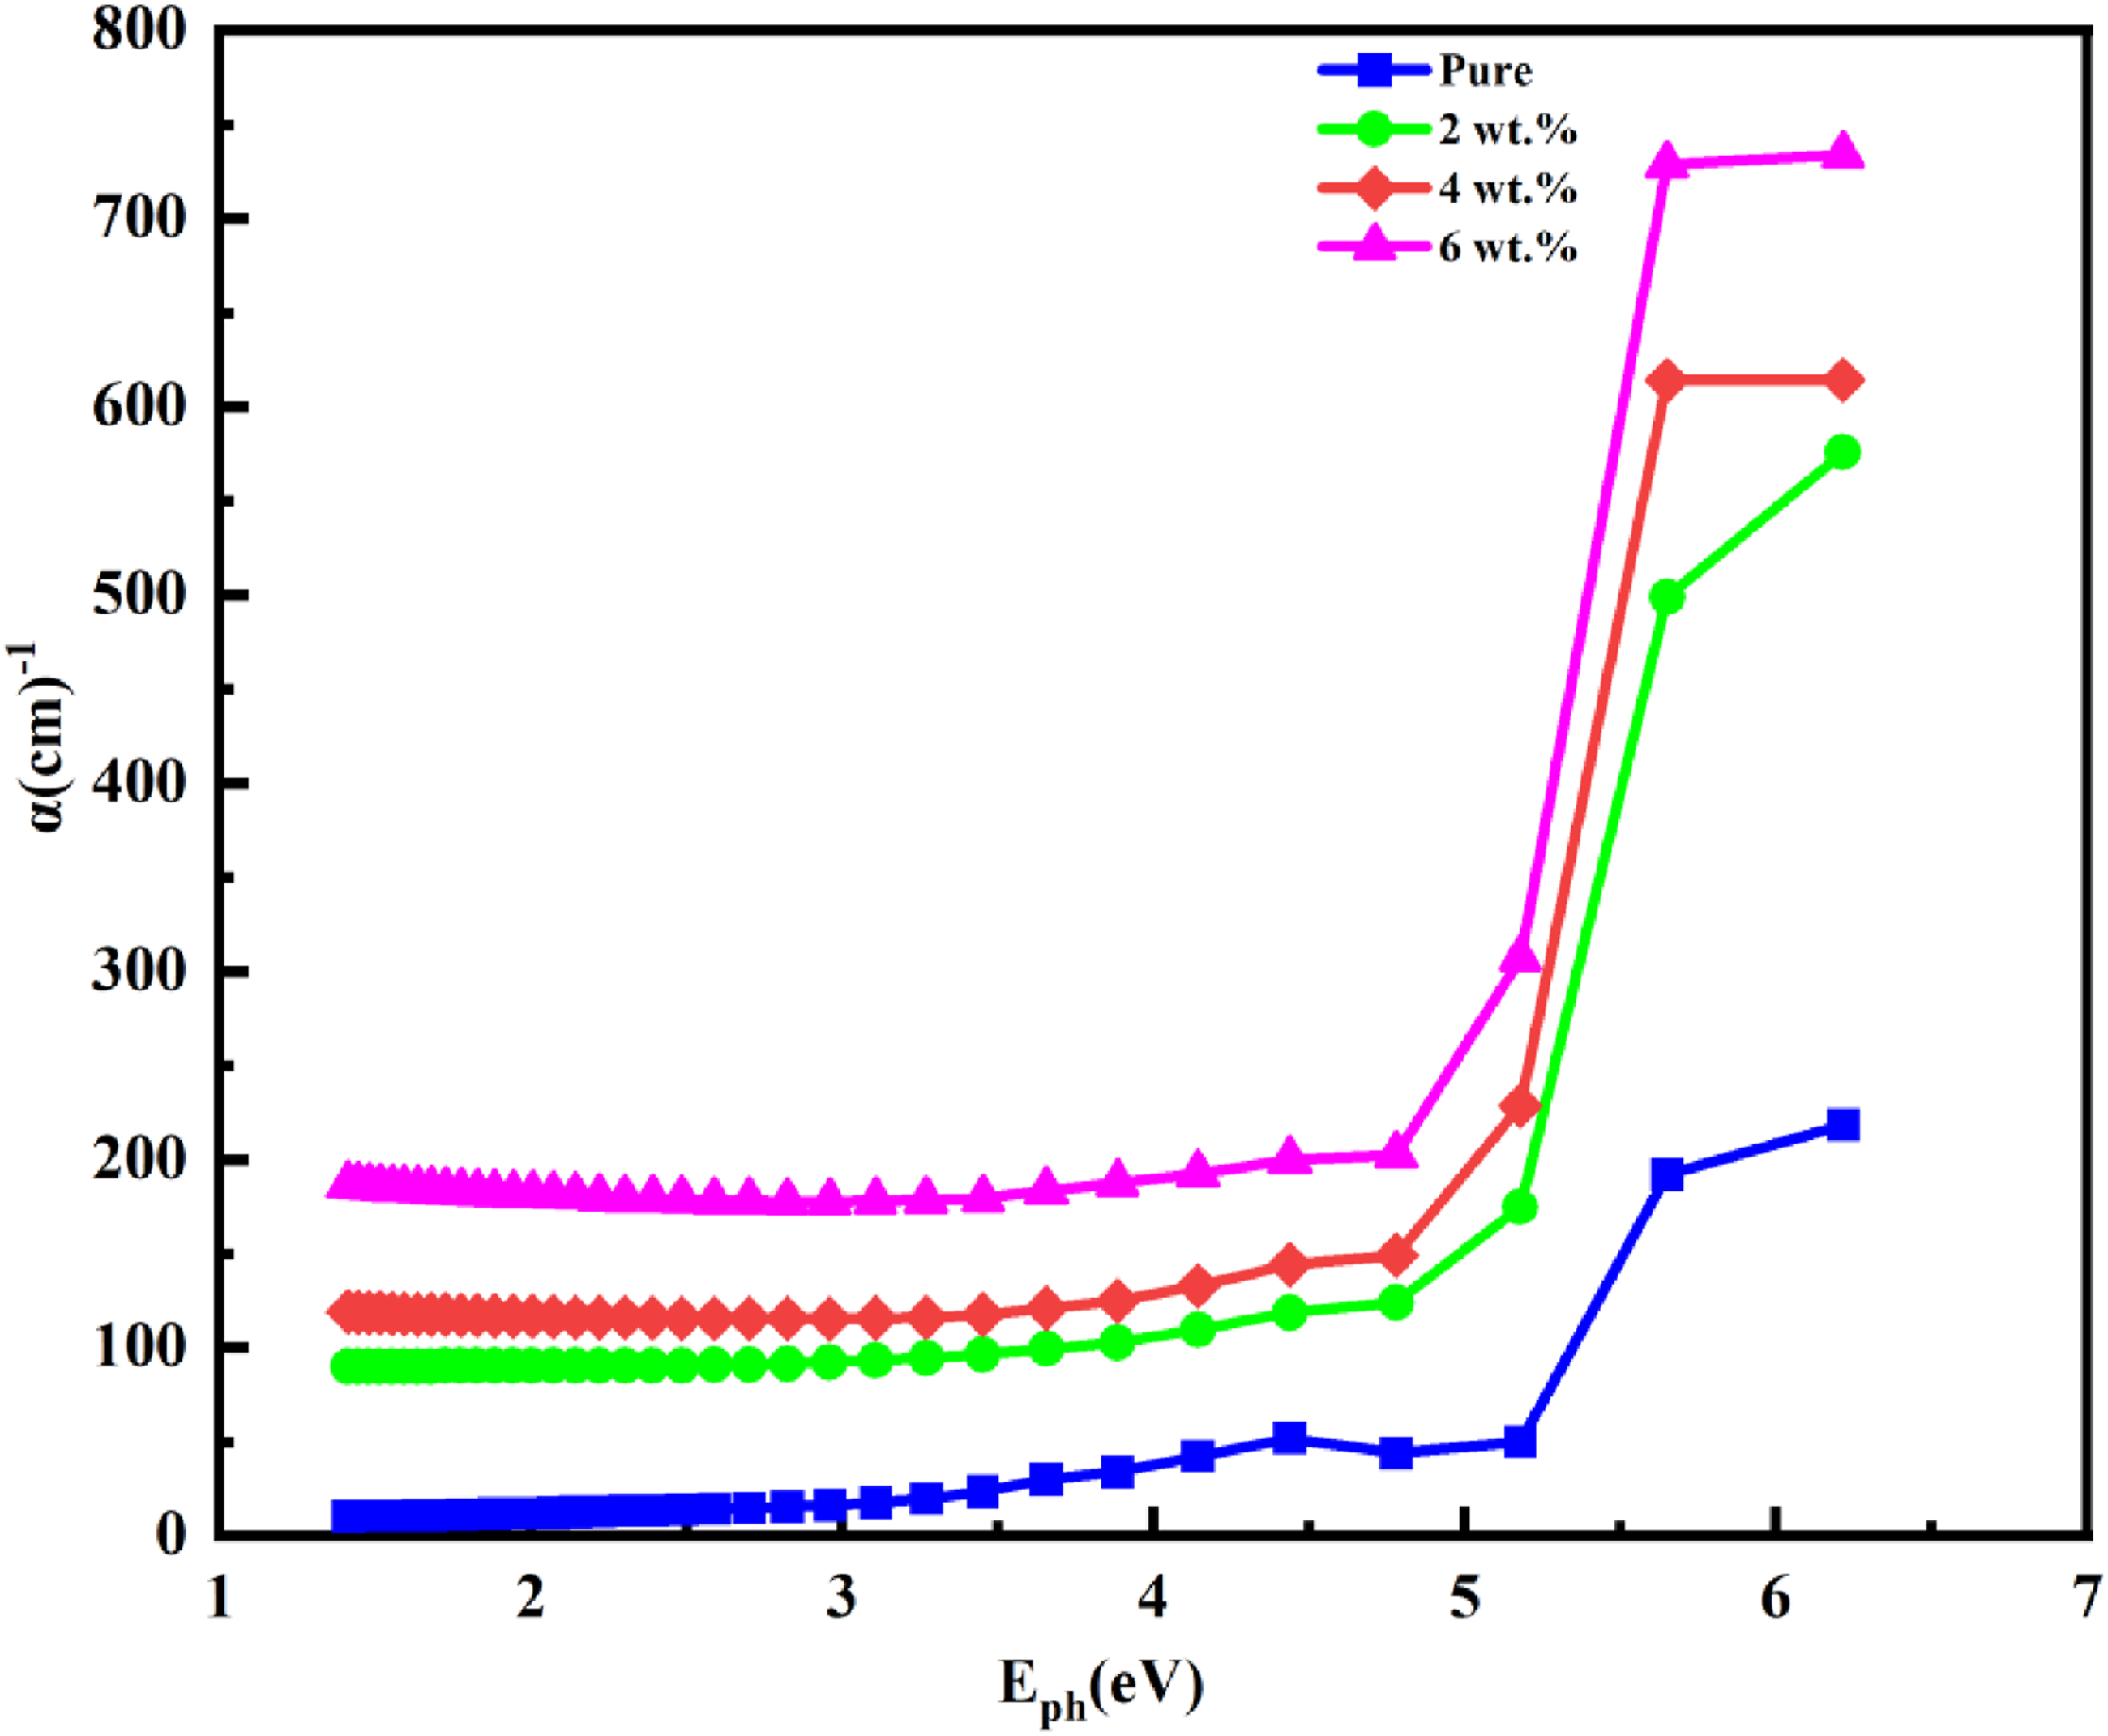
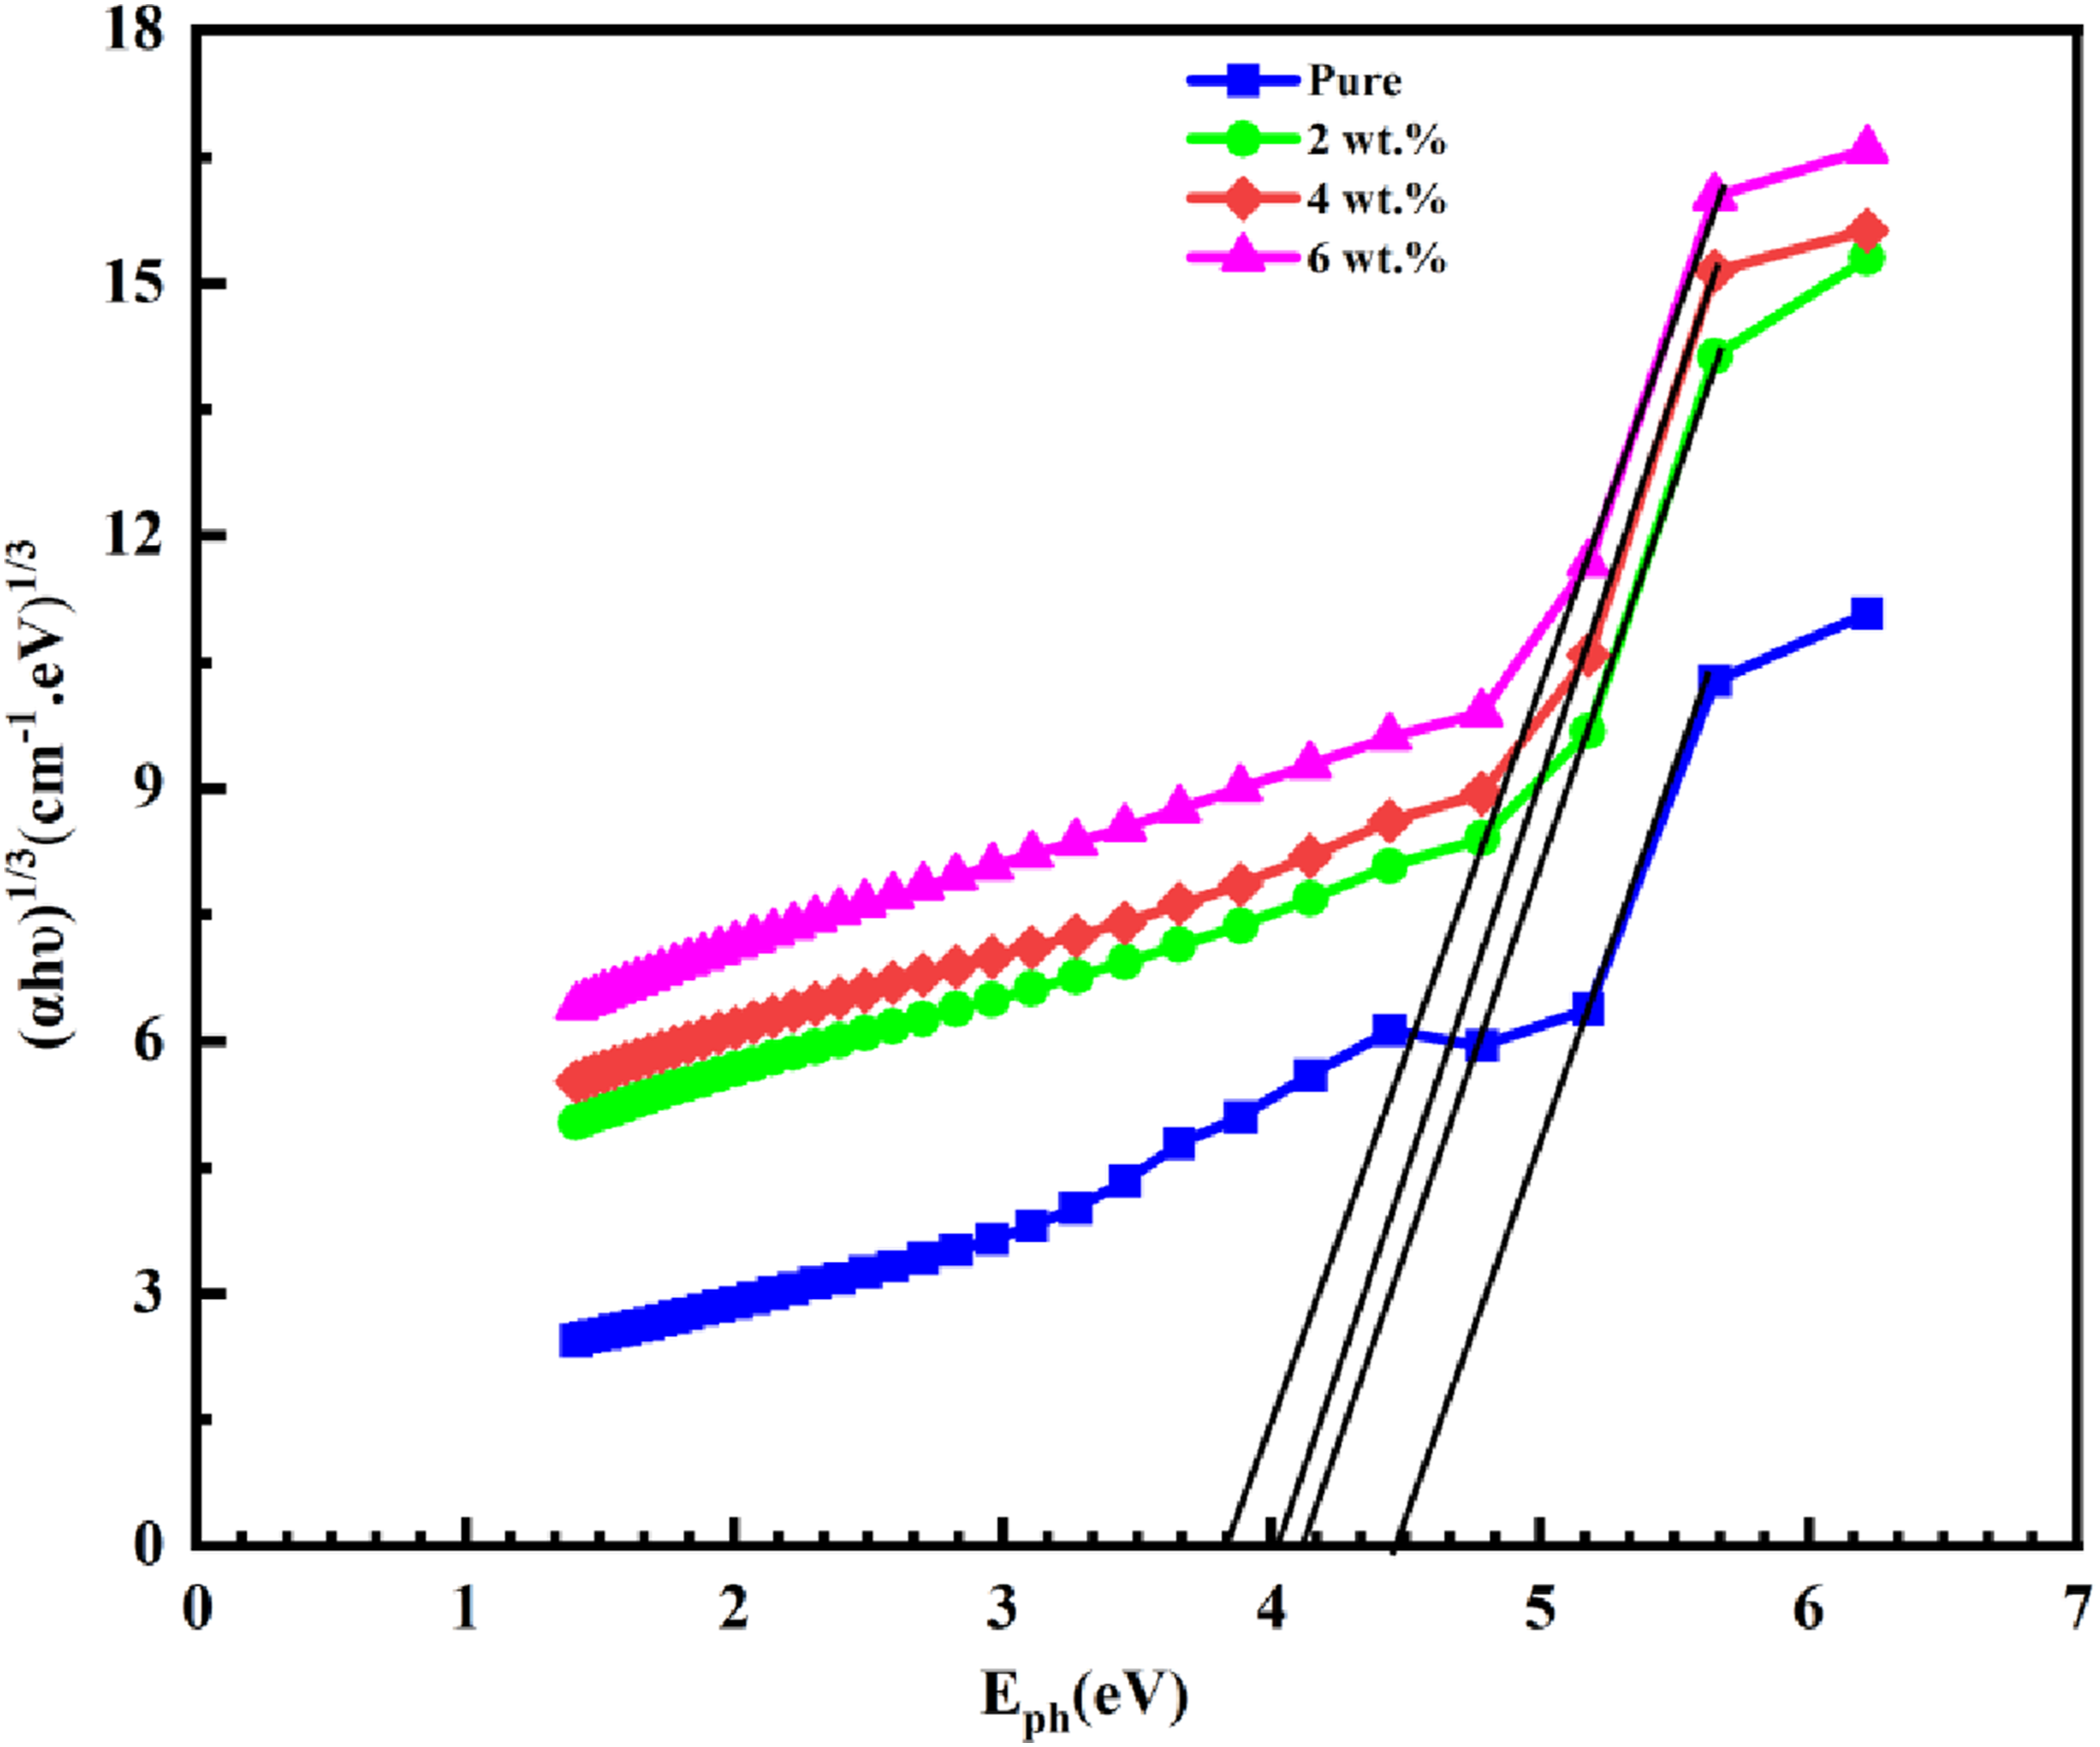
The impact of TiN–SiO2 filler loading on the optical band gap (Eg) of the PVA–PVP–TiN–SiO2 nanocomposites was methodically assessed. In this context, Eg denotes the energy gap between the highest occupied molecular orbital (HOMO) and the lowest unoccupied molecular orbital (LUMO). To get Eg, the Tauc-type graphs in Figures (6) and (7) plot photon energy (hv) versus (αhν)1/2 for allowed transitions and (αhν)1/3 for prohibited transitions respectively. These graphs are based on the observed absorption coefficient α. To find the allowable optical gap (AE_g), the linear parts of these plots were extended until they met the energy axis (hν = 0). The results are shown in Table 1. The AEg values are constant across the film series, with the pristine PVA-PVP sample showing AEg = 4.73 eV. When you add 6 wt% TiN-SiO2, the permitted gap drops to 4.38 eV. This is because more (secondary) electronic levels appear in the initial PVA–PVP band gap. Figure 6 shows that the forbidden gap (FEg) also goes decreased, from 4.44 eV to 3.80 eV when TiN–SiO2 is added. The decrease is mostly due to the development of new energy states in the host matrix band structure. It is also helped by voids caused by fillers, structural disorder, and defects forming in the composite system.29,45 (αhυ)1/2 difference for (PVA-PVP-TiN-SiO2) PNCs with Eph. (αhυ)1/3 difference of (PVA-PVP-TiN-SiO2)PNCs with Eph. Optical parameters for (PVA-PVP-TiN-SiO2)PNCs.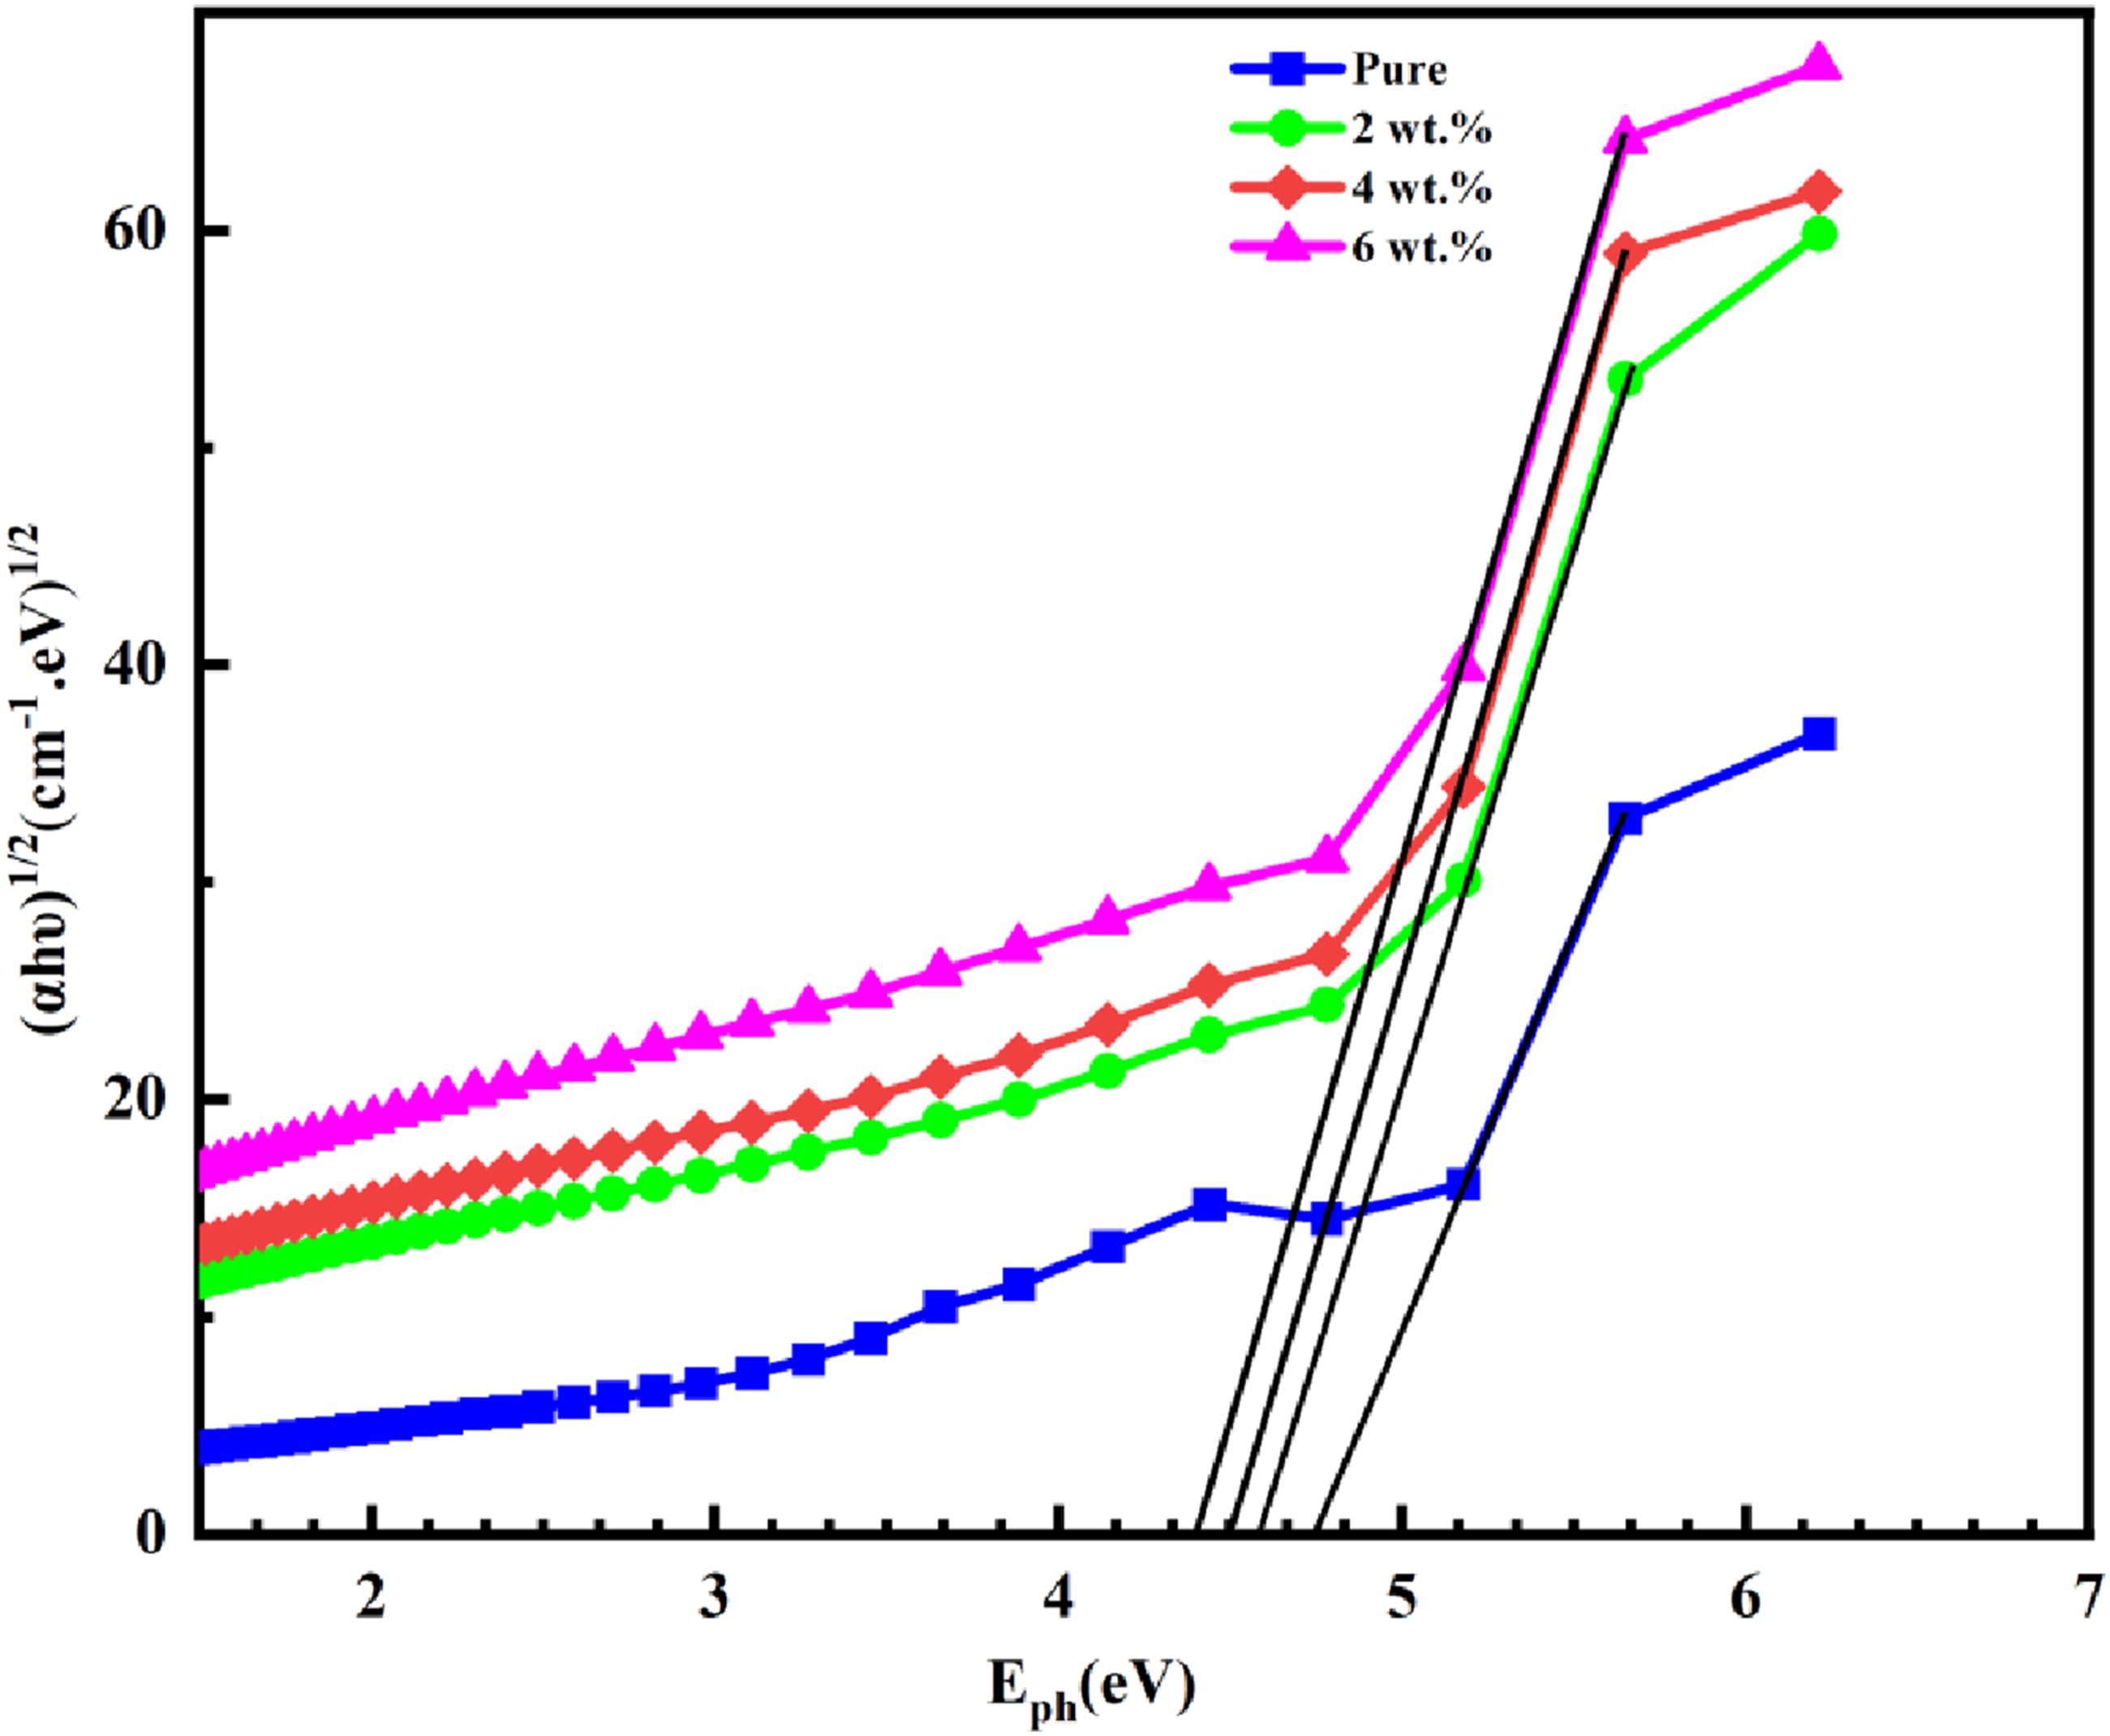
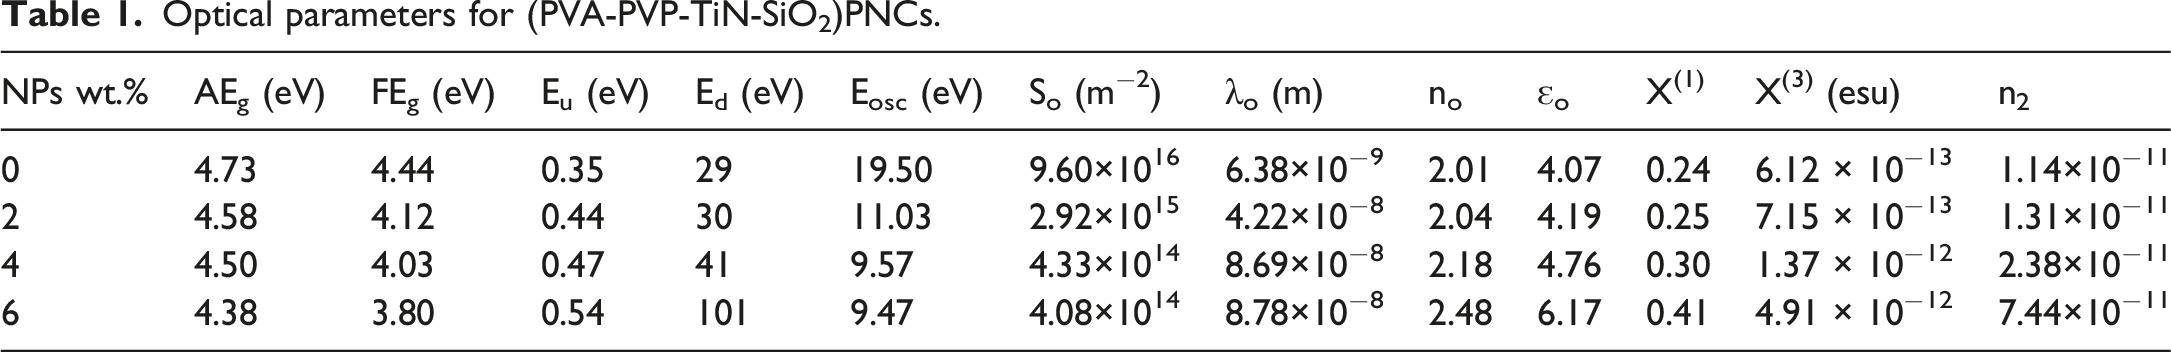
Urbach tail analysis provides insight into optical transitions involving localized states and the extended band states in the PVA–PVP–TiN–SiO2 films. As illustrated in Figure 8, the Urbach tail (band-tail) parameter can be extracted from the slope of the linear region in the ln(α) versus photon energy (hν) plot. The values summarized in Table 1 show that the band-tail energy increases from 0.35 eV for pristine PVA–PVP to 0.44, 0.47, and 0.54 eV for films containing 2%, 4%, and 6% TiN–SiO2, respectively. This systematic increase indicates that introducing TiN–SiO2 nanoparticles generates additional localized/defect-related states within the polymer matrix, thereby broadening the distribution of tail states in the band gap.46,47 Plot of ln(α) versus photon energy (hν) used to extract the Urbach energy (Eᵤ).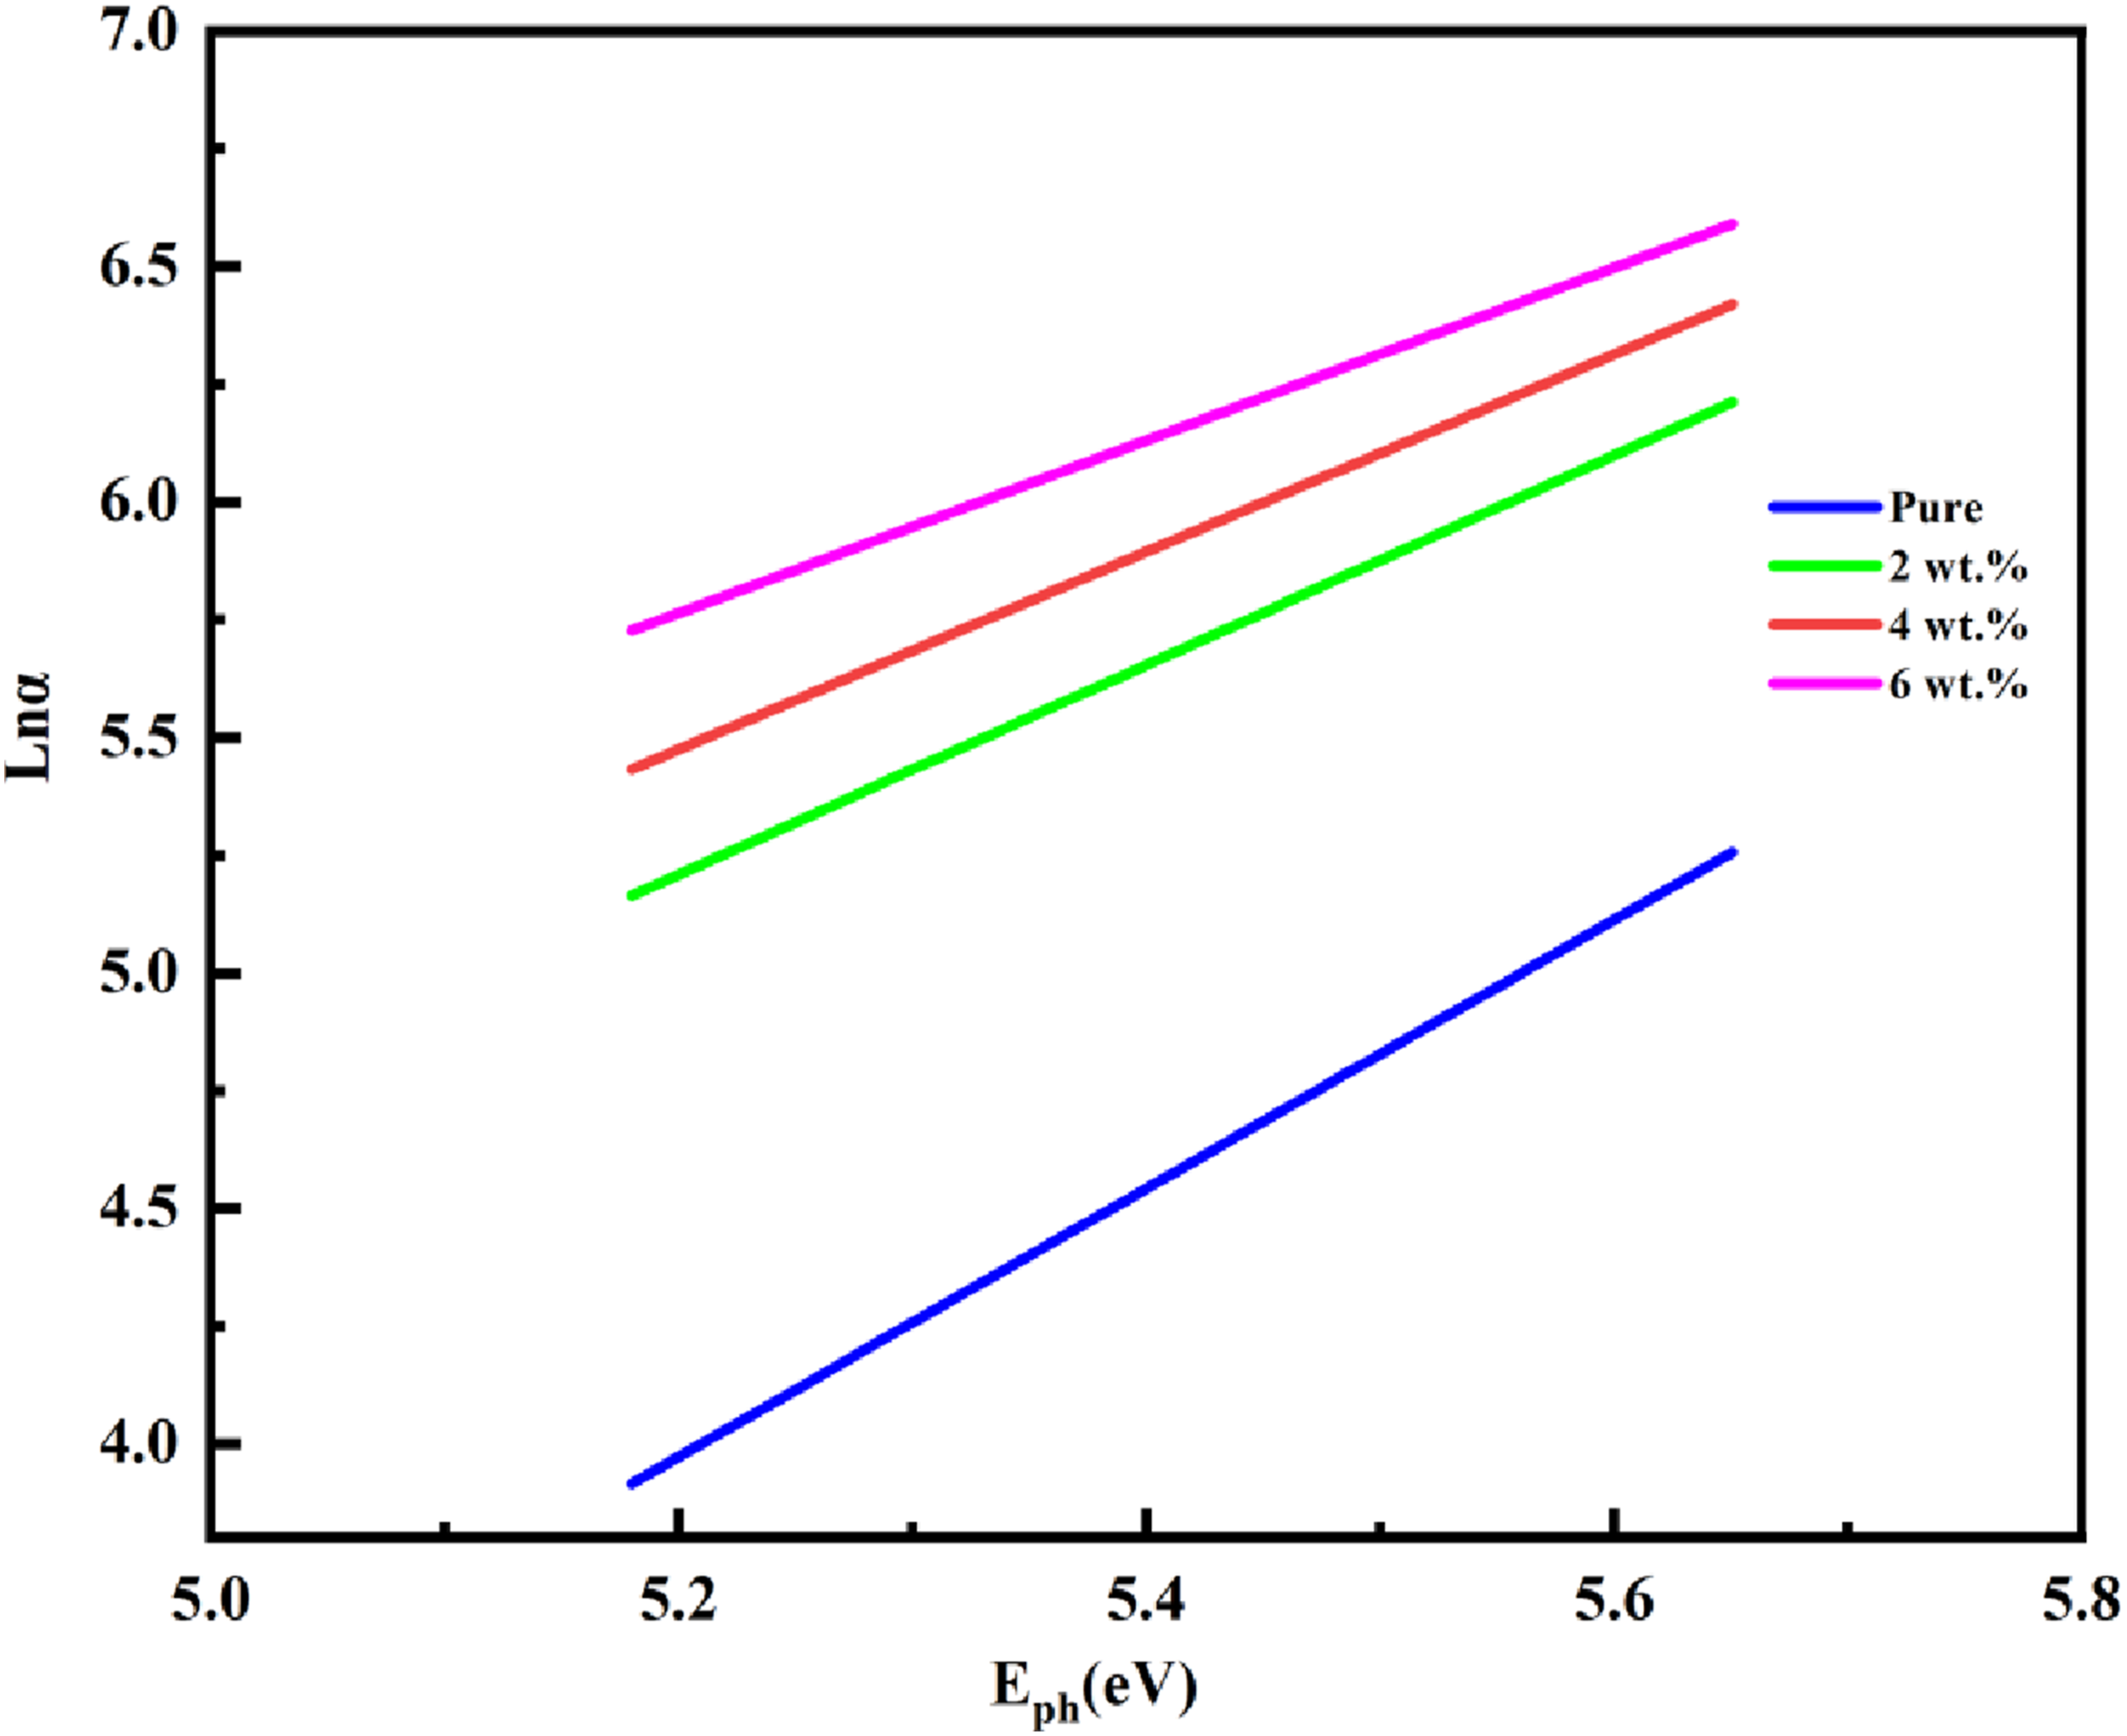
Figure 9 indicates that applying the Wemple–DiDomenico single-oscillator analysis to the PVA–PVP/TiN–SiO2 nanocomposites yields a linear dependence when (n2-1)−1 is plotted versus (hν)2, where the intercept corresponds to Eosc/Ed. and the slope equals 1/(EdEosc). As the TiN–SiO2 nanoparticle loading increases, the extracted oscillator-related energies (particularly Eosc, and also Ed.) decrease, which is commonly attributed to the higher density of scattering centers along with the associated reduction in band-gap energy. The concurrent reduction in Eosc and Ed. reflects measurable changes in how the material disperses and refracts incident light as the nanofiller concentration rises.48,49 From an application standpoint, a lower Eosc implies stronger responsiveness to lower-energy photons, which can broaden the effective absorption window relevant to photovoltaic operation. In addition, Ed. is linked to the strength of electronic polarization under external fields, and variations in this parameter may influence photo conversion efficiency in optoelectronic devices.50,51 Plot for the determination of the Eosc and Ed.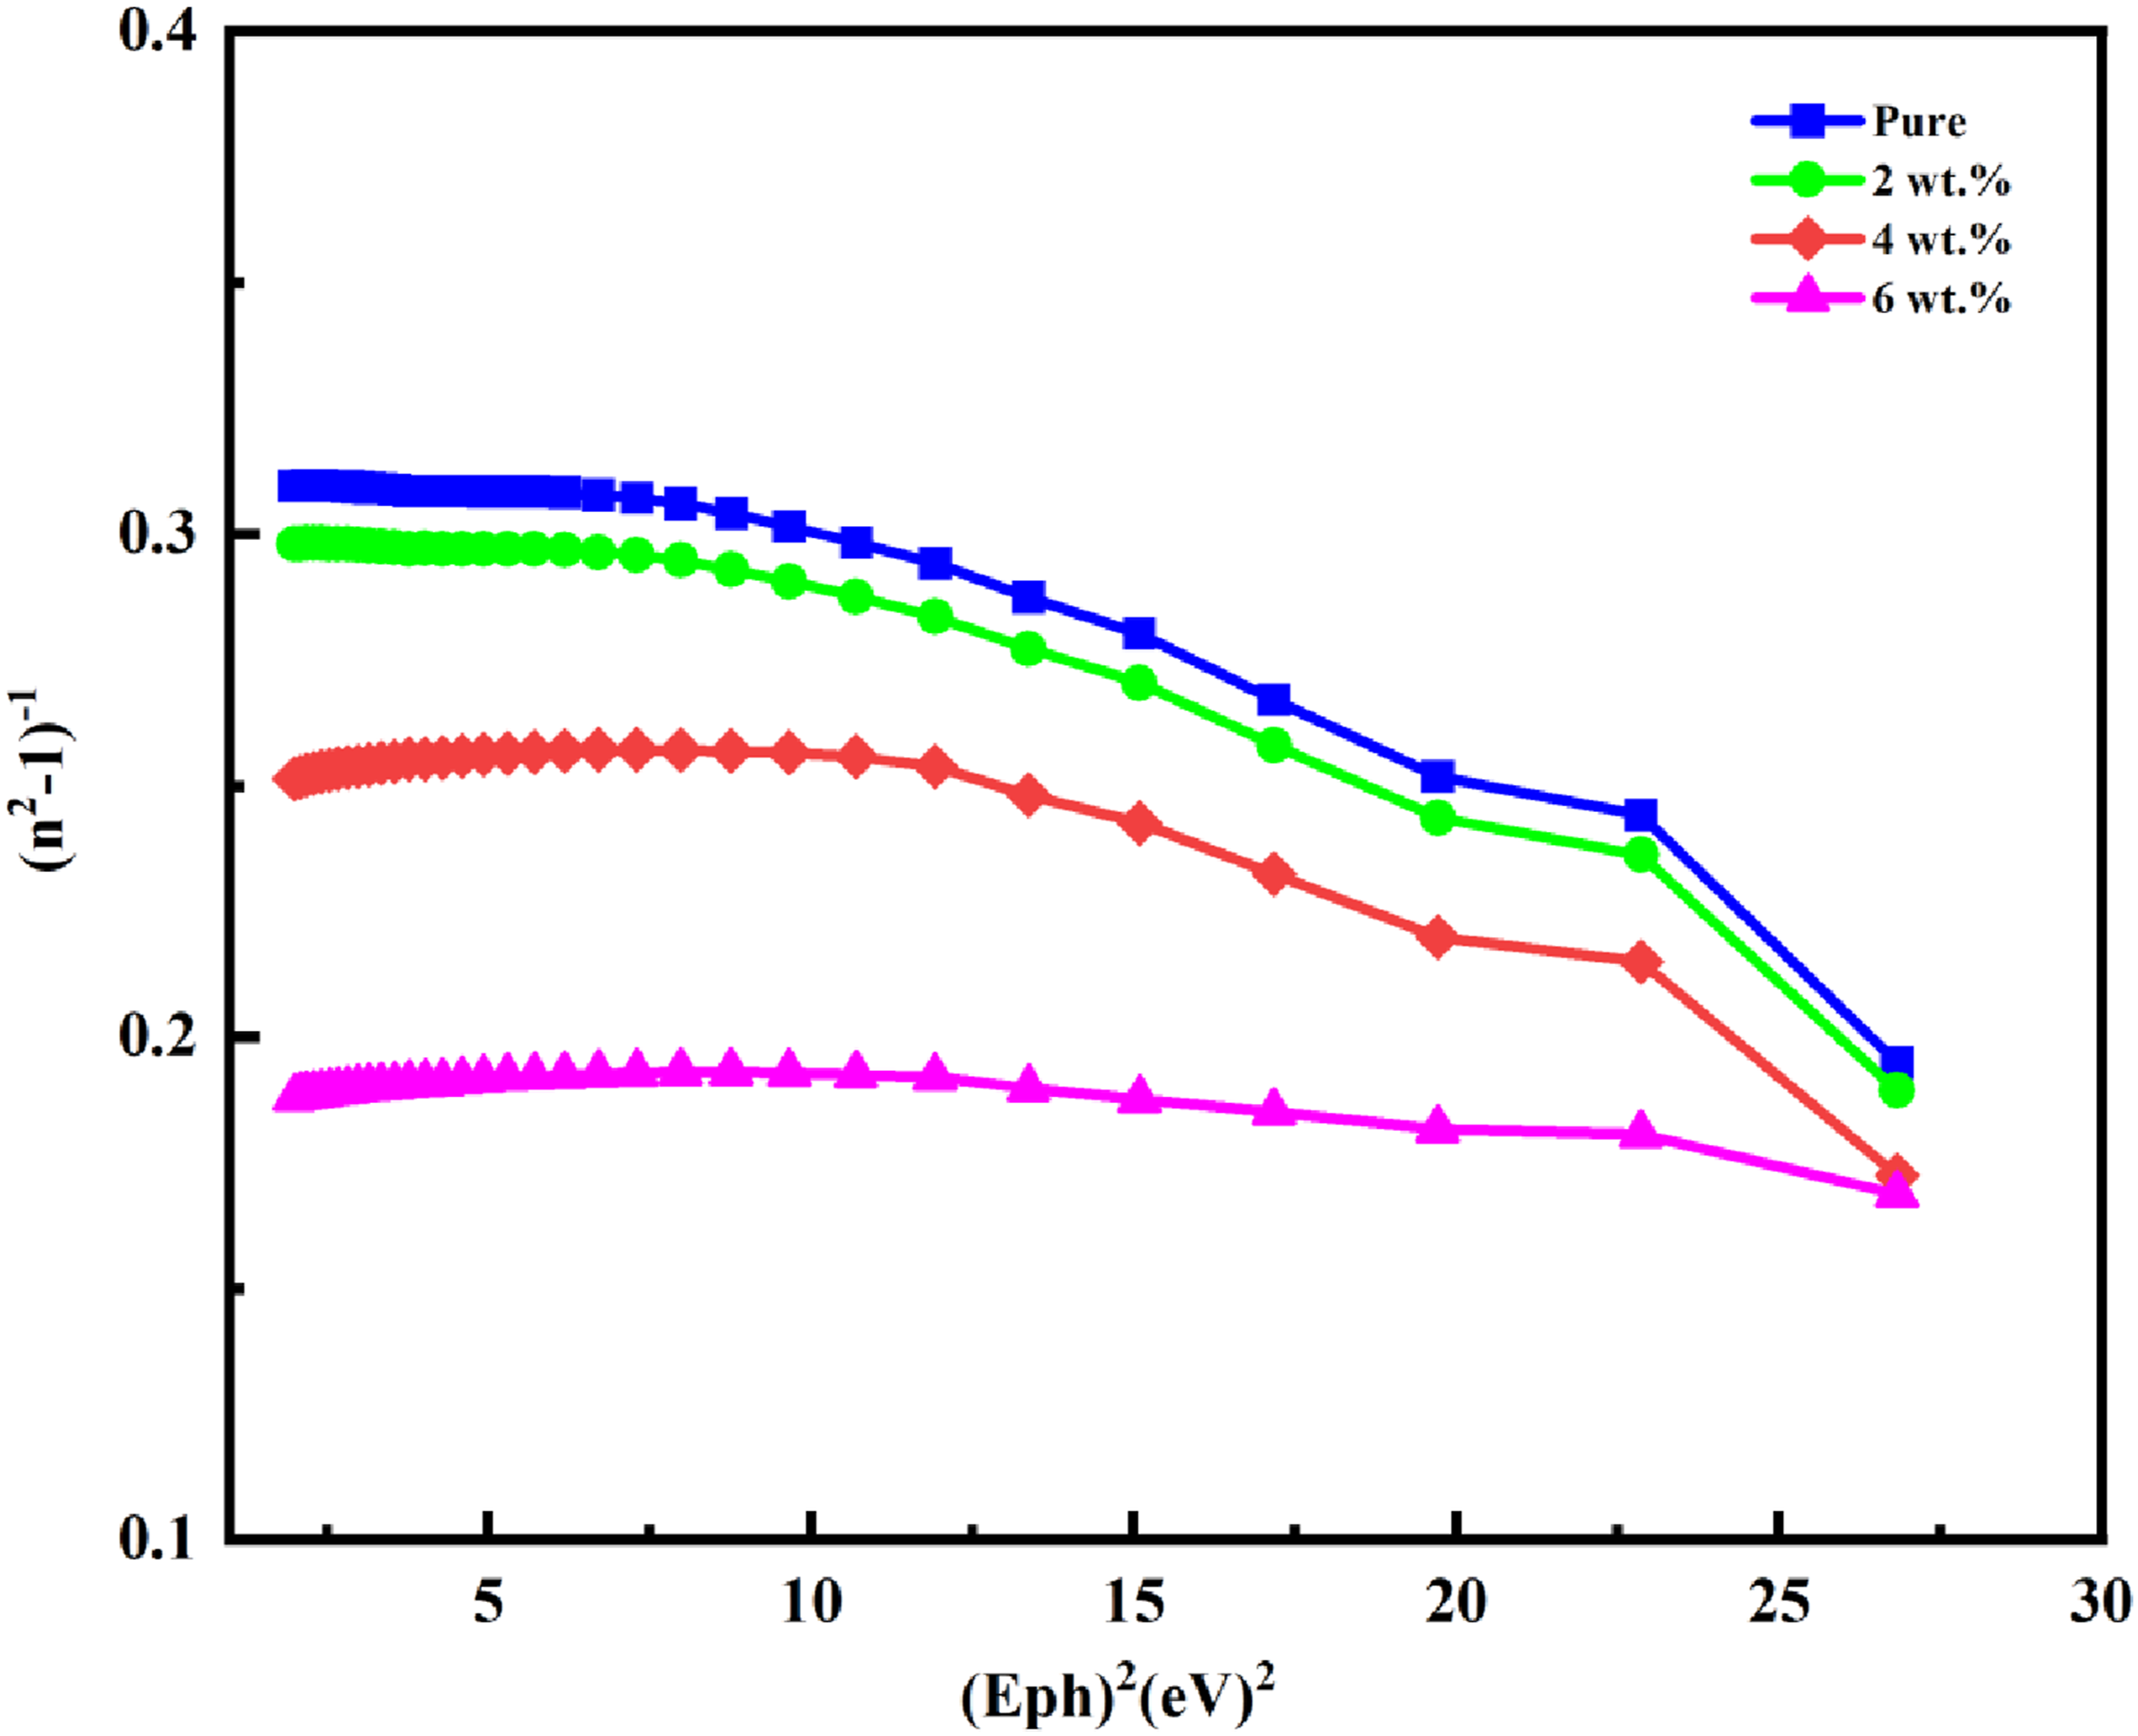
As the TiN–SiO2 nanoparticle loading increased, both the zero-frequency refractive index n0 and the static dielectric constant ε0 exhibited a modest but consistent rise, with n0 increasing from 2.01 to 2.48 and ε0ε0 increasing from 4.07 to 6.17. This behavior can be attributed to the enhanced polarizability introduced by the TiN–SiO2 fillers, which makes the nanocomposite optically denser at higher filler contents and, consequently, elevates the refractive index,52,53 Furthermore, these values are shown in Table 1).
Plotting (n2-1)−1 as a function of λ−2 yields a straight line for the PVA–PVP/TiN–SiO2 nanocomposites (Figure 10), where the intercept equals 1/(S0λ0) and the slope equals 1/S0. In this context, S0 is the average oscillator strength and λ0 is the average oscillator wavelength (oscillator parameter). Shows the graph for calculating the average oscillator strength (So) and parameter (λo).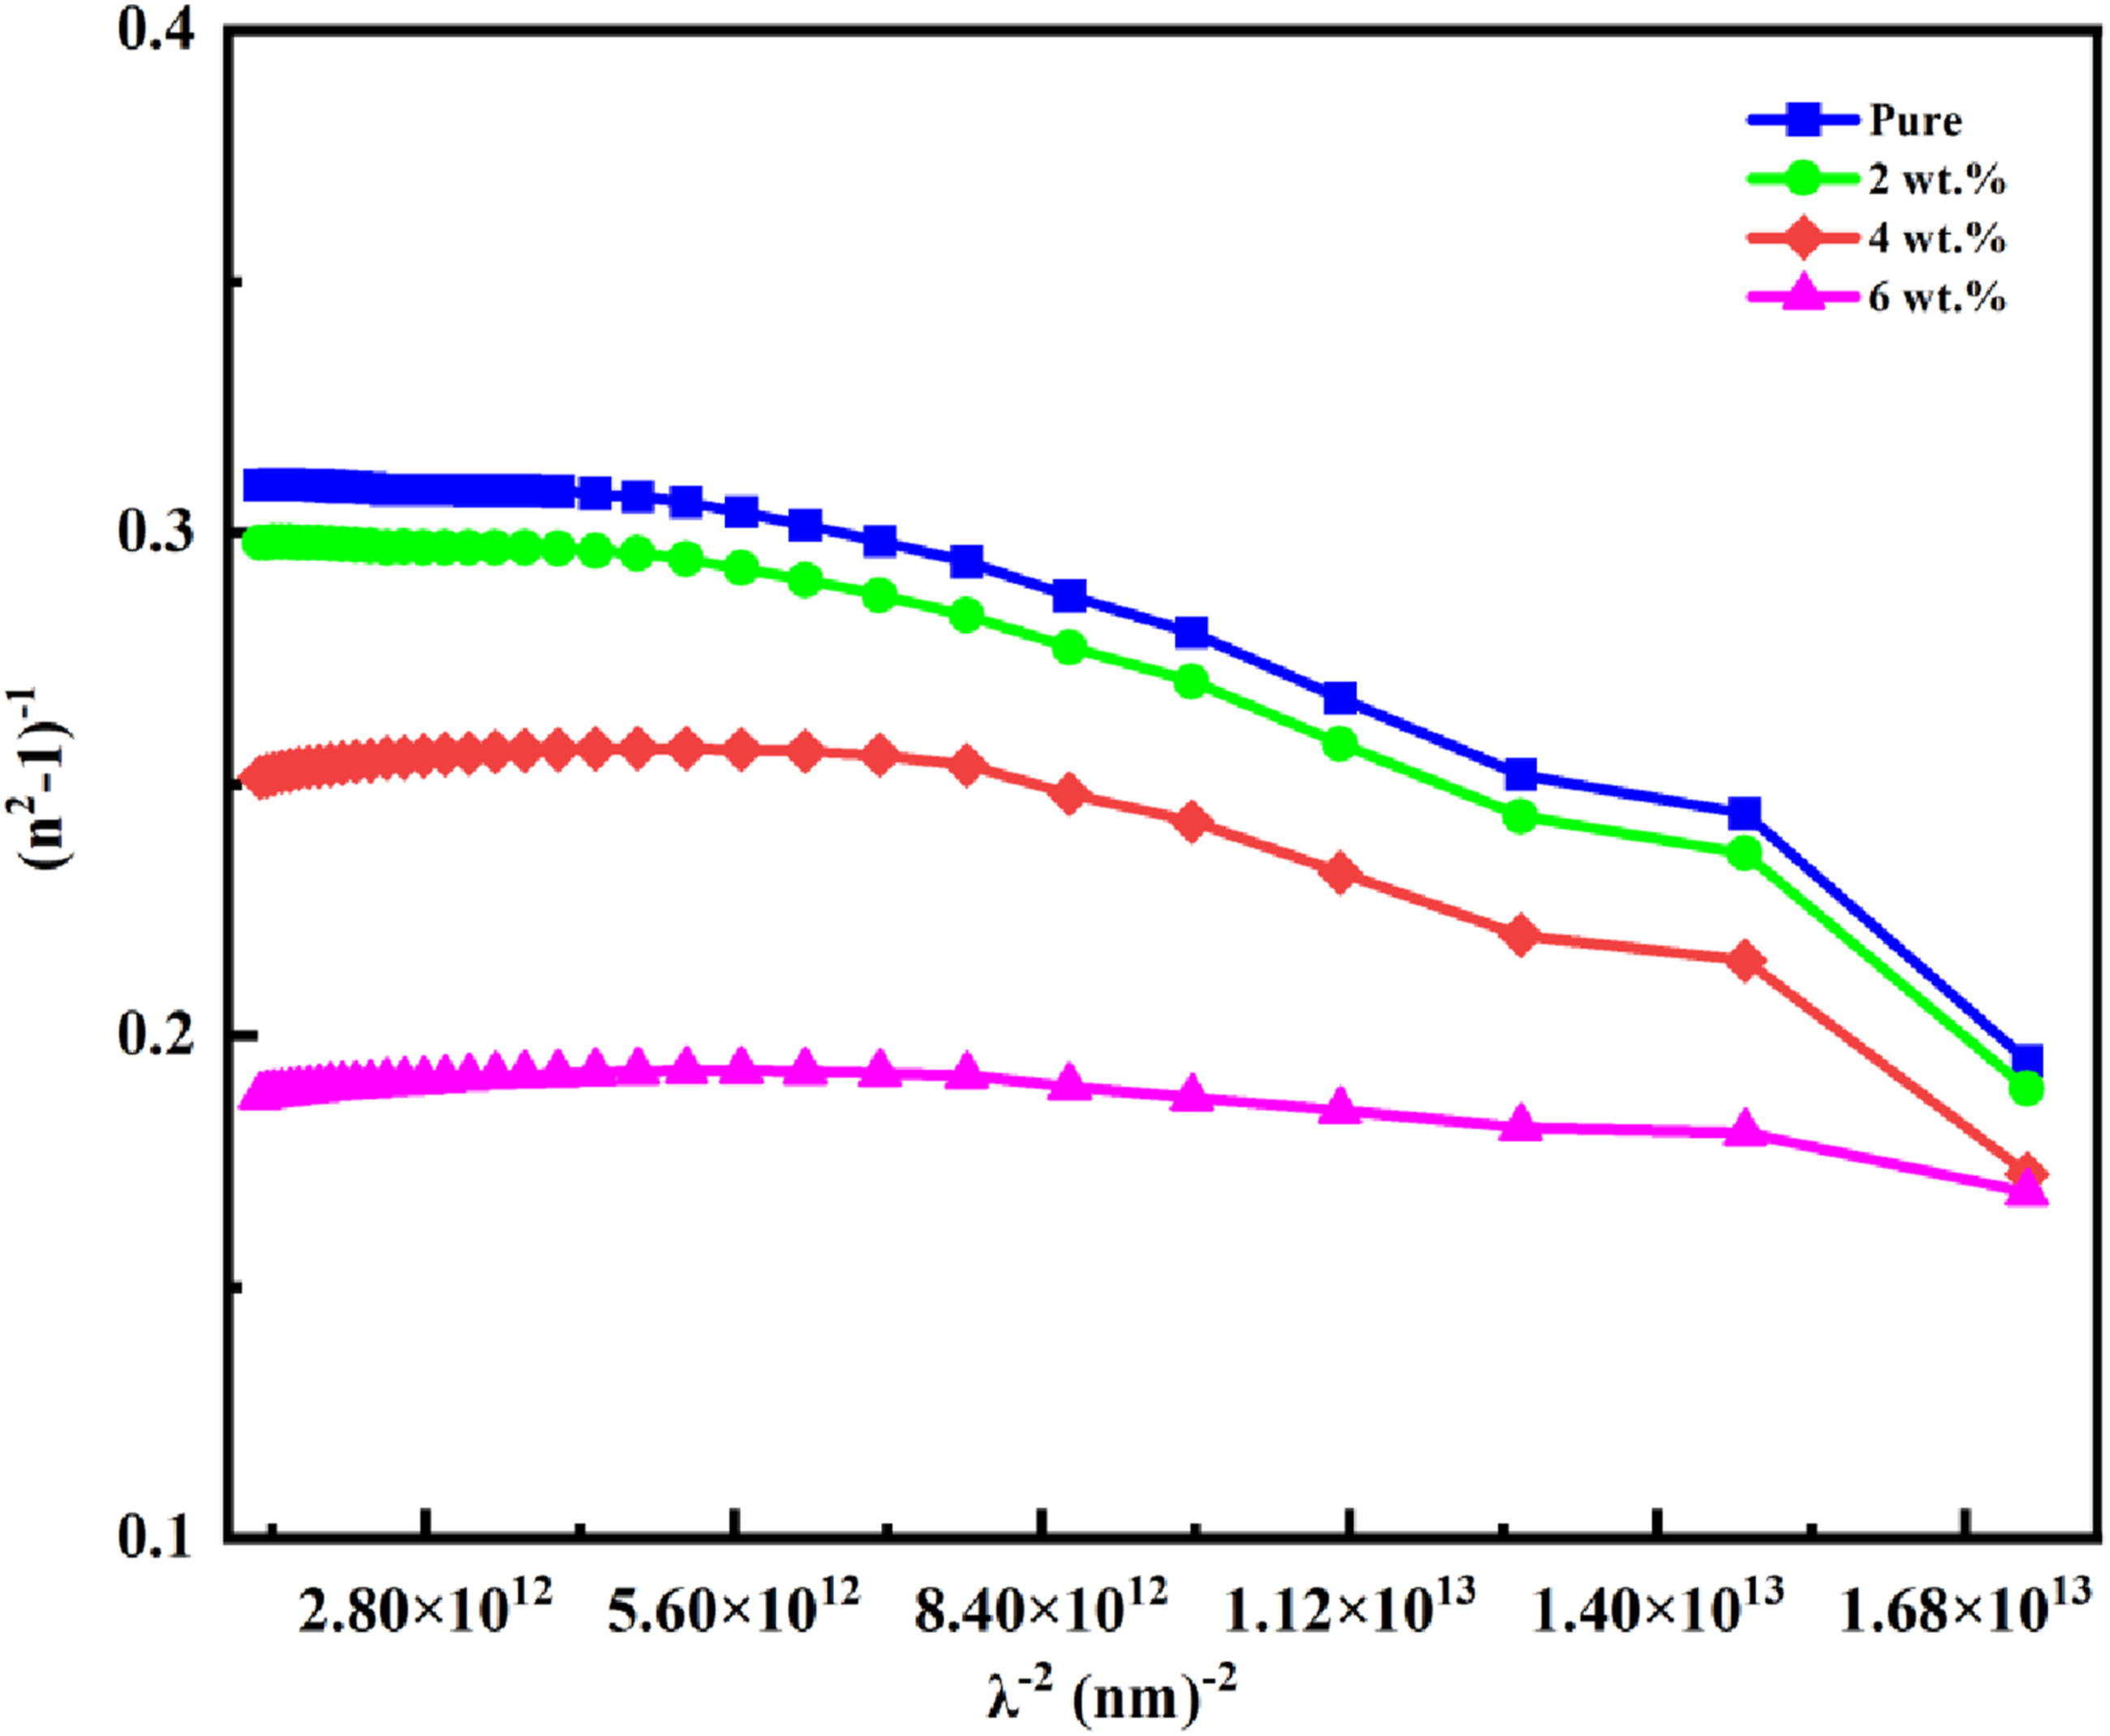
As the TiN–SiO2 nanoparticle content increases, λ0 shifts to higher values, indicating a movement toward longer-wavelength (lower-energy) optical response within the visible and near-infrared regions. This red-shifted tendency supports the suitability of the material for photovoltaic and infrared-related optoelectronic applications because it implies improved interaction with lower-energy photons. Moreover, comparatively high S0 values reflect stronger light–matter coupling, which is consistent with more effective photon absorption in the composite system.54,55
An increasing TiN–SiO2 nanoparticle concentration leads to a systematic rise in both the third-order nonlinear susceptibility χ(3) and the first-order (linear) susceptibility χ(1), indicating a strengthened nonlinear optical response. This enhancement suggests that the developed nanocomposites are more suitable for nonlinear-photonics functionalities, including frequency conversion and optical switching.
In addition, the nonlinear refractive index n2 increases markedly with filler loading, rising from 1.14 × 10⁻¹¹ esu to 7.44 × 10⁻¹¹esu. This pronounced increase provides further evidence that the material is a strong candidate for nonlinear optical applications.56,57 These numbers are also included in Table 1.
Figure 11 shows how the extinction coefficient (k) changes with wavelength for both the plain PVA–PVP film and the PVA–PVP–TiN–SiO2 nanocomposite (NC) samples. The observed behavior of (K) is in line with the trend in absorbance since the optical absorption coefficient directly controls (K), as shown by the governing relation utilized in the text. At any given wavelength, augmenting the TiN–SiO2 nanomaterial concentration in the polymer matrix results in an elevated (K) value, which is ascribed to enhanced attenuation of the incident electromagnetic radiation due to the increased nanoparticle density inside the matrix. In general, this pattern is consistent with findings from earlier studies on the same topic.58,59 Extinction coefficient of (PVA-PVP-TiN-SiO2) PNCs with λ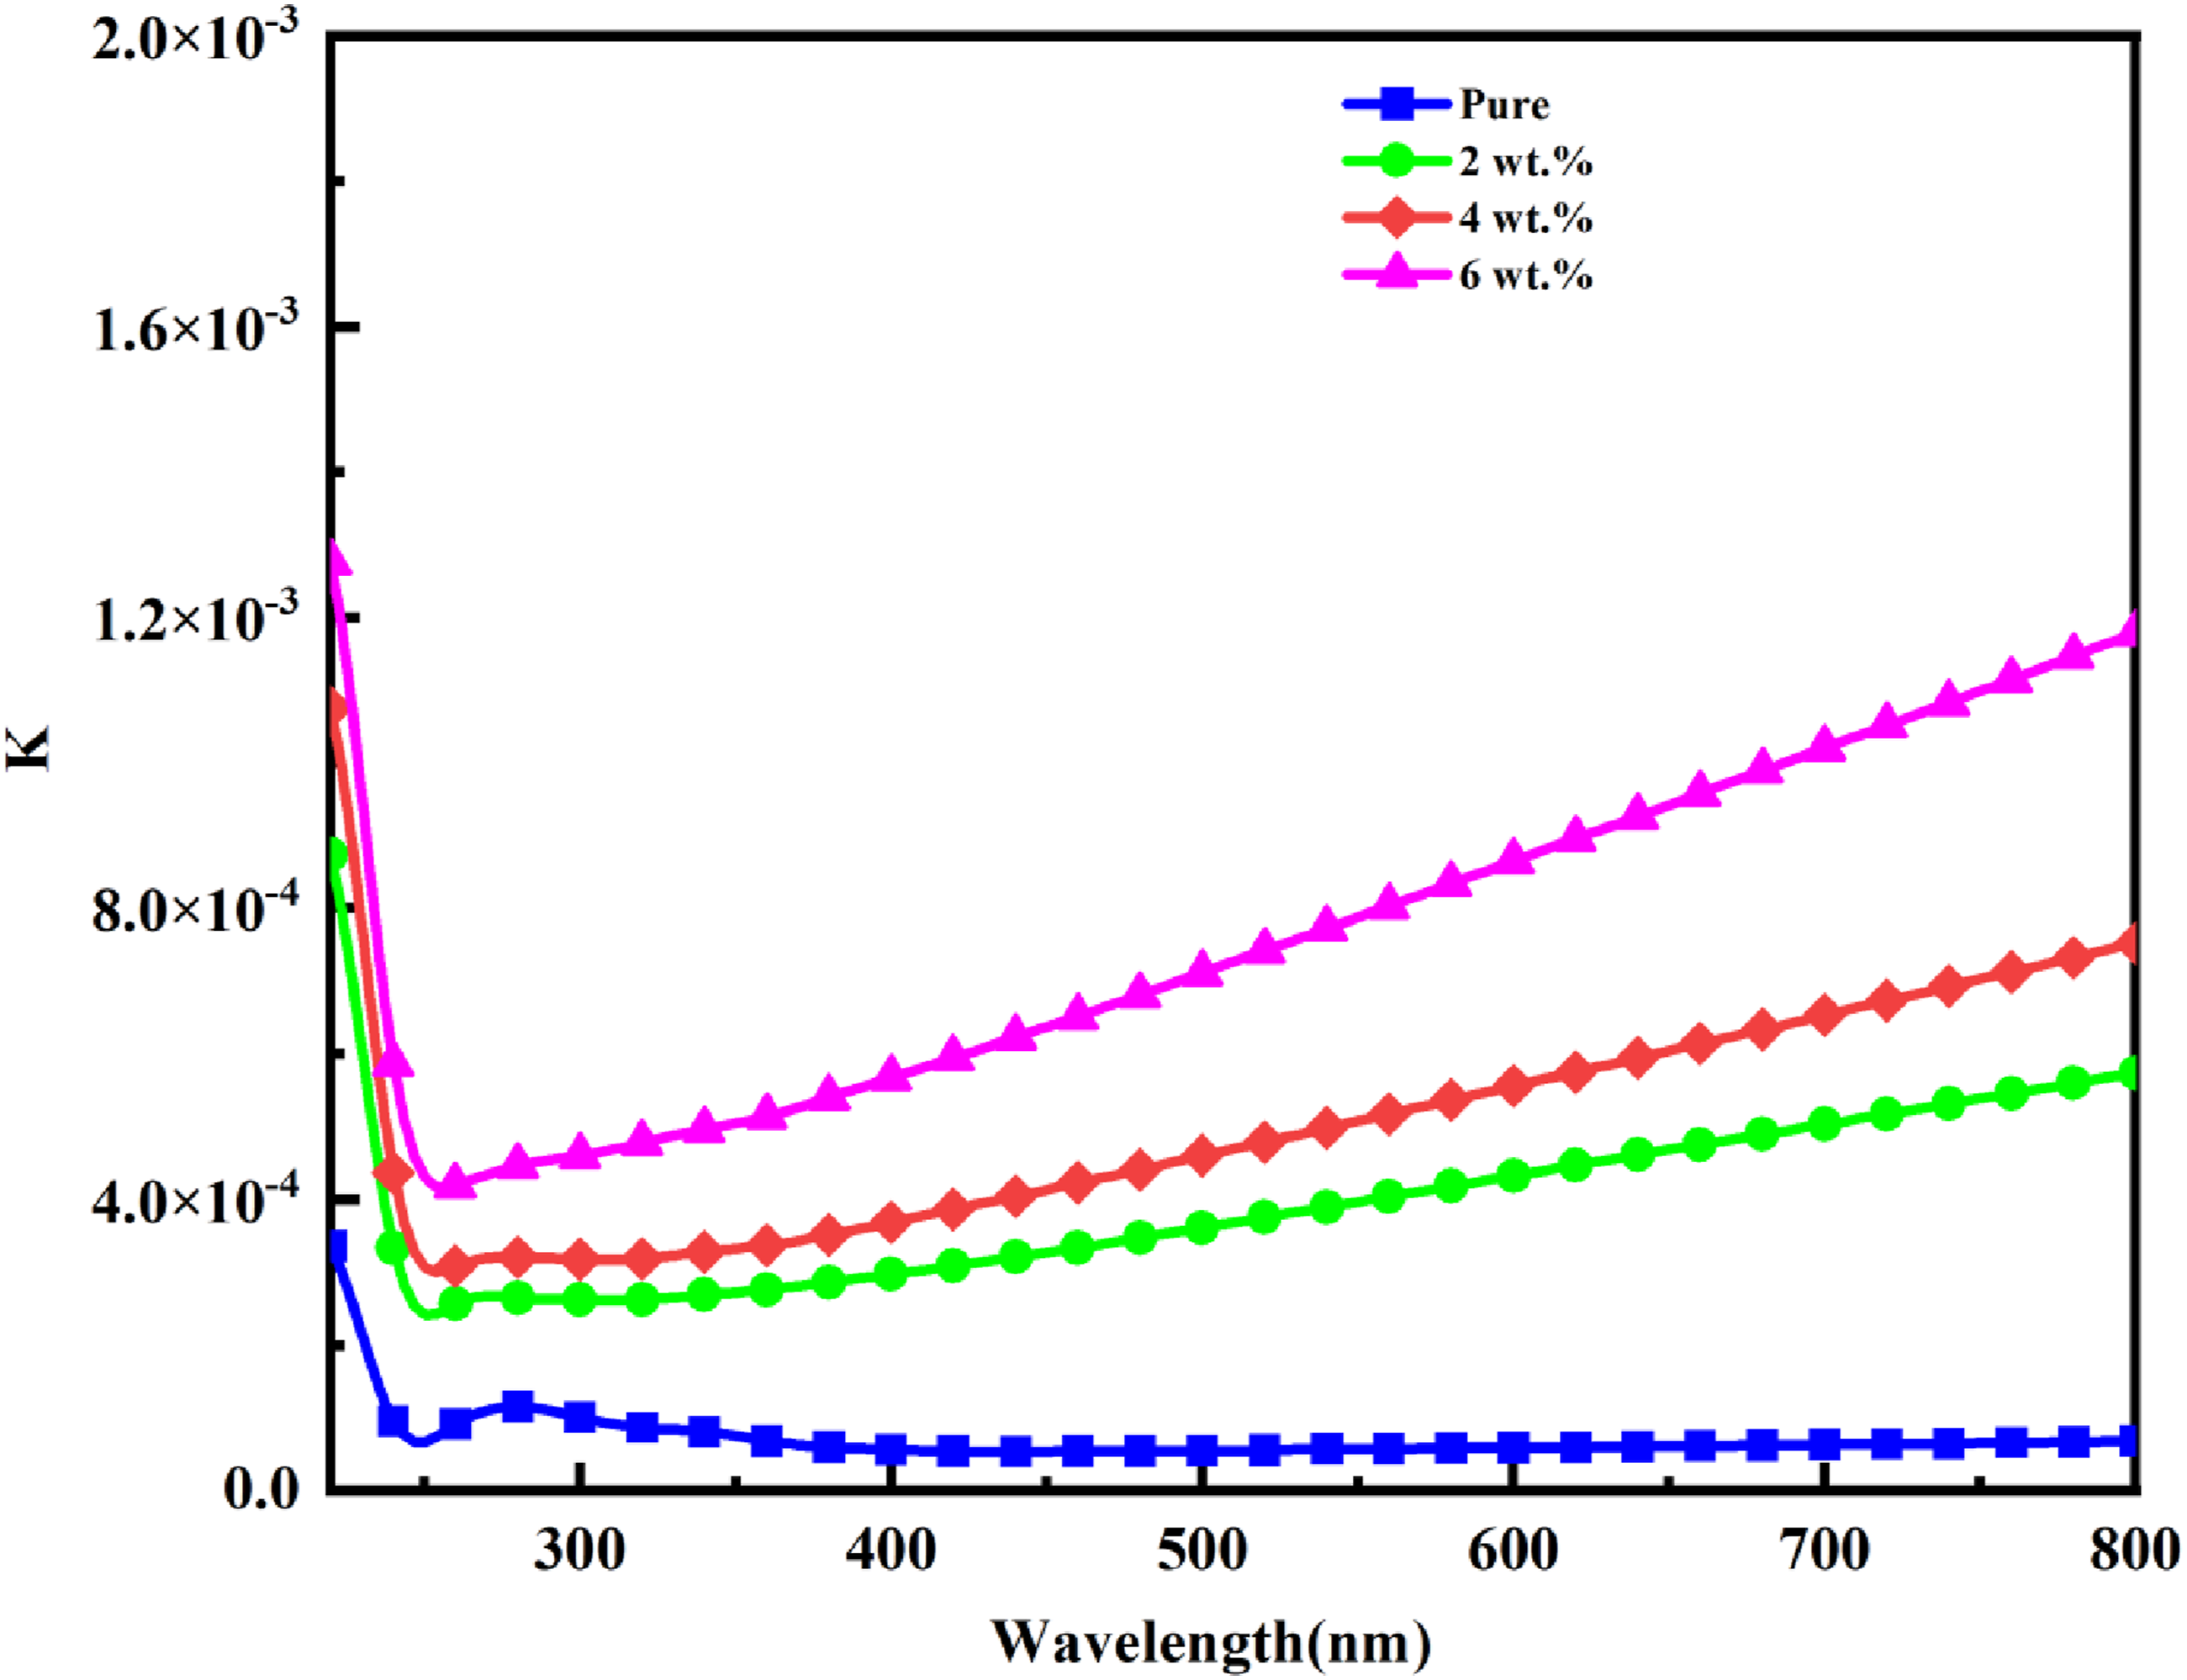
The refractive index (n) of the polymer nanocomposite films under study is plotted against wavelength in Figure 12. Property is directly related to composition. The n values increase when the polymer matrix contains additional (TiN-SiO2) nanomaterials. Refractive index with λ for (PVA-PVP-TiN-SiO2) PNCs.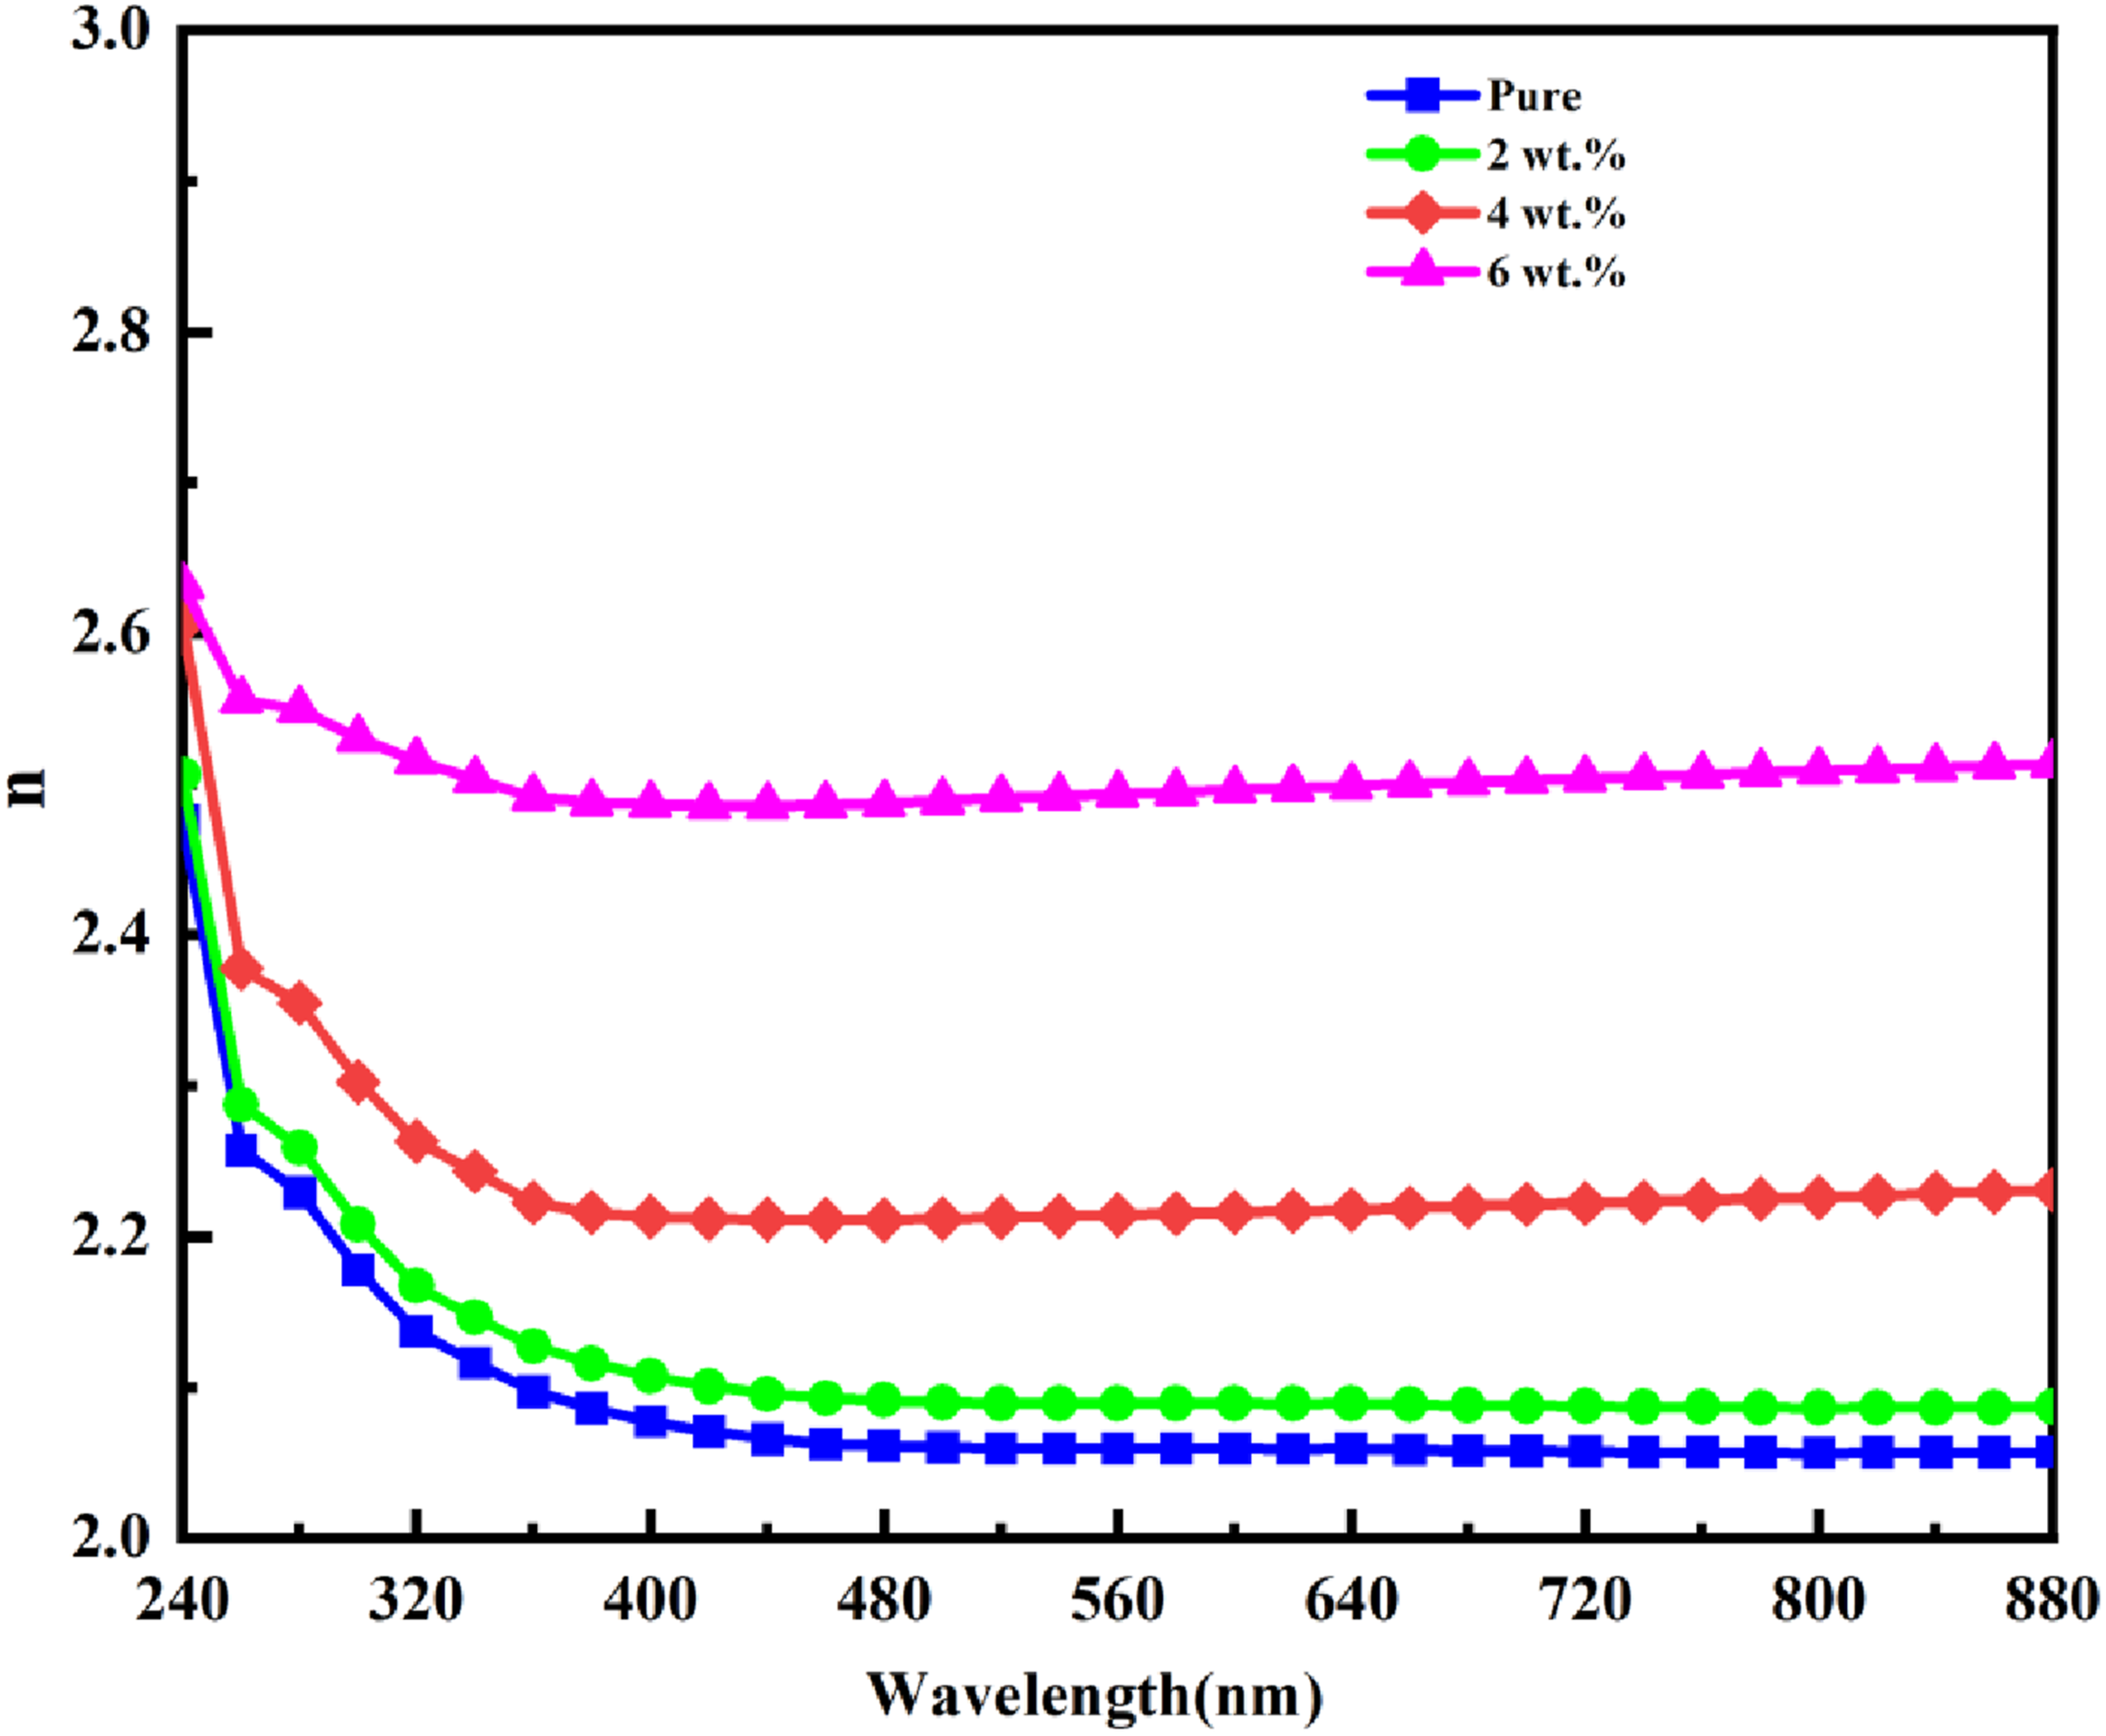
At λ = 400 nm, adding 6 wt percent (TiN-SiO2) to the PVA–PVP matrix increases the refractive index from 2.07 (neat PVA-PVP) to 2.48. As the wavelength increases in the visible range, n decreases, and during the 400–880 nm range, it remains roughly constant. Because of the increased light-matter interaction in the nanofilled sheets, the refractive index has increased. The presence of (TiN-SiO2) increases the medium’s optical density, which causes the light to bend (refract) greater.60,61
Figures 13 and 14 illustrate the relationship between the wavelength and the real and imaginary components of the dielectric constant. The integration of TiN-SiO2 NMs raised the values of ε1 and ε2. The PVA-PVP-TiN-SiO2 nanocomposites have a higher real part of the dielectric constant (ε1) than the neat PVA-PVP film, indicating enhanced polarization capability. This is typically associated with increased density of available states and a narrowing of the optical band gap. At longer wavelengths, the dielectric response becomes less sensitive to the applied optical field due to inertia, which inhibits dipoles’ (and molecular polarization’s) capacity to follow rapid field changes. PVA-PVP-TiN-SiO2 NCs’ real dielectric constant with λ. PVA-PVP-TiN-SiO2 NCs’ Imaginary dielectric constant with λ.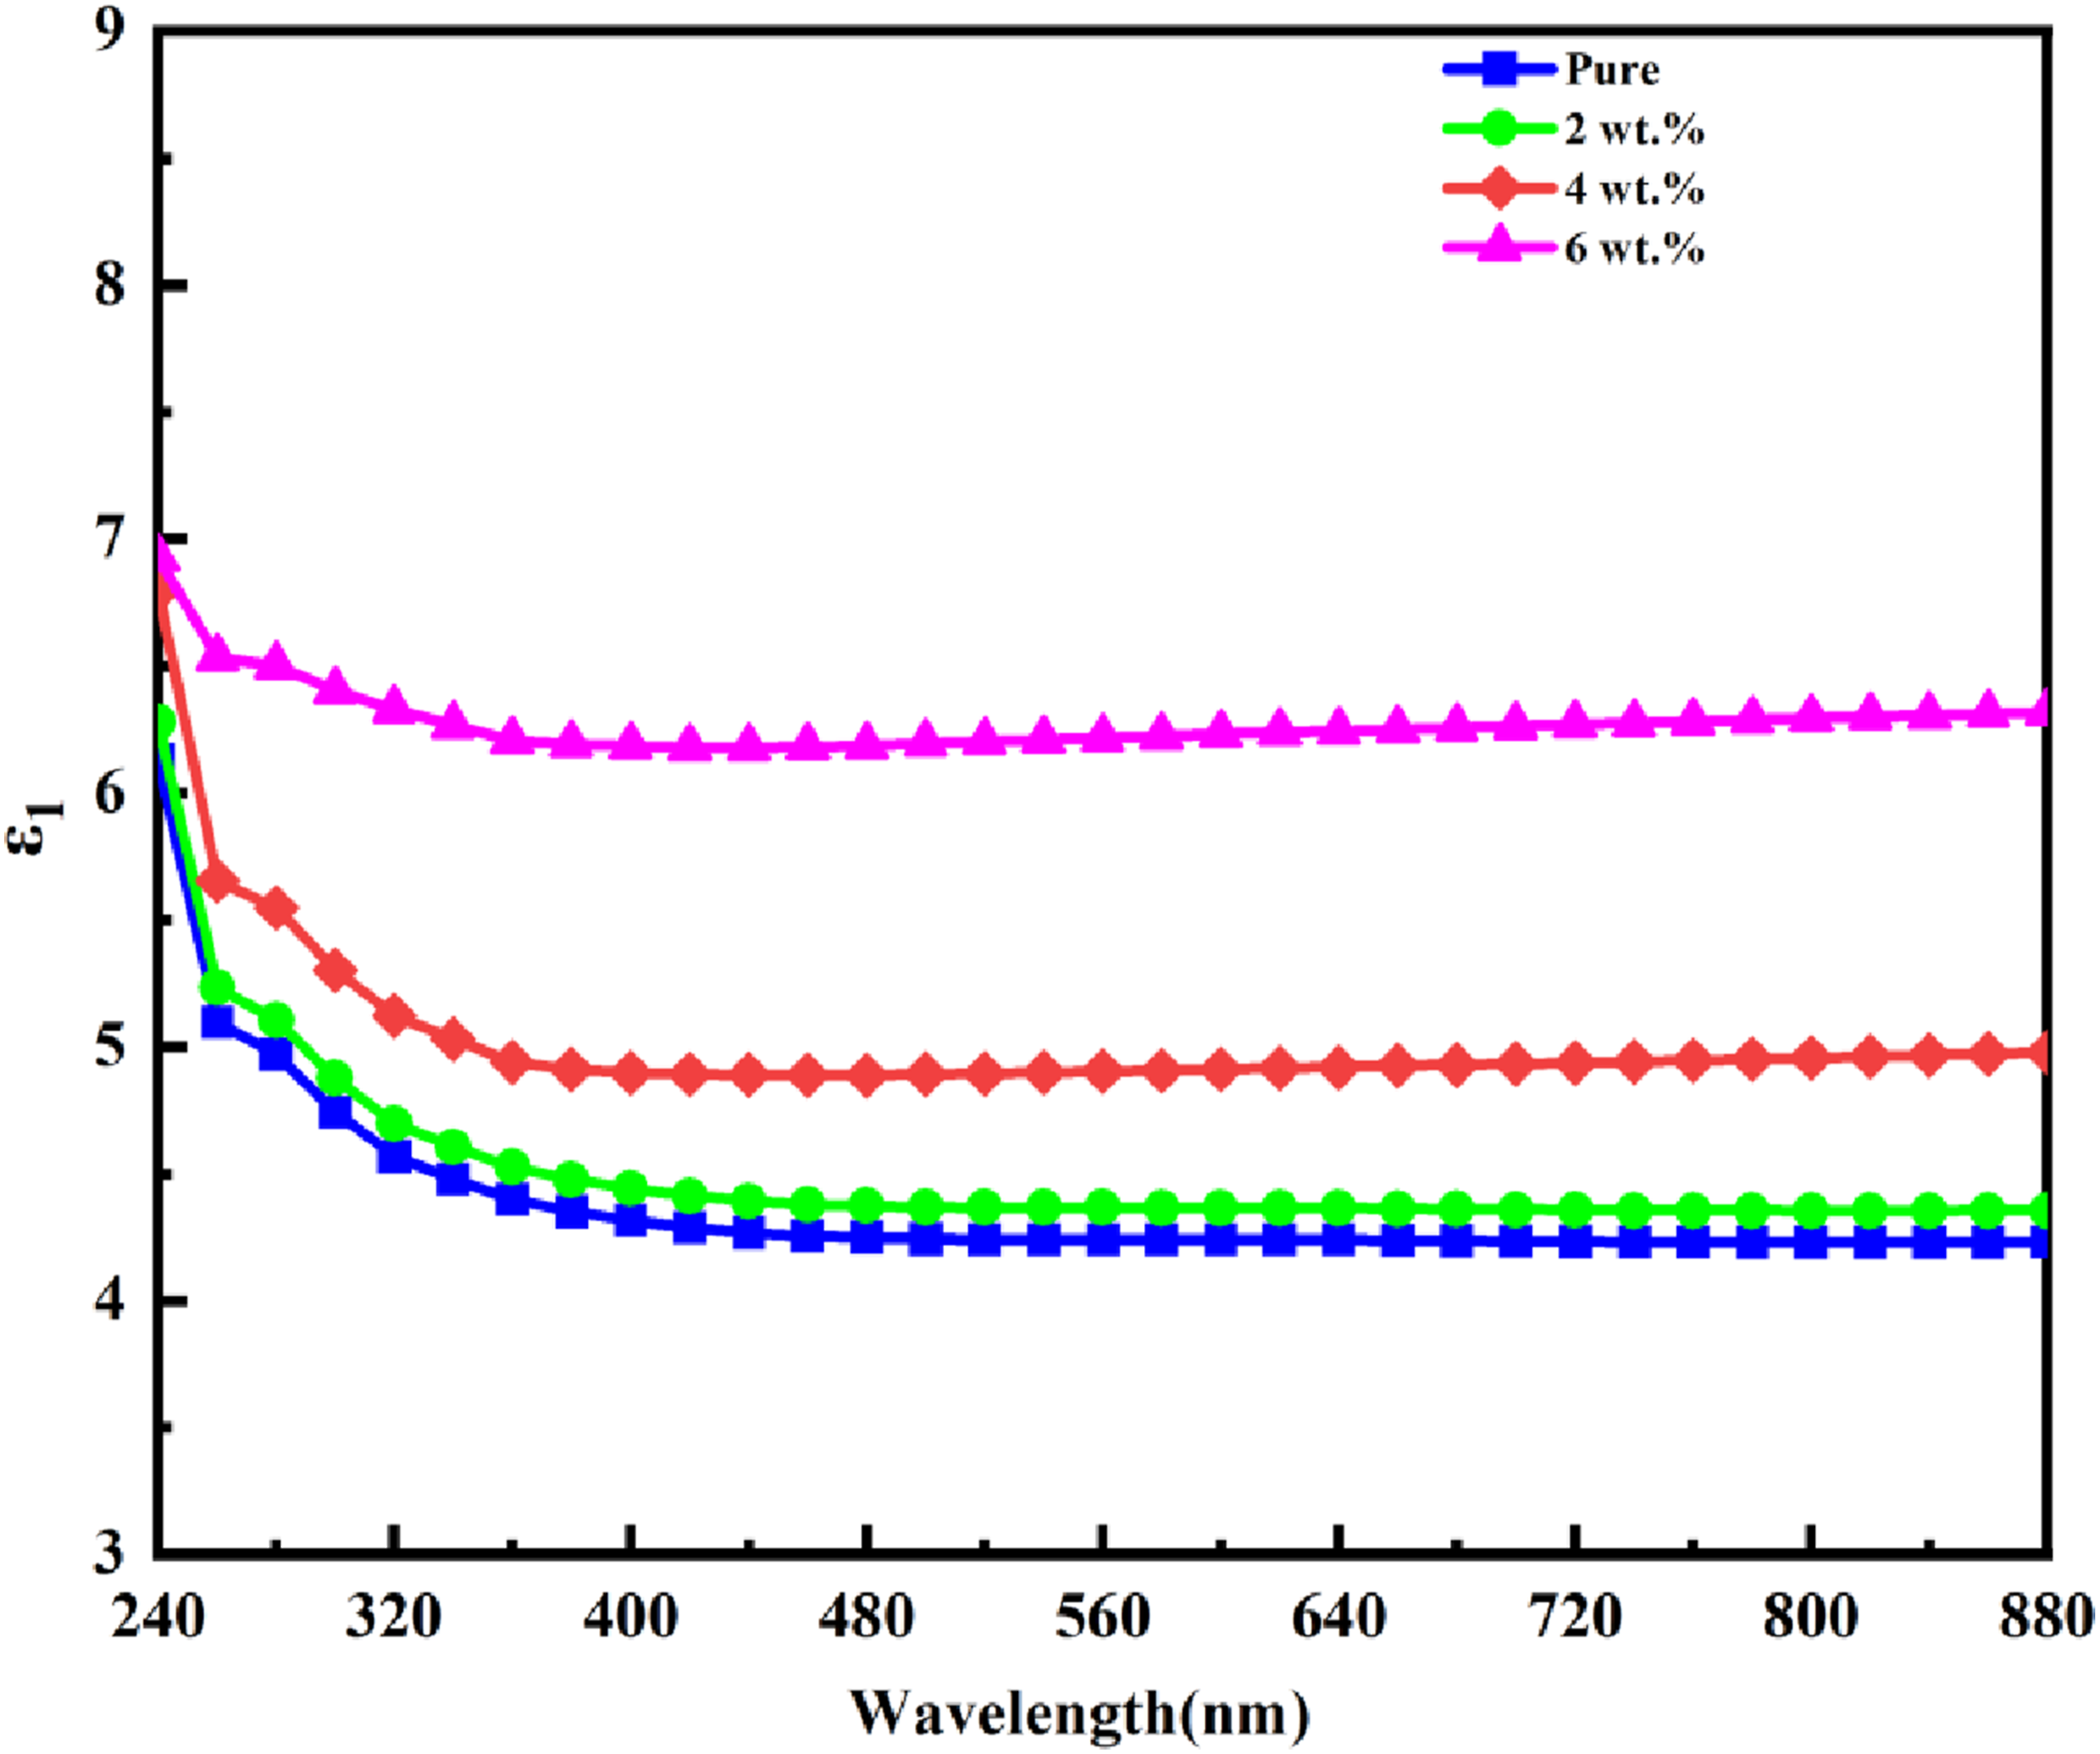
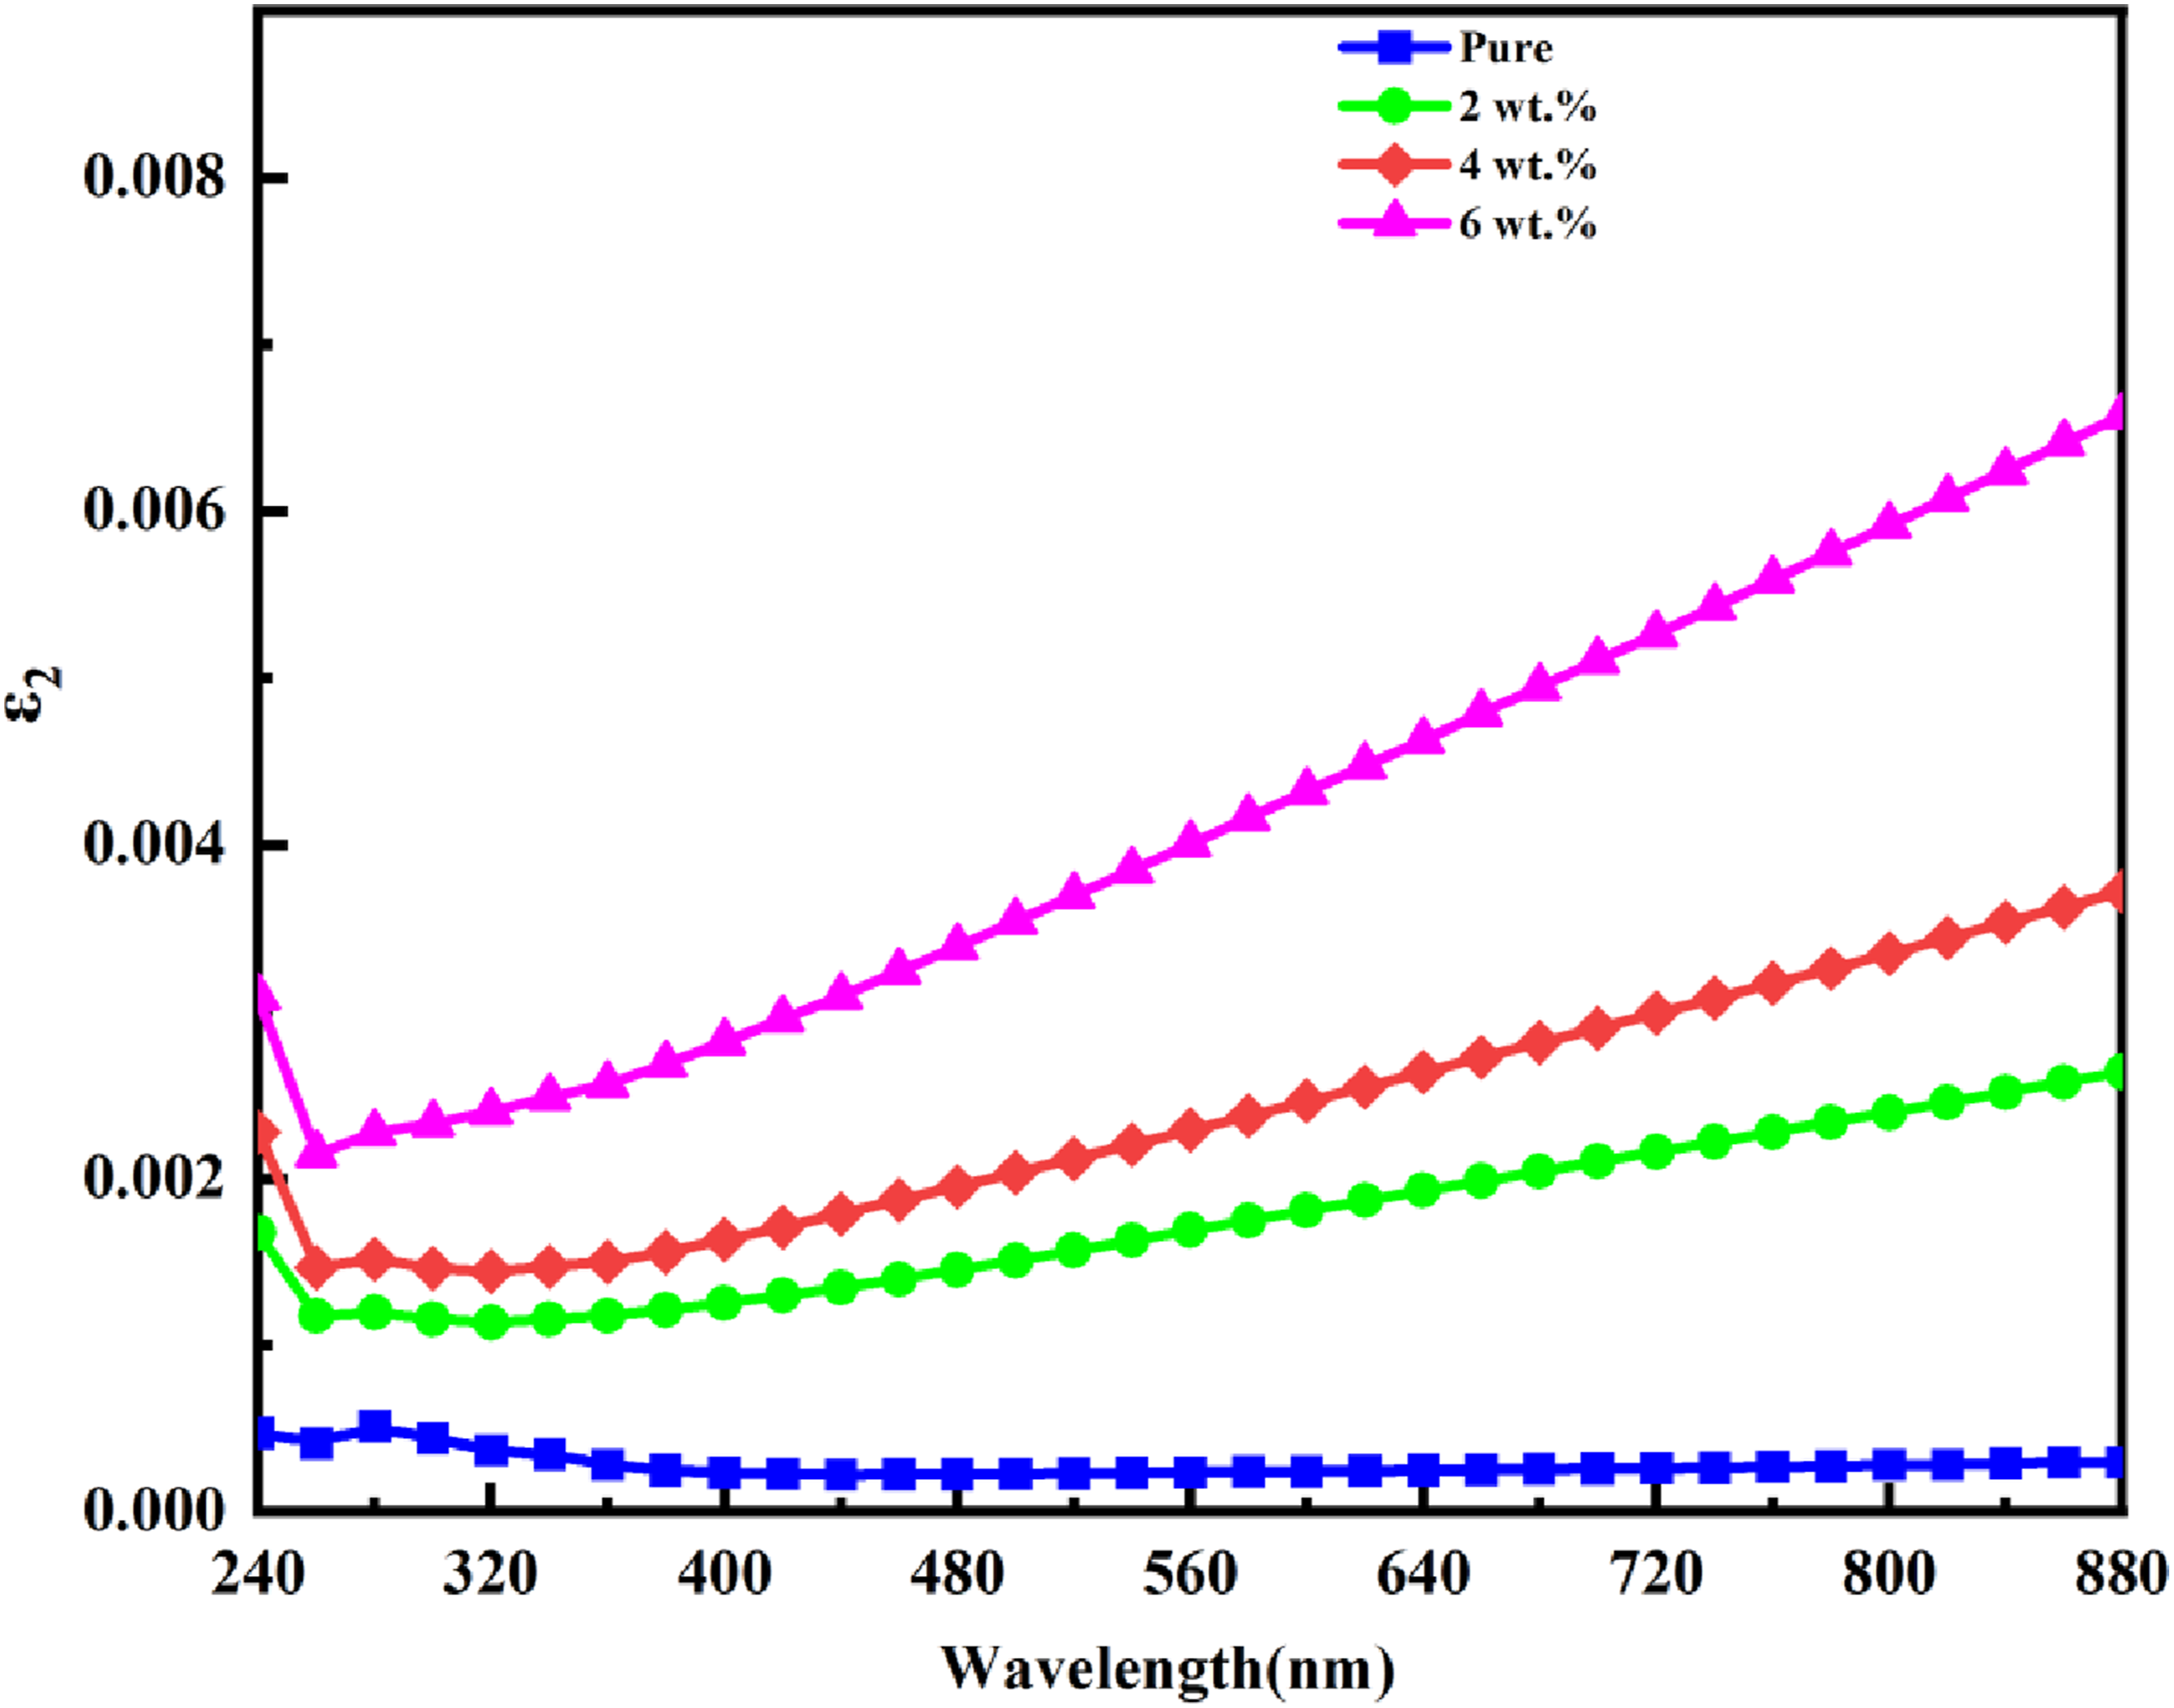
Figure 14 demonstrates that the imaginary part of the dielectric constant (ε2) increases with increasing TiN-SiO2 nanomaterial content, indicating a direct (positive) effect on nanoparticle concentration. This behavior is consistent with higher electrical polarization and a greater contribution of charge-related activities inside the polymer matrix as the nanofiller percentage increases.
Moreover, a strong correspondence is observed between ε2 and the extinction coefficient K across the visible-to-near-infrared region: while the refractive index remains comparatively stable in this spectral window, the extinction coefficient tends to increase gradually with wavelength.62,63
As the wavelength goes up, the optical conductivity of the PVA–PVP–TiN–SiO2 nanocomposites goes down, as shown in Figure 15. You may understand this pattern by remembering that shorter-wavelength photons have larger photon energies, which usually means better absorption and higher optical conductivity in the UV/short-wavelength range. Also, when the TiN–SiO2 concentration goes up, the optical conductivity becomes increasingly reliant on how many nanoparticles are in the solution. Localized energy levels associated to defects or impurities occur within the forbidden gap, which makes the absorption coefficient higher and the optical conductivity stronger.64,65,66 Displays the wavelength-dependent σop for NCs made of PVA-PVP-TiN-SiO2.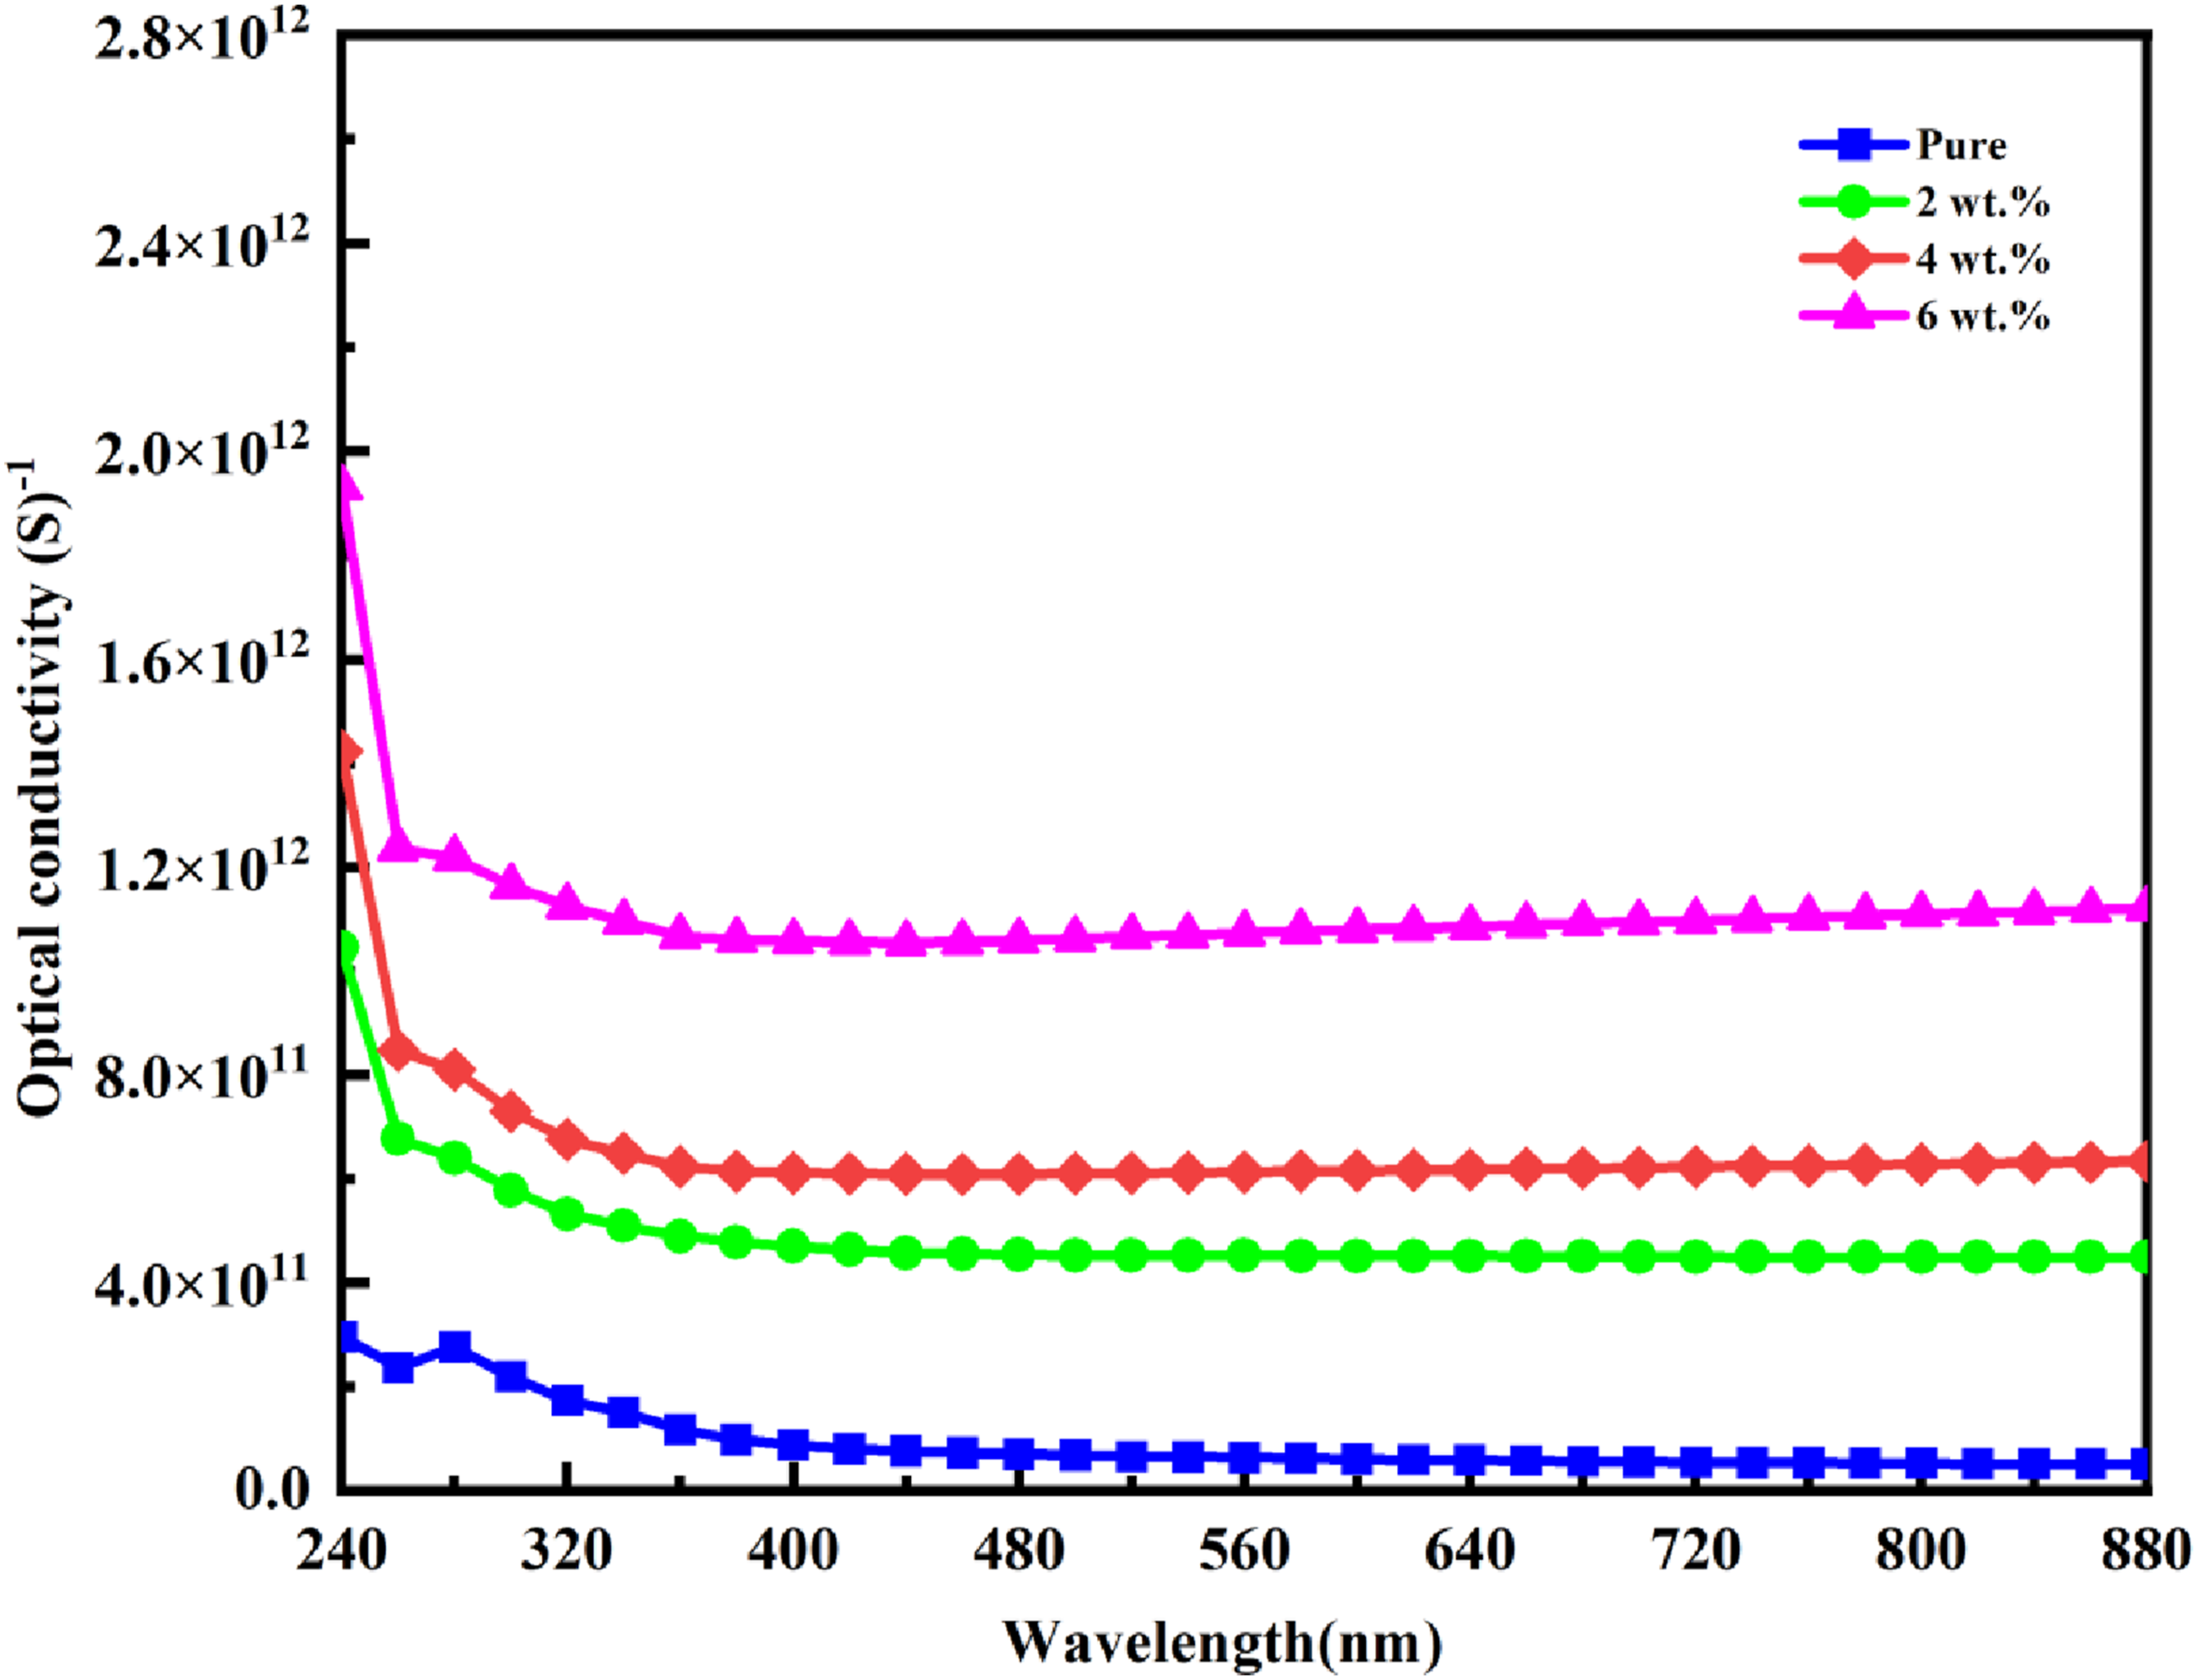
The observed enhancement in the optical properties with increasing nanofiller loading is in good agreement with previous studies on polymer nanocomposites.67,68,69,70
The A.C electrical properties of PVA-PVP/TiN-SiO2 PNCs
Figure 16 illustrates the fluctuation of the actual dielectric constant as a function of frequency at ambient temperature. It is proven that the dielectric constant value for PVA-PVP-TiN-SiO2 nanocomposites is elevated at low frequencies due to the ample relaxation time available for electric dipoles to be maintained by the applied field. Consequently, the dielectric constant is elevated. However, as the frequency rises, the dielectric constant decreases and the relaxation period shortens because the dipoles lack sufficient time to align with the field.71,72 ɛ' behavior with (PVA-PVP-TiN-SiO2) NCs frequency.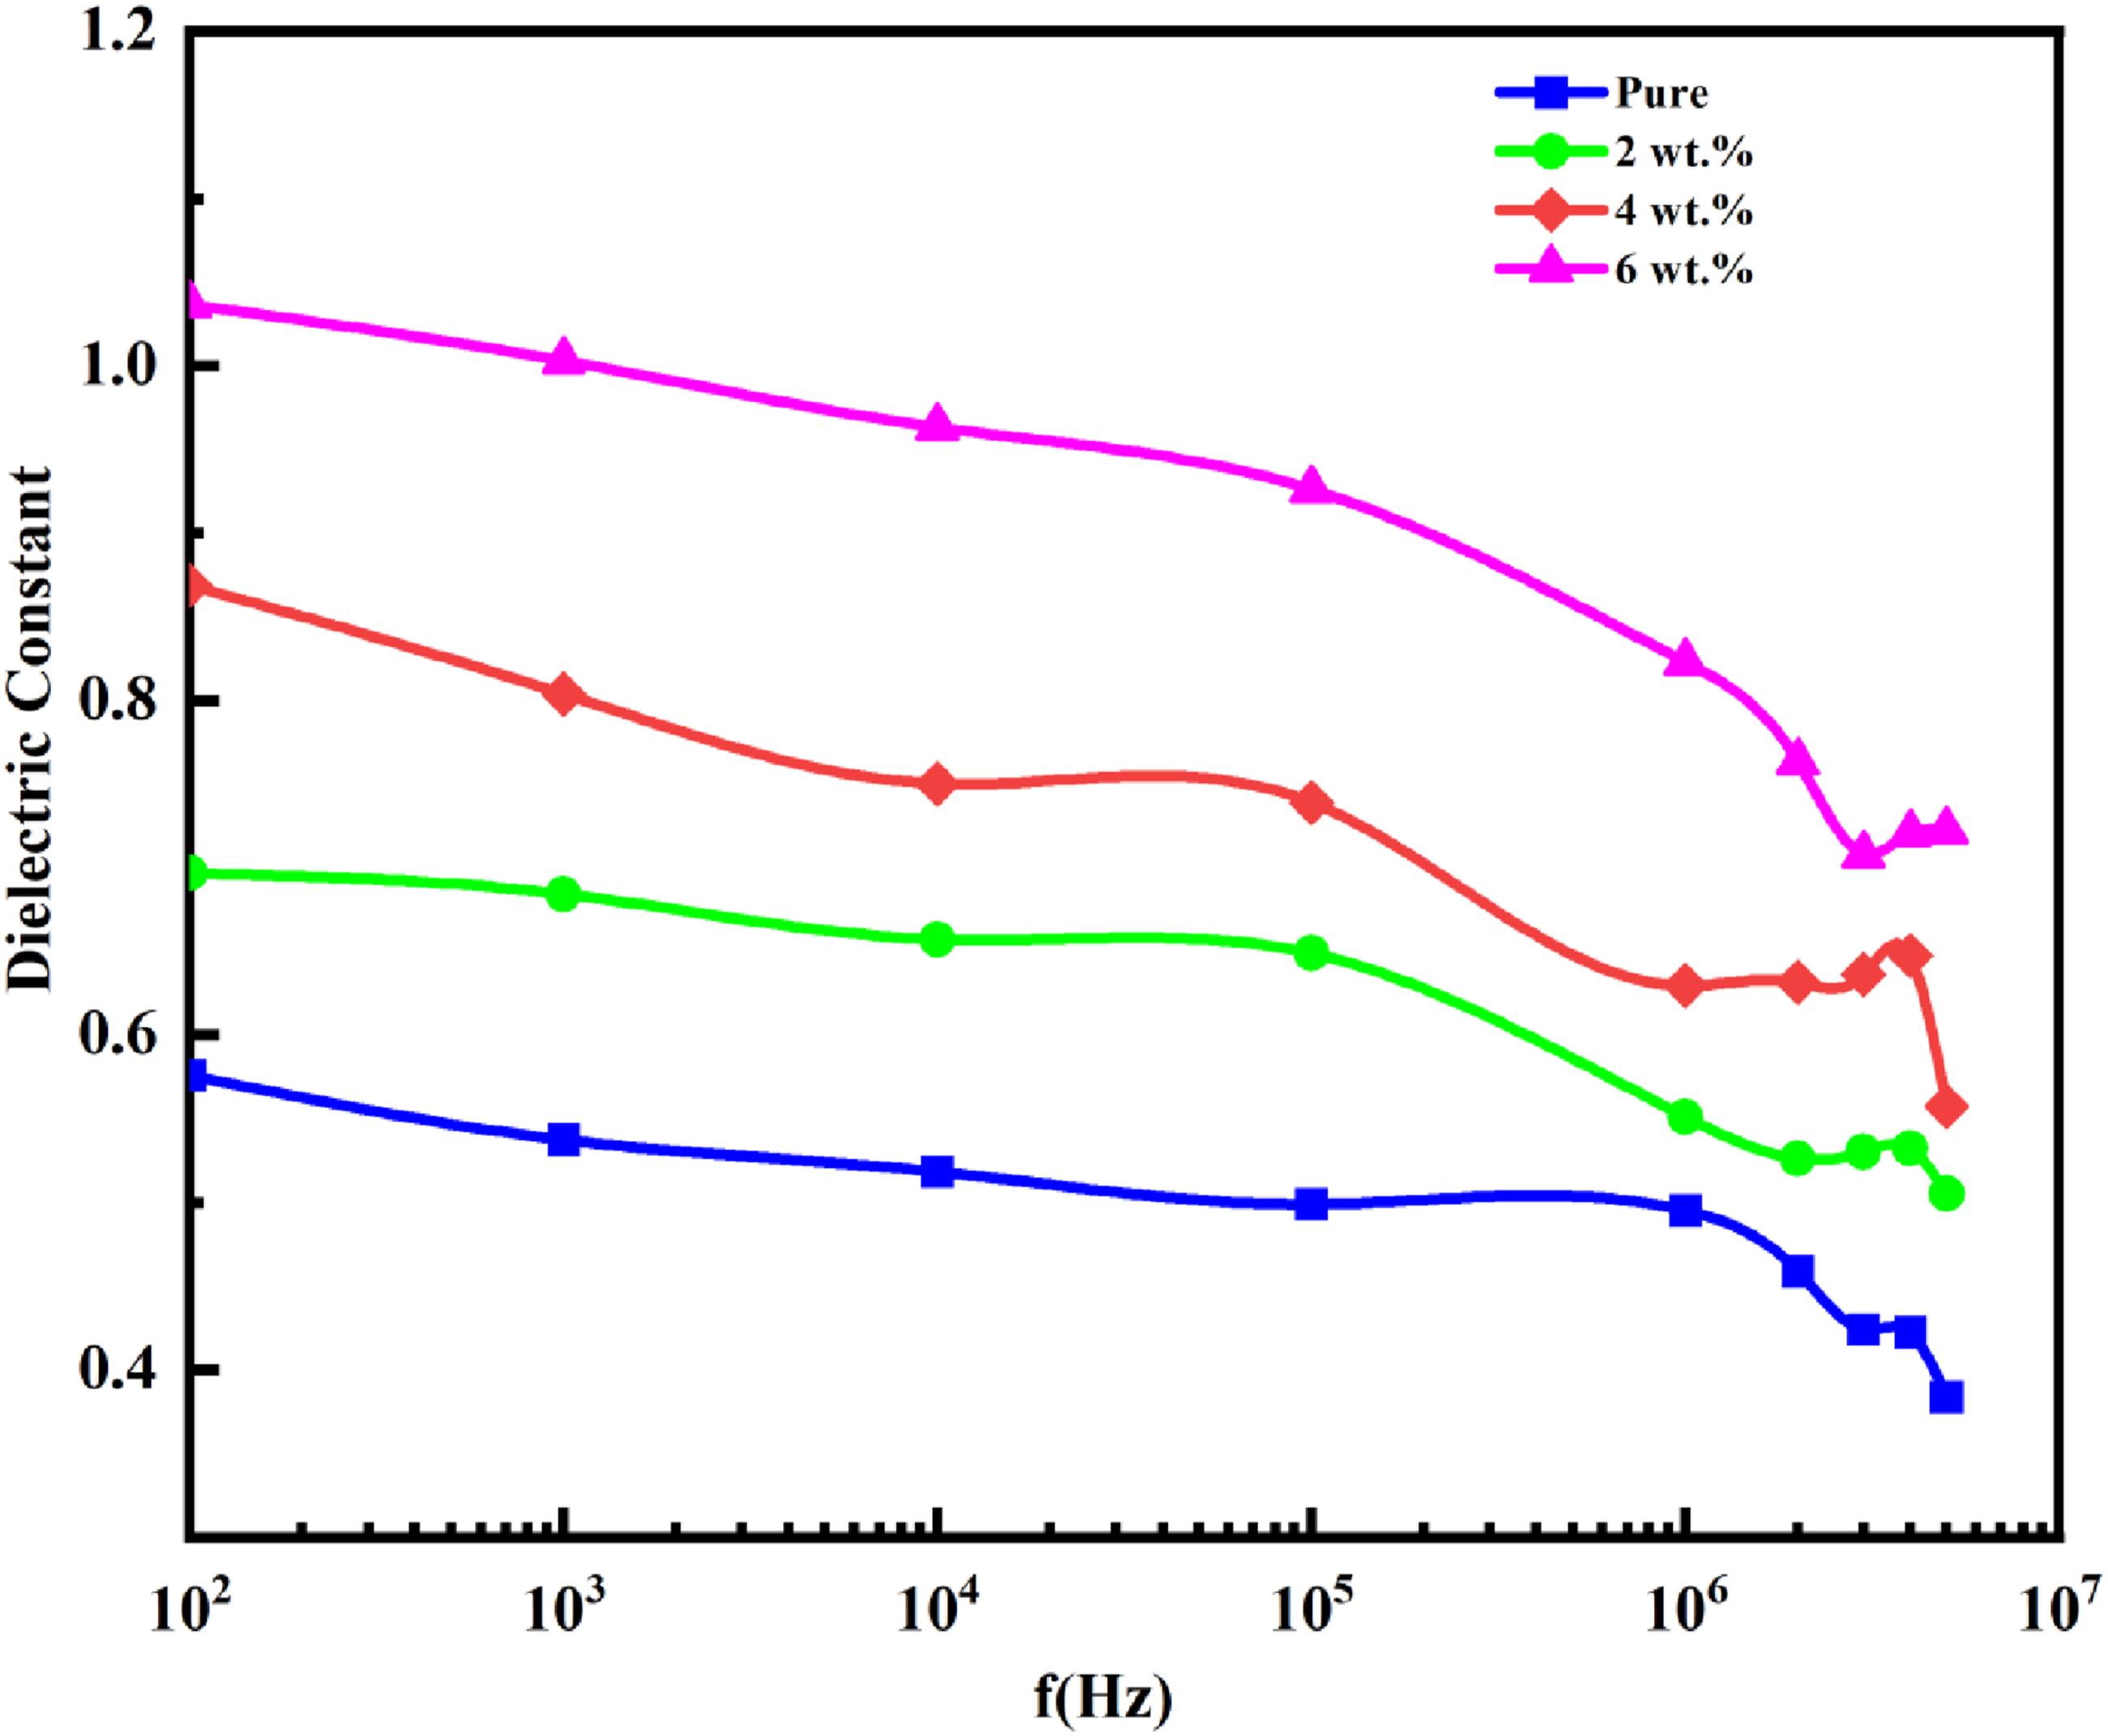
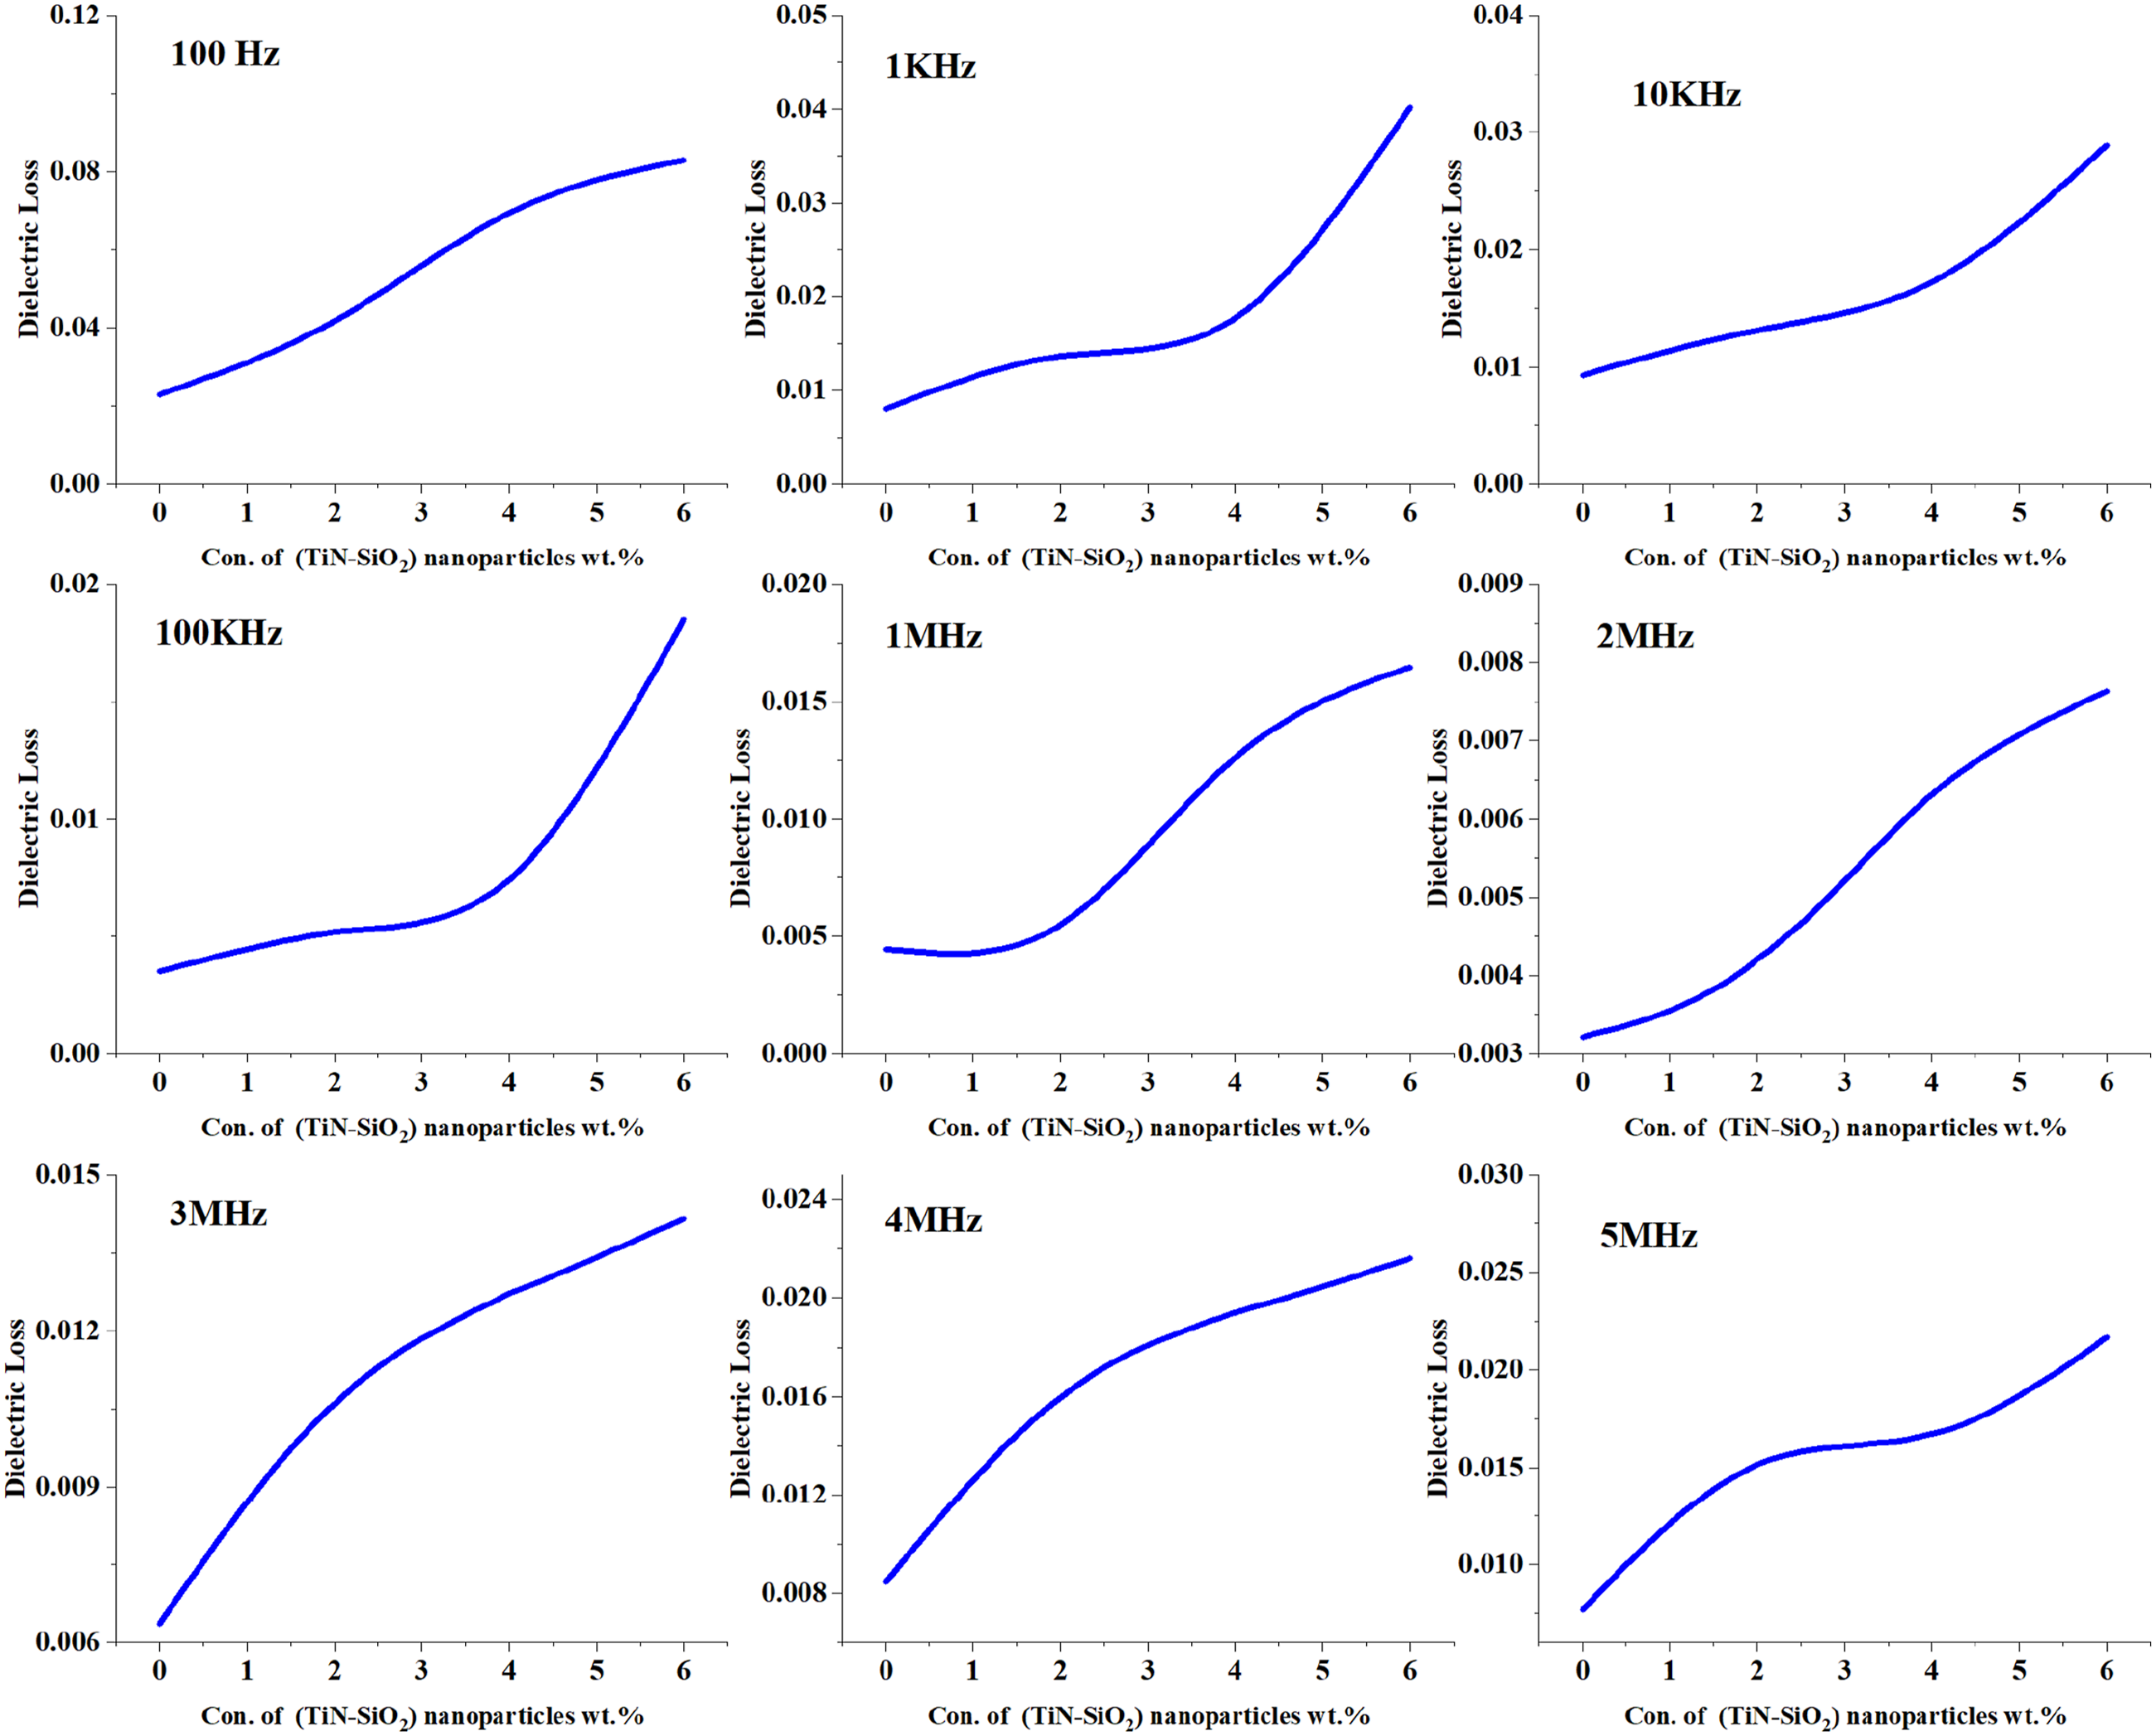
Figure 17 depicts the variation in dielectric loss frequency for PVA-PVP-TiN-SiO2 nanocomposites at room temperature as a function of different concentrations of (TiN-SiO2) nanoparticles. The frequency of the dipole and the frequency of the electric field exhibit a temporal lag, suggesting the absence of ion dispersion and charge buildup. The graph clearly demonstrates that loss decreases with increasing frequency due to the inability of composite molecules’ dipoles to align parallel, resulting in a fast periodic phase shift of the electric field.57,73 ε” Behavior with (PVA-PVP-TiN-SiO2) NCs frequency.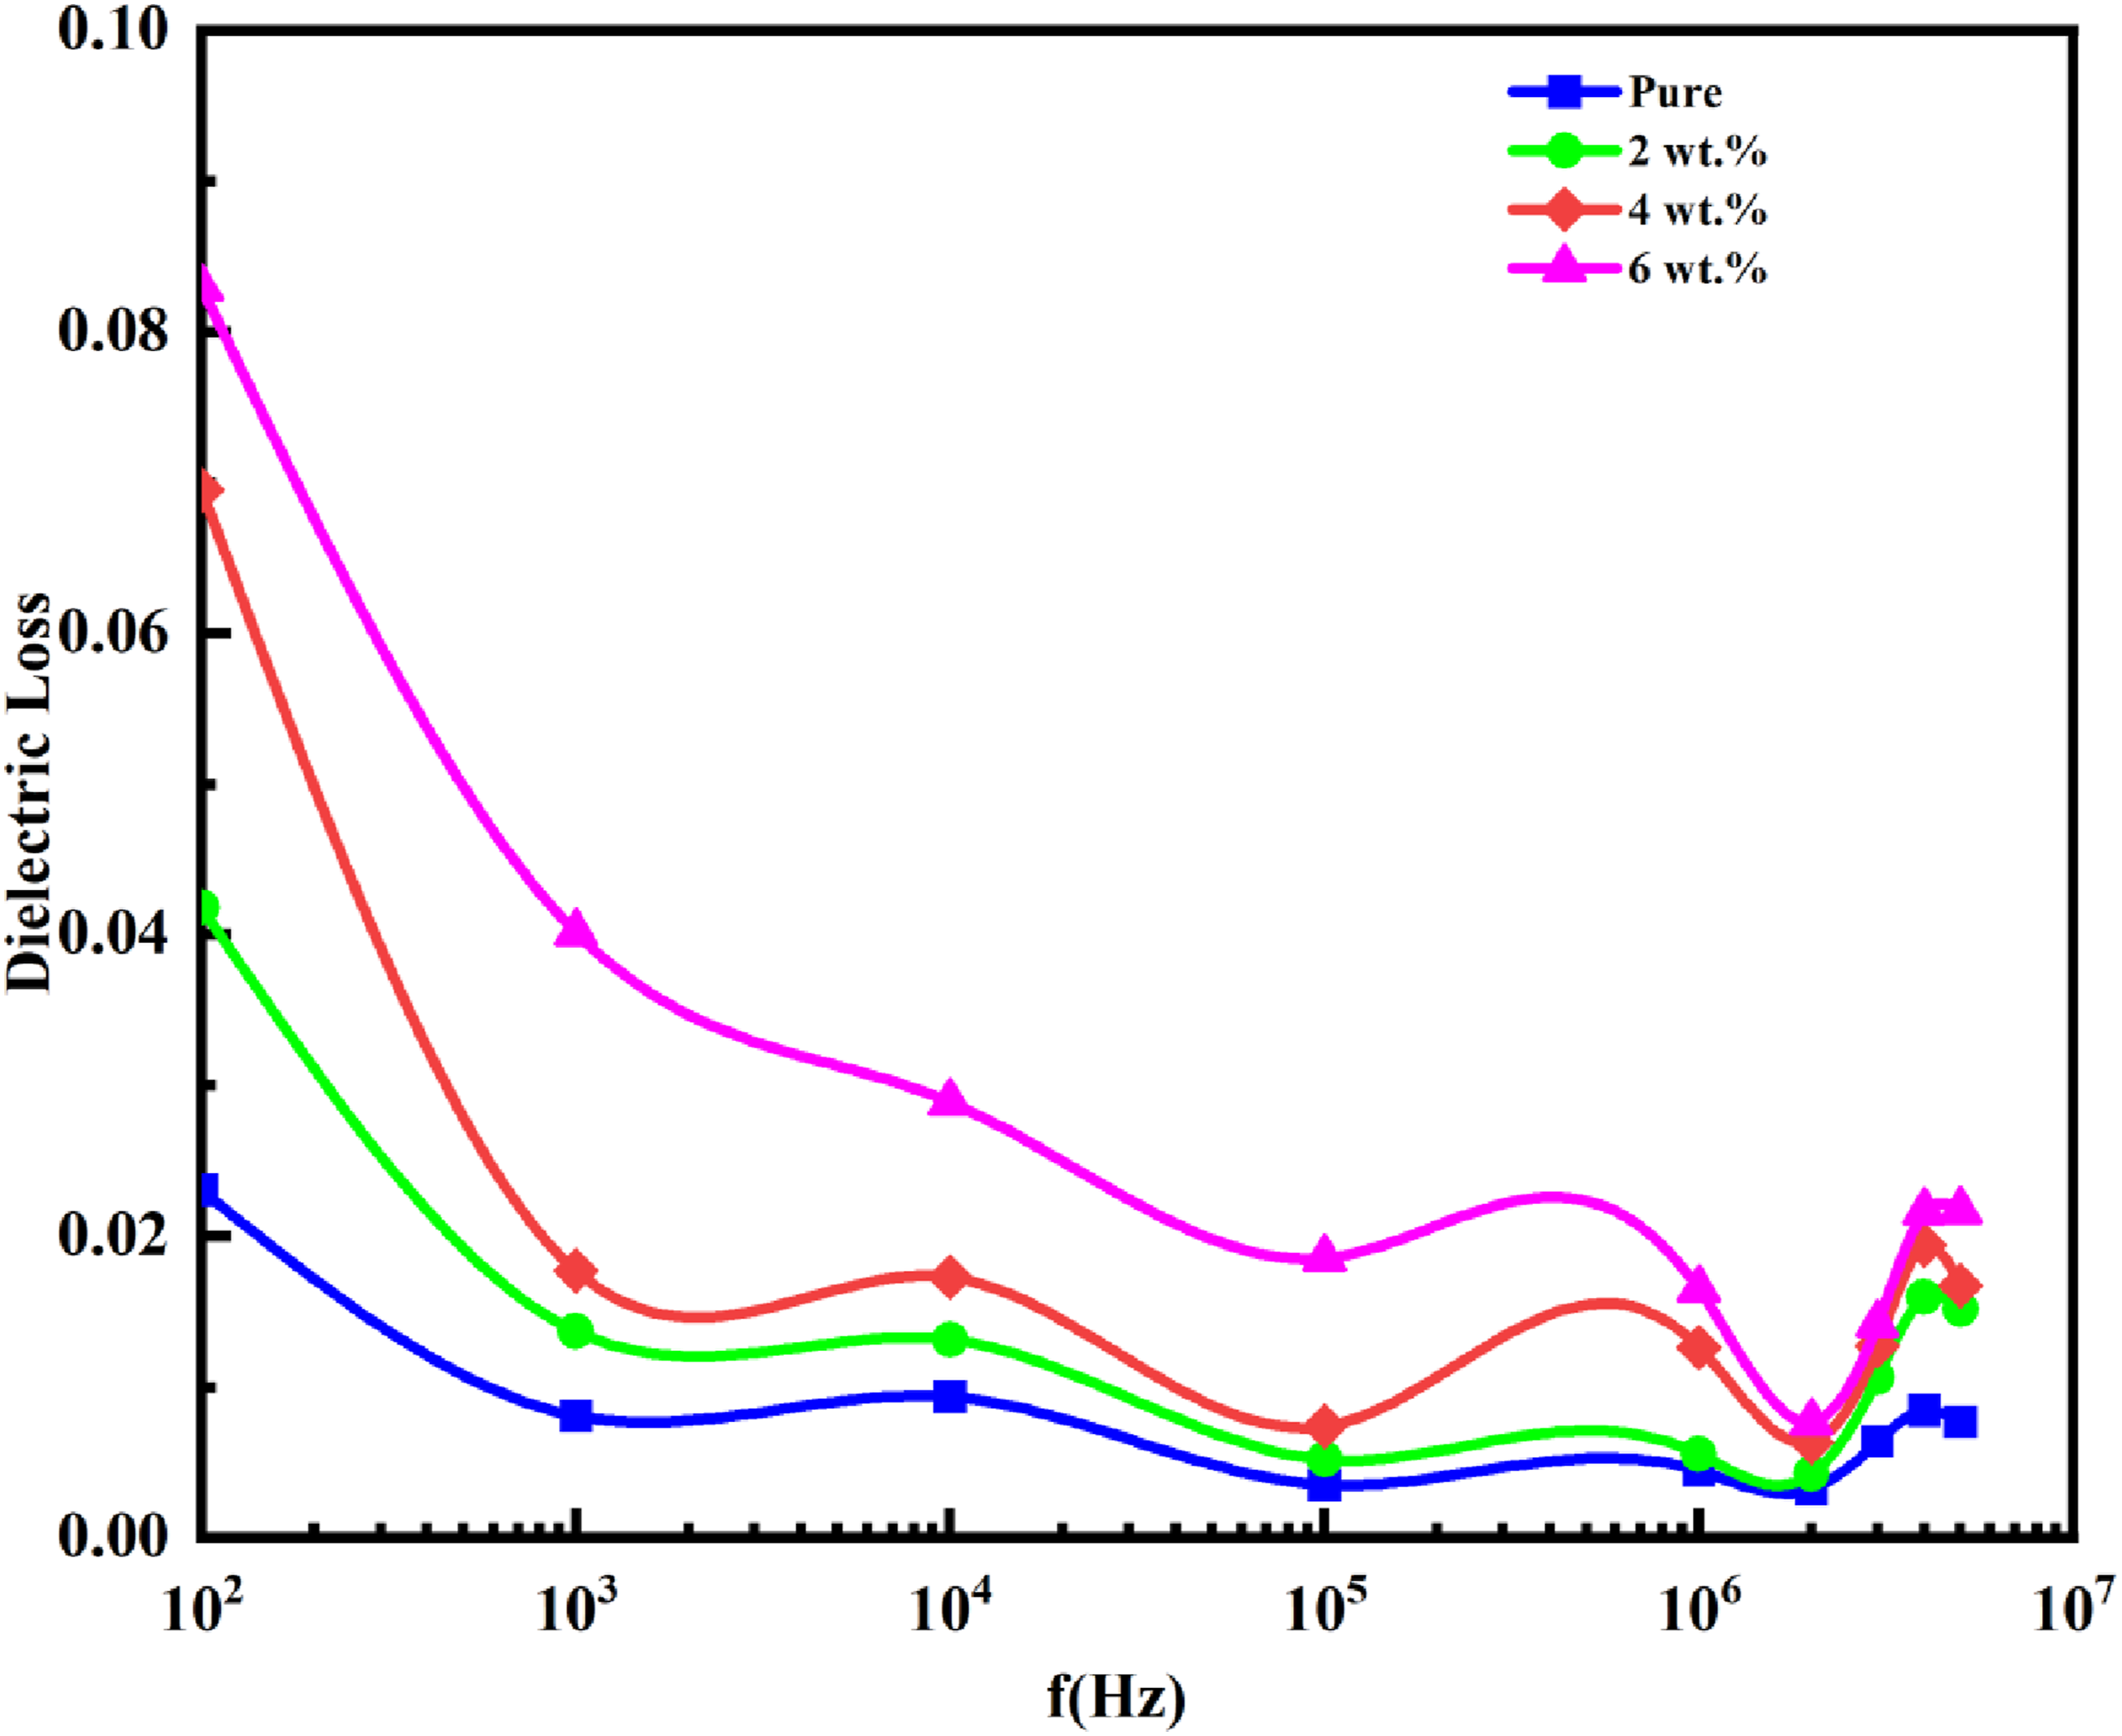
The effect of the (TiN-SiO2) nanoparticles concentration on the ε' of PVA-PVP at various frequencies is seen in Figure 18. The dielectric constant value increases with the rising concentration of (TiN-SiO2) nanoparticles. This is attributed to the formation of a cluster of (TiN-SiO2) NMs inside PNCs at elevated concentrations, which accounts for the observed rise. Figure 19 demonstrates how the permittivity (ε) of PVA-PVP at different frequencies is influenced by the concentration of (TiN-SiO2) nanomaterials. The dielectric loss exhibited a pronounced rise with the rising loading ratio of (TiN-SiO2) NMs. Because an increased concentration of (TiN-SiO2) NMs elevates electronic charge, a direct link may exist between the nano-filler content and the increase in dielectric loss. It is well recognized that (TiN-SiO2) nanomaterials possess distinctive features that directly influence their electrical characteristics and contribute to an increase in the dielectric loss of the nanocomposites.58,74 TiN-SiO2 NMs content’s impact on PVA-PVP’s ɛ' for different frequencies. TiN-SiO2 NMs content’s impact on PVA-PVP’s ε” for different frequencies.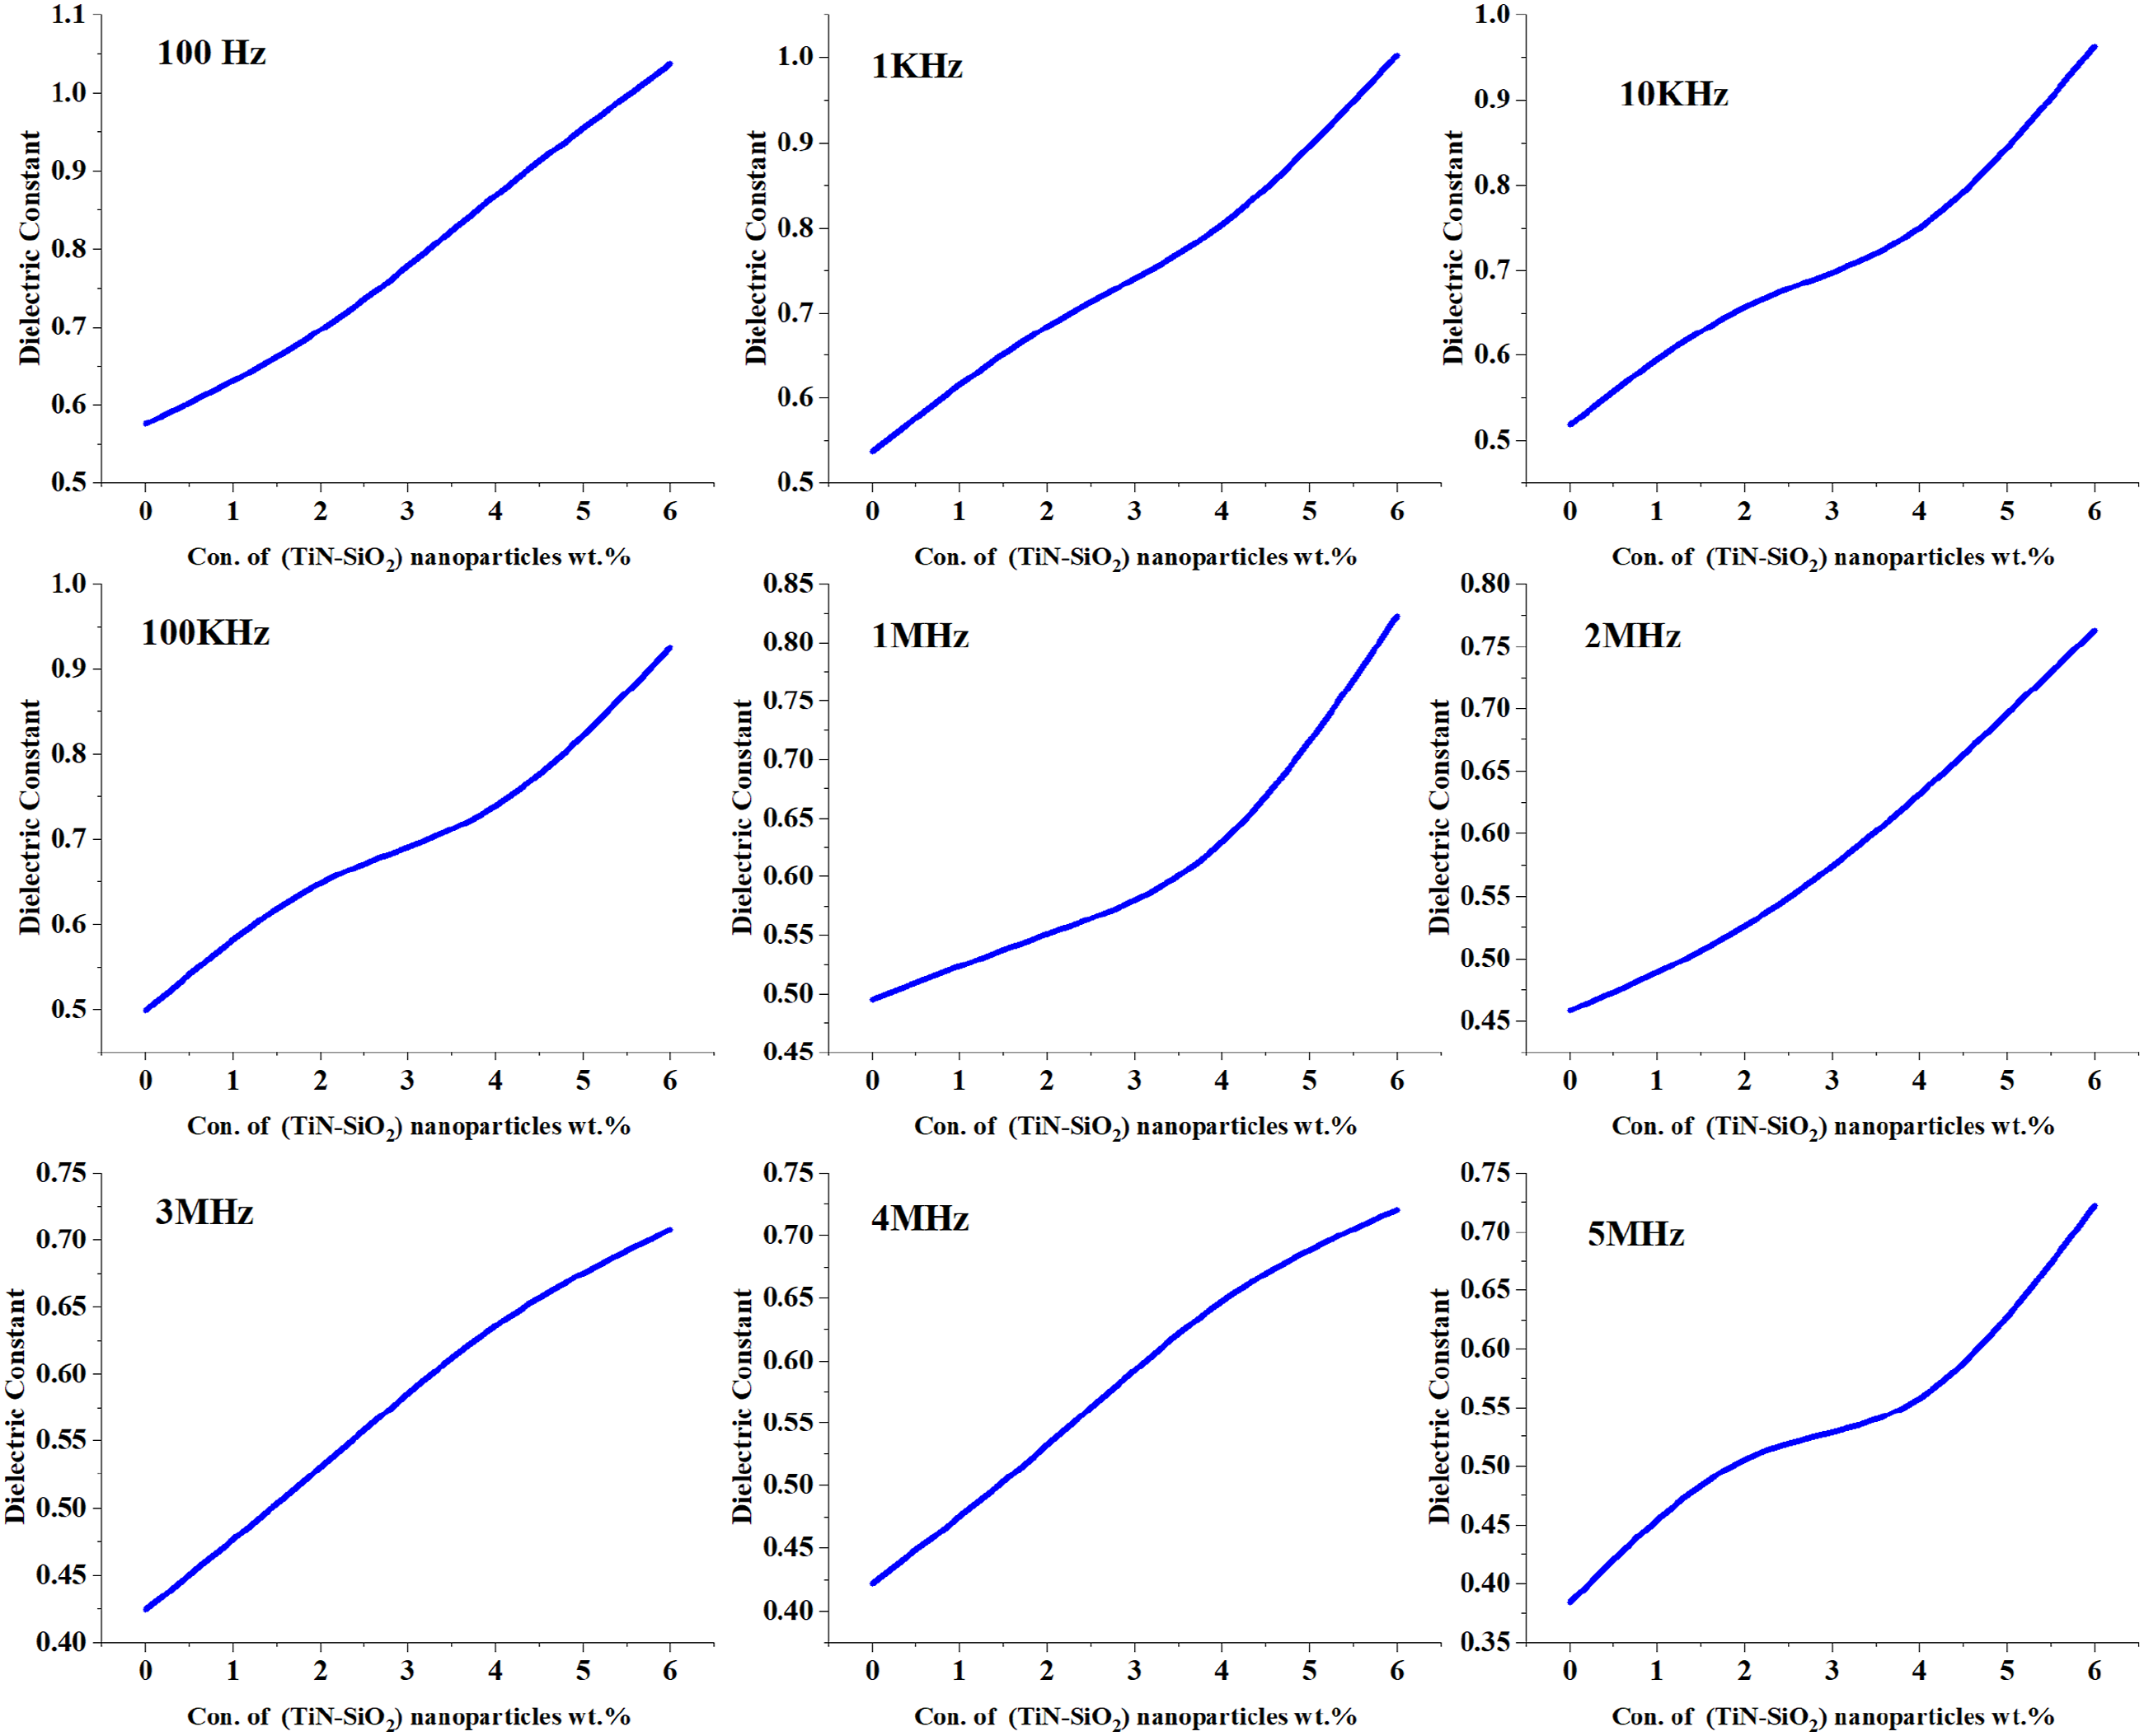
Examining the frequency dependence of the A.C electrical conductivity (Figure 20) provides useful insight into the charge-transport mechanism in the prepared nanocomposites. For all compositions, σa.c increases with increasing applied-field frequency, which is attributed to the enhanced mobility of charge carriers and ion hopping/migration within nanoparticle-rich clusters. At low frequencies, charge accumulation at the electrode–electrolyte interface becomes more pronounced, restricting the number of ions that can move freely and thereby suppressing the measured conductivity. In addition, raising the TiN–SiO2 nanomaterial content results in higher conductivity values, consistent with an increased population of electrical charges associated with the formation of more developed (saturated) nanofiller networks within the polymer matrix.
75
Conductivity difference for (PVA-PVP-TiN-SiO2) NCs with frequency (f).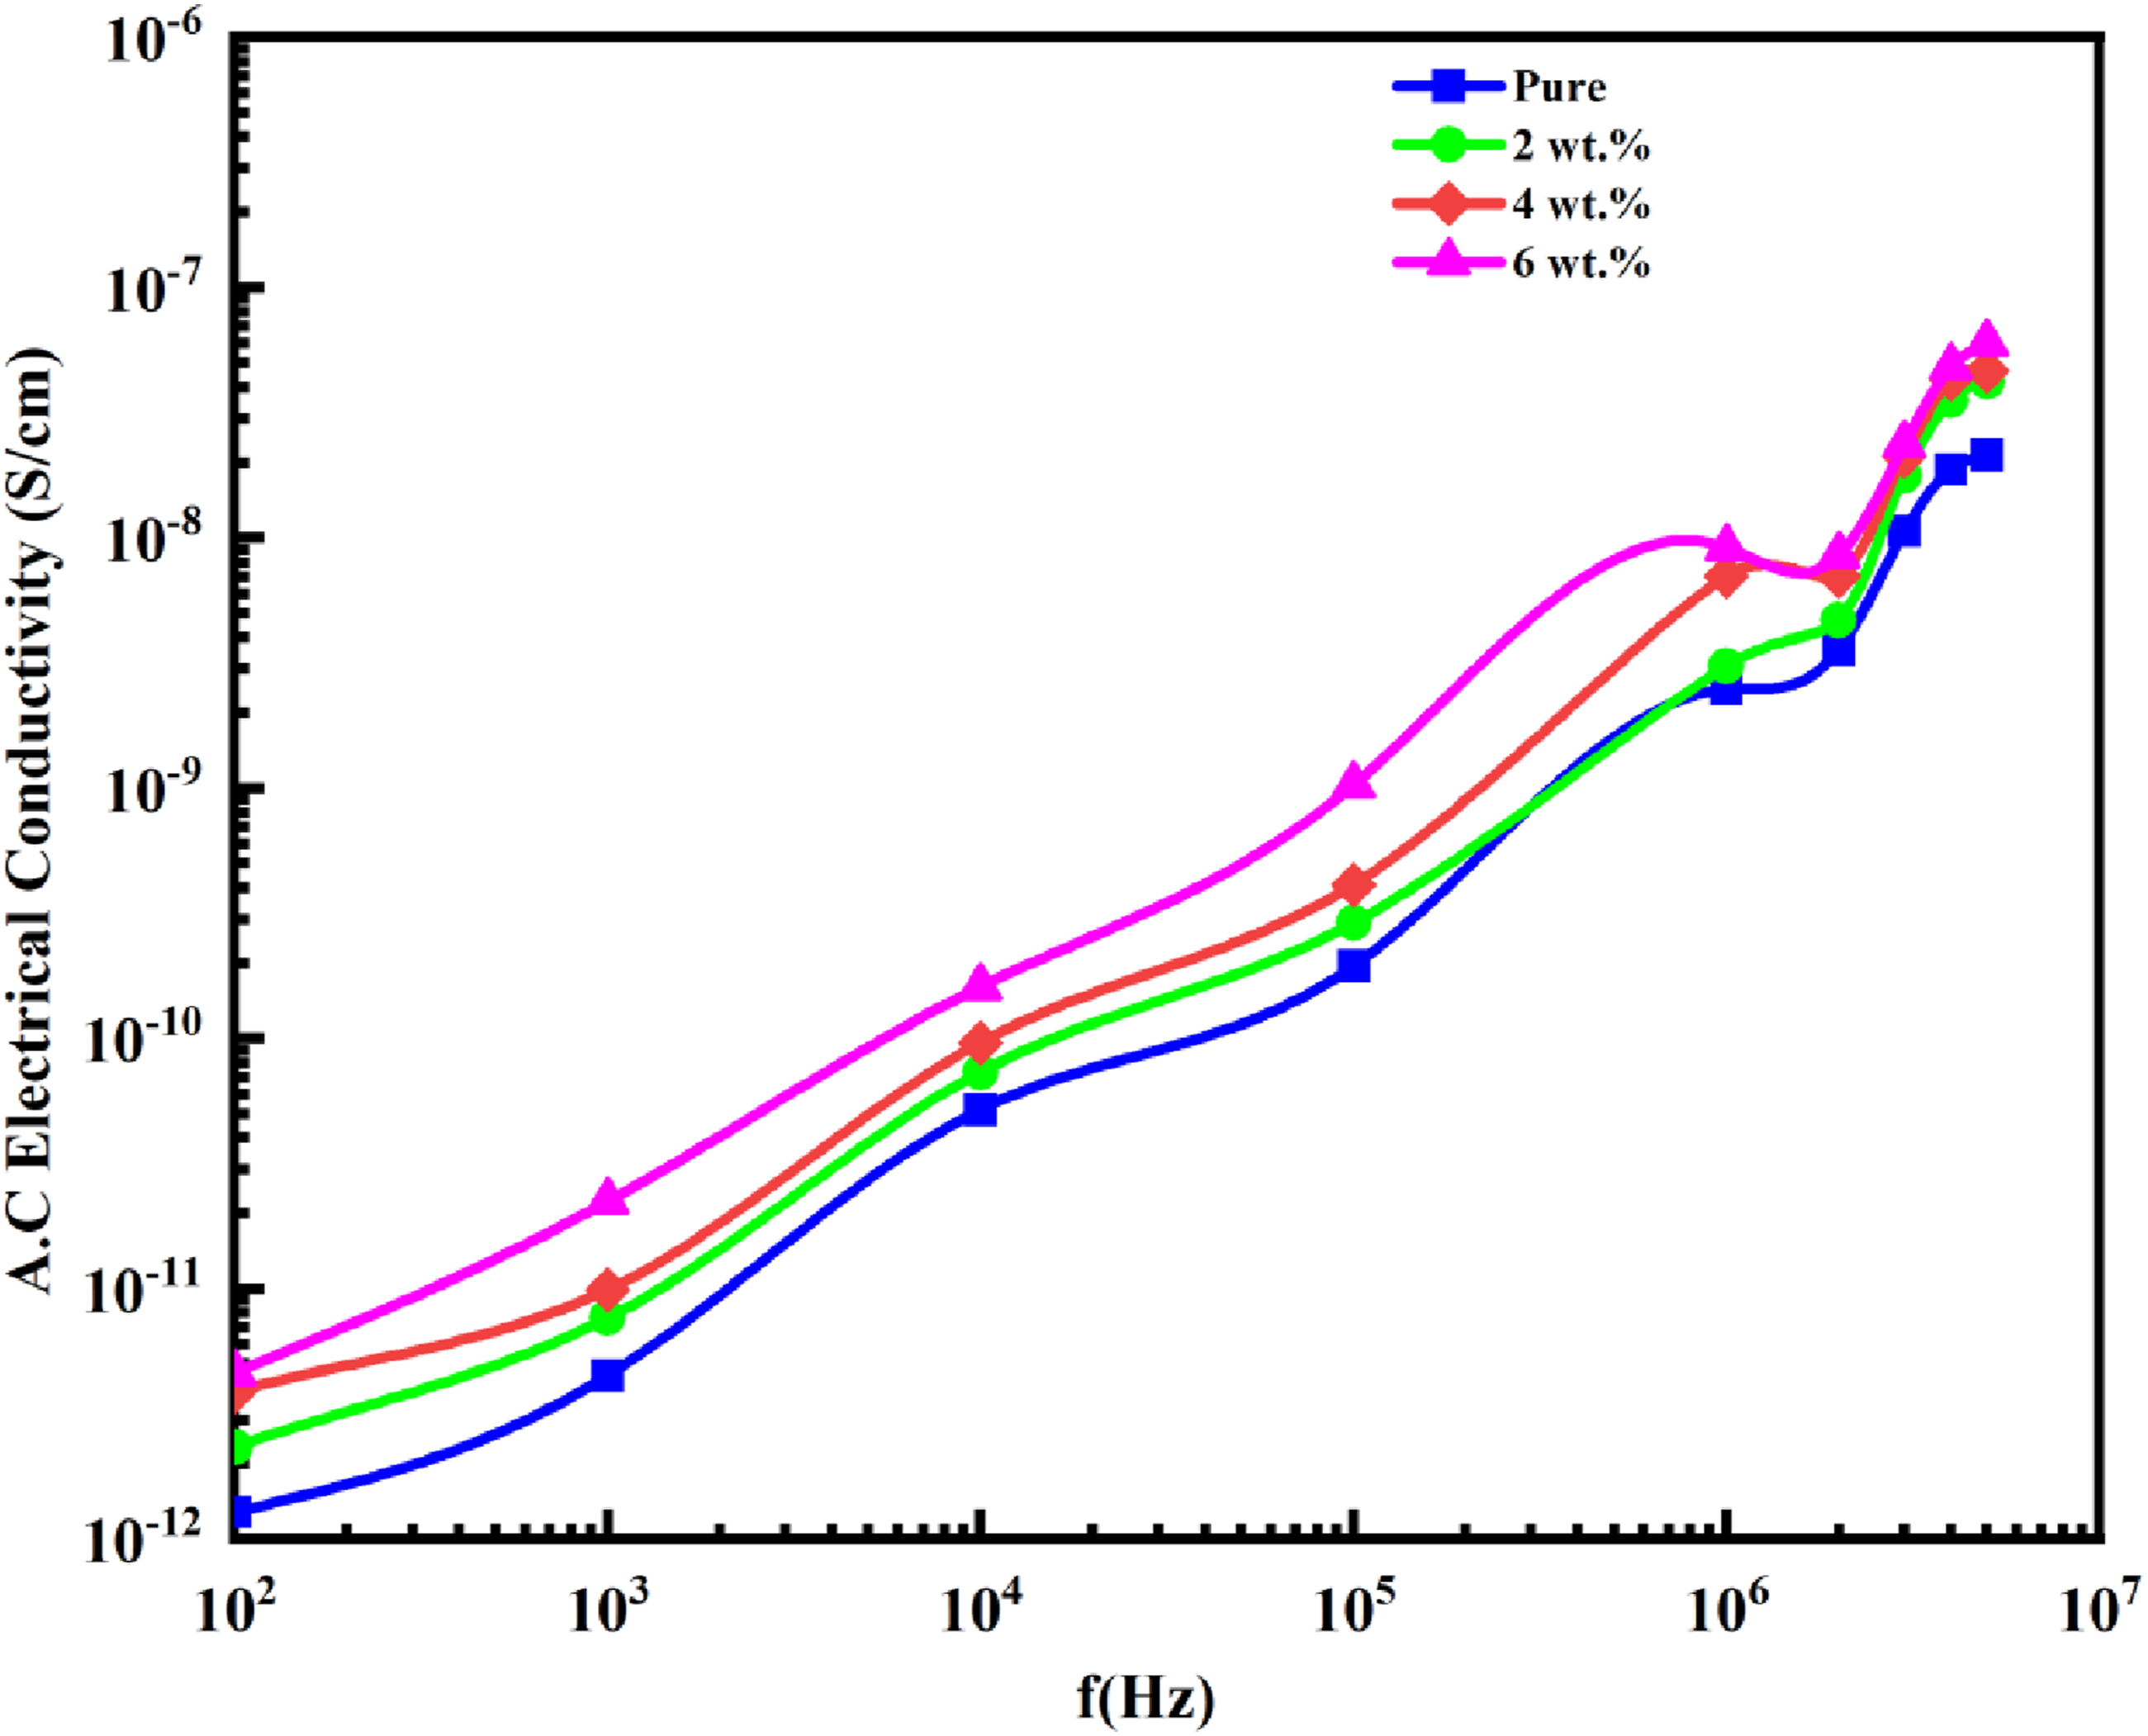
Figure 21 shows that adding more TiN–SiO2 nanoparticles to the PVA–PVP mix makes it more electrically conductive throughout the whole range of frequencies that were examined. In other words, conductivity depends on the amount of nanofiller used, not only the frequency. This tendency is due to the space-charge effect. Adding additional TiN–SiO2 increases the quantity of charge carriers and makes them more evenly spread out across the polymer matrix, which speeds up charge transport. The composite acts more and more like a network with more carrier paths as the amount of nanofiller grows, which is why the observed conductivity goes up.
76
TiN-SiO2 NMs composition affects PVA-PVP electrical conductivity at various frequencies.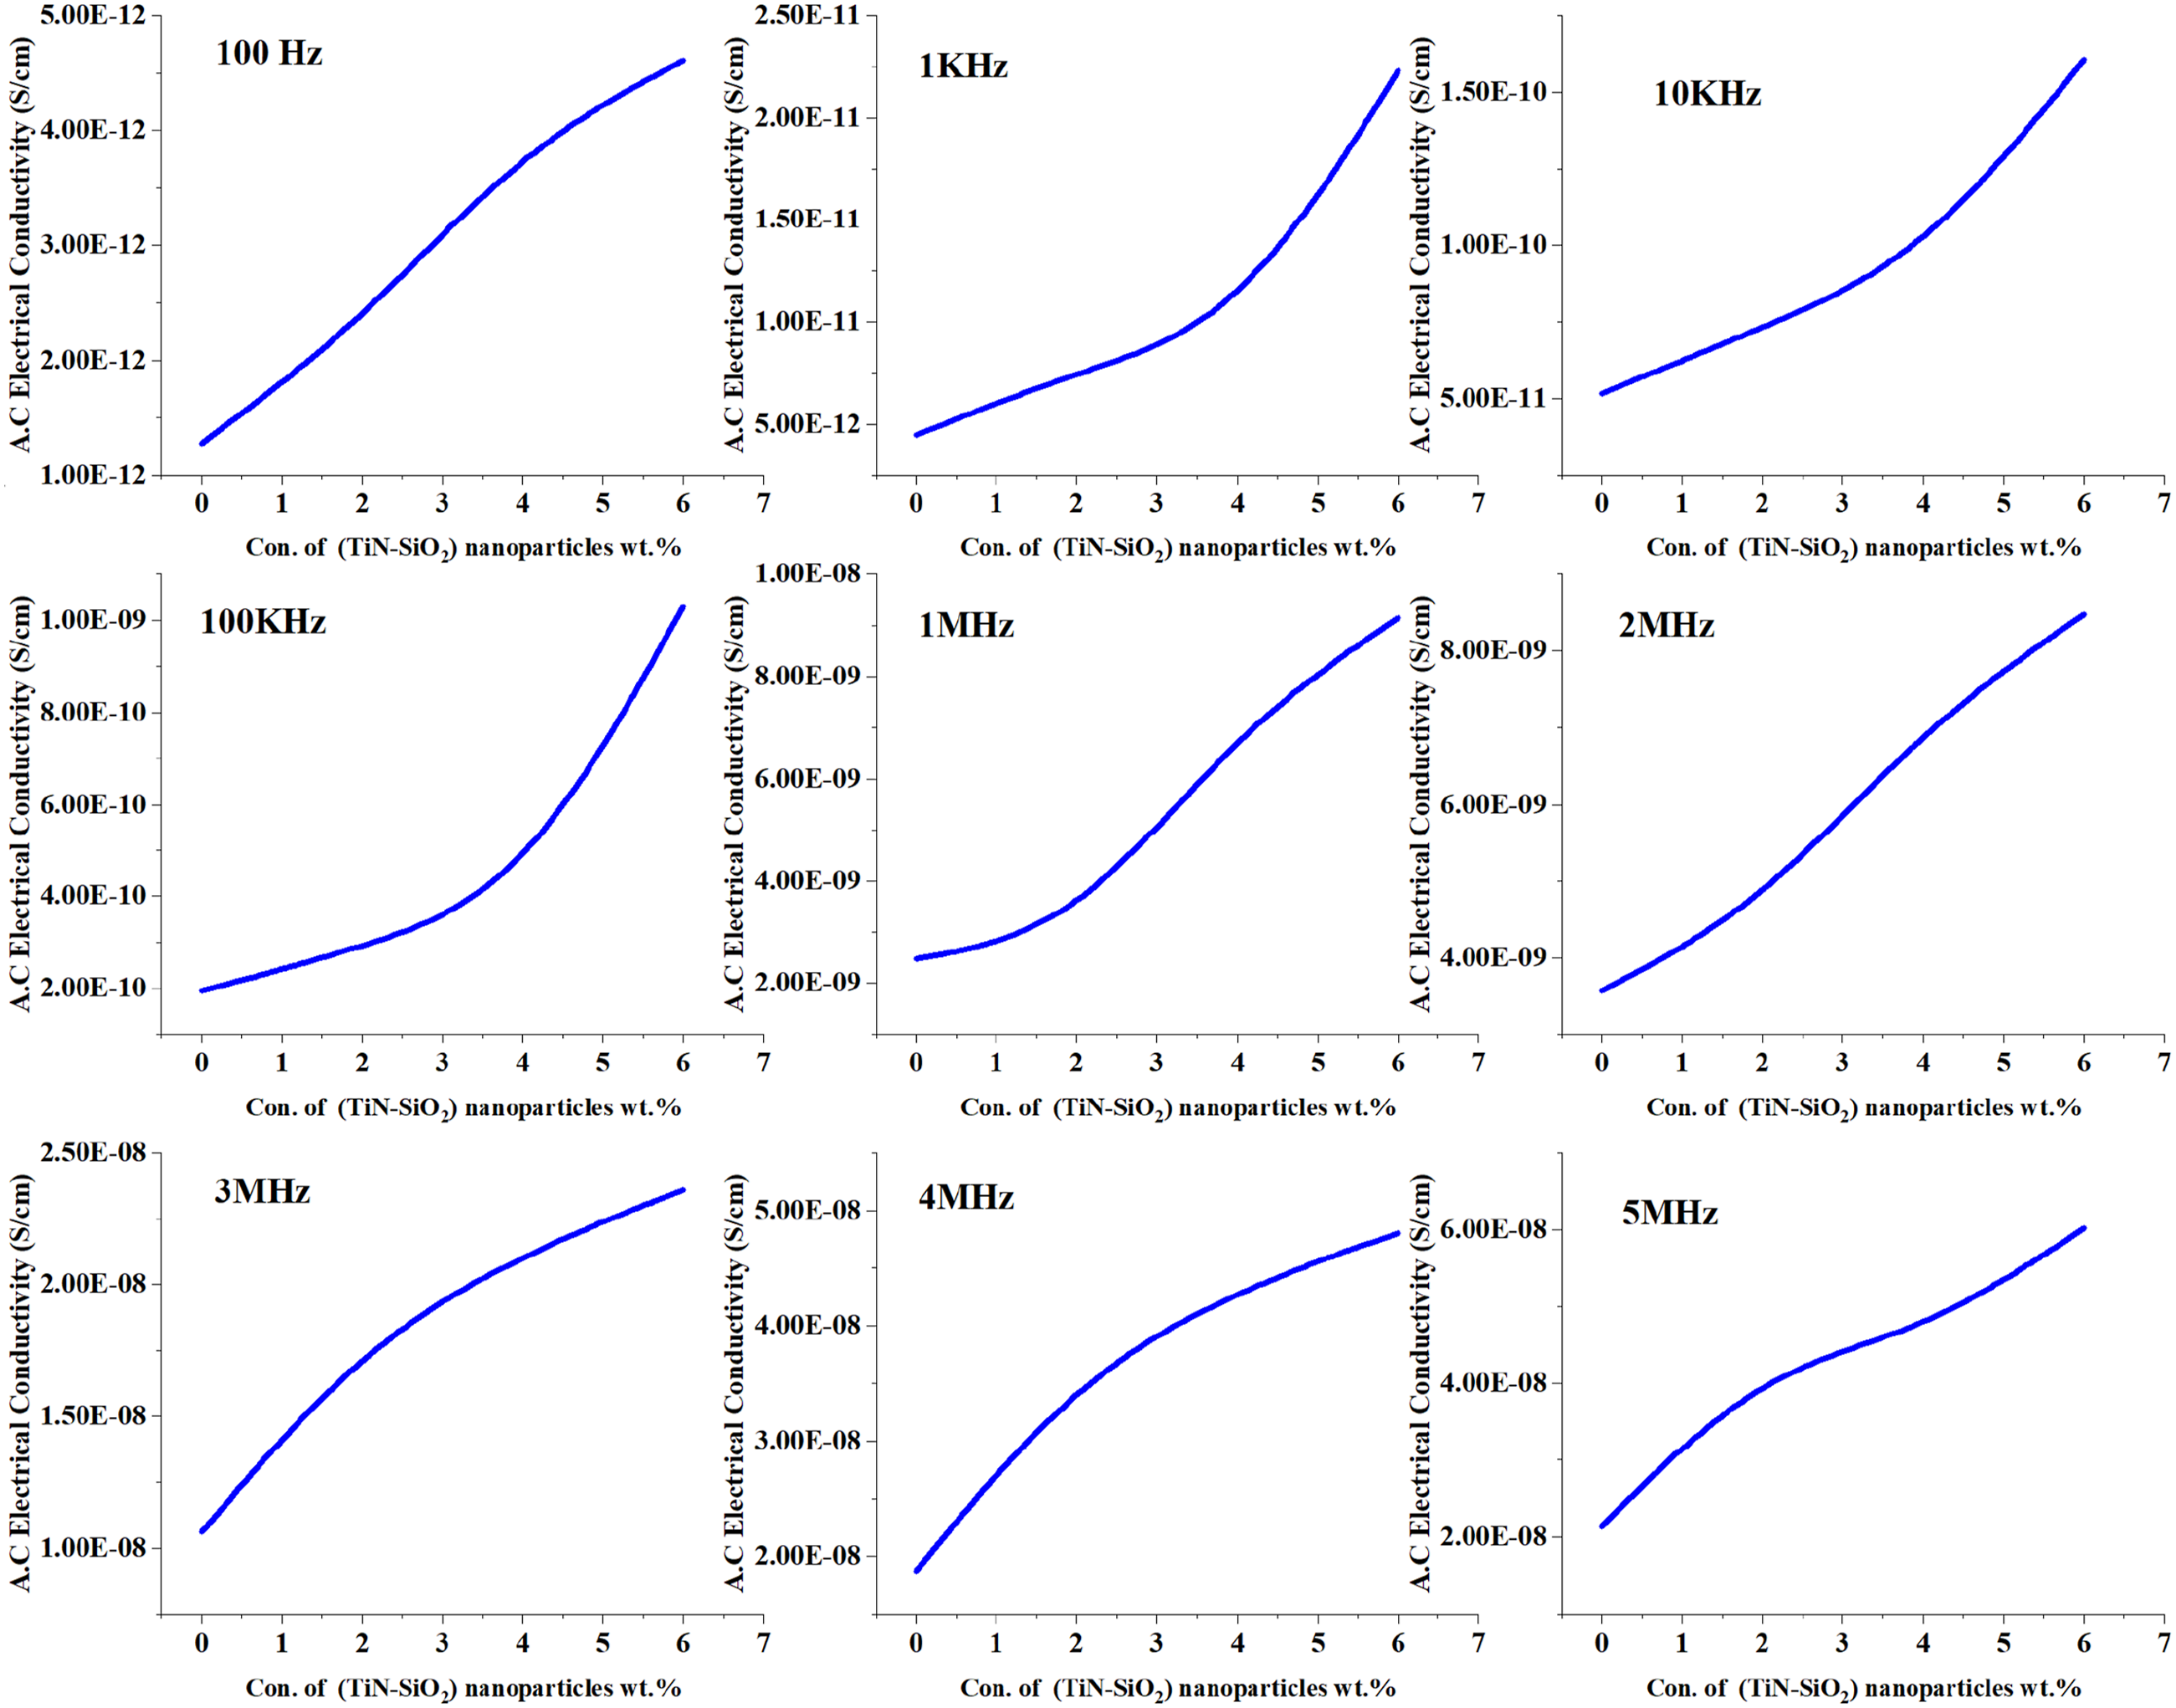
The observed improvement in the electrical and dielectric properties with increasing nanofiller loading is in line with earlier reports on polymer nanocomposites.77,78,79,80,81
Application of (PVA-PVP-TiN-SiO2) NCs for pressure sensors
Figure 22 demonstrates that the parallel capacitance of the PVA-PVP-TiN-SiO2 nanocomposites rises with increasing applied pressure, corresponding to varying TiN-SiO2 weight percentages. This shows that there is a positive relationship between pressure and capacitance, which supports the idea that these films can be used as pressure-sensitive layers. This behavior can be elucidated by positing the existence of areas inside the nanocomposite that possess an intrinsic dipole moment (for instance, crystalline or organized zones). If there is no outside mechanical or electrical stimulation, dipoles stay randomly orientated, which means that the net dipole moment is basically zero. Applying stress can change the local dipole distribution, which creates an electric field inside the sample. The induced field creates attractive forces between the charges at the top and bottom of the specimen. This is shown in experiments as an increase in the measured parallel capacitance.82,83 Variation of parallel capacitance for (PVA-PVP-TiN-SiO2) nanocomposites as a function of pressure.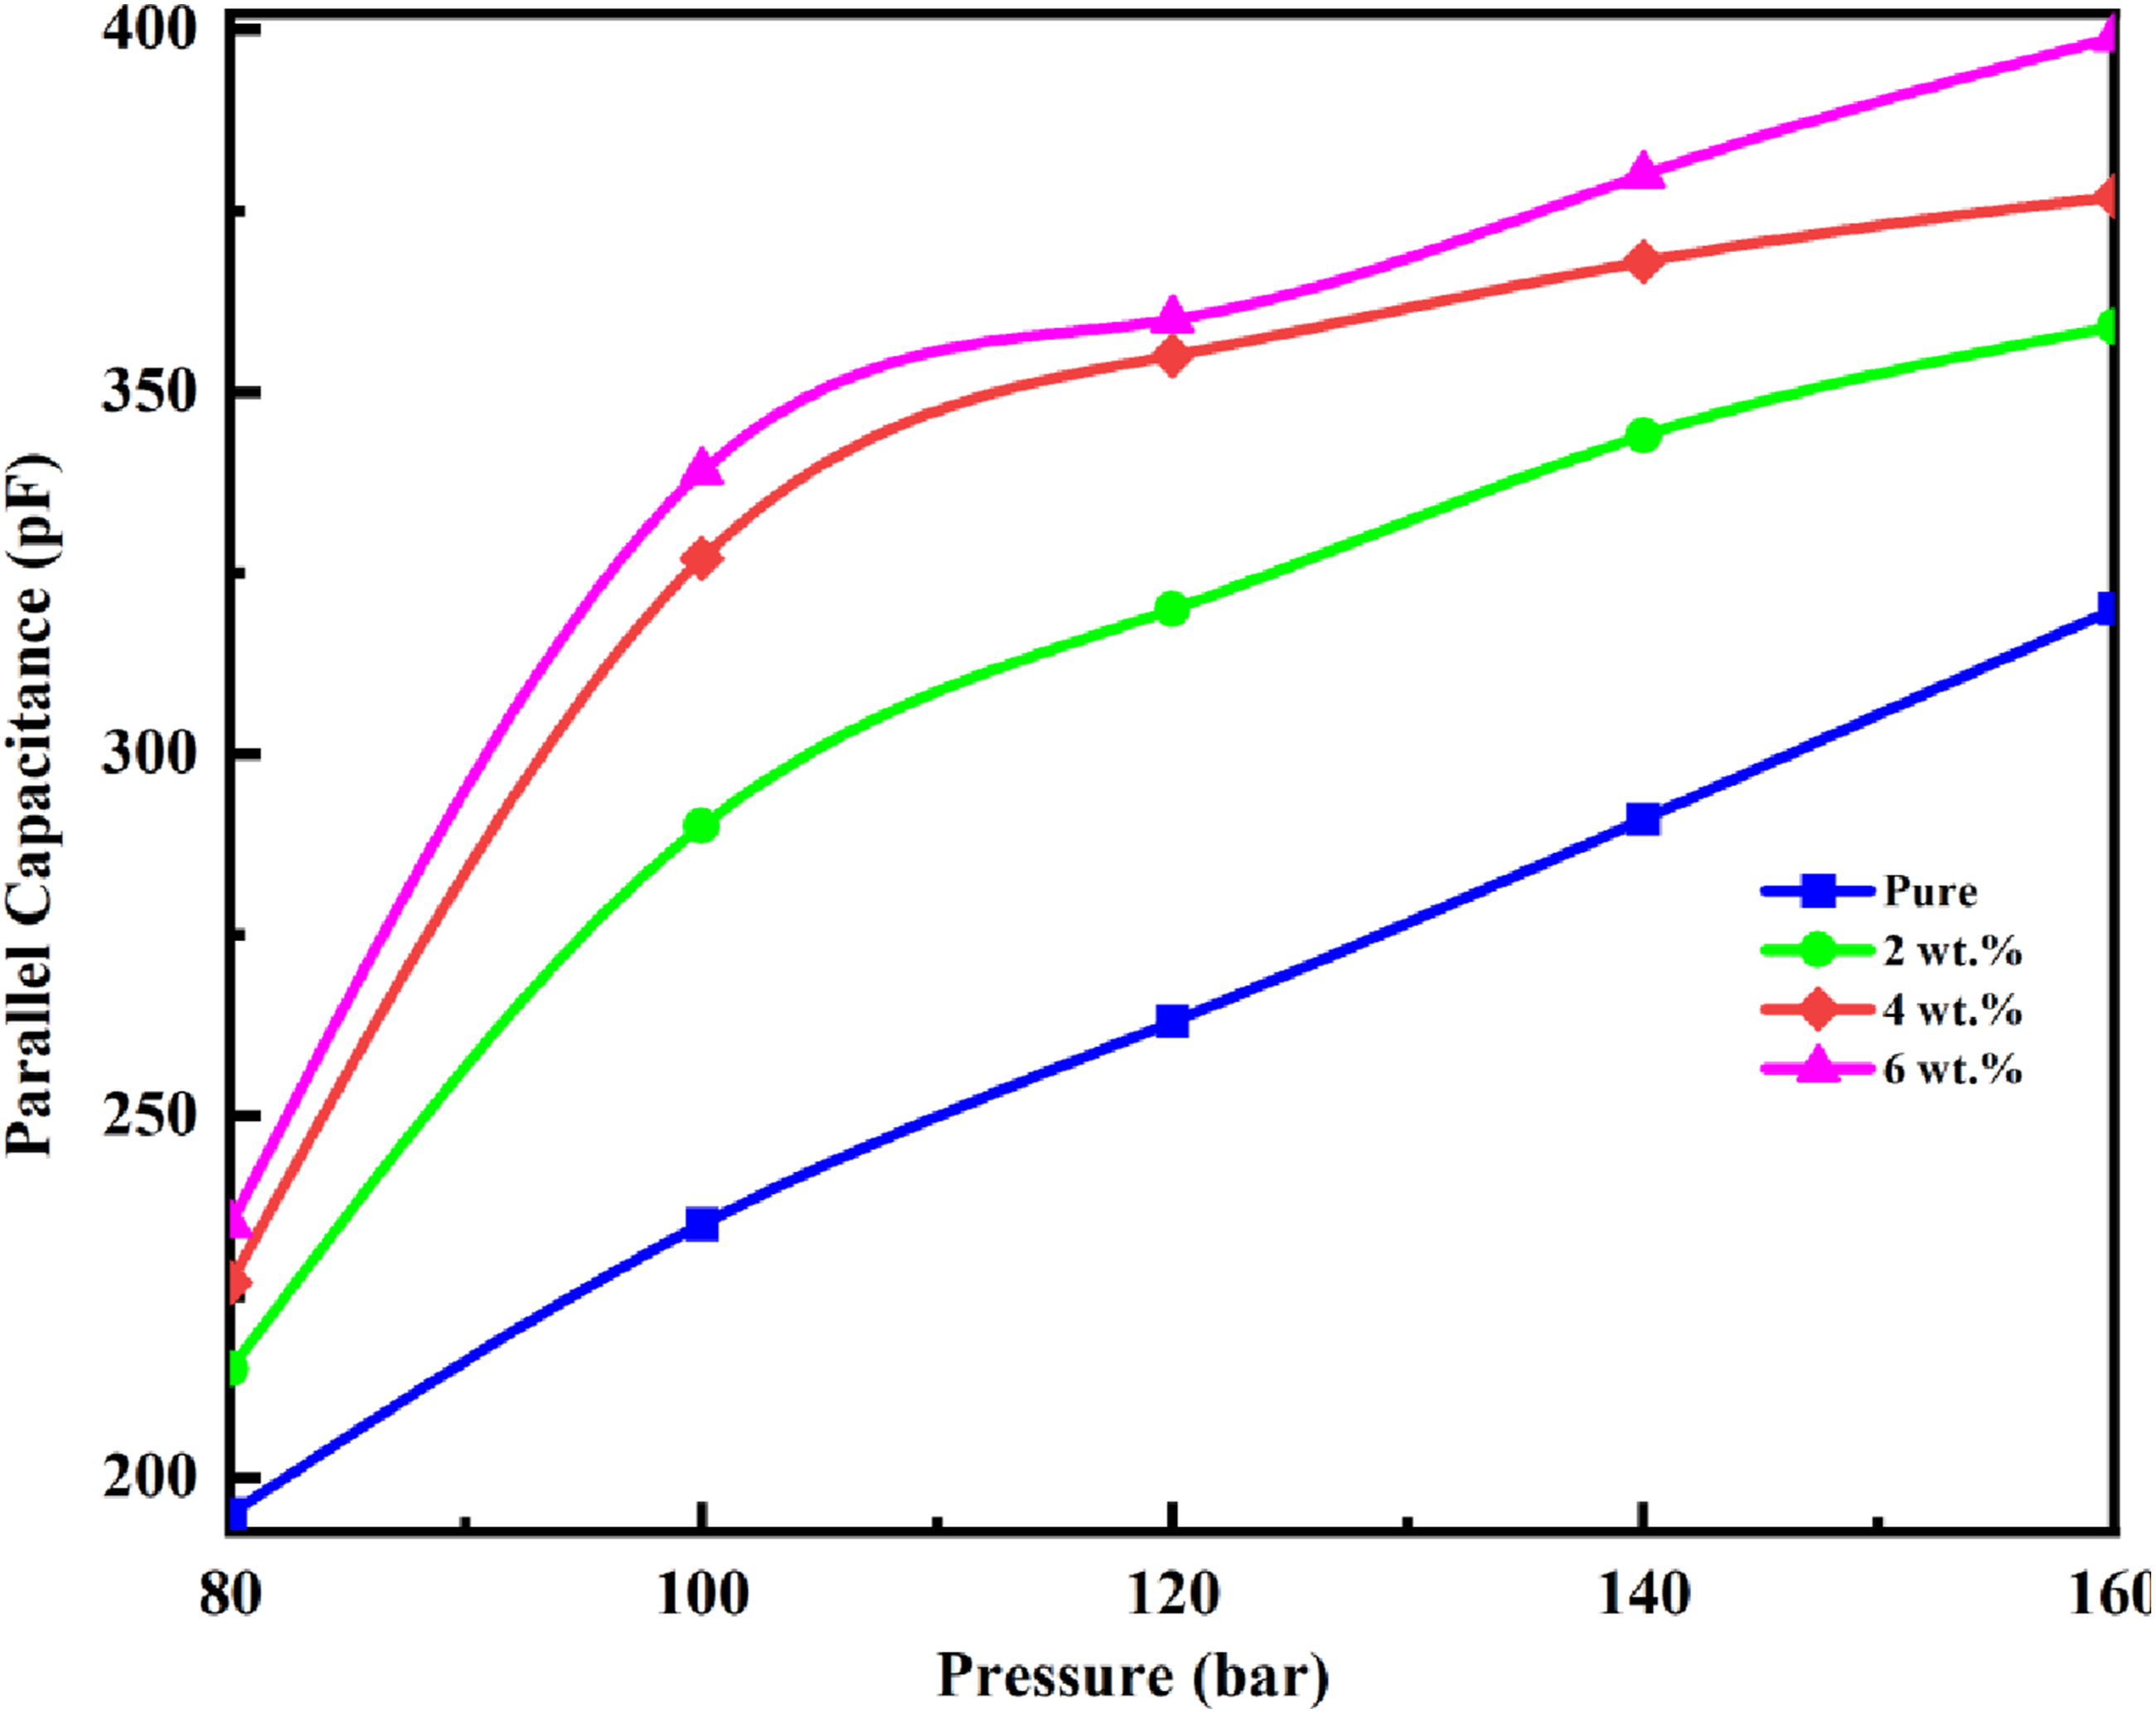
Figure 23 shows that, at an applied pressure of 80 bar, the parallel electrical capacitance Cp of the PVA-PVP-TiN-SiO2 nanocomposites increases as the TiN–SiO2 nanomaterial concentration increases. This indicates a direct concentration–capacitance relationship under fixed mechanical loading. The observed increase in Cp with nanofiller content is attributed to a rise in charge-carrier density within the nanocomposite films as TiN–SiO2 loading increases. In practical terms, adding more nanomaterial promotes more charge storage and polarization pathways in the polymer matrix, which manifests as higher measured capacitance under the same pressure.
84
At 80 bar, the effect of (TiN-SiO2) nanomaterial concentration on the parallel capacitance of (PVA-PVP-TiN-SiO2) nanocomposites.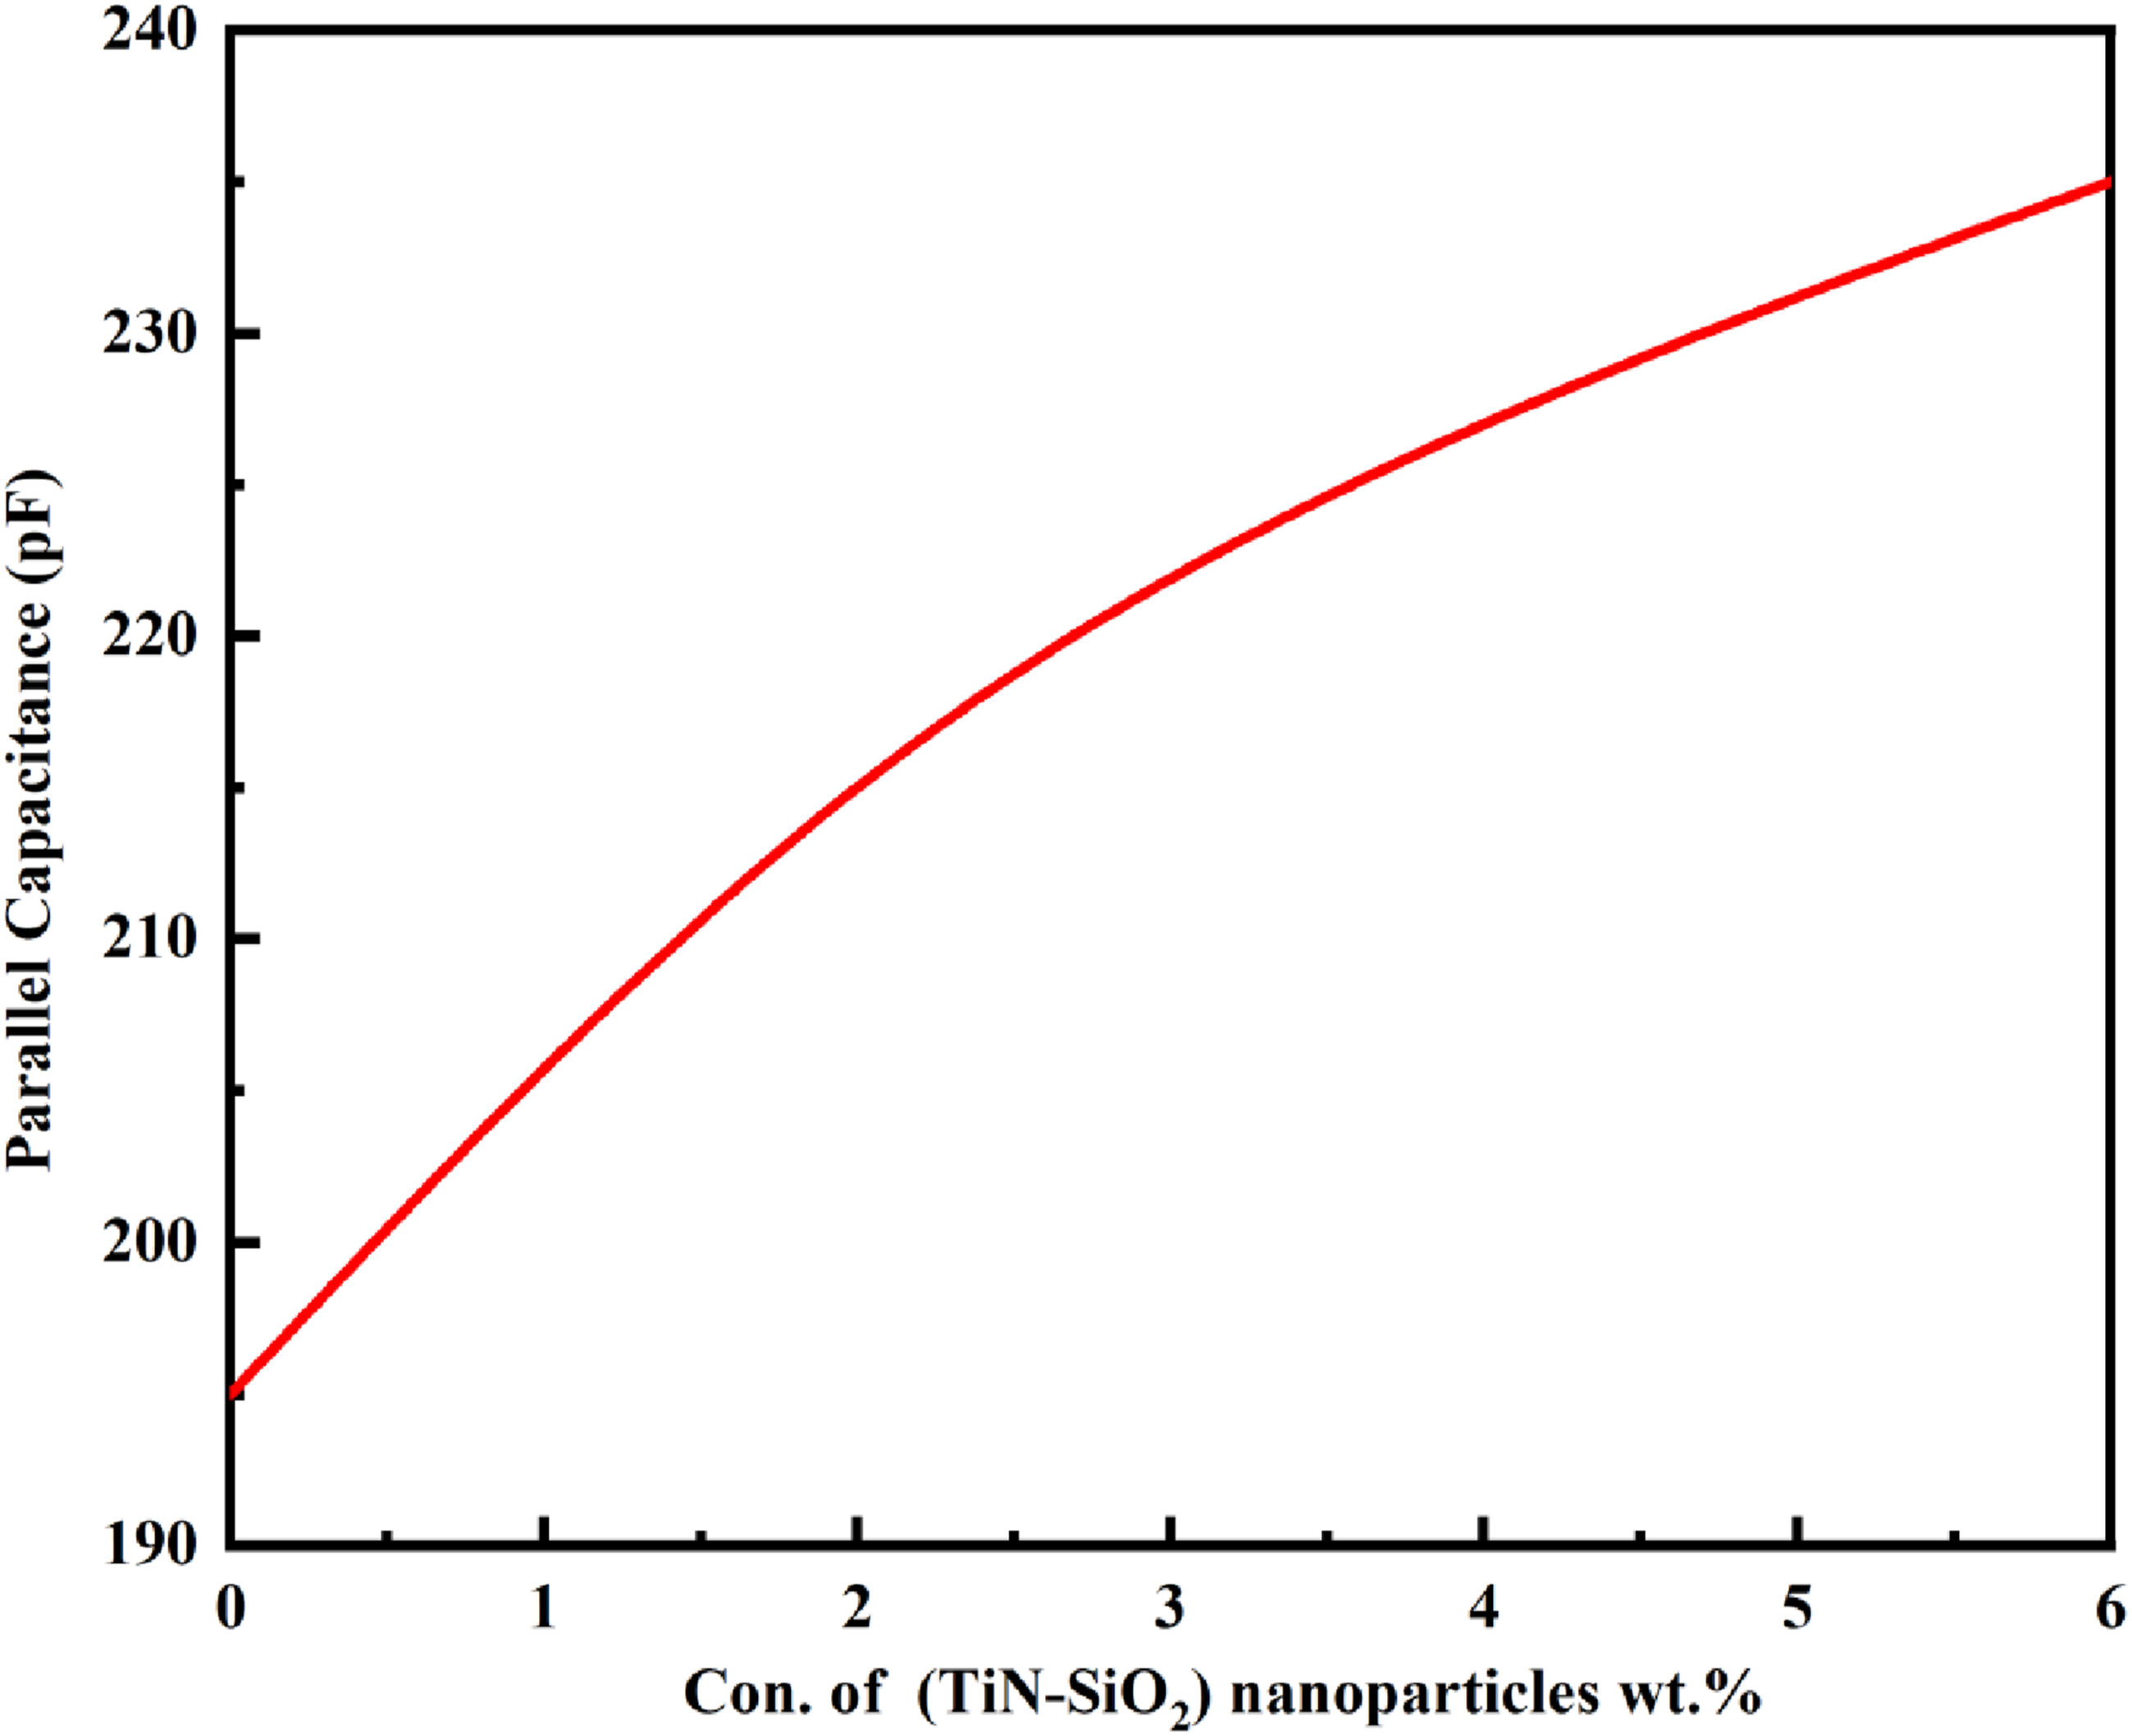
Increasing the concentration of TiN–SiO2 nanomaterial in the sensitive layer noticeably increases the pressure-sensing response of the PVA–PVP–TiN–SiO2 nanocomposite sensors and helps establish the range of useable pressure (force). Figure 24 illustrates a direct relationship between TiN–SiO2 concentration and the electrical capacitance response of the nanocomposites, which serves as the sensitivity indication in the sensor arrangement. The increase in capacitance with higher TiN–SiO2 loading is due to the internal dipole moment contribution in the nanocomposite structure. As the concentration of the nanofiller rises, the composite may have enhanced dipolar/polarization effects when subjected to pressure, manifesting experimentally as an elevated capacitance response (increased sensitivity).
85
The influence of (TiN-SiO2) NMs concentration on sensitivity for (PVA-PVP-TiN-SiO2) NCs.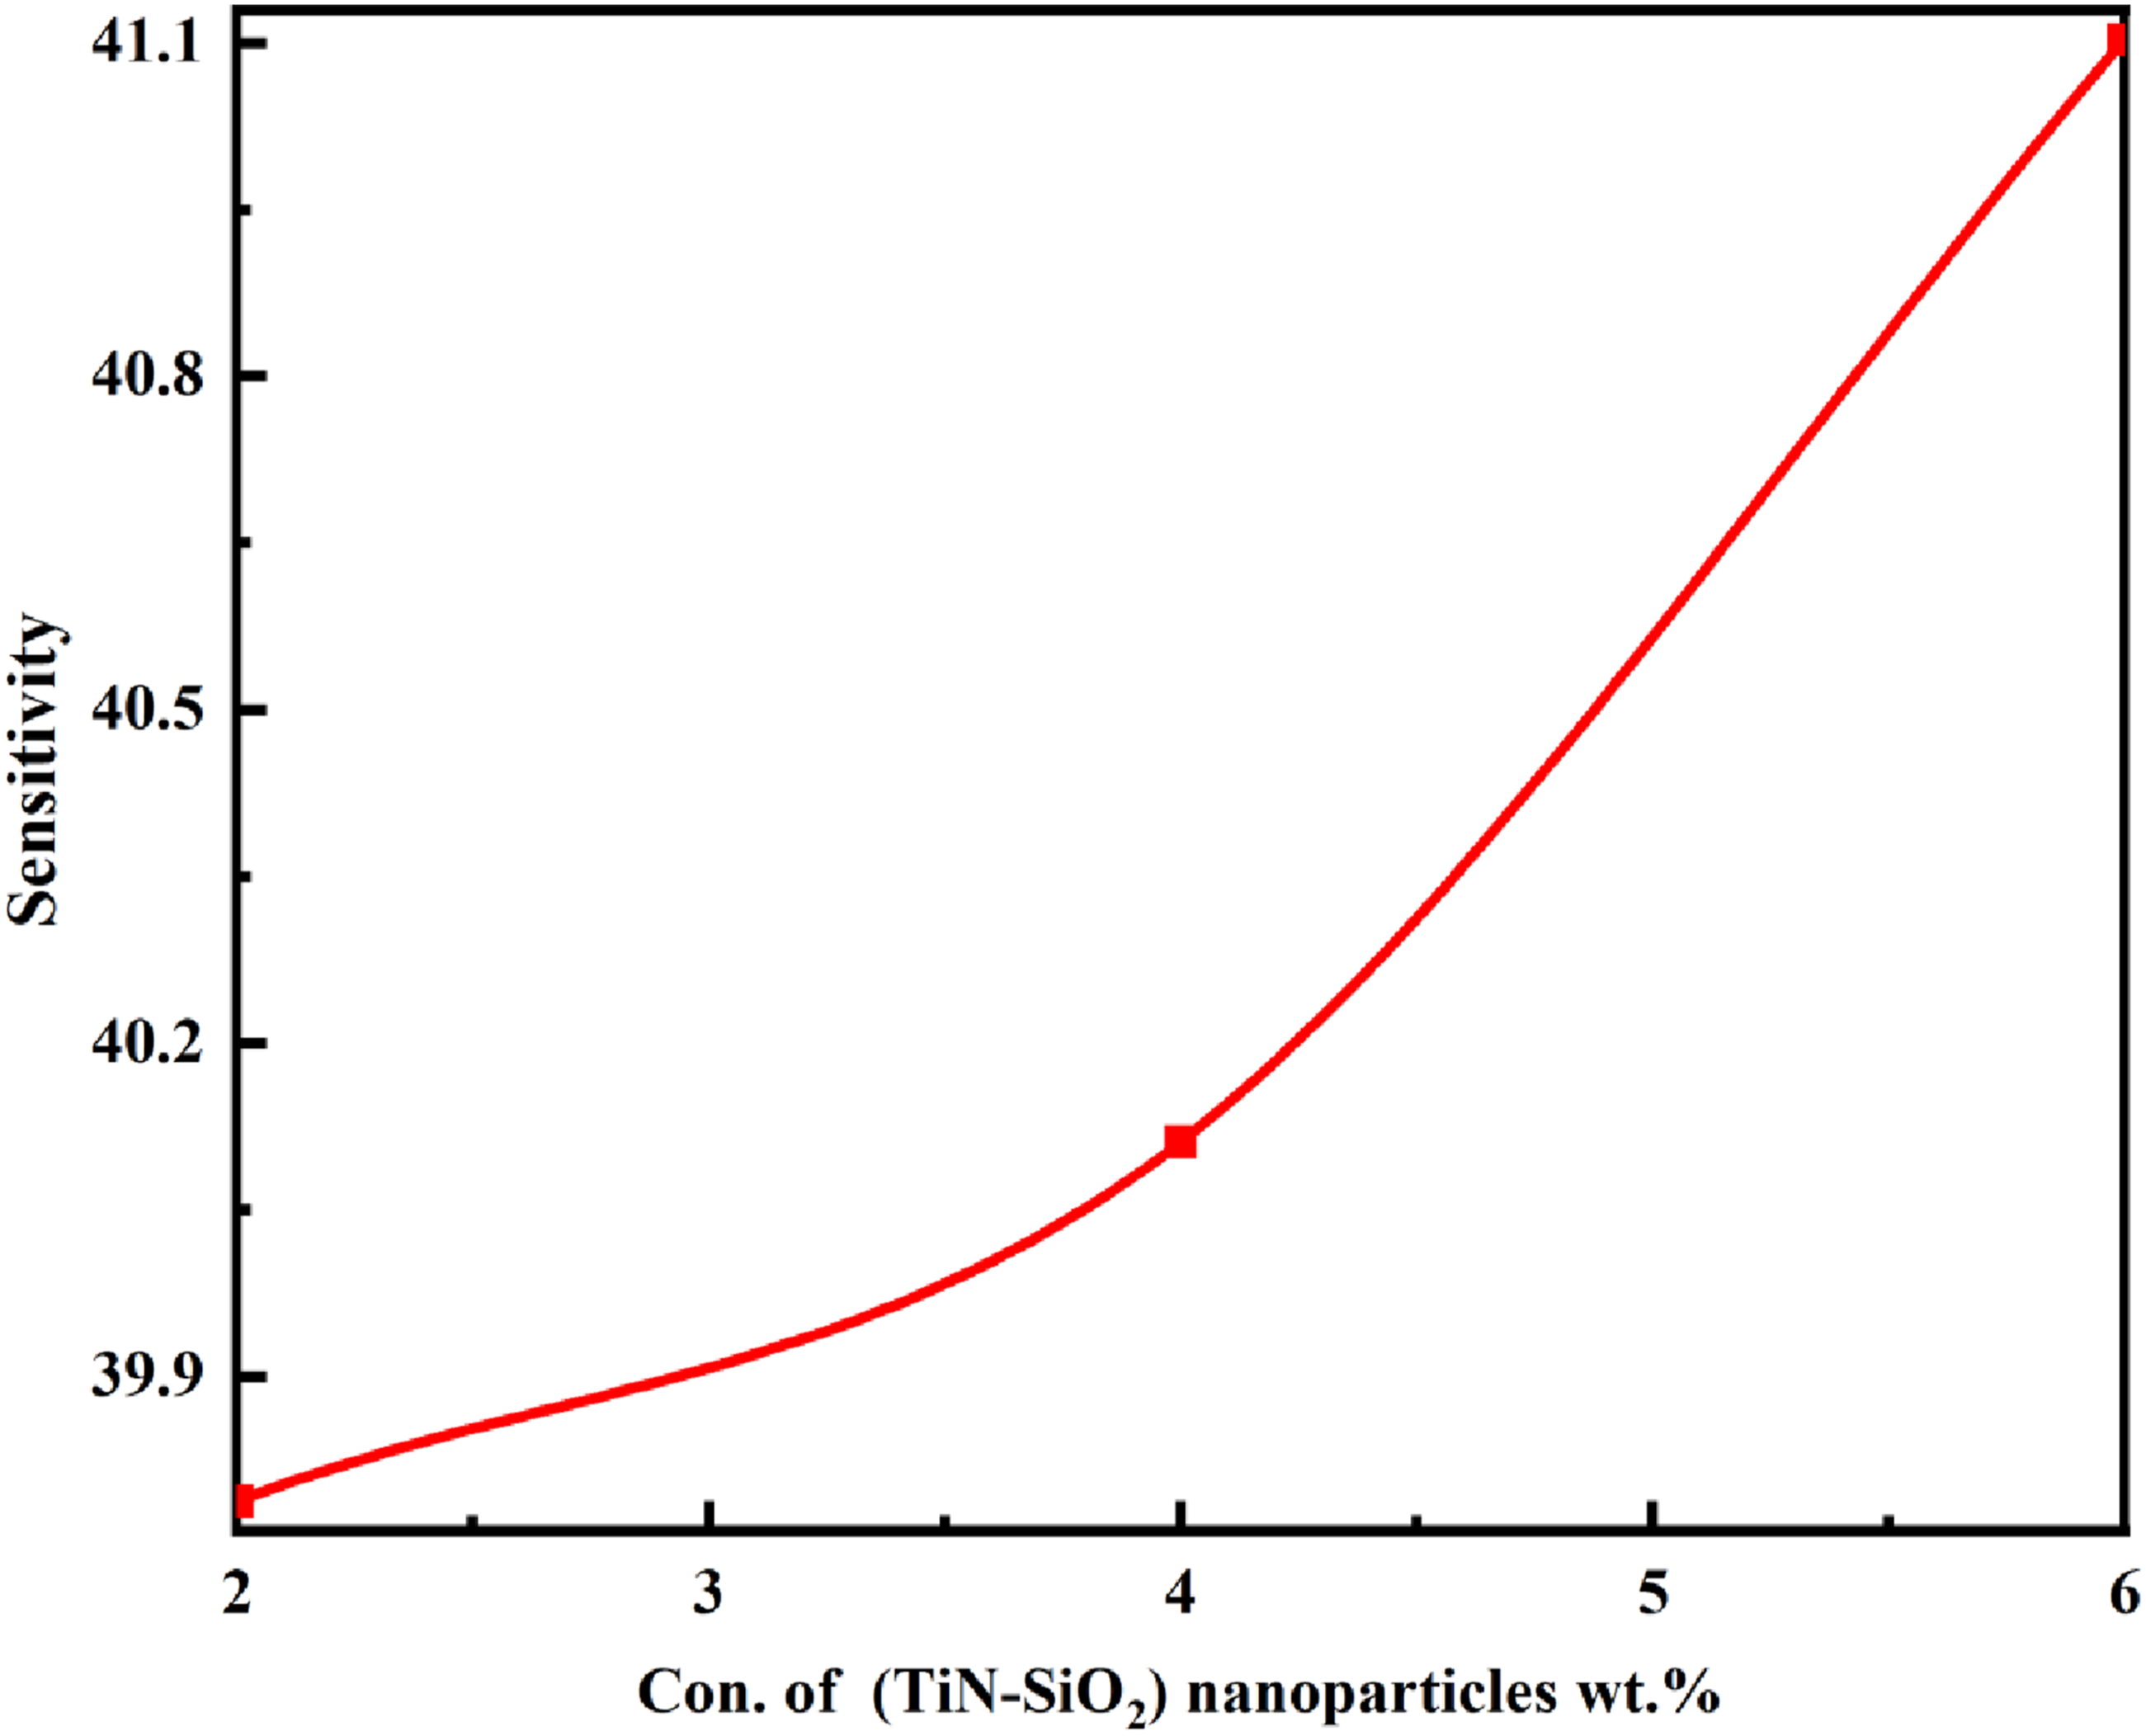
Conclusion
In this work, flexible PVA-PVP-TiN-SiO2 nanocomposite films were successfully fabricated by the solution-casting method and systematically investigated in terms of their structural, optical, dielectric, electrical, and pressure-sensing properties. FTIR analysis confirmed the existence of physical interactions between the polymer blend and the incorporated nanofillers. The optical microscope photos reveal a homogeneous distribution of nanoparticles inside the polymer composite after the addition of (TiN-SiO2) additives, resulting in the formation of a stable and interconnected network. The absorbance and absorption coefficient of nanocomposites comprising PVA-PVP and TiN-SiO2 escalate with increasing nanoparticle concentration in the TiN-SiO2 component. The nonlinear refractive index n2 increases markedly with filler loading, rising from 1.14 × 10⁻¹¹ esu to 7.44 × 10⁻¹¹esu. The nonlinear susceptibility (χ(3)), linear susceptibility (χ(1)), and zero-frequency refractive index (n0) exhibit an increase with the addition of nanoparticles, but dispersion energy (Ed.) and single-oscillator energy (Eoso) show a reduction. At λ = 400 nm, the refractive index increases from 2.07 (neat PVA-PVP) to 2.48 at 6%. The energy gap for both allowed and forbidden indirect transitions was minimized by adding a 6% (TiN-SiO2) nanofiller by weight. The energy gap for permissible transitions decreased from 4.73 to 4.38 electron volts (eV), whereas for forbidden transitions it decreased from 4.44 to 3.80 eV. Furthermore, an increase in the fraction of TiN-SiO2 leads to a reduction in the degree of transmission. The nanocomposites (NCs) composed of Poly (vinyl alcohol) (PVA), Polyvinyl pyrrolidone (PVP), titanium nitride (TiN), and silicon dioxide (SiO2) exhibit remarkable sensitivity to pressure while maintaining a lightweight, flexible, and highly efficient profile.
Footnotes
Acknowledgements
Acknowledgements to University of Babylon.
Author contributions
All authors contributed to the study’s conception and design. Material preparation, data collection and analysis were performed by Majeed Ali Habeeb, Shathar A. Imran Alaamer, Idrees Oreibi, Rehab Shather Abdul Hamza, Fellah Mamoun and Noureddine Elboughdiri. The first draft of the manuscript was written by Majeed Ali Habeeb and all authors commented on previous versions of the manuscript. All authors read and approved the final manuscript.
Declaration of conflicting interests
The authors declared no potential conflicts of interest with respect to the research, authorship, and/or publication of this article.
Funding
The authors received no financial support for the research, authorship, and/or publication of this article.
Ethics considerations
The research is not involving the studies on human or their data.
Data Availability Statement
Available.