
Abstract
In this study, ZnS nanoparticles (NPs) were immobilized on a carbon black/phosphorylated butadiene rubber (CB-PhBR) matrix using the successive ionic layer adsorption and reaction (SILAR) method to develop multifunctional polymer nanocomposites. The novelty of this work lies in the cycle-controlled deposition of ZnS NPs on a conductive, phosphate-functionalized elastomer matrix and the evaluation of the resulting structural, optical, electrical, and dielectric responses. XRD confirmed cubic ZnS formation, while SEM, FTIR, and BET supported its immobilization and the resulting morphological/porous-structure changes. The immobilization of ZnS NPs reduced the electrical conductivity and dielectric permittivity, indicating disruption of the CB percolation network and suppression of interfacial polarization. UV-vis analysis showed an increase in the optical band gap from 2.29 eV for CB-PhBR to 3.82 eV for ZnS NPs/CB-PhBR. These results demonstrate that SILAR-assisted immobilization of ZnS NPs effectively modifies the functional properties of CB-PhBR-based nanocomposites, indicating their potential for dielectric, optoelectronic, and functional polymer applications.
Keywords
Introduction
Metal sulfide nanoparticles (MeS NPs) exhibit size-dependent electrical, optical, and photoelectric properties that make them attractive for optoelectronic, sensing, energy-conversion, and functional composite applications.1,2 Among them, zinc sulfide (ZnS) NPs are especially important because ZnS is a wide-band-gap II–VI semiconductor with chemical stability, low toxicity, and potential use in light-emitting devices, sensors, photocatalysis, solar cells, batteries, and other functional systems.3,4,5,6,7 ZnS-based polymer nanocomposites have therefore been investigated using different matrices and processing routes to obtain materials with tunable optical, electrical, dielectric, photocatalytic, mechanical, antimicrobial and shielding properties.8,9,10,11,12,13,14,15 However, in elastomeric matrices, the controlled incorporation of ZnS NPs remains challenging because nanoparticle agglomeration, weak interfacial interactions, and nonuniform filler distribution can limit reproducibility and functional performance.
Previous studies on ZnS-containing elastomer nanocomposites have mainly focused on the incorporation of pre-synthesized ZnS NPs into rubber matrices by conventional compounding or mixing methods.
Ramesan and co-workers prepared ZnS-reinforced acrylonitrile butadiene rubber (NBR) nanocomposites and showed that the cure characteristics and mechanical properties depended strongly on ZnS content, with improved tensile and tear strength up to an optimum loading and deterioration at higher loading due to filler-related limitations. 16 Jasna et al. investigated ZnS NPs-reinforced chlorinated styrene-butadiene rubber (Cl-SBR) and reported changes in crystallinity, morphology, curing characteristics, glass transition temperature, mechanical properties, solvent transport, and electrical behavior. 17 These studies confirmed the reinforcing ability of ZnS NPs in elastomers, but they also highlighted the importance of nanoparticle dispersion and interfacial interaction. In particular, higher ZnS loading may lead to aggregation, weaker polymer–filler interaction, and reduced reinforcement efficiency.17,18,19,20 Related studies on rubber-based systems also show that crosslink-network architecture, filler distribution, surface treatment, and interfacial design strongly affect the final performance of elastomer composites.21,22,23,24 Despite these advances, the number of studies dealing with ZnS-based elastomer nanocomposites remains limited, and the controlled immobilization of ZnS NPs on a functional carbon black/phosphorylated butadiene rubber (CB-PhBR) matrix has not been sufficiently addressed. Most previous ZnS/rubber systems relied on direct mixing of pre-formed ZnS NPs into the elastomer phase. In contrast, immobilizing ZnS NPs at CB-rich and phosphate-functionalized regions may provide a more controlled route to regulate nanoparticle distribution, interfacial contact, and CB network continuity. This approach is particularly relevant for tuning percolation-related electrical and dielectric responses in rubber-based nanocomposites.
CB-PhBR is a promising host matrix for this purpose. 25 CB can form a conductive and reinforcing filler network, and its loading has been shown to strongly affect the mechanical, rheological, and cure behavior of rubber blends, 26 while phosphorus-containing groups in phosphorylated butadiene rubber may serve as active sites for metal-ion binding and nanoparticle deposition. We hypothesize that the successive ionic layer adsorption and reaction (SILAR) method can enable cycle-controlled immobilization of ZnS NPs within the CB-PhBR matrix, especially at CB-rich and phosphate-functionalized sites. Such immobilization is expected to reduce uncontrolled ZnS aggregation, disturb the CB percolation pathway, and tune the optical, electrical, and dielectric responses of the elastomer nanocomposite.
In this work, ZnS NPs were generated and immobilized on a previously developed CB-PhBR matrix using a three-cycle SILAR approach. During each SILAR cycle, the CB-PhBR specimen was alternately exposed to Zn2+ and S2- precursor solutions with intermediate rinsing and drying steps, enabling controlled ZnS deposition. The resulting ZnS NPs/CB-PhBR nanocomposite was characterized by FTIR, XRD, UV-vis spectroscopy, SEM, BET analysis, and impedance/capacitance measurements. The novelty of this study lies in using CB-PhBR not only as a rubber-based composite matrix but also as a functional support for ZnS NPs immobilization to regulate microstructure, CB network continuity, and optical/electrical/dielectric behavior.
Materials and Methods
Materials
BR was purchased from the Voronezh Synthetic Rubber Plant (Russia). Carbon black (CB P-234) was obtained from an industrial source. Phosphorus trichloride (PCl3), carbon tetrachloride (CCl4), sulfuric acid (H2SO4), zinc chloride (ZnCl2), and sodium sulfide nonahydrate (Na2S·9H2O) were of analytical grade and used as received. Deionized water was used for solution preparation.
Methods
Preparation of the CB-PhBR
The CB-PhBR composite matrix was prepared as described in our previous work. 25 In the present study, the previously developed CB-PhBR matrix was used as the host/support for immobilizing ZnS NPs.
Preparation of ZnS NPs by the Chemical Precipitation Method
Na2S·9H2O (2.4 g) and ZnCl2 (1.36 g) were each dissolved in deionized water to obtain 100 mL stock solutions. For ZnS precipitation, 20 mL of each solution was mixed, yielding a white ZnS hydrosol. The suspension was left to settle for 24 h, after which the supernatant was decanted. The precipitate was washed repeatedly with distilled water until the pH was neutral, then dried at room temperature.
Preparation of ZnS NPs/CB-PhBR Polymer Nanocomposite
ZnS NPs were generated and immobilized within the CB-PhBR composite using the SILAR method 27 with 0.1 M aqueous ZnCl2 and Na2S solutions. One SILAR cycle consisted of (a) Zn2+ adsorption by immersing the composite in ZnCl2 solution, followed by rinsing and drying, and (b) conversion to ZnS by immersing the Zn2+-loaded composite in Na2S solution, followed by rinsing and drying. Briefly, 0.10 g of CB-PhBR was immersed in 10 mL of 0.1 M ZnCl2 for 24 h, rinsed with distilled water, and dried at room temperature. The specimen was then immersed in 10 mL of 0.1 M Na2S for 24 h to form ZnS, rinsed, and dried. The relatively long immersion time was selected considering the bulk and porous nature of the CB-PhBR elastomer matrix. Unlike conventional flat thin-film SILAR substrates, where short dipping times are generally sufficient, CB-PhBR contains CB-rich domains and phosphorus-containing functional groups, and therefore ion diffusion, Zn2+ uptake/coordination, and subsequent reaction with S2- require longer contact times. Prolonged immersion steps have also been reported for formation of MeS NPs in functionalized rubber matrices containing phosphorus-containing acid groups,21,28,29 while conventional ZnS thin-film SILAR studies commonly use relatively shorter immersion times because of the flat and readily accessible substrate surface (soda lime glass and on indium tin oxide covered glass). 30 Thus, the 24 h immersion time was chosen to promote sufficient penetration of precursor ions into the CB-PhBR matrix and more effective formation of immobilized ZnS NPs rather than only rapid surface precipitation. The cycle was repeated three times to obtain multilayer deposition of ZnS NPs within the CB-PhBR system.
Characterization
UV-vis spectra were recorded using a Specord 210 Plus spectrophotometer (Analytik Jena, Germany) in the 190-800 nm range. X-ray diffraction (XRD) patterns were collected on a Rigaku MiniFlex 600 diffractometer with Ni-filtered Cu Kα radiation over 2θ = 10°-90°. ATR-FTIR spectra were acquired on a PerkinElmer Spectrum 100 instrument (400-4000 cm−1, 4 cm−1 resolution, 4 scans) by clamping neat samples directly onto the ATR crystal. BET surface-area measurements were performed using a Gemini VII 2390 (Micromeritics) surface-area analyzer. For electrical and dielectric measurements, PVA-based thin films were prepared by solution casting. CB-PhBR or ZnS NPs/CB-PhBR was dispersed in 20 mL of 2 wt% aqueous PVA solution to obtain a homogeneous suspension. The suspension was poured into a Petri dish and dried by solvent evaporation at room temperature and then further dried in a vacuum oven. The resulting PVA + CB-PhBR and PVA + ZnS NPs/CB-PhBR films had thicknesses of approximately 70 and 130 μm, respectively. Measurements were performed at 25°C using an LCR meter (E7-20; MNIPI, Belarus), and each experiment was repeated three times. The frequency window is reported in terms of log10(ω) to match the data presentation (log10(ω) = 2.9-6.8). SEM micrographs were recorded on a Zeiss Gemini 500 (Carl Zeiss SMT AG, Jena, Germany) after ∼5 nm Au coating.
Results and Discussion
Structure Analysis
UV-vis Analysis
Figure 1 shows the comparative UV-vis spectra of ZnS NPs, CB-PhBR, and ZnS NPs/CB-PhBR. The broad absorption spectrum of CB-PhBR in the UV-vis region suggests significant intermolecular interactions between CB and PhBR, as discussed in our previous work.
25
In contrast, ZnS NPs show a distinct absorption band centered at 313 nm.
31
This absorption edge is blue-shifted compared with bulk ZnS, indicating the nanoscale character of the synthesized ZnS NPs and the presence of quantum confinement effects.31,32,33 UV-vis spectra of ZnS NPs, CB-PhBR, and ZnS NPs/CB-PhBR nanocomposite.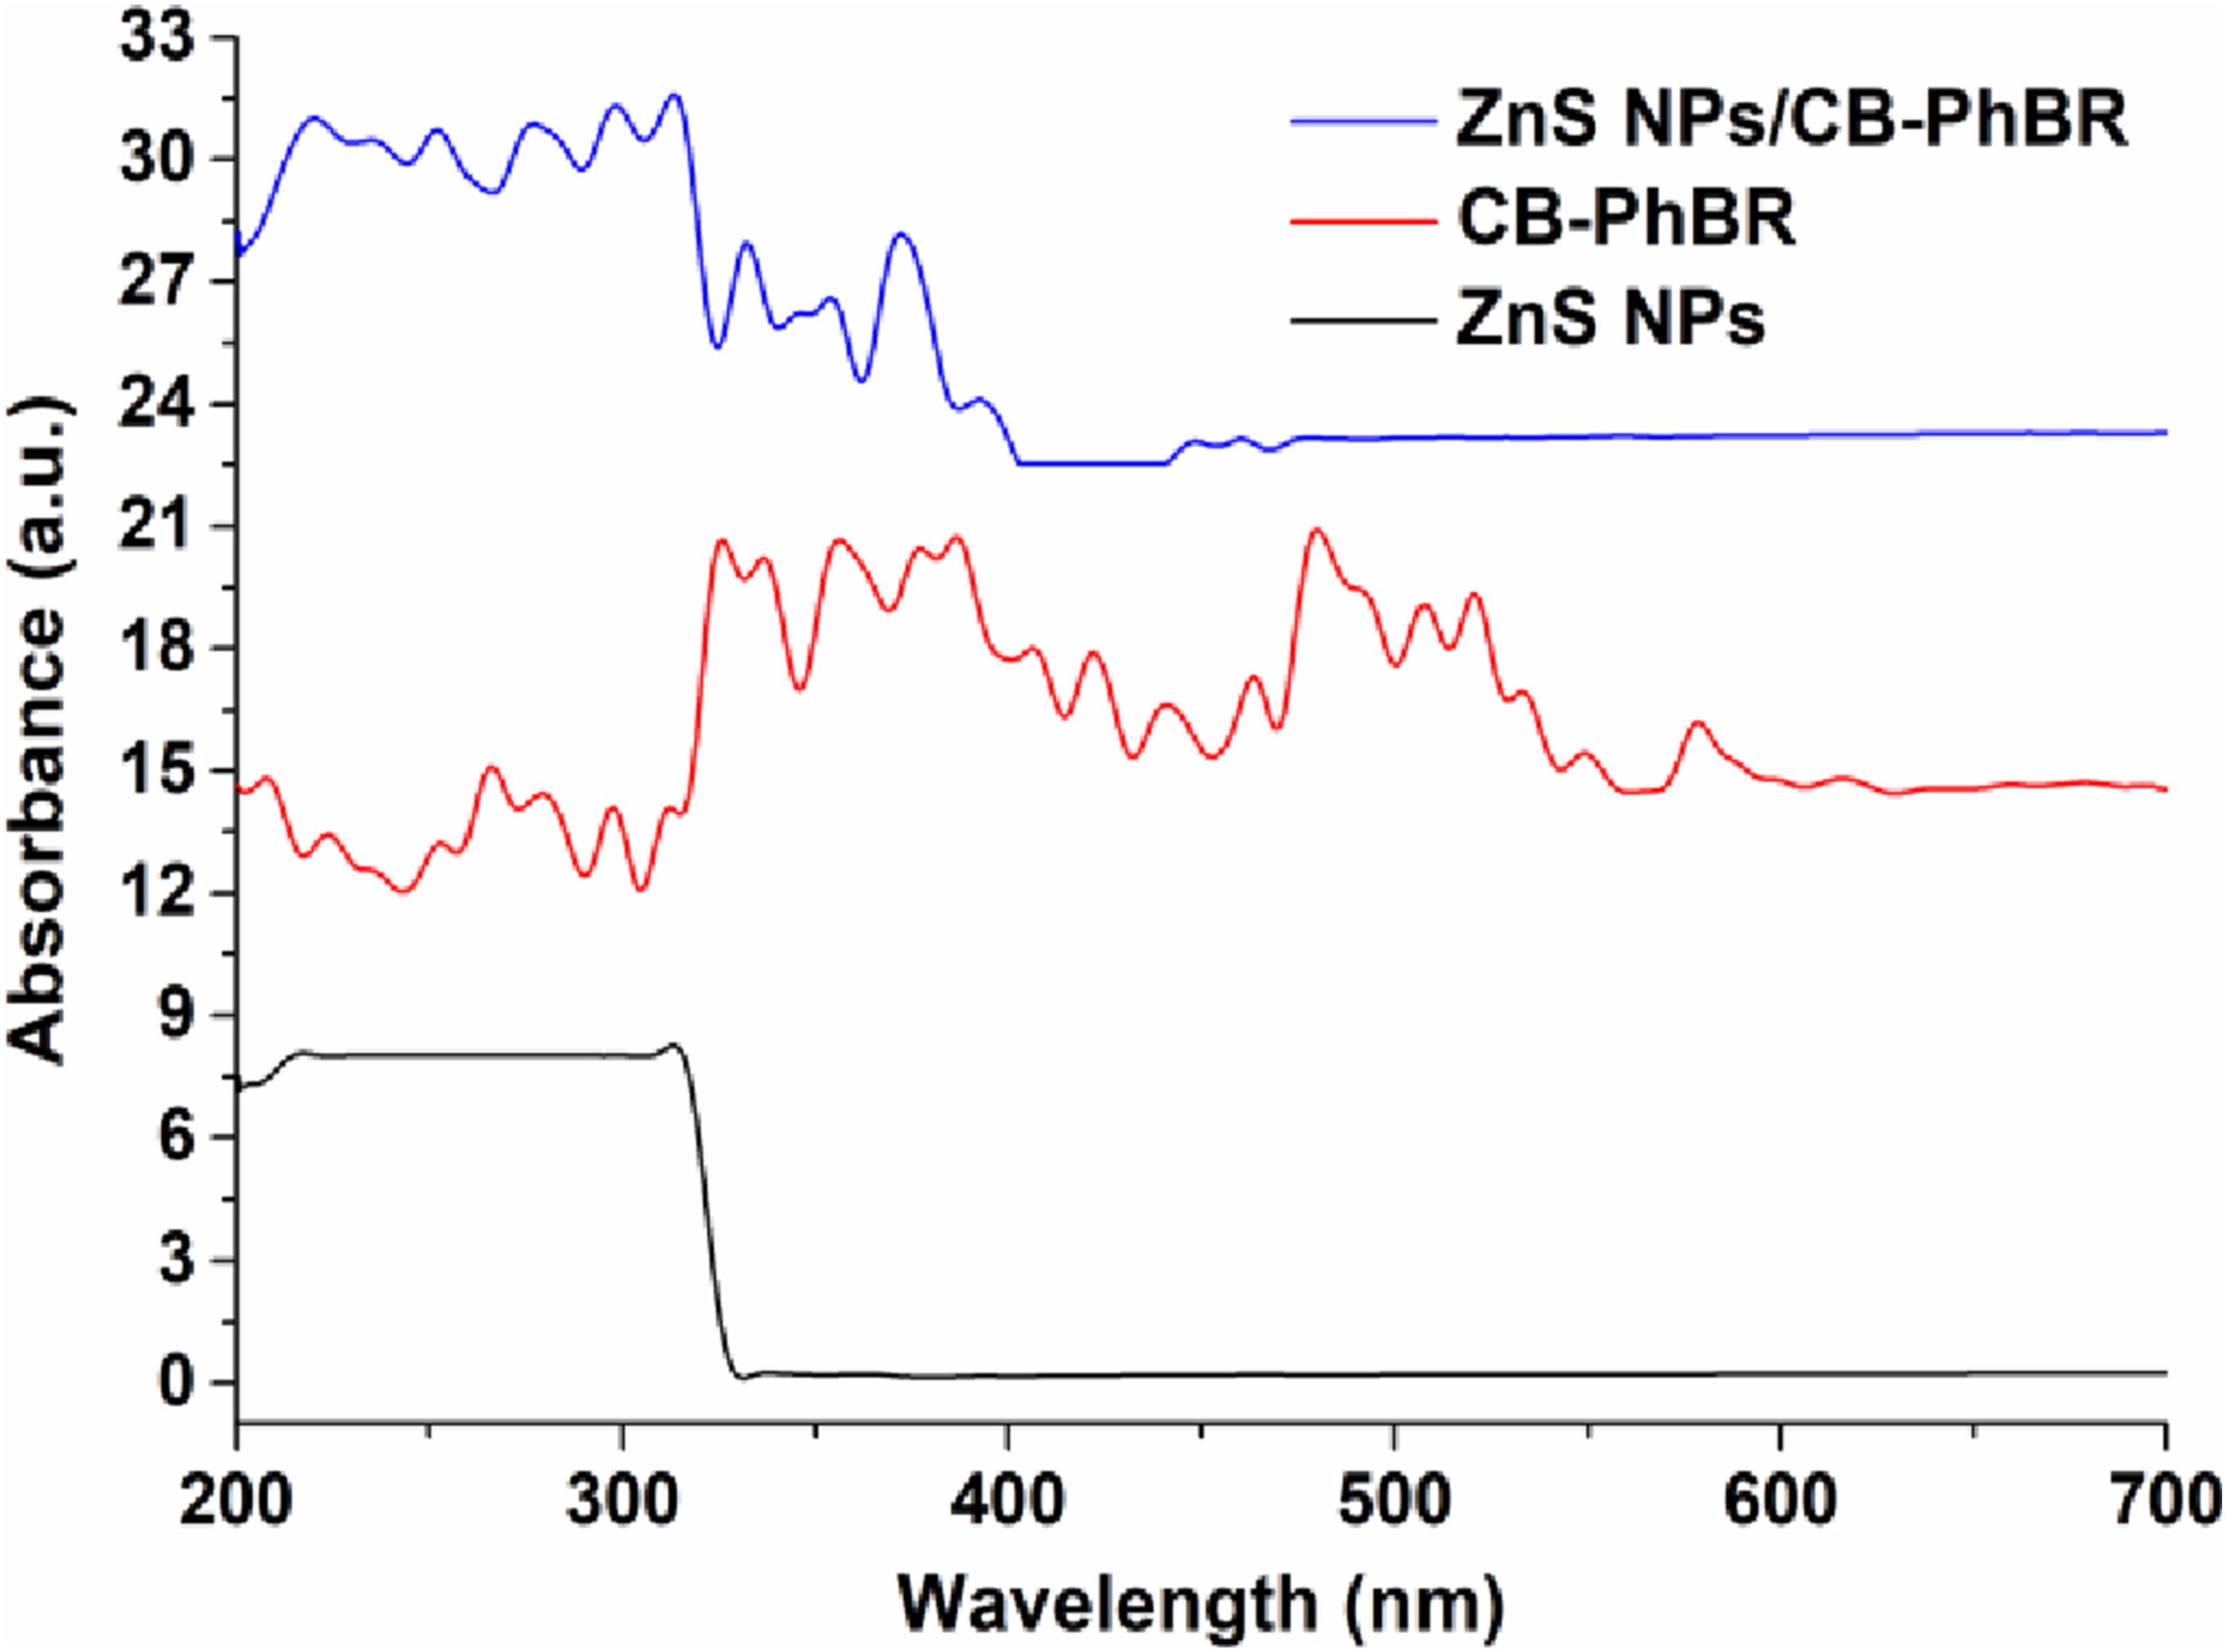
The spectra of the ZnS NPs/CB-PhBR nanocomposite exhibit a notable shift toward the UV region compared with CB-PhBR. This change suggests the successful immobilization of ZnS NPs within the CB-PhBR matrix and confirms that ZnS deposition modifies the optical response of the composite. The slight difference between free ZnS NPs and ZnS NPs/CB-PhBR may be related to interfacial interactions among ZnS NPs, phosphorus-containing groups, and the CB-containing polymer network. 34 A similar phenomenon was observed in the ZnS/reduced graphite oxide composite. 35
Using the Tauc equation,
36
the plots of the (αhν)2 versus hν for direct band gap calculation are presented in Figure 2, while the plots of the (αhν)1/2 versus hν for indirect band gap calculation are shown in Figure S1. The absorption coefficient (α) was calculated using α = 2.303 A/d, where A is the absorbance and d is the sample thickness. The obtained results are summarized in Table 1. Direct band gap calculations of Eg according to Tauc plots of ZnS NPs and ZnS NPs/CB-PhBR. Direct and indirect optical band gaps of ZnS NPs, CB-PhBR, and ZnS NPs/CB-PhBR. aValue taken from
25
.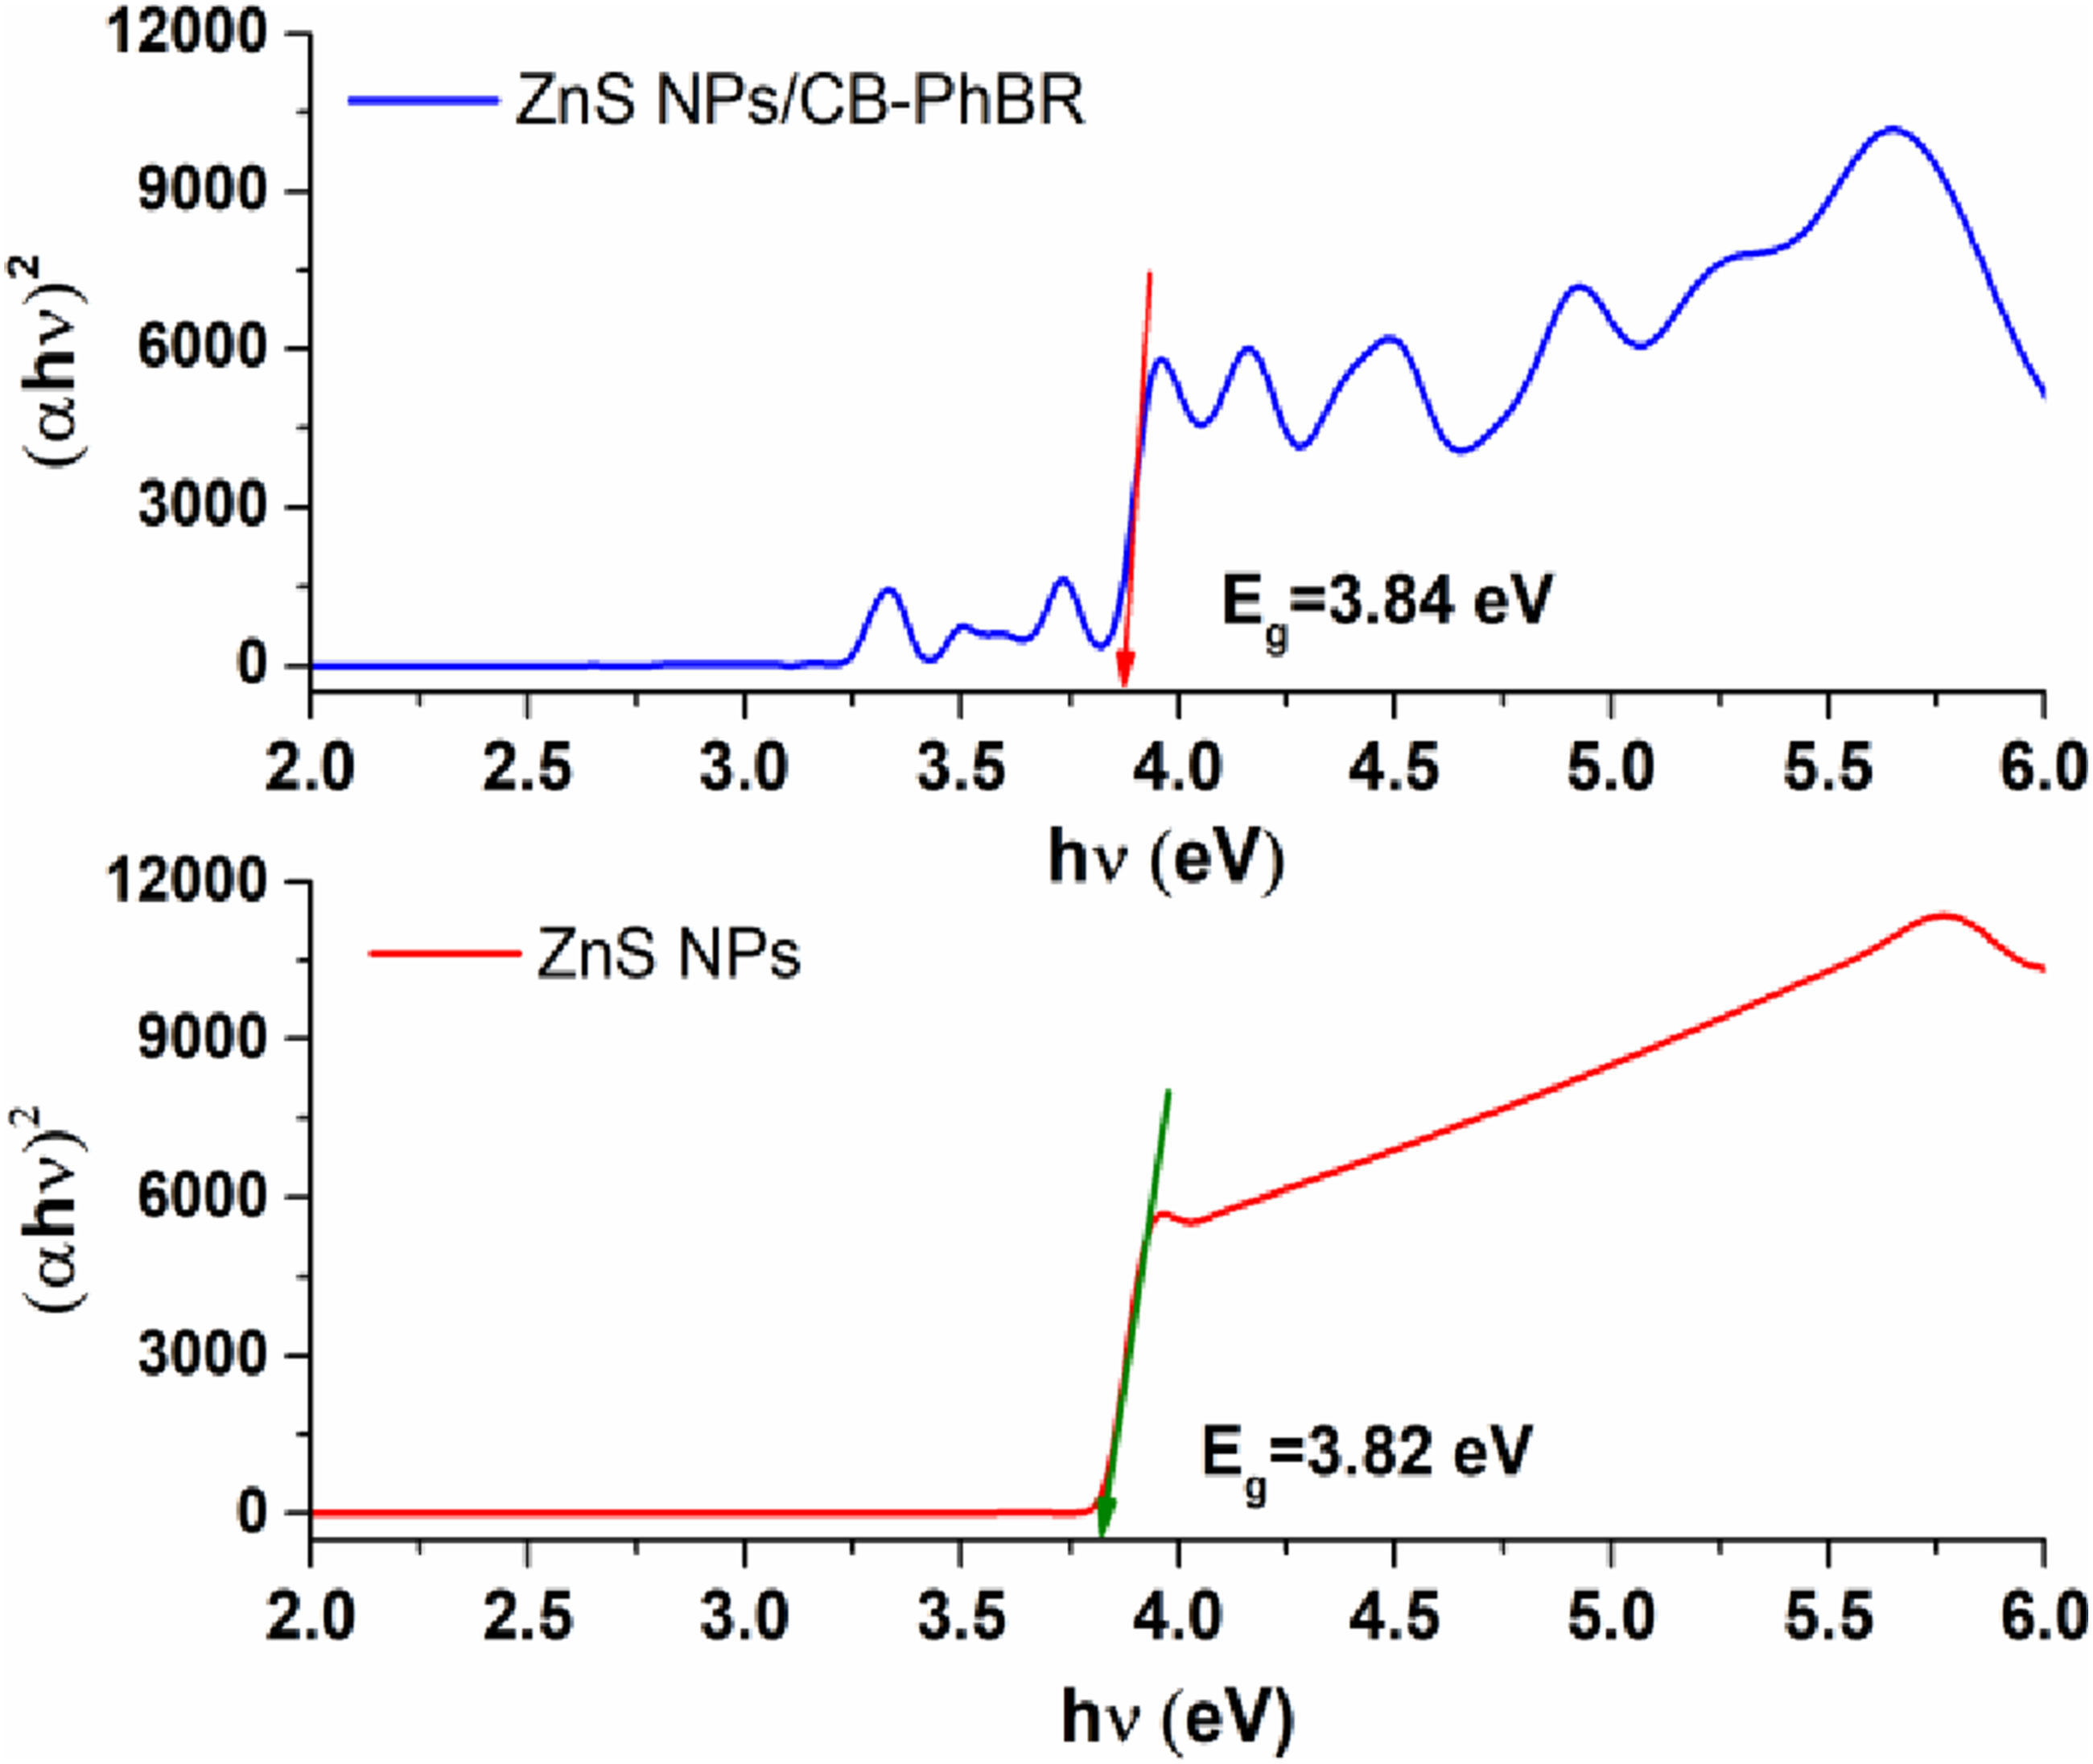
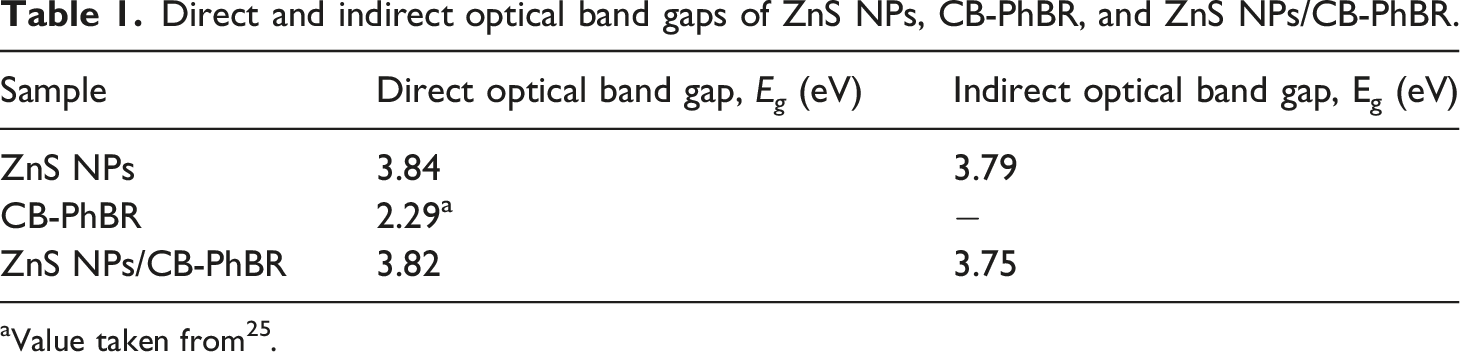
As shown in the table, the direct optical band gap values of ZnS NPs and ZnS NPs/CB-PhBR were 3.84 and 3.82 eV, respectively, whereas CB-PhBR showed a lower direct band gap of 2.29 eV. 25 The band gap values reported for bulk ZnS range from 3.56 to 3.764 eV. 37 The higher band gap of ZnS NPs/CB-PhBR compared with CB-PhBR indicates that ZnS immobilization significantly changes the optical behavior of the matrix.31,32,33 At the same time, the close band gap values of free ZnS NPs and ZnS NPs/CB-PhBR show that ZnS retains its wide-band-gap semiconductor character after immobilization. 38
As shown in Table 1, the direct band gap of ZnS NPs and the ZnS NPs/CB-PhBR nanocomposite is slightly higher than their indirect band gap values. The lower direct band gap of CB-PhBR compared with ZnS NPs/CB-PhBR confirms that ZnS immobilization shifts the optical response of the composite toward wider-band-gap behavior. Since the indirect-band-gap calculation for CB-PhBR was not reliable, CB-PhBR was evaluated only in terms of its direct band gap.
Comparison of the Eg values of ZnS NPs/CB-PhBR with reported ZnS NPs/polymer composites.
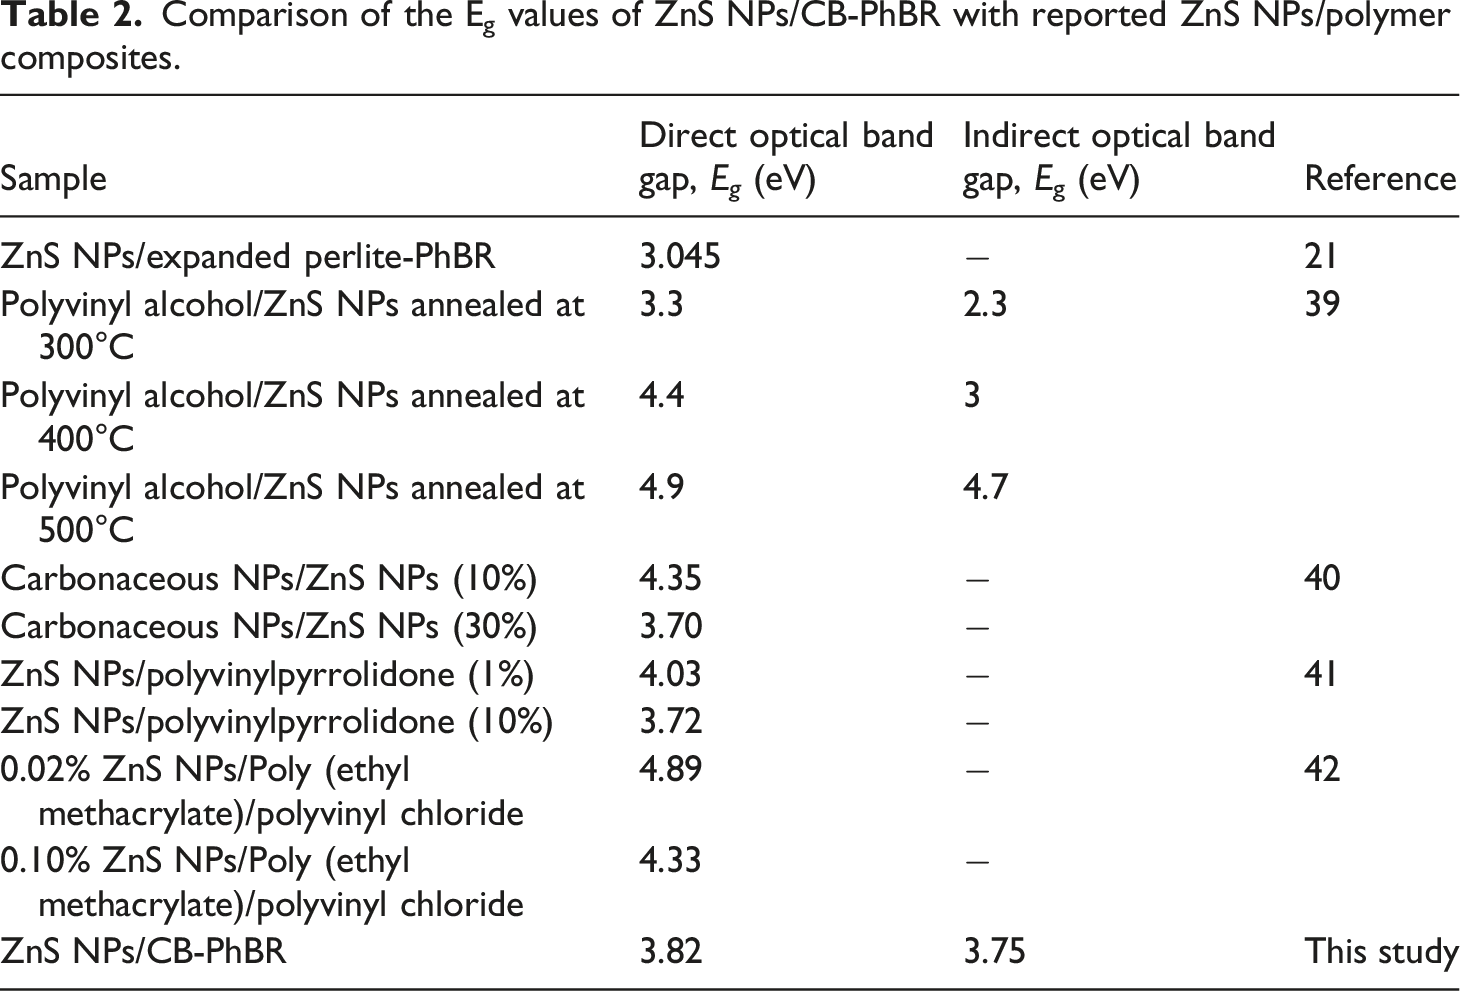
Table 2 compares the direct and indirect optical band gaps (Eg) of various ZnS NPs/polymer composites. The data show how varying amounts of ZnS NPs, treatment conditions, and polymer matrix types affect the optical properties of ZnS NPs. In this study, ZnS NPs/CB-PhBR exhibited direct and indirect optical band gaps of 3.82 and 3.75 eV, respectively. The close Eg values of ZnS NPs and ZnS NPs/CB-PhBR indicate that ZnS retains its wide-band-gap semiconductor character after immobilization. The higher band gaps of ZnS NPs/CB-PhBR indicate potential applicability in UV-optoelectronic or UV-absorbing polymer systems. In contrast, materials with smaller band gaps may be better suited for applications requiring visible-light absorption. 43
XRD Analysis
XRD analysis was performed to determine the phase composition and average crystallite size of ZnS NPs in the prepared nanocomposite. XRD patterns of ZnS NPs synthesized by the chemical precipitation method are given in Figure 3. The cataloged peaks at 2θ values (28.31°), (48.40°) and (58.97°) correspond to (111), (220) and (311) Miller indices (hkl), respectively, referring to the cubic phase of ZnS. The formation of cubic ZnS is consistent with the low-temperature synthesis conditions.
44
The comparative CB-PhBR and ZnS NPs/CB-PhBR diffraction patterns, as shown in Figure 3, were analyzed to assess the interaction between the deposited ZnS NPs and the CB-PhBR composite matrix. After attachment of ZnS NPs to the CB-PhBR matrix, the (111), (220), and (311) peaks characteristic of cubic ZnS NPs (ICDD PDF 65-0309) were observed in the XRD pattern of the synthesized ZnS NPs/CB-PhBR nanocomposite (Figure 3). In addition, it is observed that the intensity of the diffraction peaks of ZnS NPs in ZnS NPs/CB-PhBR nanocomposite is weakened compared to pure ZnS NPs. This behavior may be attributed to the lower relative amount of crystalline ZnS in the polymer-CB matrix, reduced crystallite size, and lattice strain and interfacial constraints introduced during immobilization.
41
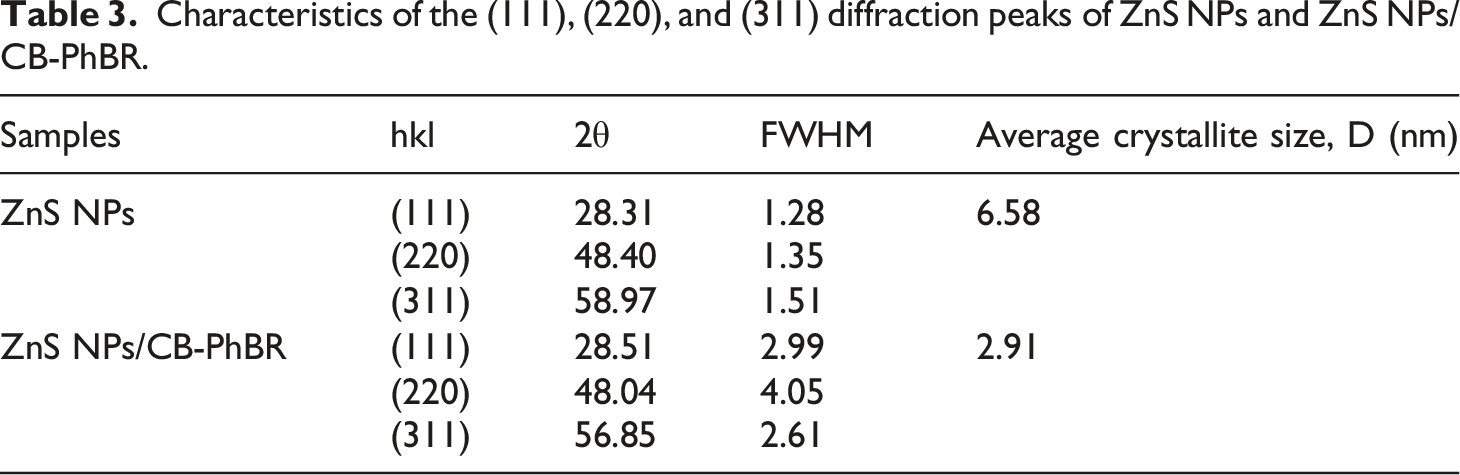
The characteristics of the (111), (220), and (311) diffraction peaks for ZnS NPs in their pure state and within the ZnS NPs/CB-PhBR nanocomposite are provided in Table 3. The table shows that the (111), (220), and (311) peaks exhibit significant broadening, likely due to the small crystallite sizes of the ZnS.
45
The peak parameters were calculated using OriginPro 2015; details are provided in Figures S2 and S3. XRD pattern of ZnS NPs, CB-PhBR, and ZnS NPs/CB-PhBR nanocomposite. Characteristics of the (111), (220), and (311) diffraction peaks of ZnS NPs and ZnS NPs/CB-PhBR.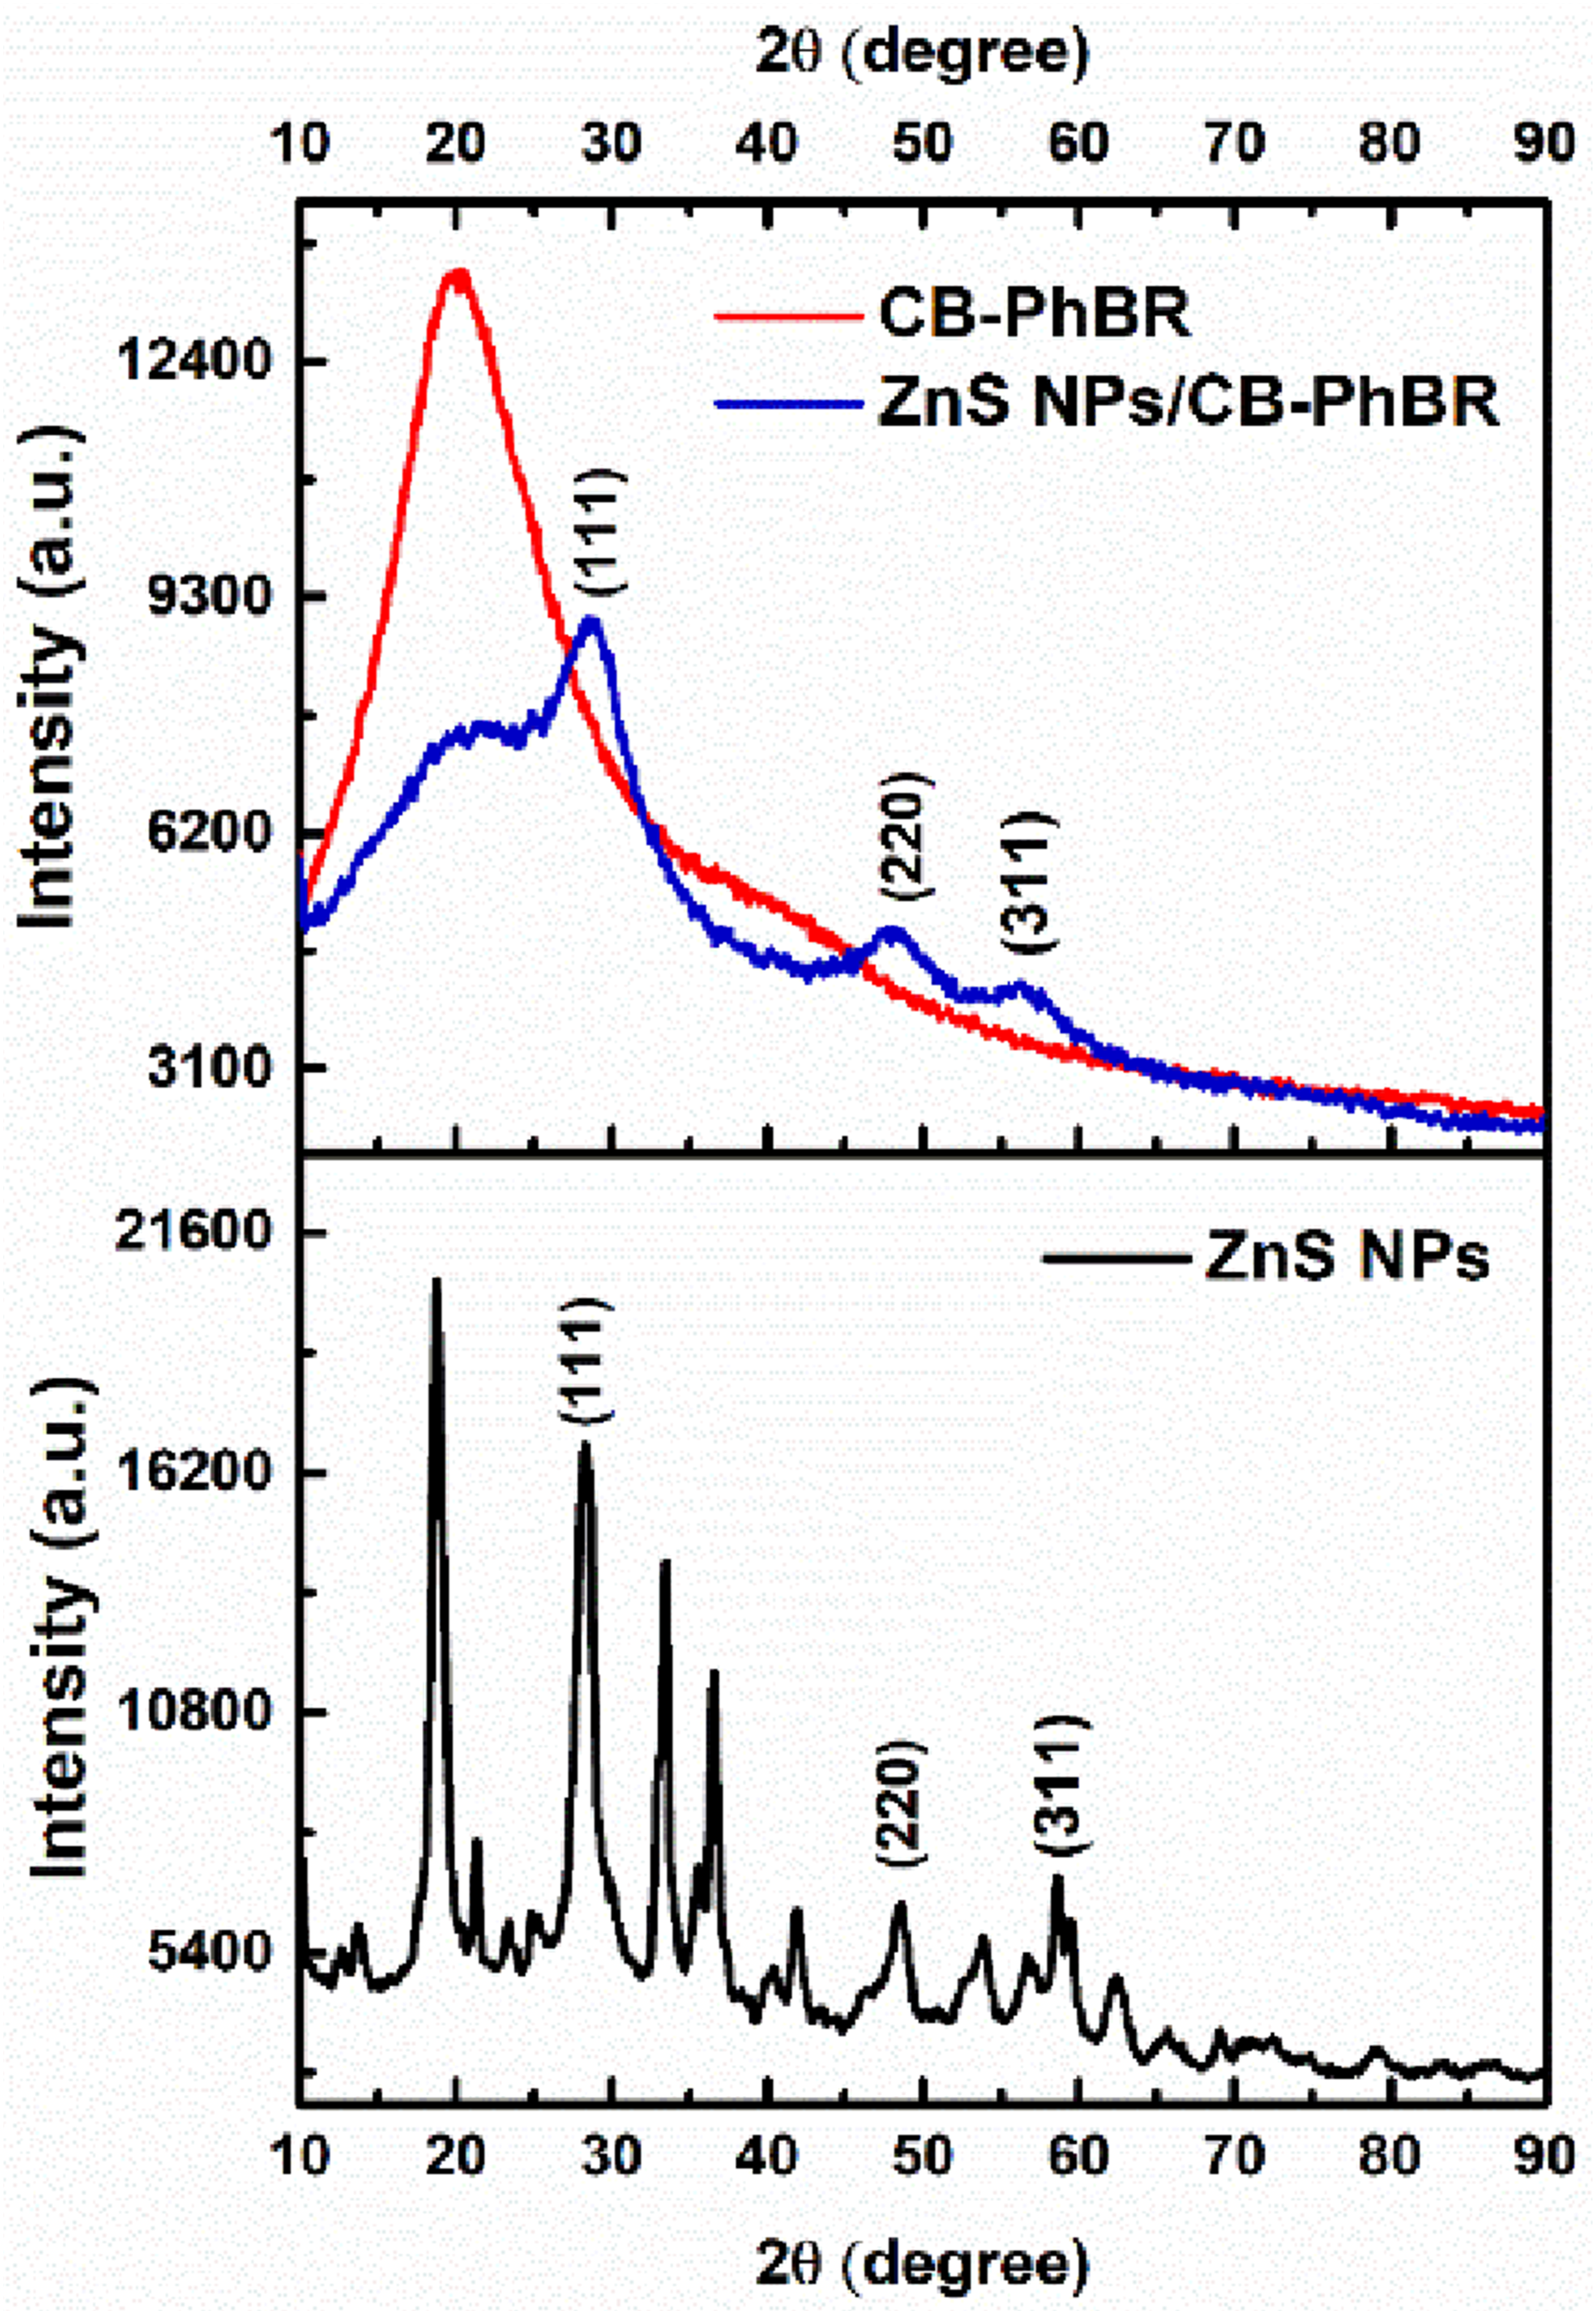
To estimate the average crystallite size of ZnS NPs, the Debye-Scherrer (D-S) equation
46
is used, based on the (111), (220), and (311) peaks: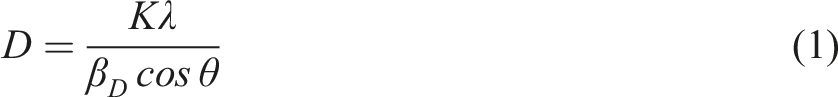
The average crystallite size of ZnS NPs, calculated using the D-S equation, is presented in Table 3 for both the pure ZnS NPs and the ZnS NPs/CB-PhBR nanocomposite.
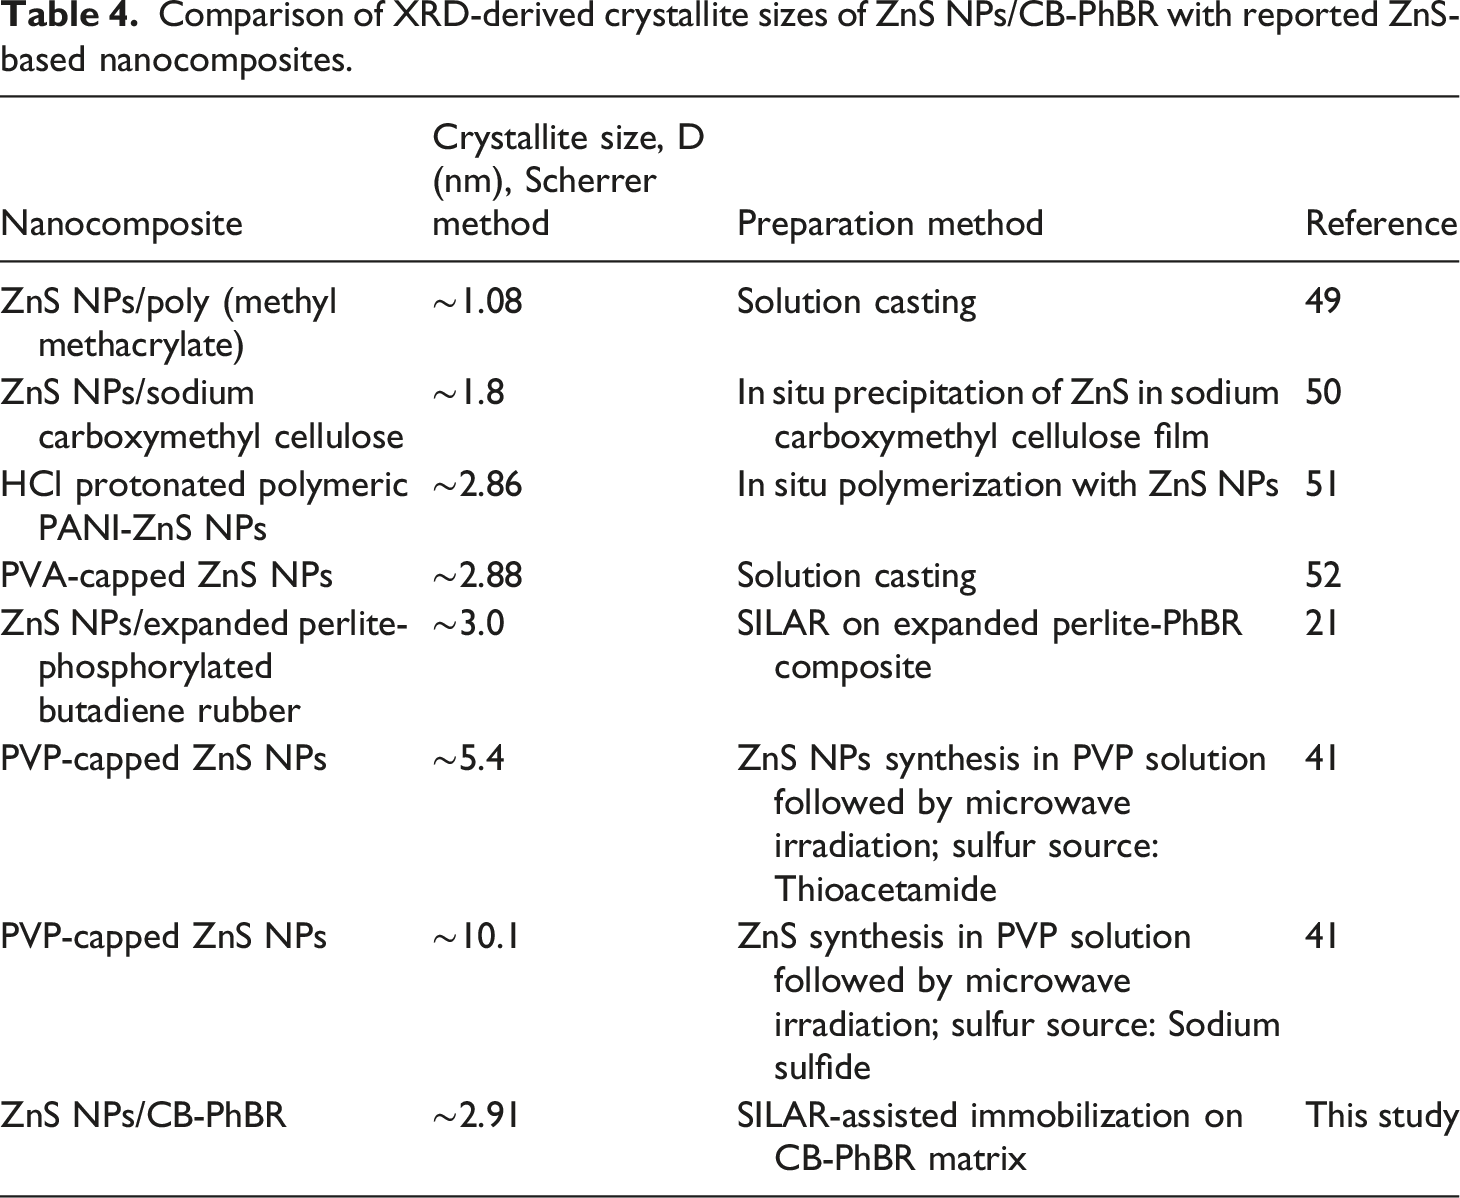
Comparison of XRD-derived crystallite sizes of ZnS NPs/CB-PhBR with reported ZnS-based nanocomposites.
The D-S method primarily considers the impact of crystal size on the broadening observed in XRD peaks and does not offer insights into the internal lattice deformations induced by factors such as point defects, grain boundaries, triple junctions, and stacking defects in nanocrystals. In contrast, due to its simplicity and ease of use, the Williamson-Hall (W-H) method is extensively employed to assess the influence of internal stress on XRD peak broadening. According to the W-H method, the broadening of X-ray peaks arises from both size-dependent effects and microscopic deformations within the nanocrystal. Consequently, the total broadening can be determined by the following expression47,48:
Using the XRD pattern data, the average crystallite size and microstrain were calculated using the uniform deformation model (UDM), uniform stress deformation model (USDM), and uniform deformation energy density model (UDEDM), which were derived by modifying the W-H method.
The UDM assumes that lattice strain is uniformly distributed throughout the crystal, resulting in broadening of the isotropic peak.
48
The UDM equation is linear, considering the isotropic nature of crystals. The analysis involves plotting 4sinθ on the X-axis and βhkl⋅cosθ on the Y-axis for each diffraction peak, resulting in a straight line where the y-intercept reveals crystallite size and the slope indicates lattice strain. The UDM equation is represented as
48
:
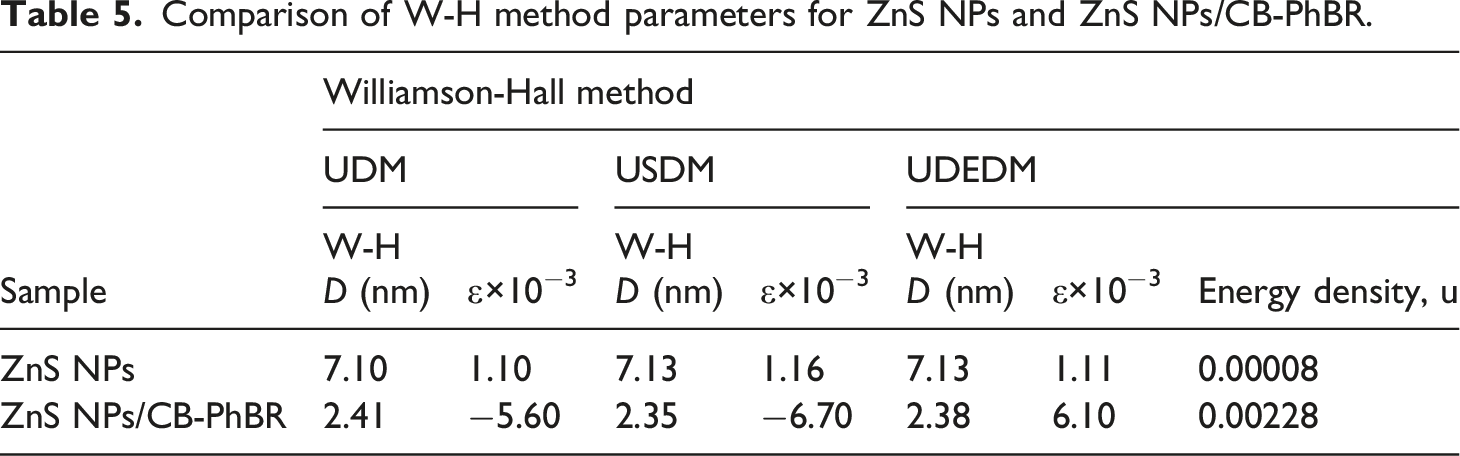
Comparison of W-H method parameters for ZnS NPs and ZnS NPs/CB-PhBR.
The homogeneous deformation model assumes that nanocrystals are homogeneous and isotropic, which does not accurately reflect the properties of real crystals. Therefore, to more accurately simulate real conditions, it is necessary to adjust the W-H equation to take into account the anisotropy of the lattice deformation stress. This modified model, called the USDM, assumes that the lattice strain stress is uniform in all directions within the lattice planes and accounts for the small microstrain present in the particles.48,53 According to Hooke’s law, within the elastic limit, stress (σ) and strain (ε) are linearly proportional
54
:
where E is the modulus of elasticity, also known as Young’s modulus, this approximation holds for tiny strains, assuming uniform lattice deformation stress. Replacing strain with
54
:

USDM results for ZnS NPs and ZnS NPs/CB-PhBR are shown in Table 5, and βhkl⋅cosθ versus 4sinθ/Ehkl graphs are given in Figure S4.
Crystals in reality contain defects, such as dislocations and agglomerations, that render them imperfect. As a result, assumptions of isotropy in crystal behavior and a linear stress-strain relationship cannot fully satisfy real conditions. Therefore, alternative models are necessary for studying crystal structure parameters. The UDEDM assumes uniform deformation energy in all crystal directions, unlike earlier models that assumed homogeneity and isotropy. This model is used to calculate the energy density (u) considering the strain-stress relationship, especially under elastic conditions as described by Hooke’s law. The energy density (u) for an elastic system can be computed using the equation u = (ε2Ehkl)/2, where ε is the strain, and Ehkl is the elastic modulus related to the crystallographic direction (hkl). Thus, equation (3) can be written as follows
54
:
The dependency of βhkl⋅cosθ on 4sinθ(2/Ehkl)1/2 is illustrated in Figure S4. This graph evaluates the anisotropic energy density (u) based on its slope, which is related to the crystal grain size (D), and the Y-intercept. 48 UDEDM results for ZnS NPs and ZnS NPs/CB-PhBR are shown in Table 5.
A critical comparison of the D-S and W-H results provides deeper insight into the structural effect of ZnS immobilization. The D-S method gave an average crystallite size of 6.58 nm for free ZnS NPs and 2.91 nm for ZnS NPs/CB-PhBR, whereas the W-H models gave values of 7.10-7.13 nm and 2.35-2.41 nm, respectively (Table 5). Although the absolute values differ slightly, both approaches show the same trend: ZnS crystallites become smaller after immobilization within the CB-PhBR matrix.
The difference between the D-S and W-H values can be attributed to the fact that the D-S method considers peak broadening mainly as a size effect, whereas the W-H approach separates the contributions of crystallite size and lattice strain. Therefore, the smaller W-H crystallite size obtained for ZnS NPs/CB-PhBR suggests that the peak broadening in the composite is not caused only by crystallite-size reduction, but also by strain introduced during immobilization.
The strain values further support this interpretation. Free ZnS NPs showed low positive microstrain values of about 1.10-1.16 × 10⁻³, while ZnS NPs/CB-PhBR showed larger strain values, including negative values in the UDM and USDM models. These negative values indicate compressive strain, which may arise from interfacial constraints between ZnS NPs and the surrounding CB-PhBR matrix. In addition, the higher deformation energy density of ZnS NPs/CB-PhBR compared with free ZnS NPs indicates stronger structural distortion in the immobilized ZnS phase. Overall, the combined D-S and W-H analysis confirms that ZnS immobilization in CB-PhBR reduces crystallite size and introduces interfacial strain, supporting the successful formation of a constrained ZnS NPs/polymer-carbon black hybrid structure.
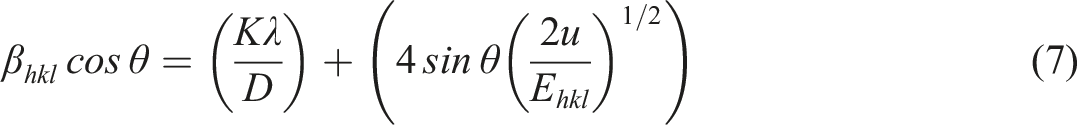
FTIR Analysis
FTIR spectroscopy was used to investigate the structural features and chemical interactions in CB-PhBR and ZnS NPs/CB-PhBR composites (Figure 4). The detailed characterization of CB, PhBR, and CB-PhBR composites was presented in our previous work.
25
The presence of hydroxyl (-OH) and carboxyl (-COOH) groups on the CB surface was found to play an essential role in the interaction of CB with phosphorylated BR in the formation of the composite structure.55,56 The main absorption band at 3384 cm-1 can be assigned to O-H stretching vibrations of the -P(O) (OH)2 groups in PhBR. The bands at 2931 and 2868 cm−1 are mainly related to C-H stretching vibrations of the butadiene rubber backbone, although this region may overlap with PO-H stretching vibrations of phosphate groups.
57
After modification with CB, the absence of a significant effect on the FTIR spectra of PhBR indicates distribution of CB particles throughout the polymer matrix.
58
FTIR spectra of CB-PhBR and ZnS NPs/CB-PhBR.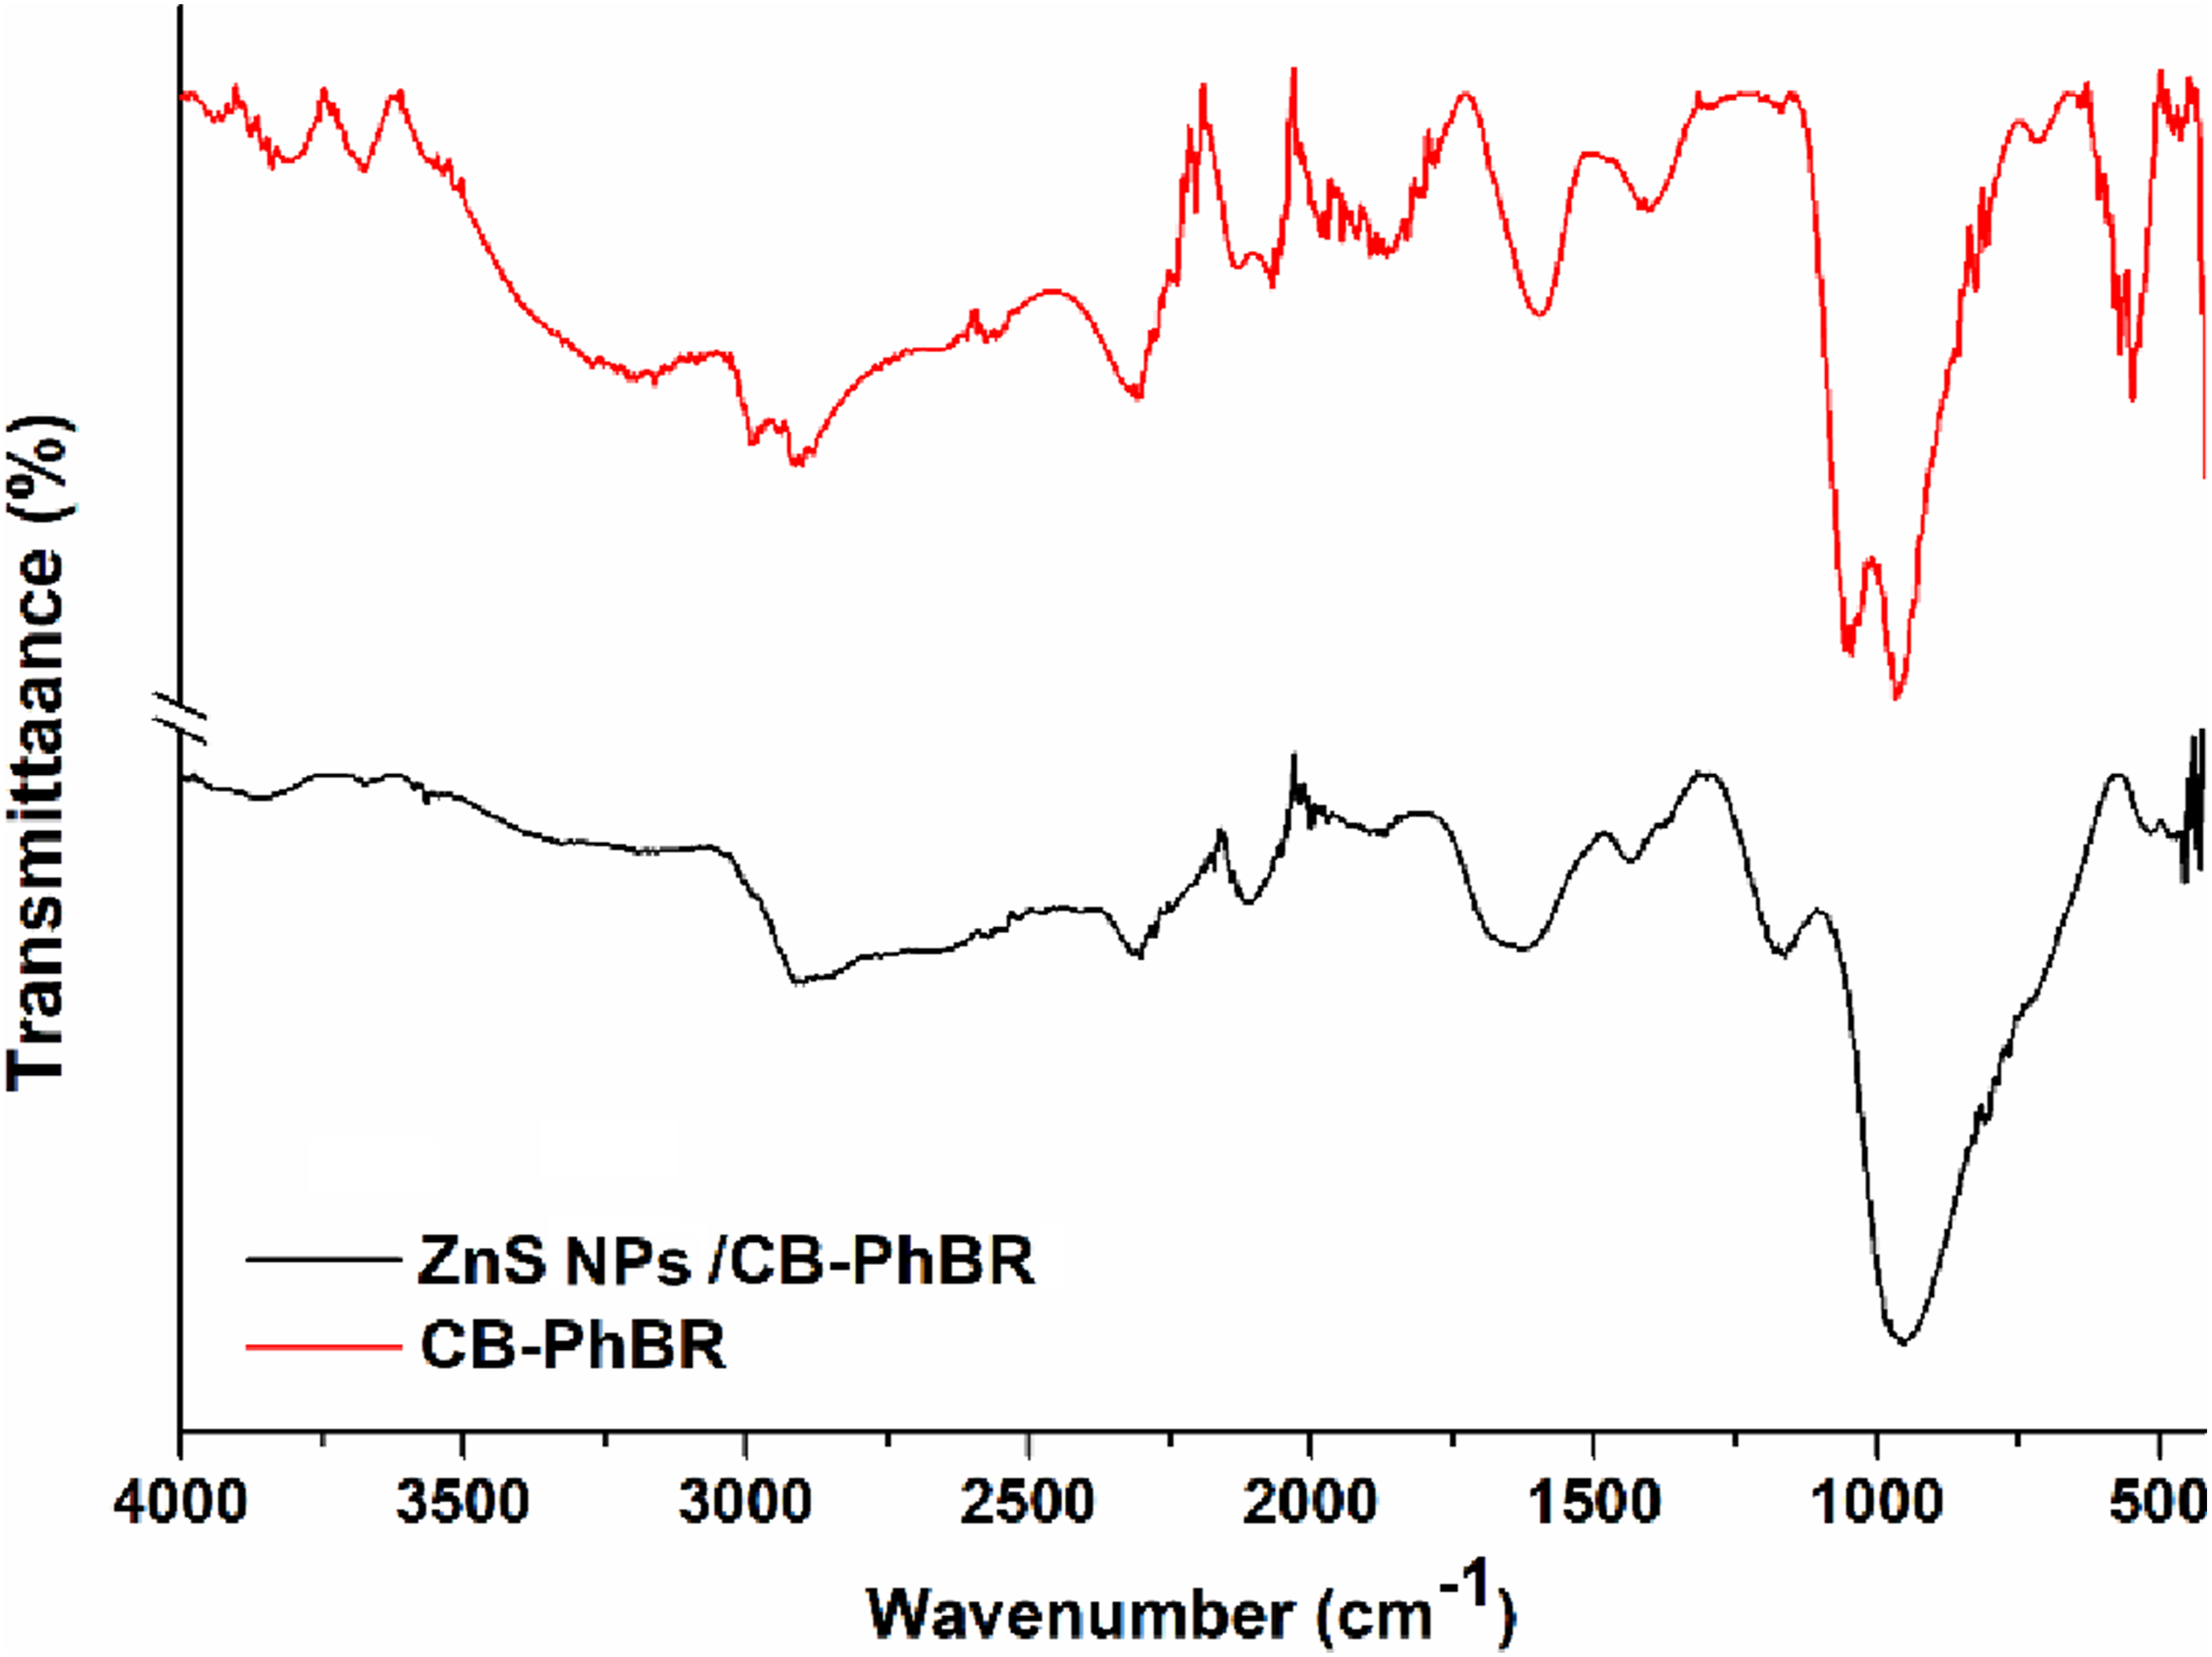
The characteristic CB-PhBR bands are also observed in the spectrum of ZnS NPs/CB-PhBR. In CB-PhBR, the band at 982 cm−1 is assigned to C–O–P stretching, confirming the attachment of –PO(OH)2 groups to the rubber matrix through oxygen. 25 This assignment is also consistent with reported phosphate-containing carbon materials, where P–O-related vibrations are commonly observed in the 900-1100 cm−1 region. 57 After ZnS immobilization, this phosphate-related C–O–P region shifts and broadens, with a band observed at 954.74 cm−1. This change suggests a change in the local phosphate environment due to the interaction and coordination of Zn2+ ions with oxygen-containing phosphate groups, followed by reaction with S2- and the formation of immobilized ZnS NPs near these functional sites.
BET Analysis
Brunauer-Emmett-Teller (BET) (Figure 5) and Barrett-Joyner-Halenda (BJH) (Table 6) analyses show that the incorporation of ZnS NPs into the CB-PhBR matrix significantly reduces the surface area and changes the pore structure. BET surface area analysis results: N2 adsorption-desorption isotherm plots of (a) CB-PhBR; (b) ZnS NPs/CB-PhBR. Surface area, pore volume, and pore size distribution of samples by BET analysis. Note. BJH cumulative surface area and pore volume values were calculated for pores with widths of 1.7-300 nm; Single-point surface area values were obtained at P/P0 ≈ 0.349, while single-point total pore volume values were obtained at P/P0 ≈ 0.984.
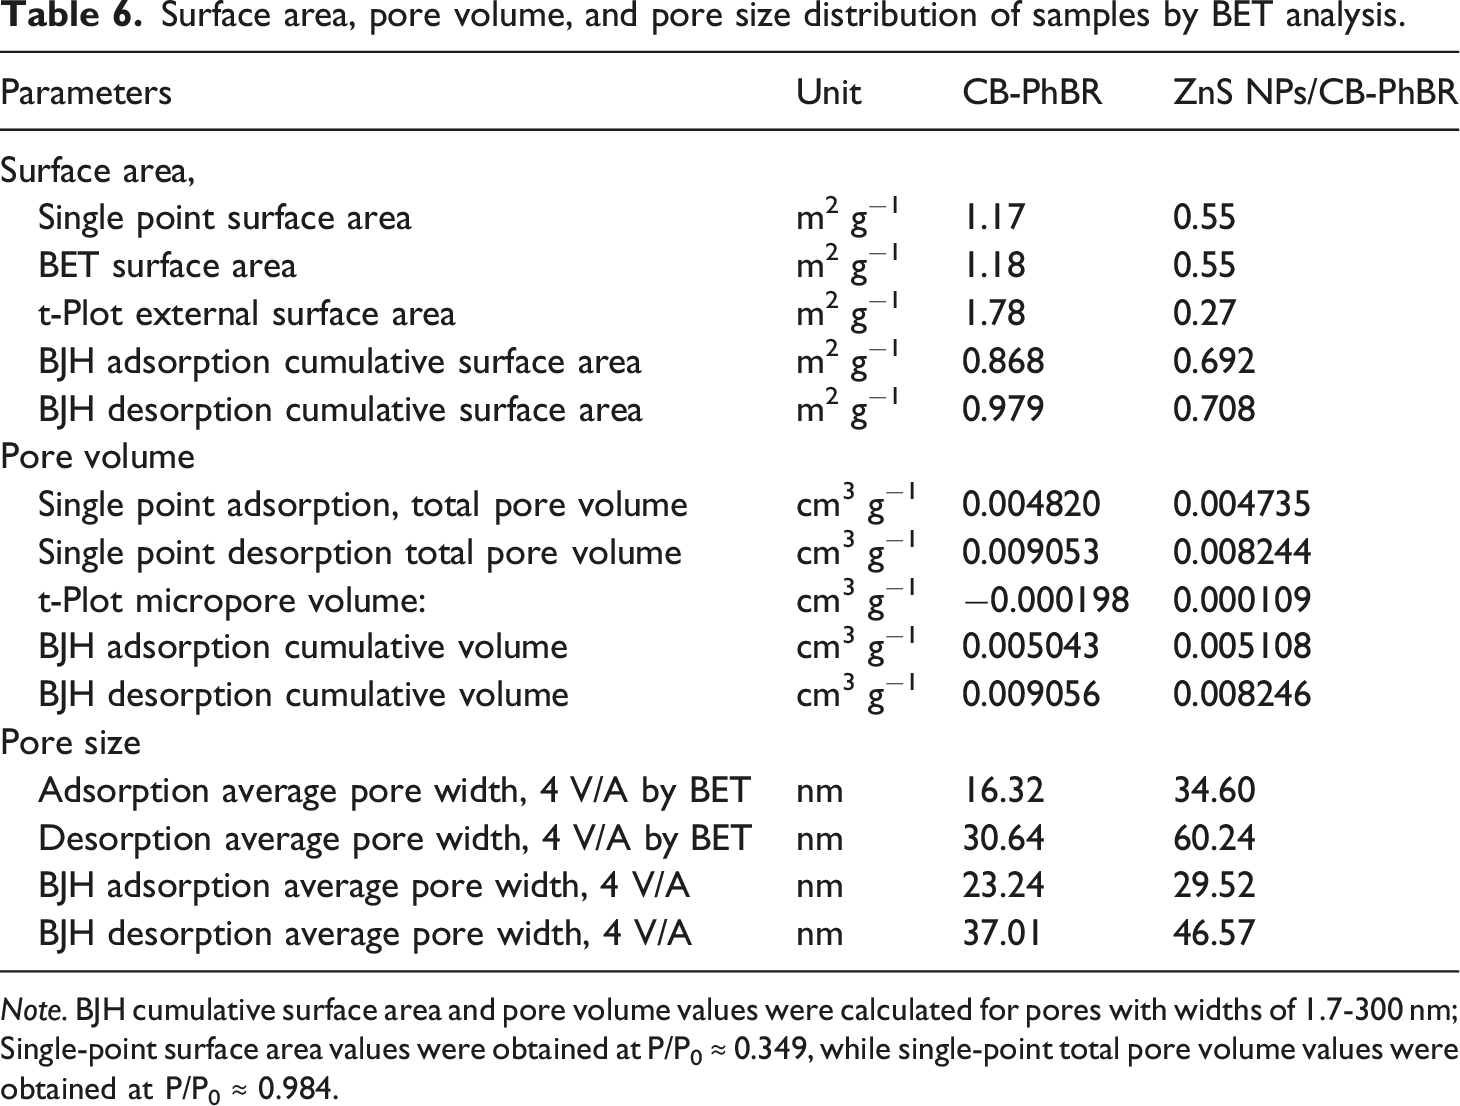
The CB-PhBR shows a BET surface area of ∼1.18 m2 g−1, which is approximately twice that of the ZnS NPs/CB-PhBR (∼0.55 m2 g−1). A similar trend is observed in the external surface area t-plot (1.78 vs 0.27 m2 g−1), while the micropore volume t-plot is essentially zero (even slightly negative for CB-PhBR), indicating negligible microporosity in both materials. Notably, the total pore volume accessible to N2 remains of the same order of magnitude (∼5 × 10⁻³ cm3 g−1 for single-point adsorption) for both samples. However, since the ZnS NPs/CB-PhBR has a smaller surface area, its adsorption average pore width is larger (∼35 nm) than that of CB-PhBR (∼16 nm). Similarly, the average pore width during desorption doubles, from ∼30 to 60 nm. BJH mesopore analysis (17-3000 Å) also shows a slight decrease in the total pore surface area with ZnS loading (adsorption branch pore area ∼0.692 m2 g−1 vs 0.868 m2 g−1 for CB-PhBR), consistent with the ZnS NPs partially blocking or occupying some pore spaces (Table 6).
The N2 isotherms of both samples exhibit H3 hysteresis loops (Figure 5), indicating slit-like pores in the samples.59,60 The N2 isotherms of both samples, mostly below P/P0 = 0.9, show a higher adsorbed volume than the desorption isotherm at the same relative pressure. This behavior may be associated with delayed desorption and pore-network effects. Indeed, the BJH data reflect this: the cumulative pore surface area calculated from the desorption branch is slightly higher than that from adsorption (e.g., 0.979 vs 0.868 m2 g−1 in CB-PhBR and 0.708 vs 0.692 m2 g−1 in ZnS NPs/CB-PhBR). Such hysteresis, in which adsorption uptake exceeds desorption, may arise from mesopore geometry and network effects. During adsorption, these pores are filled by capillary condensation, but during desorption, liquid nitrogen may be trapped (pore blocking) until a critical state is reached. 61 The PhBR matrix is a polymer that undergoes slight swelling or pore-structure changes upon cooling and N2 adsorption, potentially trapping gas and preventing its release. Such gas trapping or pore deformation will result in incomplete desorption, leaving an adsorption branch at a higher value. The desorption branch being lower than the adsorption branch has also been observed in the literature for ZnO, 62 anatase TiO2, 63 organic-rich mudstone, 64 oxamide-phenylene-based mesoporous organosilica NPs, 65 and chitosan-vanadium-titanium-magnetite composite. 66
SEM Analysis
Figure 6 shows the surface morphology of CB-PhBR and ZnS NPs/CB-PhBR. Apparent morphological differences are evident between them, indicating that the incorporation of ZnS NPs significantly modifies the surface structure of the polymer matrix. The CB-PhBR sample (Figure 6(a)) exhibits a rough, highly irregular surface characterized by large, layered, flake-like structures. These formations are likely the result of the modification of the rubber matrix during sample preparation and indicate a heterogeneous surface topology. The rough texture may be due to partial phase separation, and CB appears to be uniformly distributed within the matrix, contributing to the macro-rough surface. SEM micrographs of CB-PhBR (a) and ZnS NPs/CB-PhBR (b).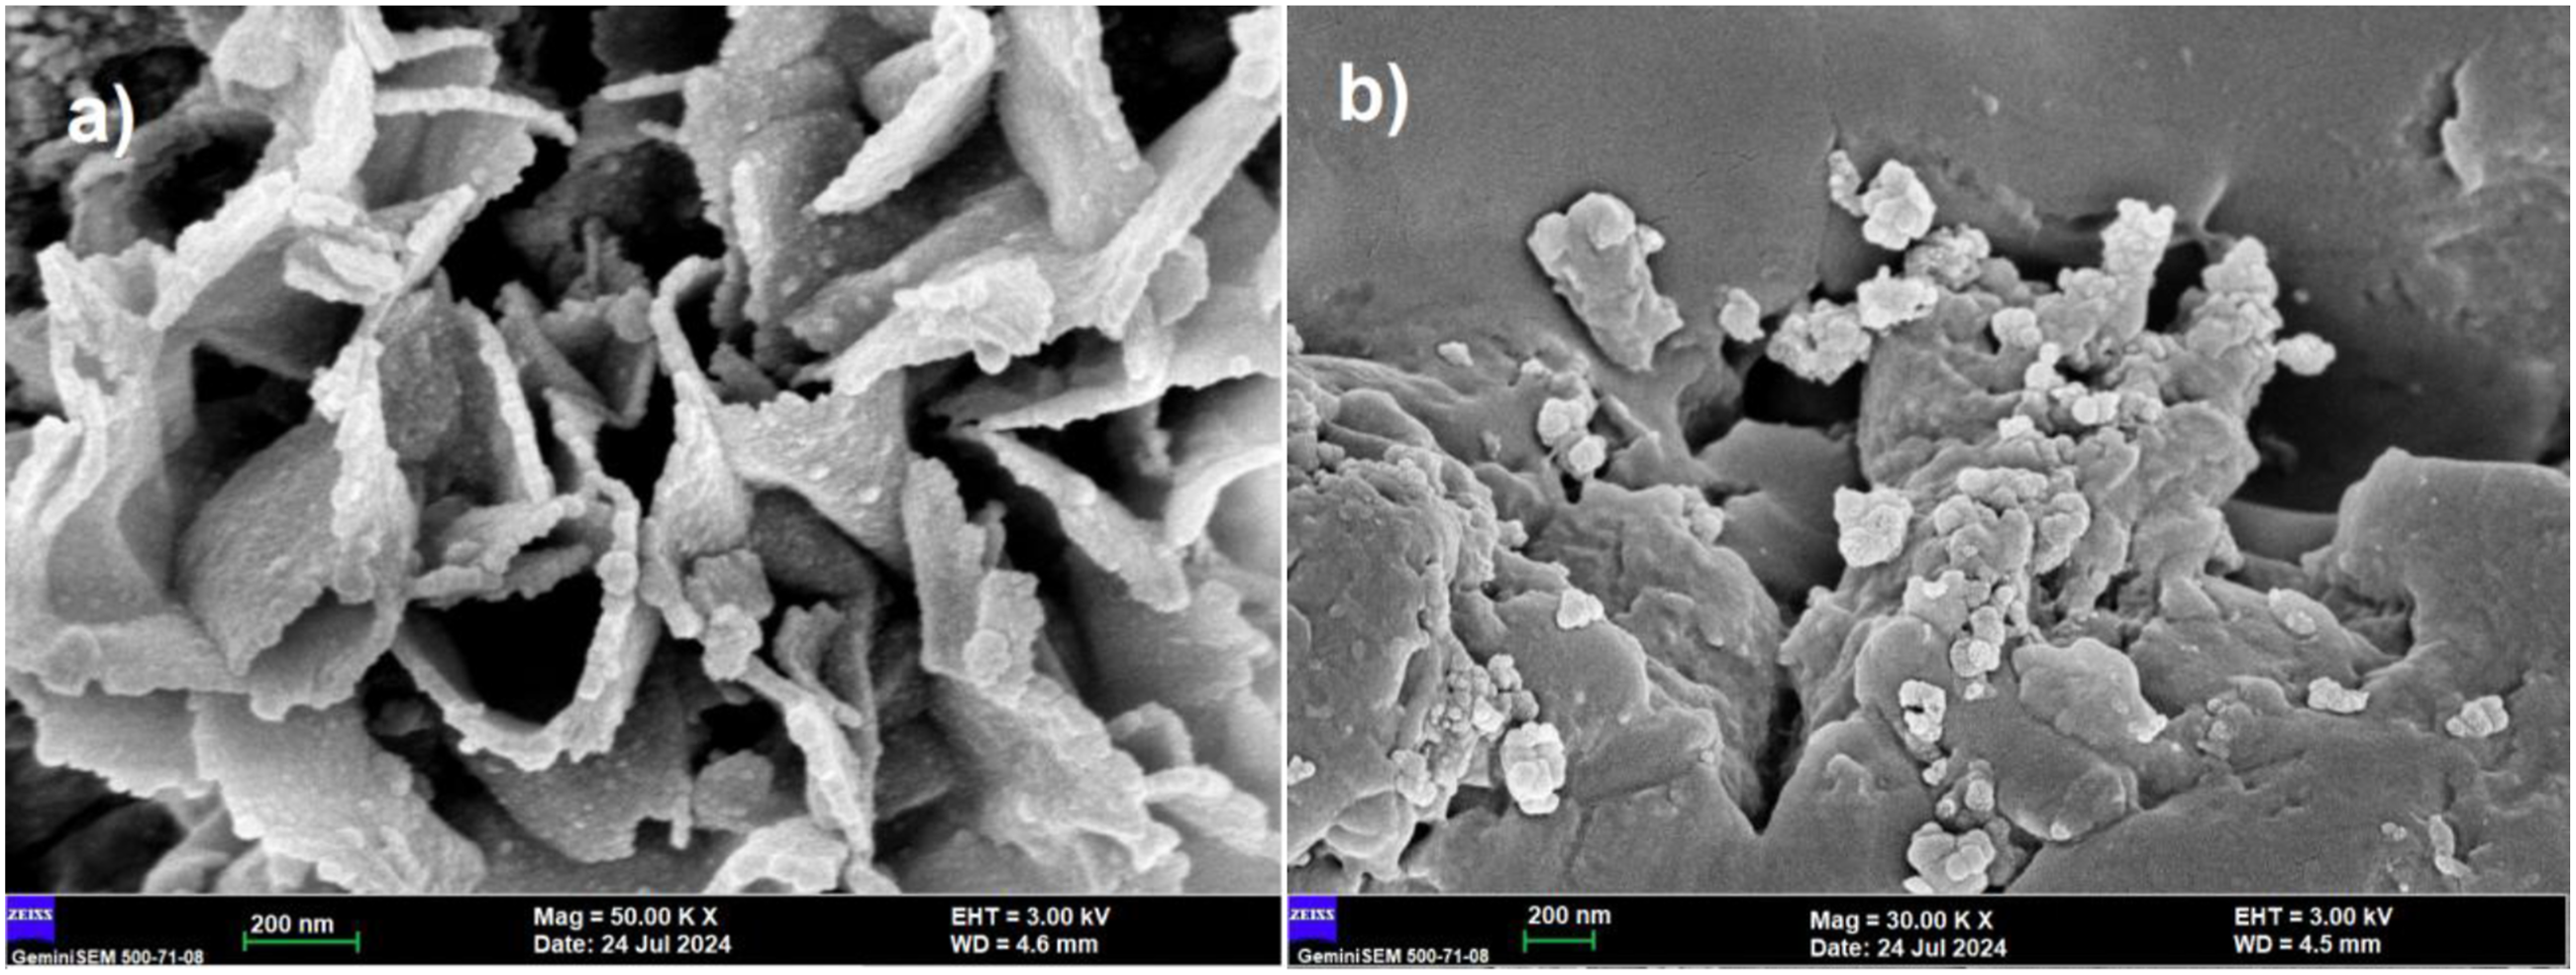
In contrast, the ZnS NPs/CB-PhBR (Figure 6(b)) exhibit a markedly different morphology. The surface is relatively smoother at the macroscale, but features numerous fine, spherical, or granular structures. The bright particles observed on the surface are likely associated with ZnS NPs deposition and partial agglomeration on the CB-PhBR matrix. The presence of these nanoclusters creates a two-scale roughness, preserving some matrix features while introducing a nanoscale surface texture. This micro-to nanoscale-structured surface is typical of materials synthesized by methods such as SILAR, in which nanoparticles nucleate and grow in discrete clusters on the polymer surface. 67
Electrical and Dielectric Properties of ZnS NPs/CB-PhBR
To investigate the electrical and dielectric properties, thin films of the samples were prepared using PVA (PVA + CB-PhBR and PVA + ZnS NPs/CB-PhBR). Figure 7(a) and (b) shows the frequency dependence of electrical conductivity (σ, S cm−1) and the real part of dielectric permittivity (ε') of CB-PhBR and ZnS NPs/CB-PhBR. The real part of the dielectric permittivity was calculated using the equation
51
: Frequency dependence of electrical conductivity (a) and real dielectric permittivity (b) of CB-PhBR and ZnS NPs/CB-PhBR.
The electrical conductivity (σ, S cm−1) of the samples was determined by first measuring the resistance (R) of the thin PVA films and calculating resistivity (ρ) using the following equation
68
:
The conductivity (σ) was then obtained by taking the reciprocal of the resistivity
68
:
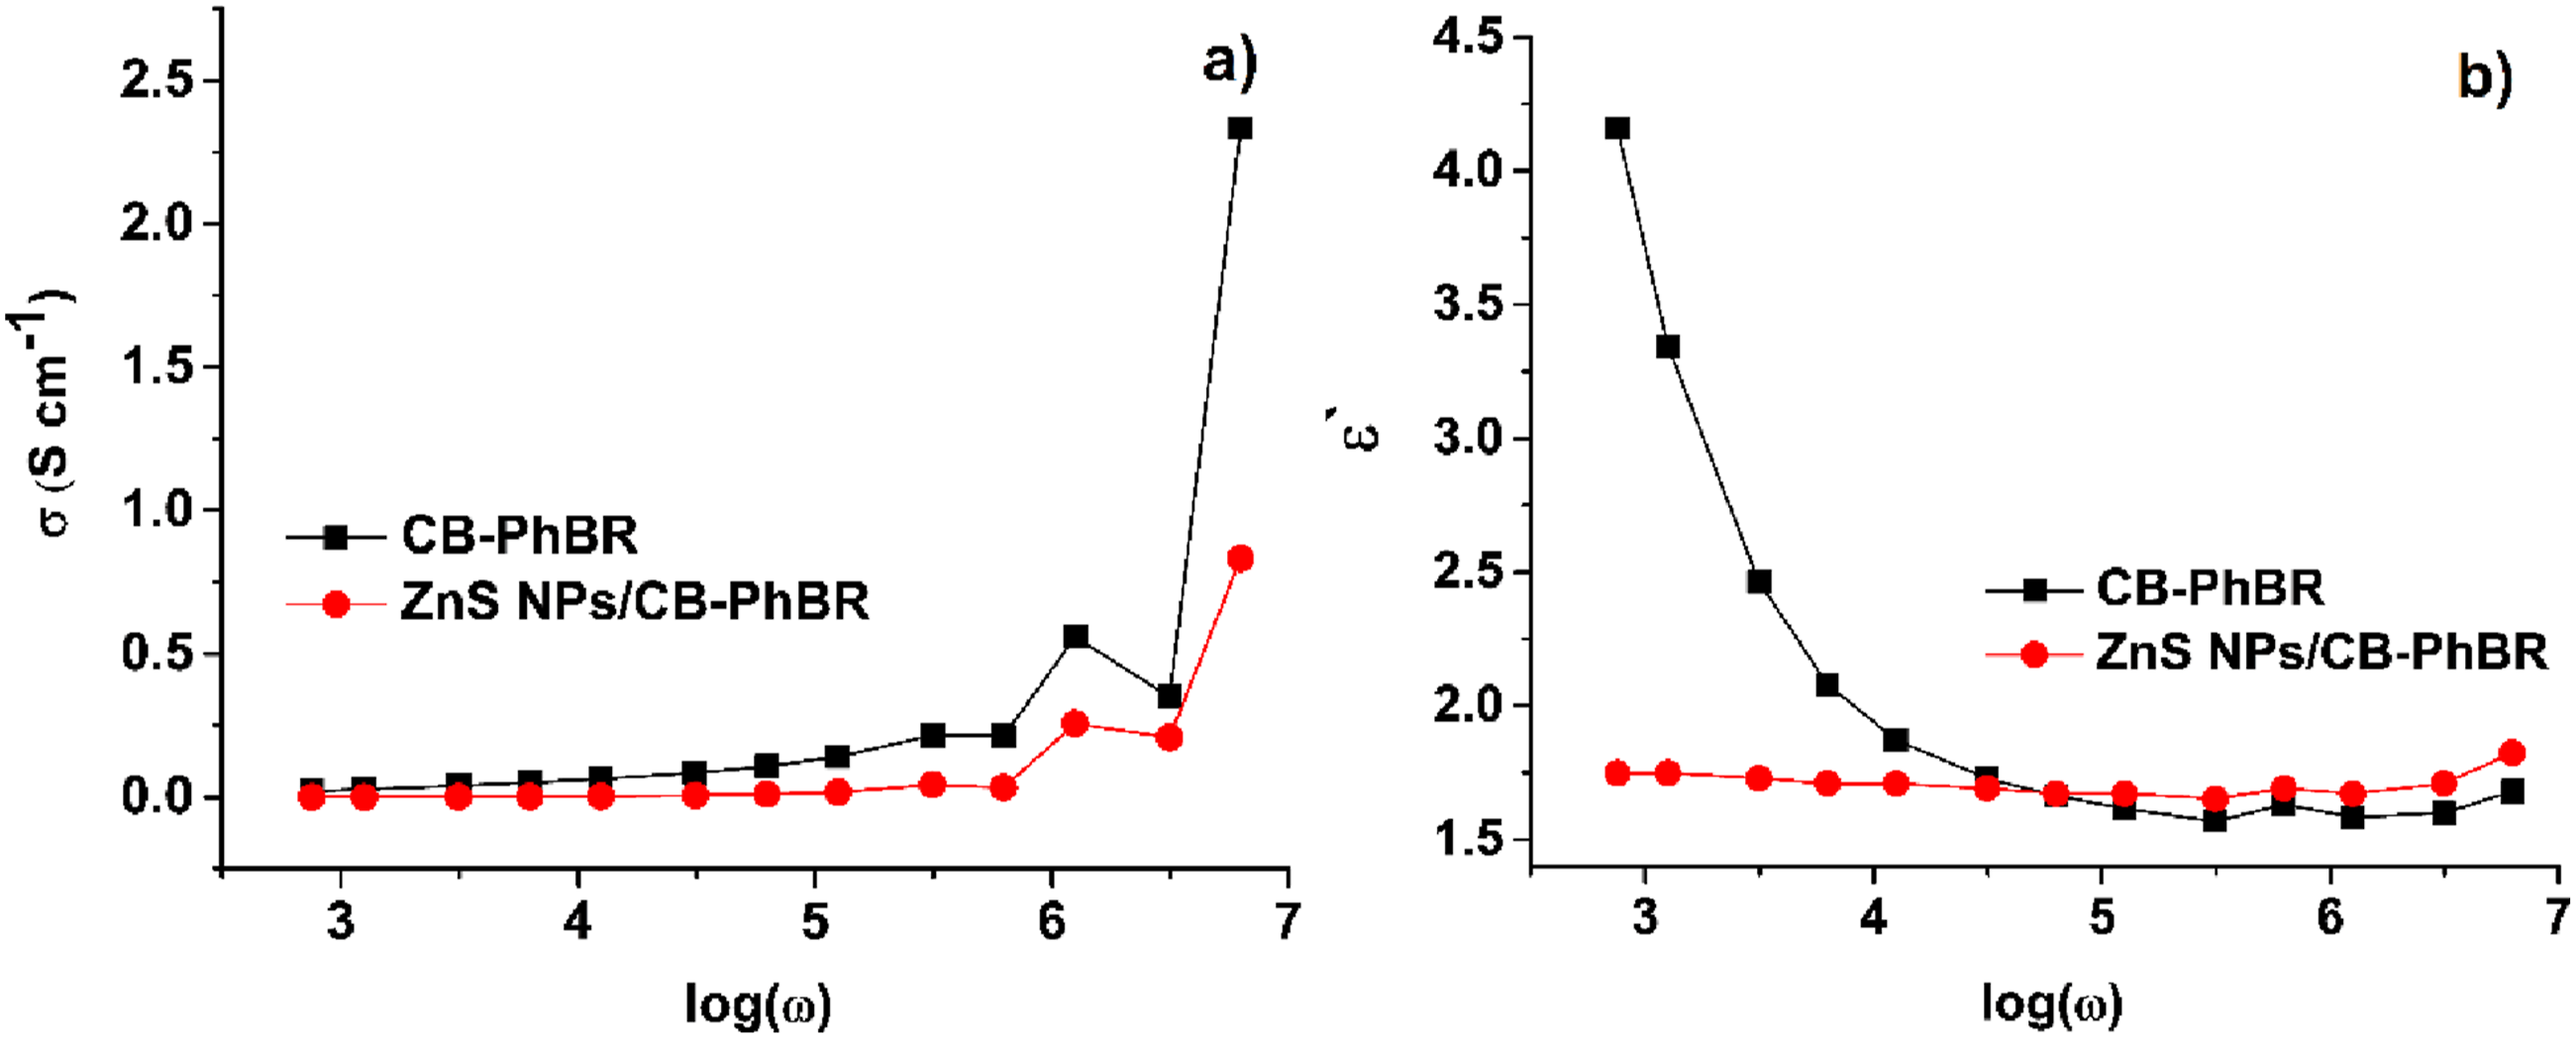
Figure 7(a) shows that the CB-PhBR exhibits a low-frequency plateau near zero and then a pronounced power-law increase at high frequencies, reaching σ ˜ 2.3 S cm−1 at log(ω)≈6.8. In contrast, ZnS NPs/CB-PhBR shows much lower conductivity than CB-PhBR over the investigated frequency range (log(ω) = 2.9÷6.8), increasing to about 0.84 S cm−1 at the highest frequency. In other words, the addition of ZnS NPs reduces the high-frequency σ by about 2.7 times (from 2.3 to 0.84 S cm−1).
This reduction can be explained by disruption of the CB percolation network. In CB-PhBR, conductive CB particles form interconnected pathways that facilitate charge transport through the polymer matrix. During SILAR treatment, ZnS NPs are immobilized mainly at CB-rich and phosphate-functionalized regions. The deposited ZnS phase can partially cover CB surfaces, occupy interparticle spaces, and increase the separation distance between adjacent CB aggregates. As a result, the number of continuous conductive pathways decreases, the contact resistance between CB particles increases, and charge transport through the CB network becomes less efficient. Therefore, ZnS NPs/CB-PhBR shows lower conductivity over the measured frequency range.
The reduction of matrix electrical conductivity by inorganic semiconductor nanoparticles such as ZnS NPs has also been observed in composites like TiO2 NPs/polyaniline, 69 ZnO NPs/poly (3,4-ethylenedioxythiophene)-polystyrene sulfonate, 70 and CdS NPs/poly (ethylene oxide). 71
Figure 7(b) shows that CB-PhBR has a higher ε′ (≈4.3) at low frequency (log(ω)≈3), which then drops steeply to ∼1.5 at high frequency. This reflects the strong interfacial polarization from the space charge at the CB-PhBR interfaces. In contrast, ZnS NPs/CB-PhBR maintains a low, almost frequency-flat ε′ of about 1.6-1.8 across the entire band.
The decrease in permittivity after ZnS immobilization is consistent with the suppression of Maxwell-Wagner-Sillars interfacial polarization. In the original CB-PhBR system, mobile charges can accumulate at the interfaces between conductive CB domains and the polymer matrix, leading to high low-frequency permittivity. After ZnS deposition, the ZnS phase introduces additional dielectric barriers (ZnS NPs have low dielectric constant 72 ) around CB-rich regions and restricts charge accumulation at these interfaces. This reduces space-charge polarization and results in lower dielectric permittivity. Therefore, ZnS NPs act not only as an optical semiconductor phase but also as a structural barrier that interrupts CB-CB contacts and weakens interfacial polarization. A similar phenomenon was observed in the investigation of the dielectric properties of CB/epoxy composites with various SiO2 loadings; a failure in voltage response was noted at high SiO2 loading on the CB surface. 73
The simultaneous decrease in conductivity and permittivity suggests that ZnS NPs/CB-PhBR may be useful for dielectric polymer materials where reduced leakage current, suppressed interfacial polarization, and more stable frequency-dependent dielectric behavior are required. Together with its wider optical band gap, this hybrid system may also be considered for multifunctional insulating, dielectric, and UV-optoelectronic polymer applications.
Synthesis Mechanism of ZnS NPs/CB-PhBR
Scheme 1 illustrates the structure of the ZnS NPs/CB-PhBR nanocomposite synthesized via the SILAR method over three cycles. It illustrates the accumulation of ZnS NPs within the cross-linked polymer composite and their decoration of the CB structure. The ZnS NPs/CB-PhBR were formed due to the functional groups and porosity of the CB, which enhanced the polymer composite’s surface structure and facilitated nanoparticle incorporation. Extensive research has focused on modifying polymer surfaces to improve their affinity for inorganic nanoparticles via various techniques.
74
One of the most effective techniques involves incorporating nanofillers, such as metallic, ceramic, and carbon structures, into the polymer matrix. This approach markedly alters the physicochemical properties, particularly the surface structure, of the polymer matrix.
75
ZnS NPs/CB-PhBR nanocomposite obtained in three cycles by the SILAR method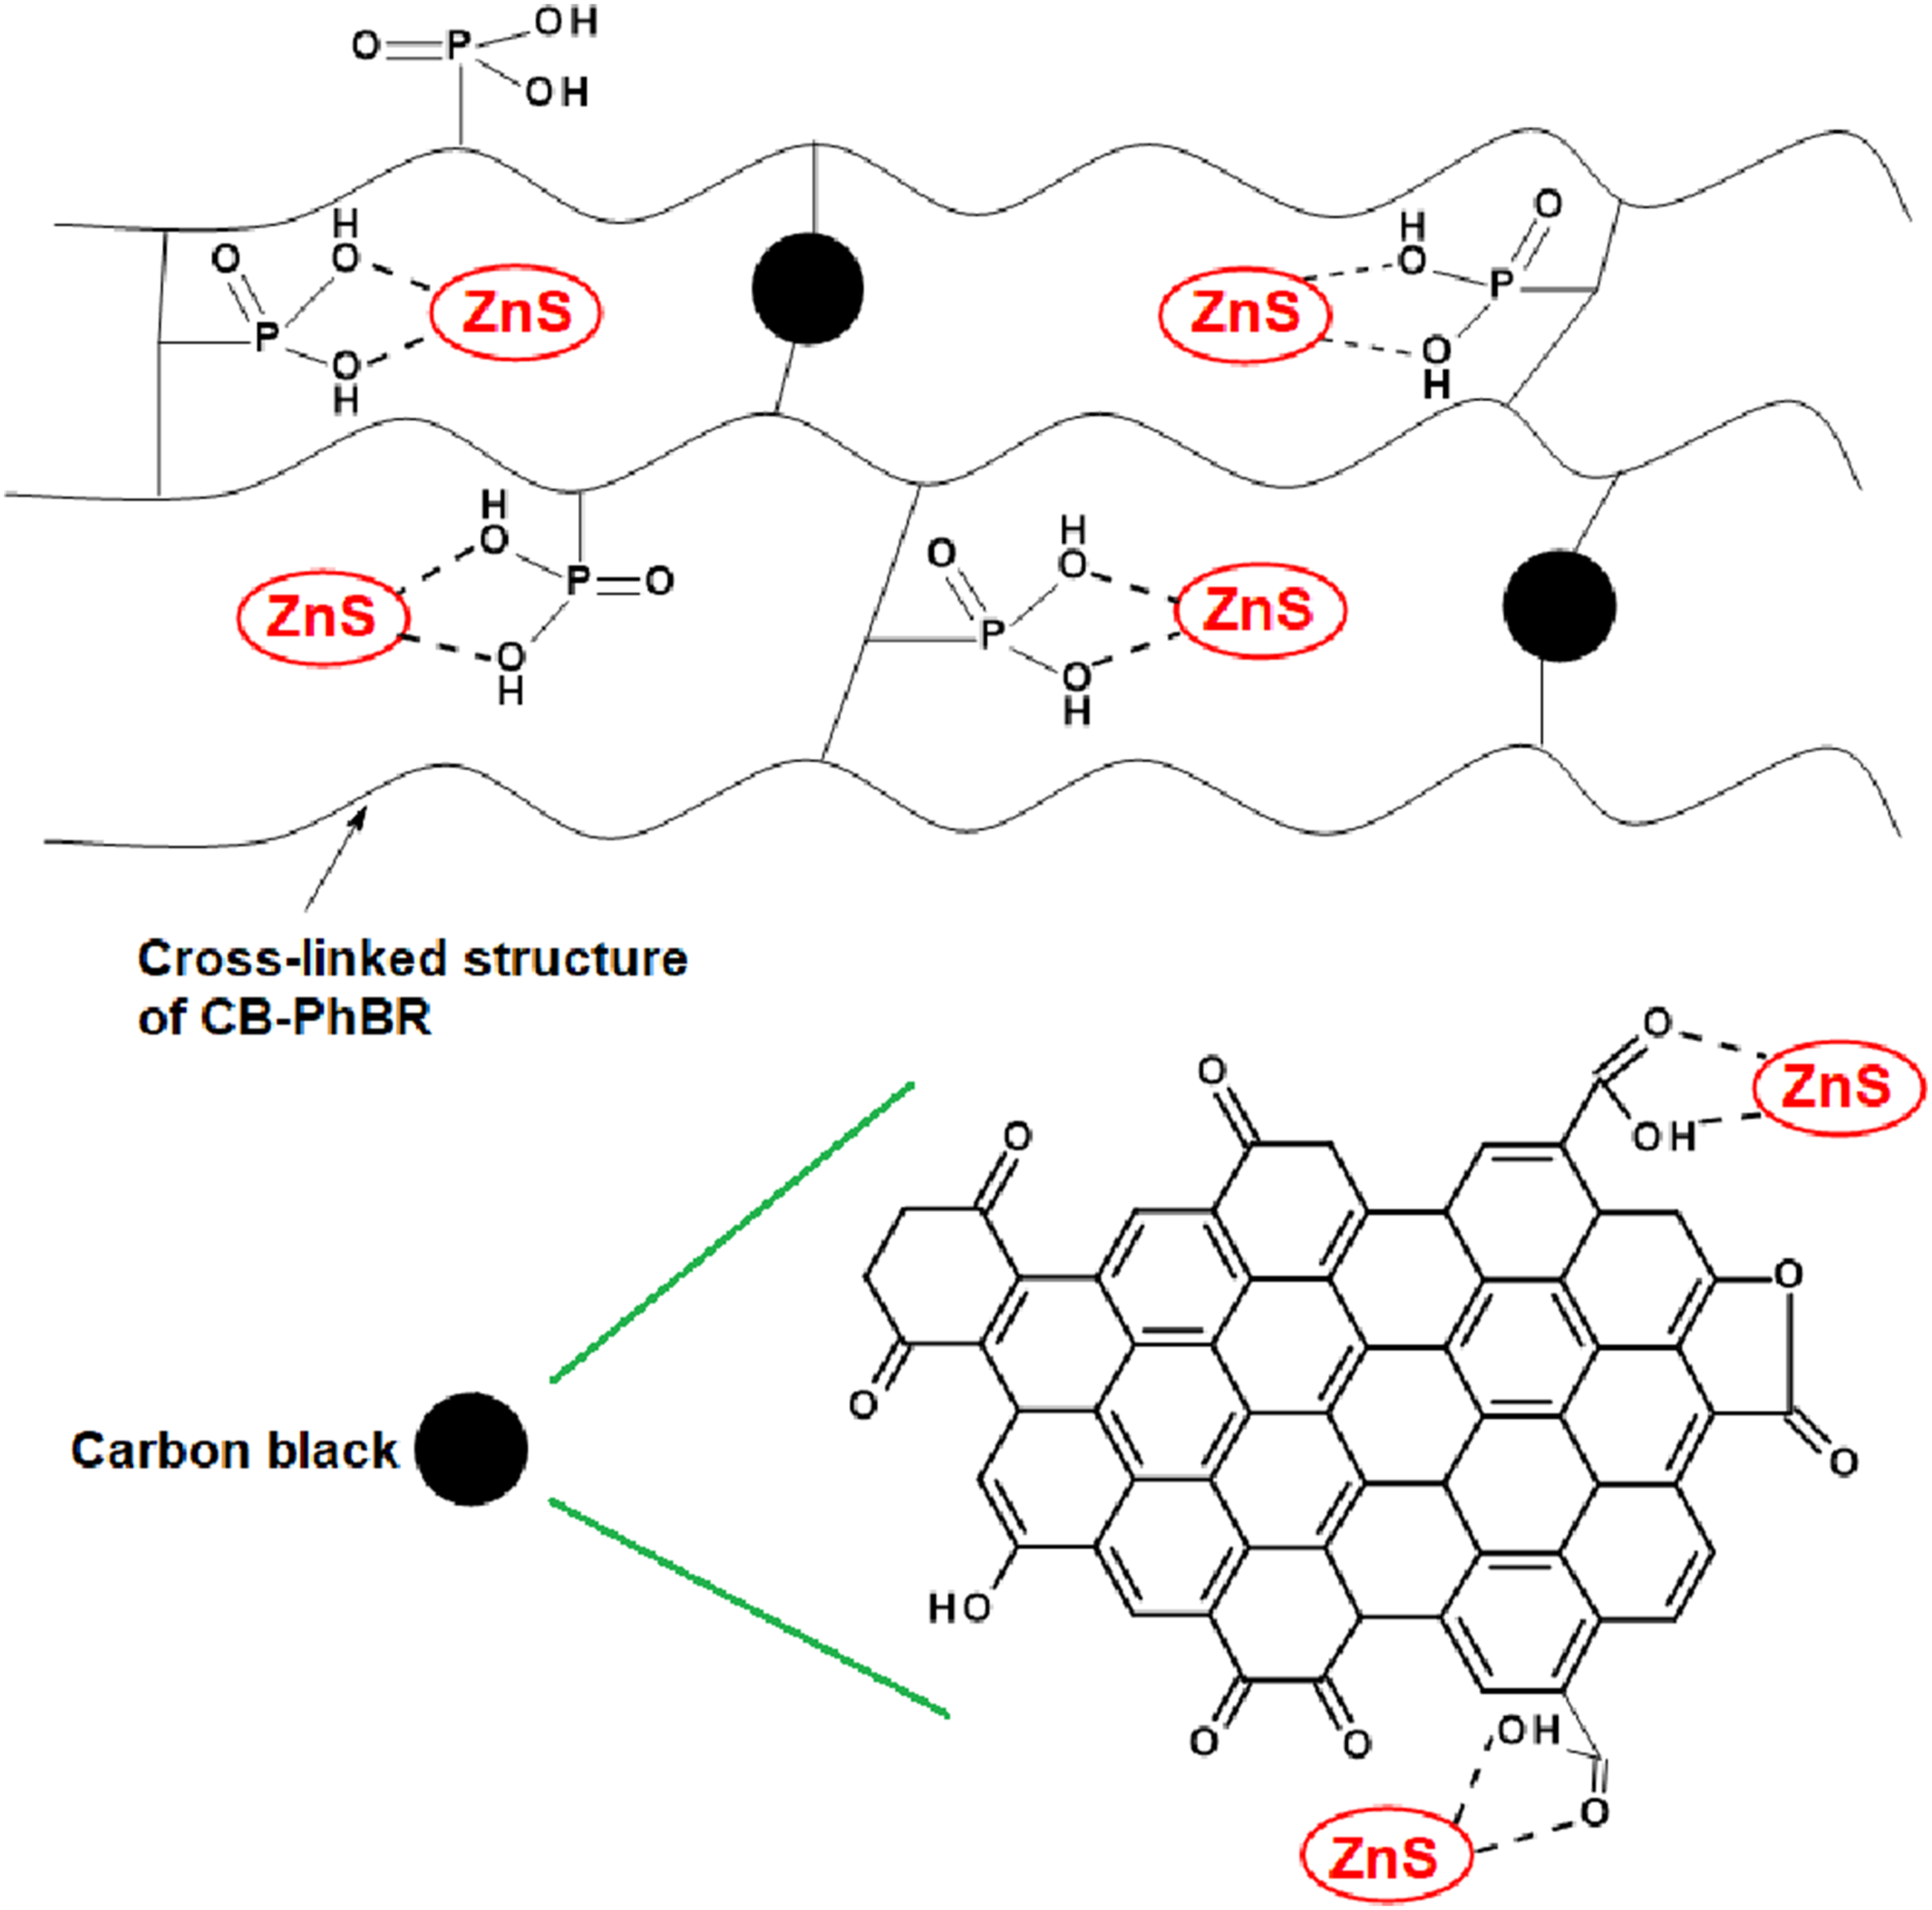
Conclusion
In this study, ZnS NPs were successfully immobilized on a previously developed CB-PhBR matrix using a three-cycle SILAR approach. The main novelty of this work is the use of CB-PhBR not only as an elastomeric composite matrix, but also as a functional support for the controlled immobilization of ZnS NPs at CB-rich and phosphate-functionalized sites.
Structural and morphological analyses confirmed the formation of cubic ZnS NPs and their integration into the CB-PhBR matrix. FTIR results indicated interactions between ZnS NPs and phosphorus-containing groups, while SEM and BET analyses showed clear changes in surface morphology, pore structure, and surface area after ZnS immobilization. XRD analysis showed that ZnS crystallite size decreased after immobilization, and the W-H analysis further indicated the presence of lattice strain, suggesting interfacial constraints between ZnS NPs and the polymer-carbon black matrix.
The incorporation of ZnS NPs significantly modified the functional properties of CB-PhBR. The optical band gap increased from 2.29 eV for CB-PhBR to 3.82 eV for ZnS NPs/CB-PhBR, confirming the transition toward wider-band-gap behavior. Electrical and dielectric measurements showed that ZnS NP immobilization reduced AC conductivity and dielectric permittivity by disrupting the CB percolation network and suppressing interfacial polarization.
Overall, the results demonstrate that SILAR-assisted ZnS immobilization is an effective strategy for tuning the structural, optical, electrical, and dielectric behavior of CB-PhBR-based elastomer nanocomposites. The obtained hybrid material may be promising for dielectric, insulating, UV-optoelectronic, and other functional polymer applications where reduced leakage current, suppressed interfacial polarization, and controlled optical response are required.
Although mechanical reinforcement was not the main focus of this study, the CB-based nature of the matrix and the successful immobilization of ZnS NPs indicate that ZnS NPs/CB-PhBR can serve as a functional hybrid filler system for modified rubber composites.
Supplemental material
Supplemental material - Zinc sulfide nanoparticles immobilized on carbon black as a reinforcing hybrid filler for modified butadiene rubber composites
Supplemental material for Zinc sulfide nanoparticles immobilized on carbon black as a reinforcing hybrid filler for modified butadiene rubber composites by Solmaz B. Aliyeva, Nada M. Edres, Mustafa Soylak, Irada A. Buniyat-zadeh, Nurlana M. Binnetova and Rasim M. Alosmanov in Journal of Thermoplastic Composite Materials
Footnotes
Acknowledgements
Nada Edres is extremely grateful to the Azerbaijan scholarship for citizens of Organisation of Islamic Cooperation member countries for financial support and for giving the chance to join the research group of Prof. Rasim Alosmanov in the Department of Chemistry of High Molecular Compounds, Faculty of Chemistry, Baku State University. Nada Edres would like to thank G.M. Eyvazova and S. J. Mammadyarova (Nano Centre of Baku State University), for their help with the X-ray diffraction analysis and the investigation of the electrical and dielectric properties.
Author contributions
S.B.A and R.M.A. conceived and designed the study. N.M.E. and I.A.B.-Z. synthesized the materials and performed the SILAR immobilization. S.B.A and N.M.B. processed the experimental data and prepared the figures. M.S. contributed to data interpretation and manuscript revision. R.M.A. supervised the project and edited the manuscript. All authors reviewed and approved the final manuscript.
Declaration of conflicting interests
The authors declared no potential conflicts of interest with respect to the research, authorship, and/or publication of this article.
Funding
The authors received no financial support for the research, authorship, and/or publication of this article.
Supplemental material
Supplemental material for this article is available online.
References
Supplementary Material
Please find the following supplemental material available below.
For Open Access articles published under a Creative Commons License, all supplemental material carries the same license as the article it is associated with.
For non-Open Access articles published, all supplemental material carries a non-exclusive license, and permission requests for re-use of supplemental material or any part of supplemental material shall be sent directly to the copyright owner as specified in the copyright notice associated with the article.