
Abstract
This study investigates the influence of cenosphere and graphene nanoplatelet (GNP) reinforcements on the physical, mechanical, and dimensional accuracy characteristics of PLA-based composites fabricated using Fused Filament Fabrication (FFF). The incorporation of cenospheres effectively reduced the composite density from 1.25 g/cm3 for neat PLA to 1.19 g/cm3 and 1.14 g/cm3 for 5 wt% and 10 wt% cenosphere additions, respectively, demonstrating the lightweighting capability of hollow ceramic fillers. The void content increased progressively with reinforcement loading due to increased melt viscosity, particle agglomeration, and localized air entrapment during processing, with values ranging from 2.14% to 8.09% for the reinforced composites. Despite the increase in porosity, graphene nanoplatelets improved the overall stiffness and stress transfer efficiency of the composites through enhanced interfacial interaction and restriction of polymer chain mobility. Mechanical characterization revealed substantial enhancement in hardness, reaching a maximum value of 91.5 Shore D for the hybrid PCG-5 composite, attributed to the synergistic reinforcement effect of rigid cenospheres and high-stiffness graphene nanoplatelets. Dimensional accuracy analysis identified layer thickness as the most influential processing parameter, contributing nearly 79% of the total variation, with lower layer heights consistently improving geometric fidelity. Statistical analyses using Taguchi design, ANOVA, contour mapping, and regression modeling confirmed this trend, while Random Forest regression further validated the experimental findings with a high prediction accuracy (R2 = 0.94) and minimal prediction error. Feature importance analysis also established layer thickness as the dominant governing factor, followed by printing speed and raster angle. Overall, the integration of experimental optimization and machine learning provides an effective framework for improving dimensional precision and mechanical performance in additively manufactured PLA hybrid composites intended for lightweight engineering applications.
Keywords
Introduction
Additive manufacturing (AM) has revolutionized modern material processing by enabling the layer-by-layer fabrication of complex geometries with minimal material wastage and superior design flexibility.1,2 Among the various AM techniques, Fused Filament Fabrication (FFF) has emerged as one of the most widely adopted due to its cost-effectiveness, material versatility, and ability to produce functional prototypes and end-use components directly from computer-aided design (CAD) models.3,4 The rising global emphasis on sustainable manufacturing has further intensified interest in biodegradable thermoplastics such as Polylactic Acid (PLA), derived from renewable sources like corn starch and sugarcane.5,6 PLA offers advantages such as ease of printing, good surface finish, and high stiffness; however, its inherent brittleness, moderate thermal stability, and susceptibility to dimensional inaccuracy constrain its suitability for high-performance engineering applications.7,8
To address these limitations, researchers have increasingly explored the incorporation of micro- and nano-scale reinforcements to modify the structural, thermal, and surface properties of PLA composites. 9 Graphene nanoplatelets (GNPs), known for their exceptional mechanical strength, electrical conductivity, and high surface area, have demonstrated significant potential in enhancing polymer matrix stiffness, hardness, and interlayer bonding during FFF printing. Their inclusion often results in improved mechanical integrity and enhanced dimensional precision. 10 Similarly, hollow cenospheres-lightweight aluminosilicate microspheres derived from industrial fly ash-offer an eco-friendly pathway to reducing composite density while improving stiffness-to-weight ratio. Their spherical morphology promotes uniform stress transfer and improves stability against shrinkage and warpage during the printing process.11,12
While the synergistic use of nanocarbon fillers and lightweight ceramic microspheres has shown promise in improving mechanical and functional performance, limited attention has been given to their combined influence on dimensional accuracy-a critical requirement for functional components in aerospace, automotive, biomedical, and precision tooling sectors. Dimensional accuracy in FFF is highly sensitive to process parameters such as layer thickness, raster angle, and printing speed, which exhibit complex nonlinear interactions affecting warpage, shrinkage, and interlayer adhesion.13,14
To systematically understand these interactions, statistically structured design-of-experiments (DOE) approaches such as the Taguchi method are essential, enabling efficient exploration of multi-parameter effects with minimal experimentation.15–18 Furthermore, analysis of variance (ANOVA) plays a vital role in quantifying the contribution of each process parameter and reinforcement type to the overall variance in dimensional accuracy, density, or hardness, thereby strengthening the scientific reliability of the observations.19–22
The effectiveness of ANOVA and Response Surface Methodology (RSM) in identifying the dominant influence of printing and laser-processing parameters on surface quality and dimensional response of PLA components is proved from the literature. 23 This work highlighted the importance of parameter interaction effects and statistical optimization in improving surface morphology and manufacturing precision of FFF-fabricated polymers.
Taguchi-based ANOVA analysis was used to quantify the contribution of machining parameters toward hole quality characteristics. The study demonstrated that statistically optimized process parameters significantly improve dimensional precision and surface integrity in composite materials. This reinforces the applicability of Taguchi and ANOVA techniques for evaluating process–response relationships in advanced composite manufacturing. 24
Integration of statistical analysis with machine learning prediction approaches was adopted in a study which showed that combining ANOVA with machine learning algorithms enhances prediction reliability and process understanding in additive manufacturing applications. 25 Effectiveness of hybrid statistical optimization techniques in improving process performance of hybrid composites is also demonstrated in literature. 26
Recent studies have demonstrated significant advancements in improving the performance of FFF-printed PLA composites through reinforcement engineering, statistical optimization, and machine learning approaches. Grey Relational Analysis (GRA)-based optimization of PLA/carbon fiber composites highlighted the importance of process parameters in enhancing fracture toughness and structural integrity. 27 Similarly, investigations on PLA composites reinforced with ceramic fillers reported that parameters such as layer thickness, printing speed, and raster angle strongly influence mechanical performance, dimensional stability, and interlayer bonding characteristics. 28
Studies on PLA/Lawsonia inermis and PLA/Henna biocomposites further demonstrated that reinforcement dispersion and interfacial interaction play a critical role in improving stiffness, hardness, and structural performance of biodegradable polymer composites. 29 Machine learning-assisted prediction of PLA/wood composite properties confirmed that supervised learning models can effectively capture process–property relationships in additive manufacturing applications. 30 In addition, statistical and metaheuristic optimization studies on PLA/wood composites established that hybrid optimization techniques significantly improve process reliability and dimensional precision.31,32
Recent investigations on PLA/graphene nanocomposites also reported substantial enhancement in mechanical and thermal properties due to improved stress transfer efficiency and restricted polymer chain mobility imparted by graphene nanoplatelets. These findings support the present investigation, where graphene and cenosphere reinforcements improved hardness and lightweight characteristics of PLA composites. 33 Overall, the existing literature confirms that integrating reinforcement modification, statistical analysis, and machine learning approaches is highly effective for optimizing the performance of FFF-fabricated PLA hybrid composites.
Beyond classical statistical tools, machine learning (ML) has recently emerged as a powerful predictive framework capable of capturing nonlinear relationships between process parameters and printed part quality. Integrating ML with experimental results enhances predictive accuracy, supports parameter optimization, and provides deeper insights into parameter–response behaviors.34,35
Therefore, this study aims to develop and characterize sustainable hybrid PLA composites reinforced with cenospheres and graphene nanoplatelets, while simultaneously optimizing density, hardness, void content, and dimensional accuracy using a combined Taguchi–ANOVA-machine-learning framework. This integrated approach enables a comprehensive evaluation of filler composition and FFF process parameters, supporting the development of dimensionally stable, lightweight, and high-performance composite structures suitable for aerospace, automotive interiors, and next-generation sustainable product design.
Materials and methods
Materials used
Polylactic Acid (PLA), cenospheres, and graphene nanoplatelets (GNPs) were selected as the main constituents for developing the composite materials because of their complementary physical and mechanical characteristics. PLA, a biodegradable thermoplastic polymer derived from renewable resources such as corn starch, was used as the primary matrix material. It offers good printability, moderate mechanical strength, and dimensional stability, making it highly suitable for additive manufacturing applications.
Cenospheres, lightweight hollow spherical particles obtained from industrial fly ash a by-product of coal combustion in thermal power plants were incorporated as fillers to reduce the overall density of the composite. Their low density, good compressive strength, and thermal resistance make them ideal for lightweight structural applications such as automotive and aerospace components.
To further enhance the mechanical and functional performance of the composites, Graphene Nanoplatelets (GNPs) were introduced as secondary nano-reinforcements. Graphene, a single layer of carbon atoms arranged in a hexagonal lattice, exhibits exceptional properties such as very high tensile modulus (≈1 TPa), superior thermal conductivity (≈5000 W/mK), and excellent electrical conductivity. Even at very low weight fractions, GNPs can significantly improve stiffness, thermal stability, and interfacial bonding in polymer matrices.
The combination of PLA, cenospheres, and graphene nanoplatelets aims to achieve a lightweight, strong, and multifunctional composite suitable for advanced structural and functional applications. The raw materials used for the preparation of the proposed composites are shown in Figure 1. Raw materials used in preparation of proposed composites.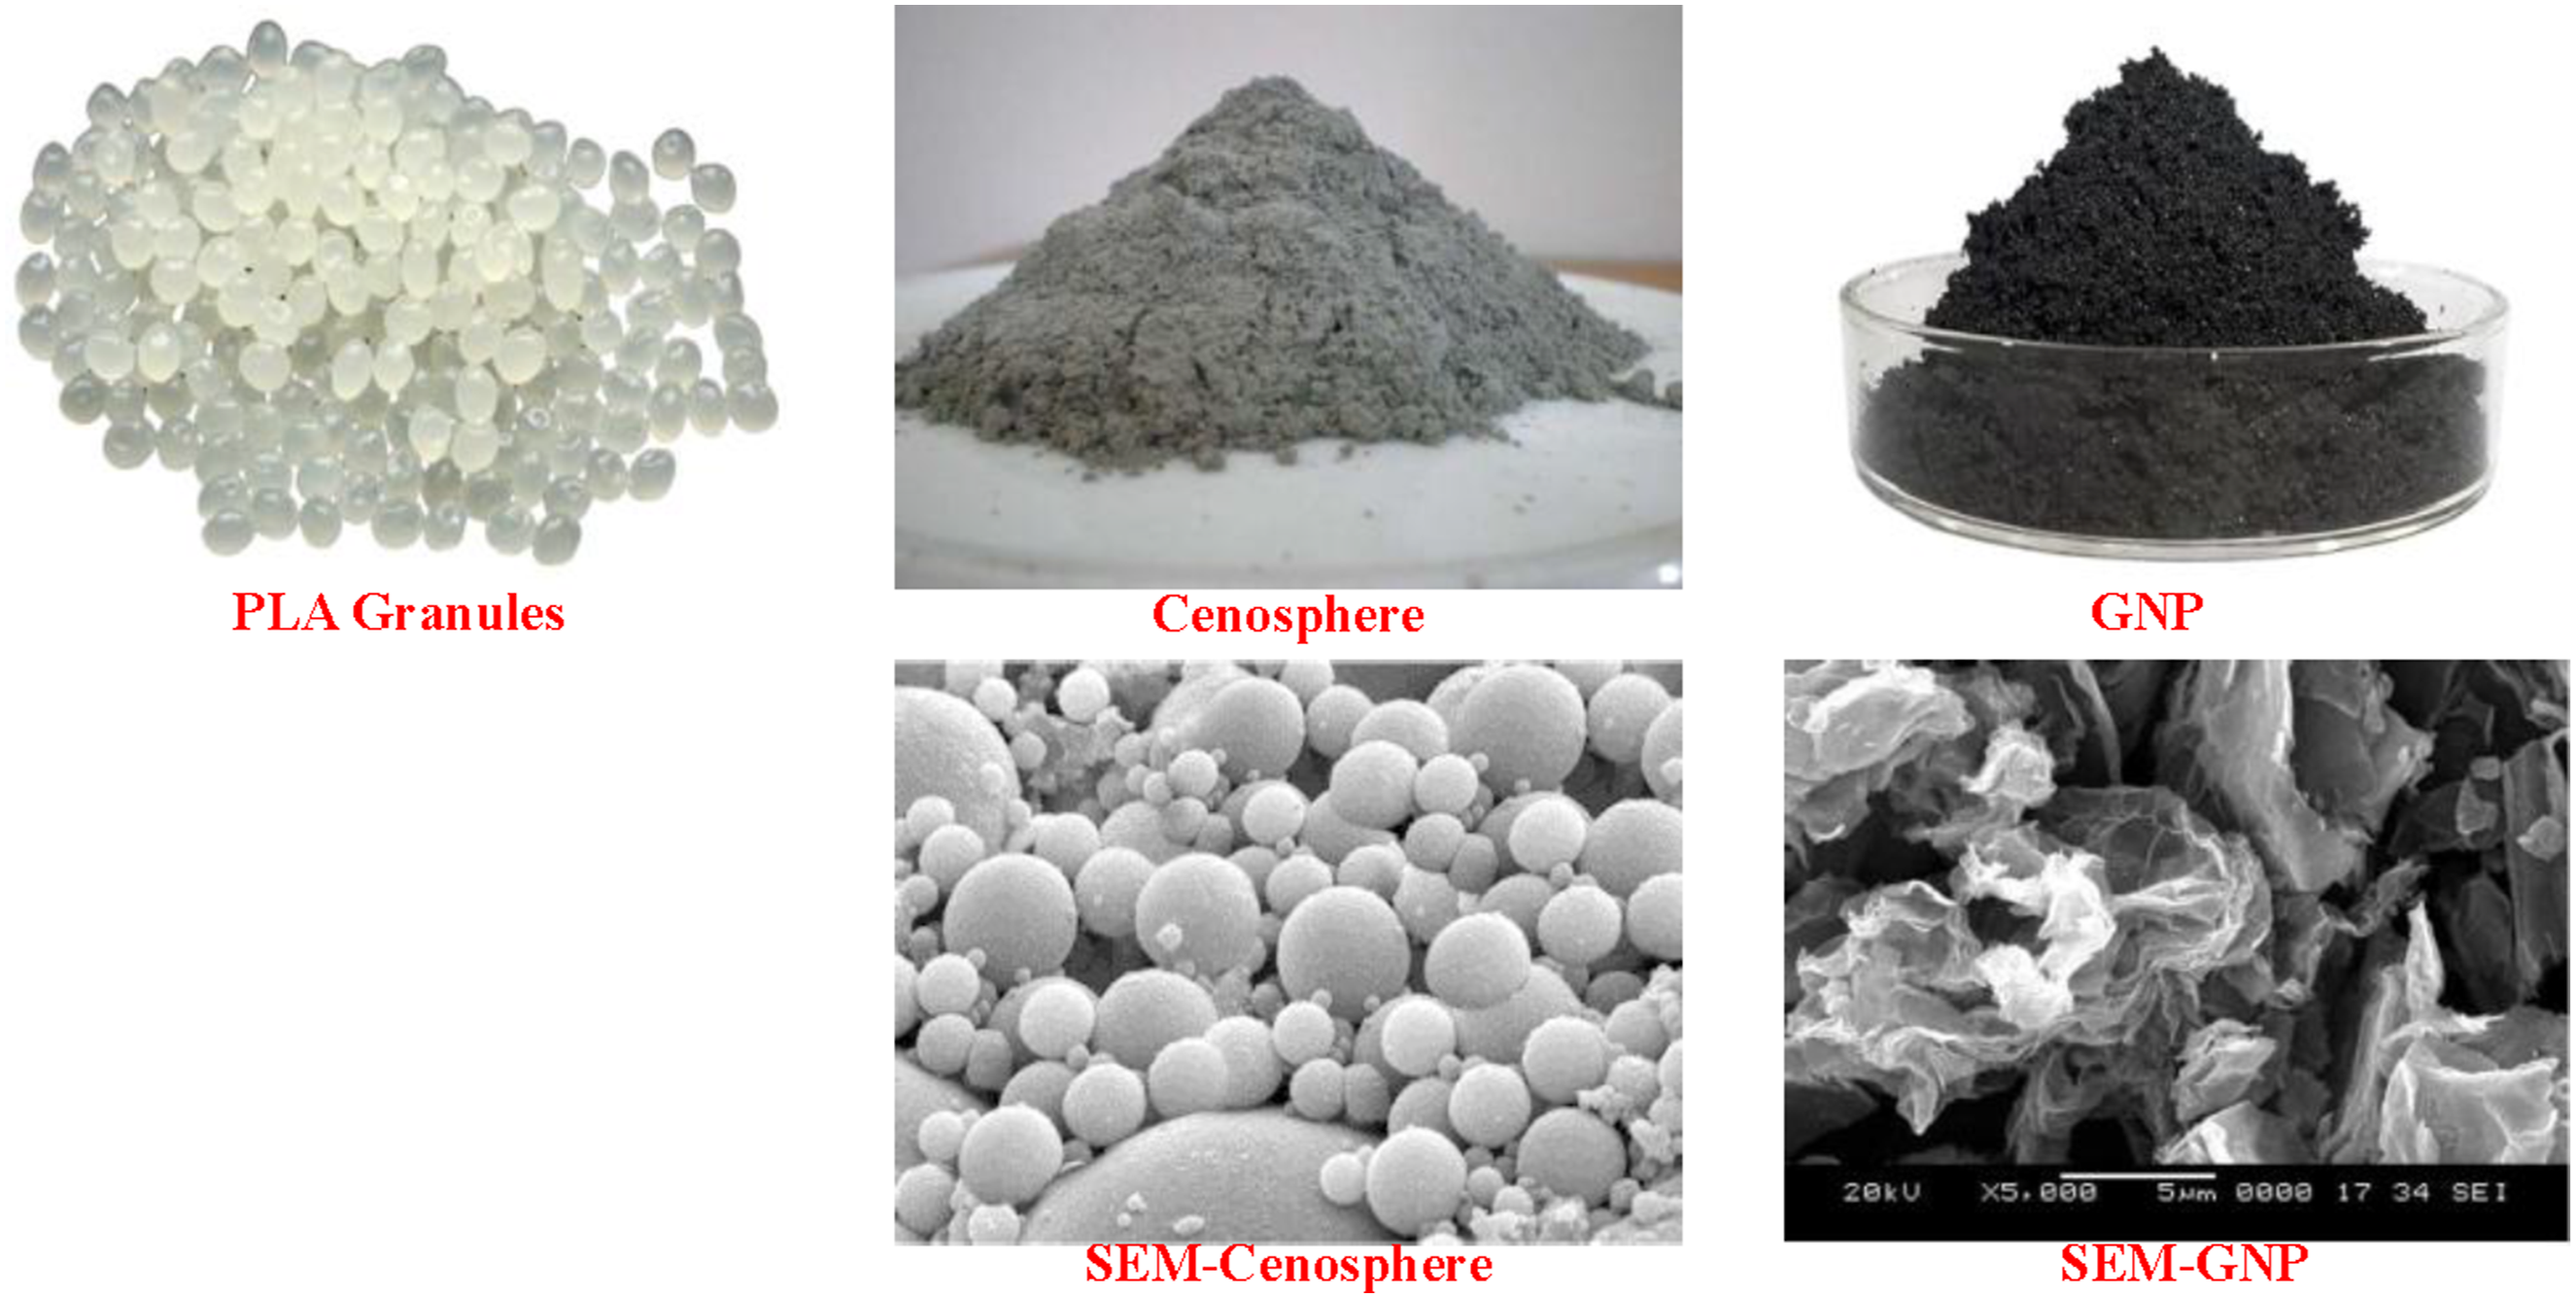
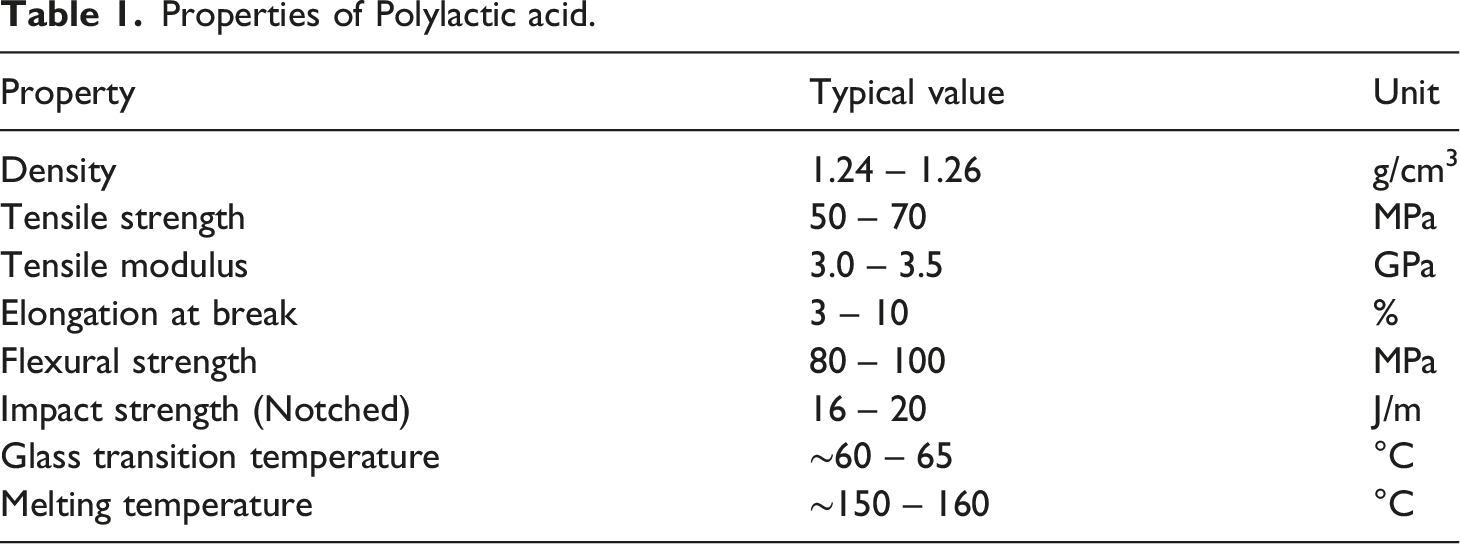
Properties of Polylactic acid.
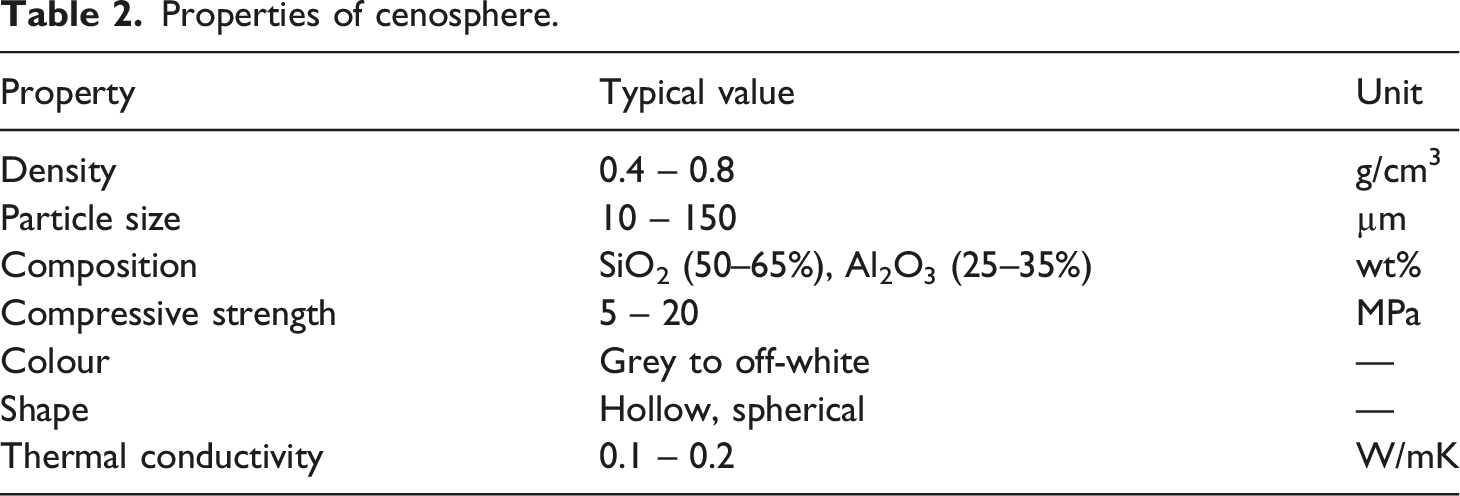
Properties of cenosphere.
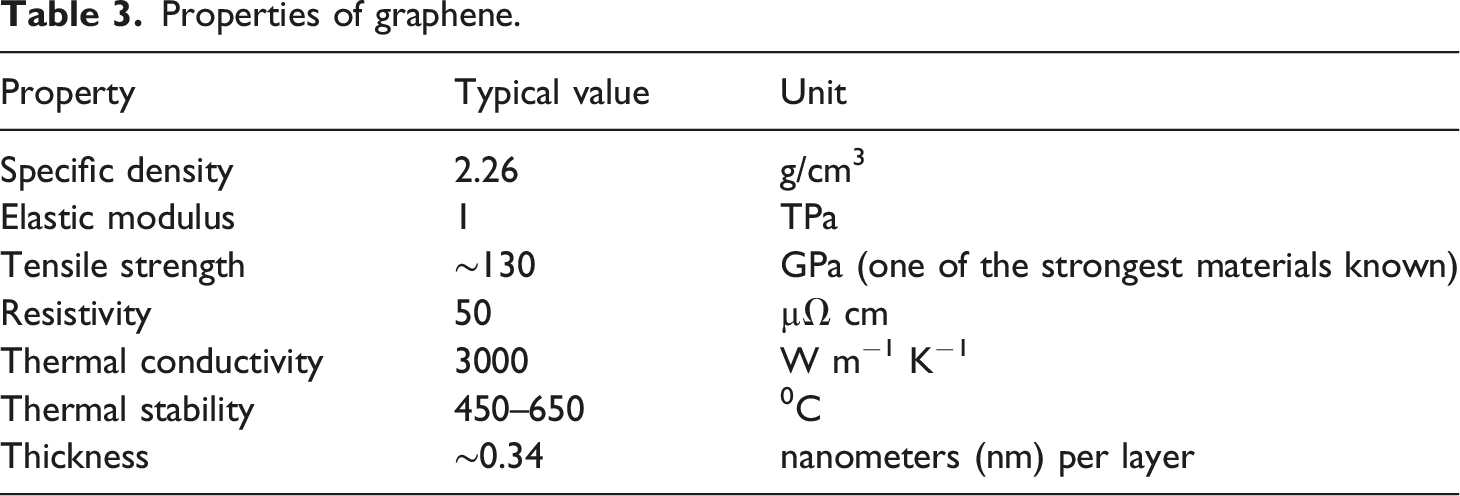
Properties of graphene.
Composite formulation
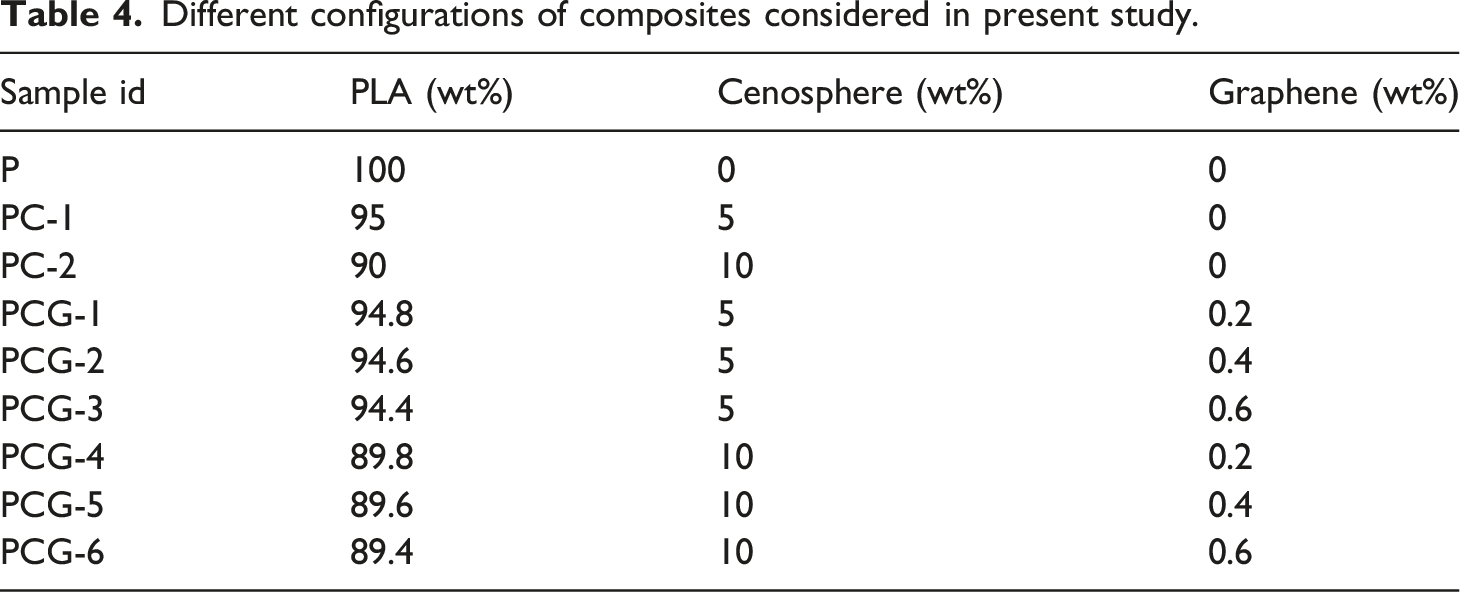
Different configurations of composites considered in present study.
The steps involved in preparation of composite granules are presented in Figure 2. Steps involved in preparation of composite granules.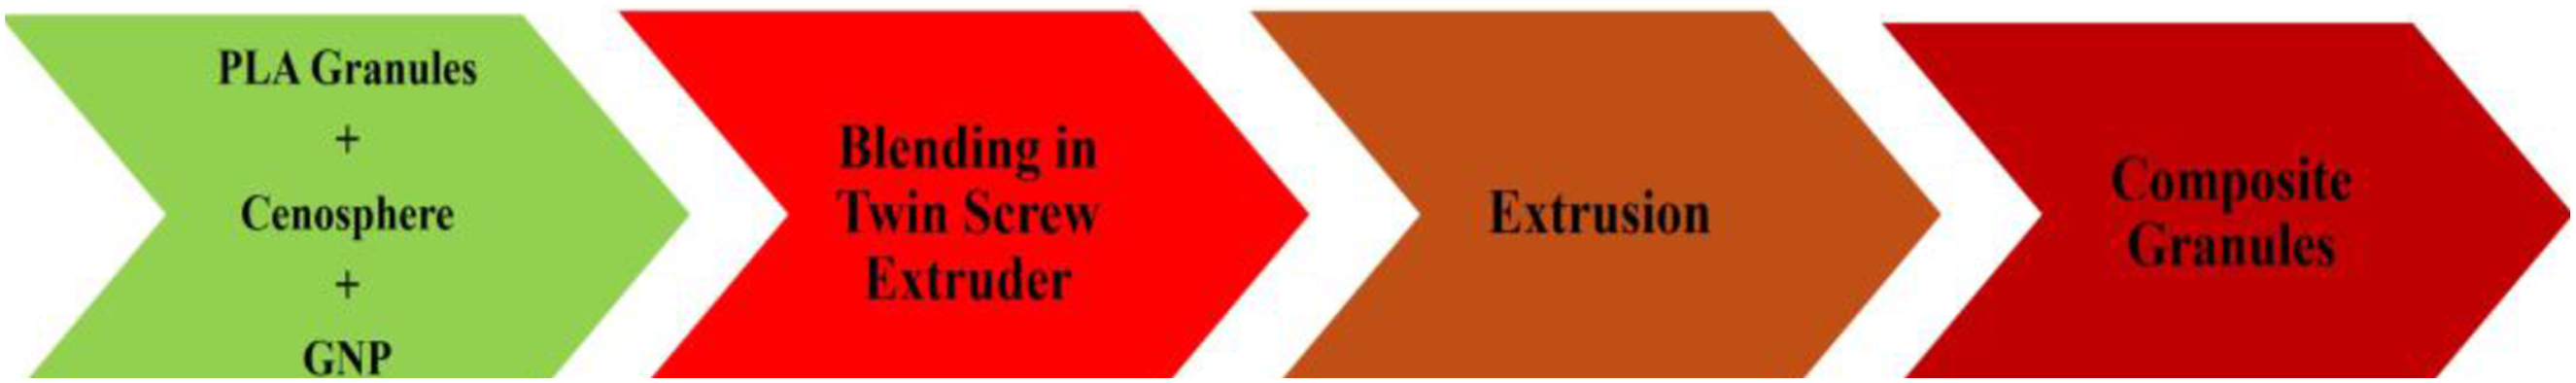
Composite filament preparation
The preparation of composite filaments suitable for 3D printing is a critical step that directly influences the printability and mechanical performance of the final components. In this study, composite filaments were prepared by integrating Cenosphere and Graphene into a PLA matrix using melt compounding and extrusion techniques. The process involved the following systematic steps as presented in Figure 3(a). (a) Steps involved in composite filament preparation; (b) produced filaments.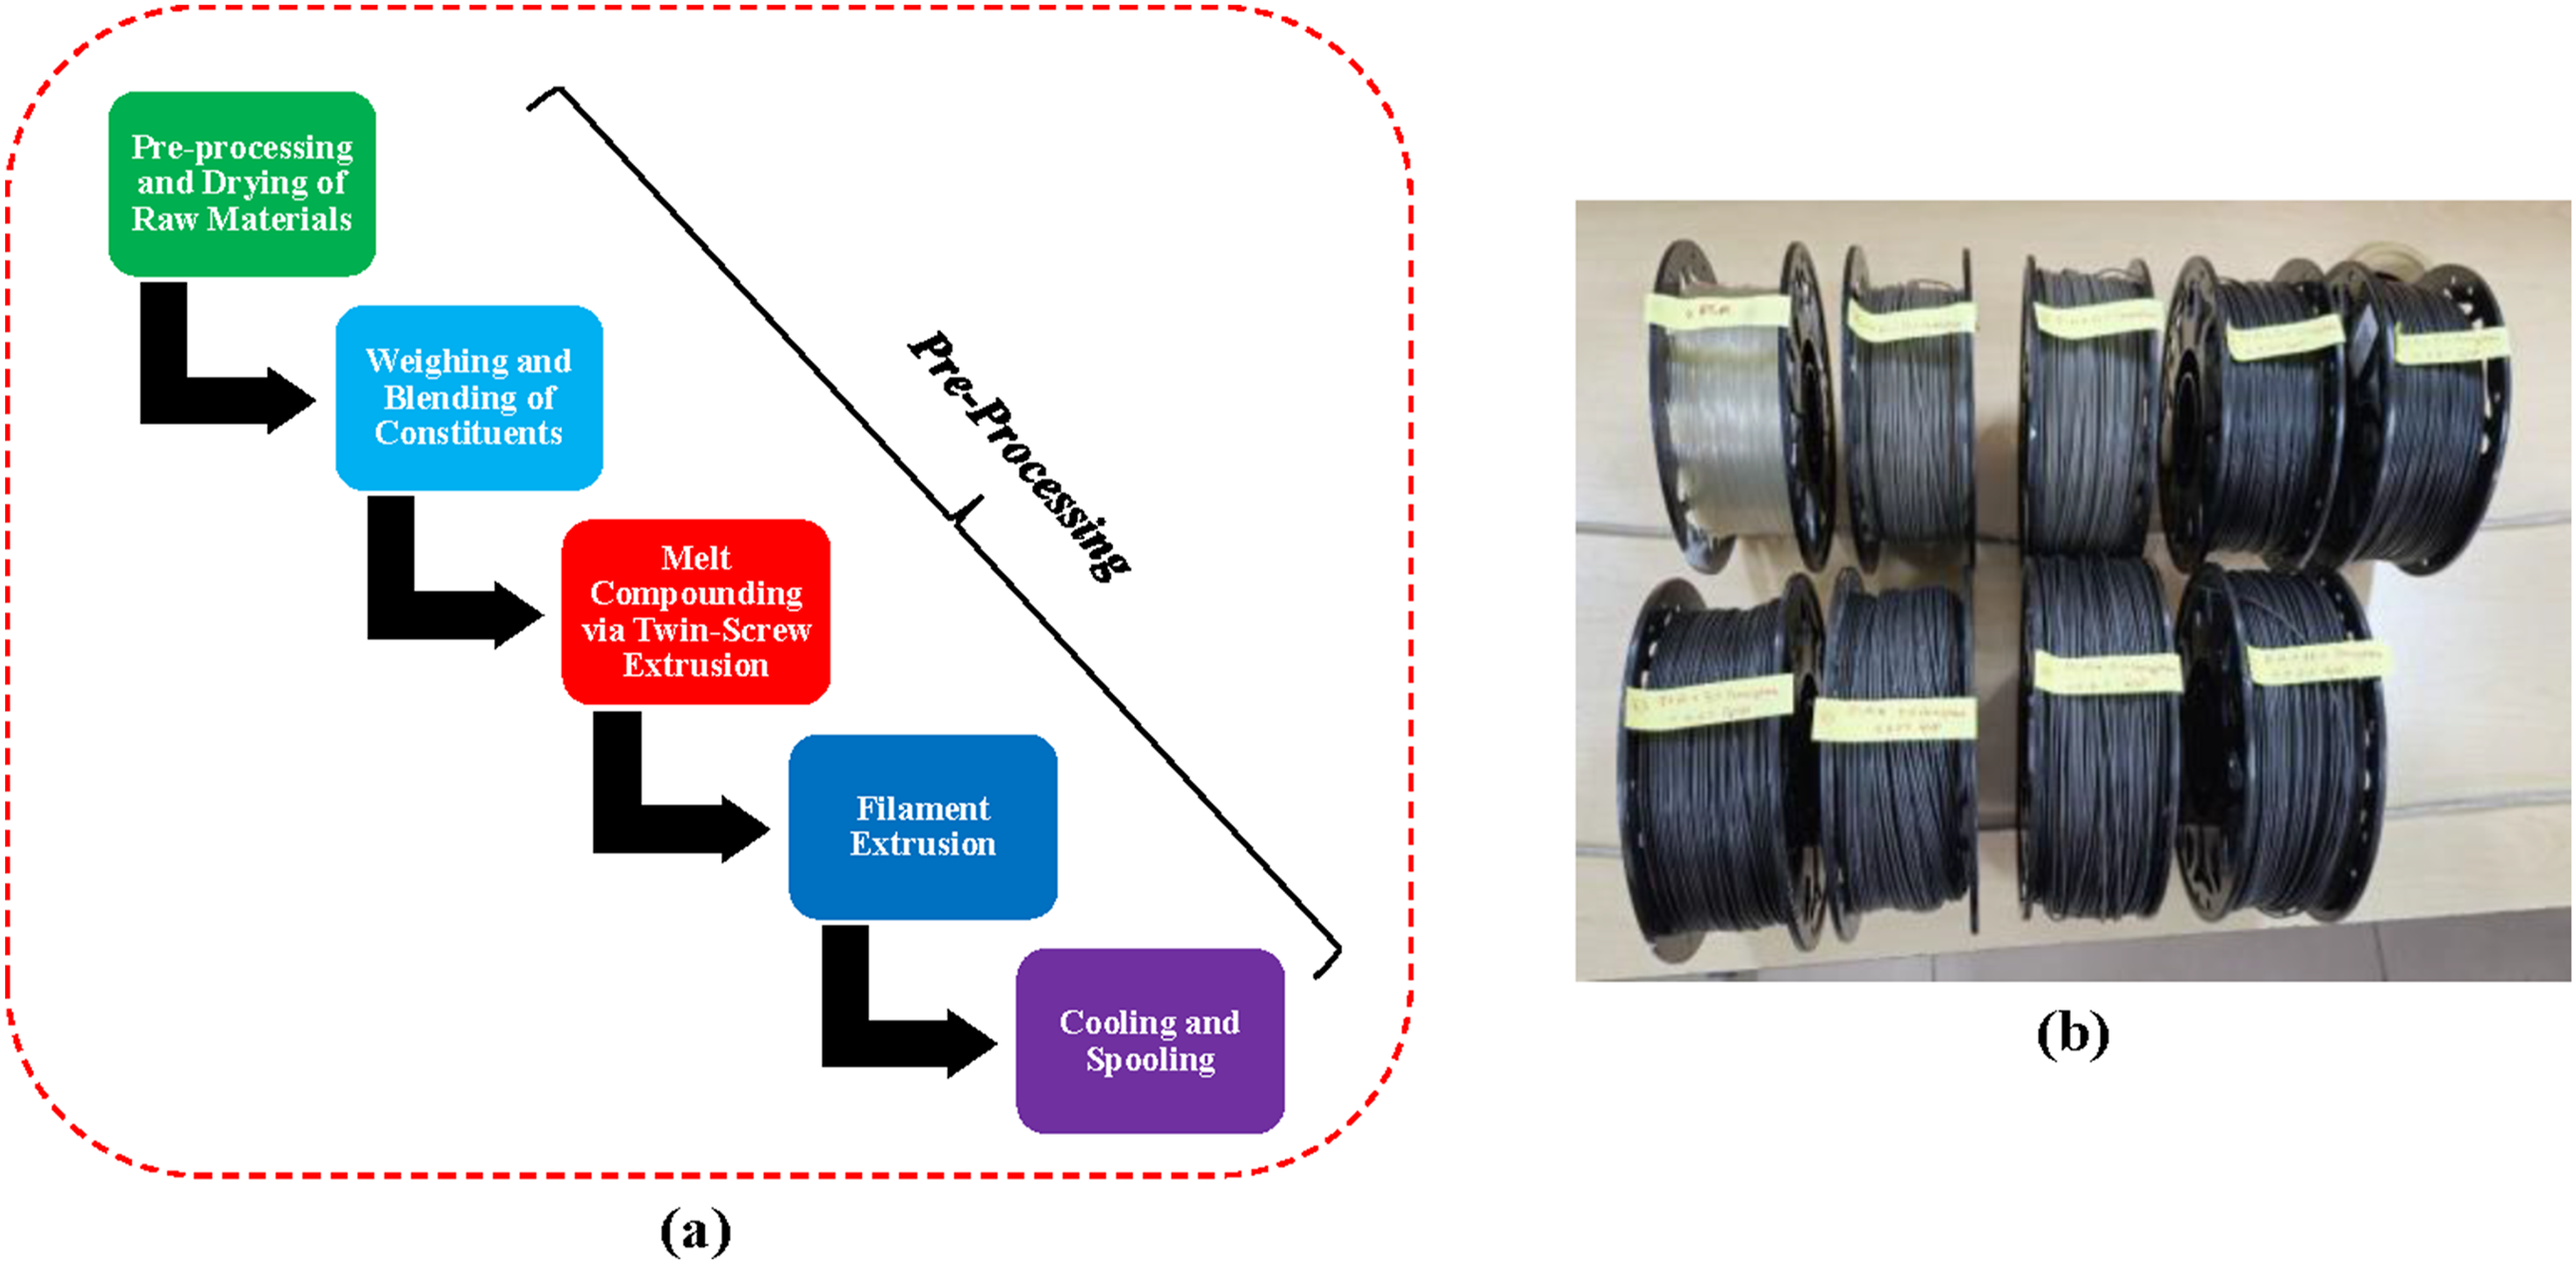
Before compounding, PLA pellets, cenospheres, and graphene were thoroughly dried to eliminate moisture that could compromise interfacial adhesion and mechanical performance. PLA was dried at 60°C for 6 hours, cenospheres at 100°C for 2 hours, and graphene under vacuum at 80°C for 4 hours. Dried materials were stored in airtight desiccators. Accurately weighed proportions of PLA, cenospheres, and graphene, based on specific formulations, were manually blended for 10 minutes to ensure initial homogeneity. The dry-blended mix was then processed in a co-rotating twin-screw extruder (L/D 24:1) at 60 r/min, with barrel temperatures ranging from 170°C to 190°C, to achieve uniform dispersion. The extrudate was air-cooled, pelletized, and stored in vacuum-sealed containers. These composite pellets were subsequently extruded into 1.75 mm filaments using a single-screw extruder at 180-190°C and 20-30 r/min. An inline laser micrometer and feedback-controlled puller maintained dimensional accuracy within ±0.05 mm. The filaments were water-cooled (∼25°C), straightened with calibrated rollers, spooled, and redried at 50°C for 2 hours. Final filaments were inspected for uniformity and defects, then stored in vacuum-sealed bags with desiccants. Thus, produced filaments are presented in Figure 3(b). Before 3D printing, filaments were redried at 50°C for 3 hours to ensure consistent printability and mechanical behavior.
3D printing
A popular 3D printing technique called fused filament fabrication (FFF) provides a flexible and affordable platform for creating composites with complex geometries and regulated microstructures. Figure 4 depicts the standard FFF process flow. Standard FFF process flow.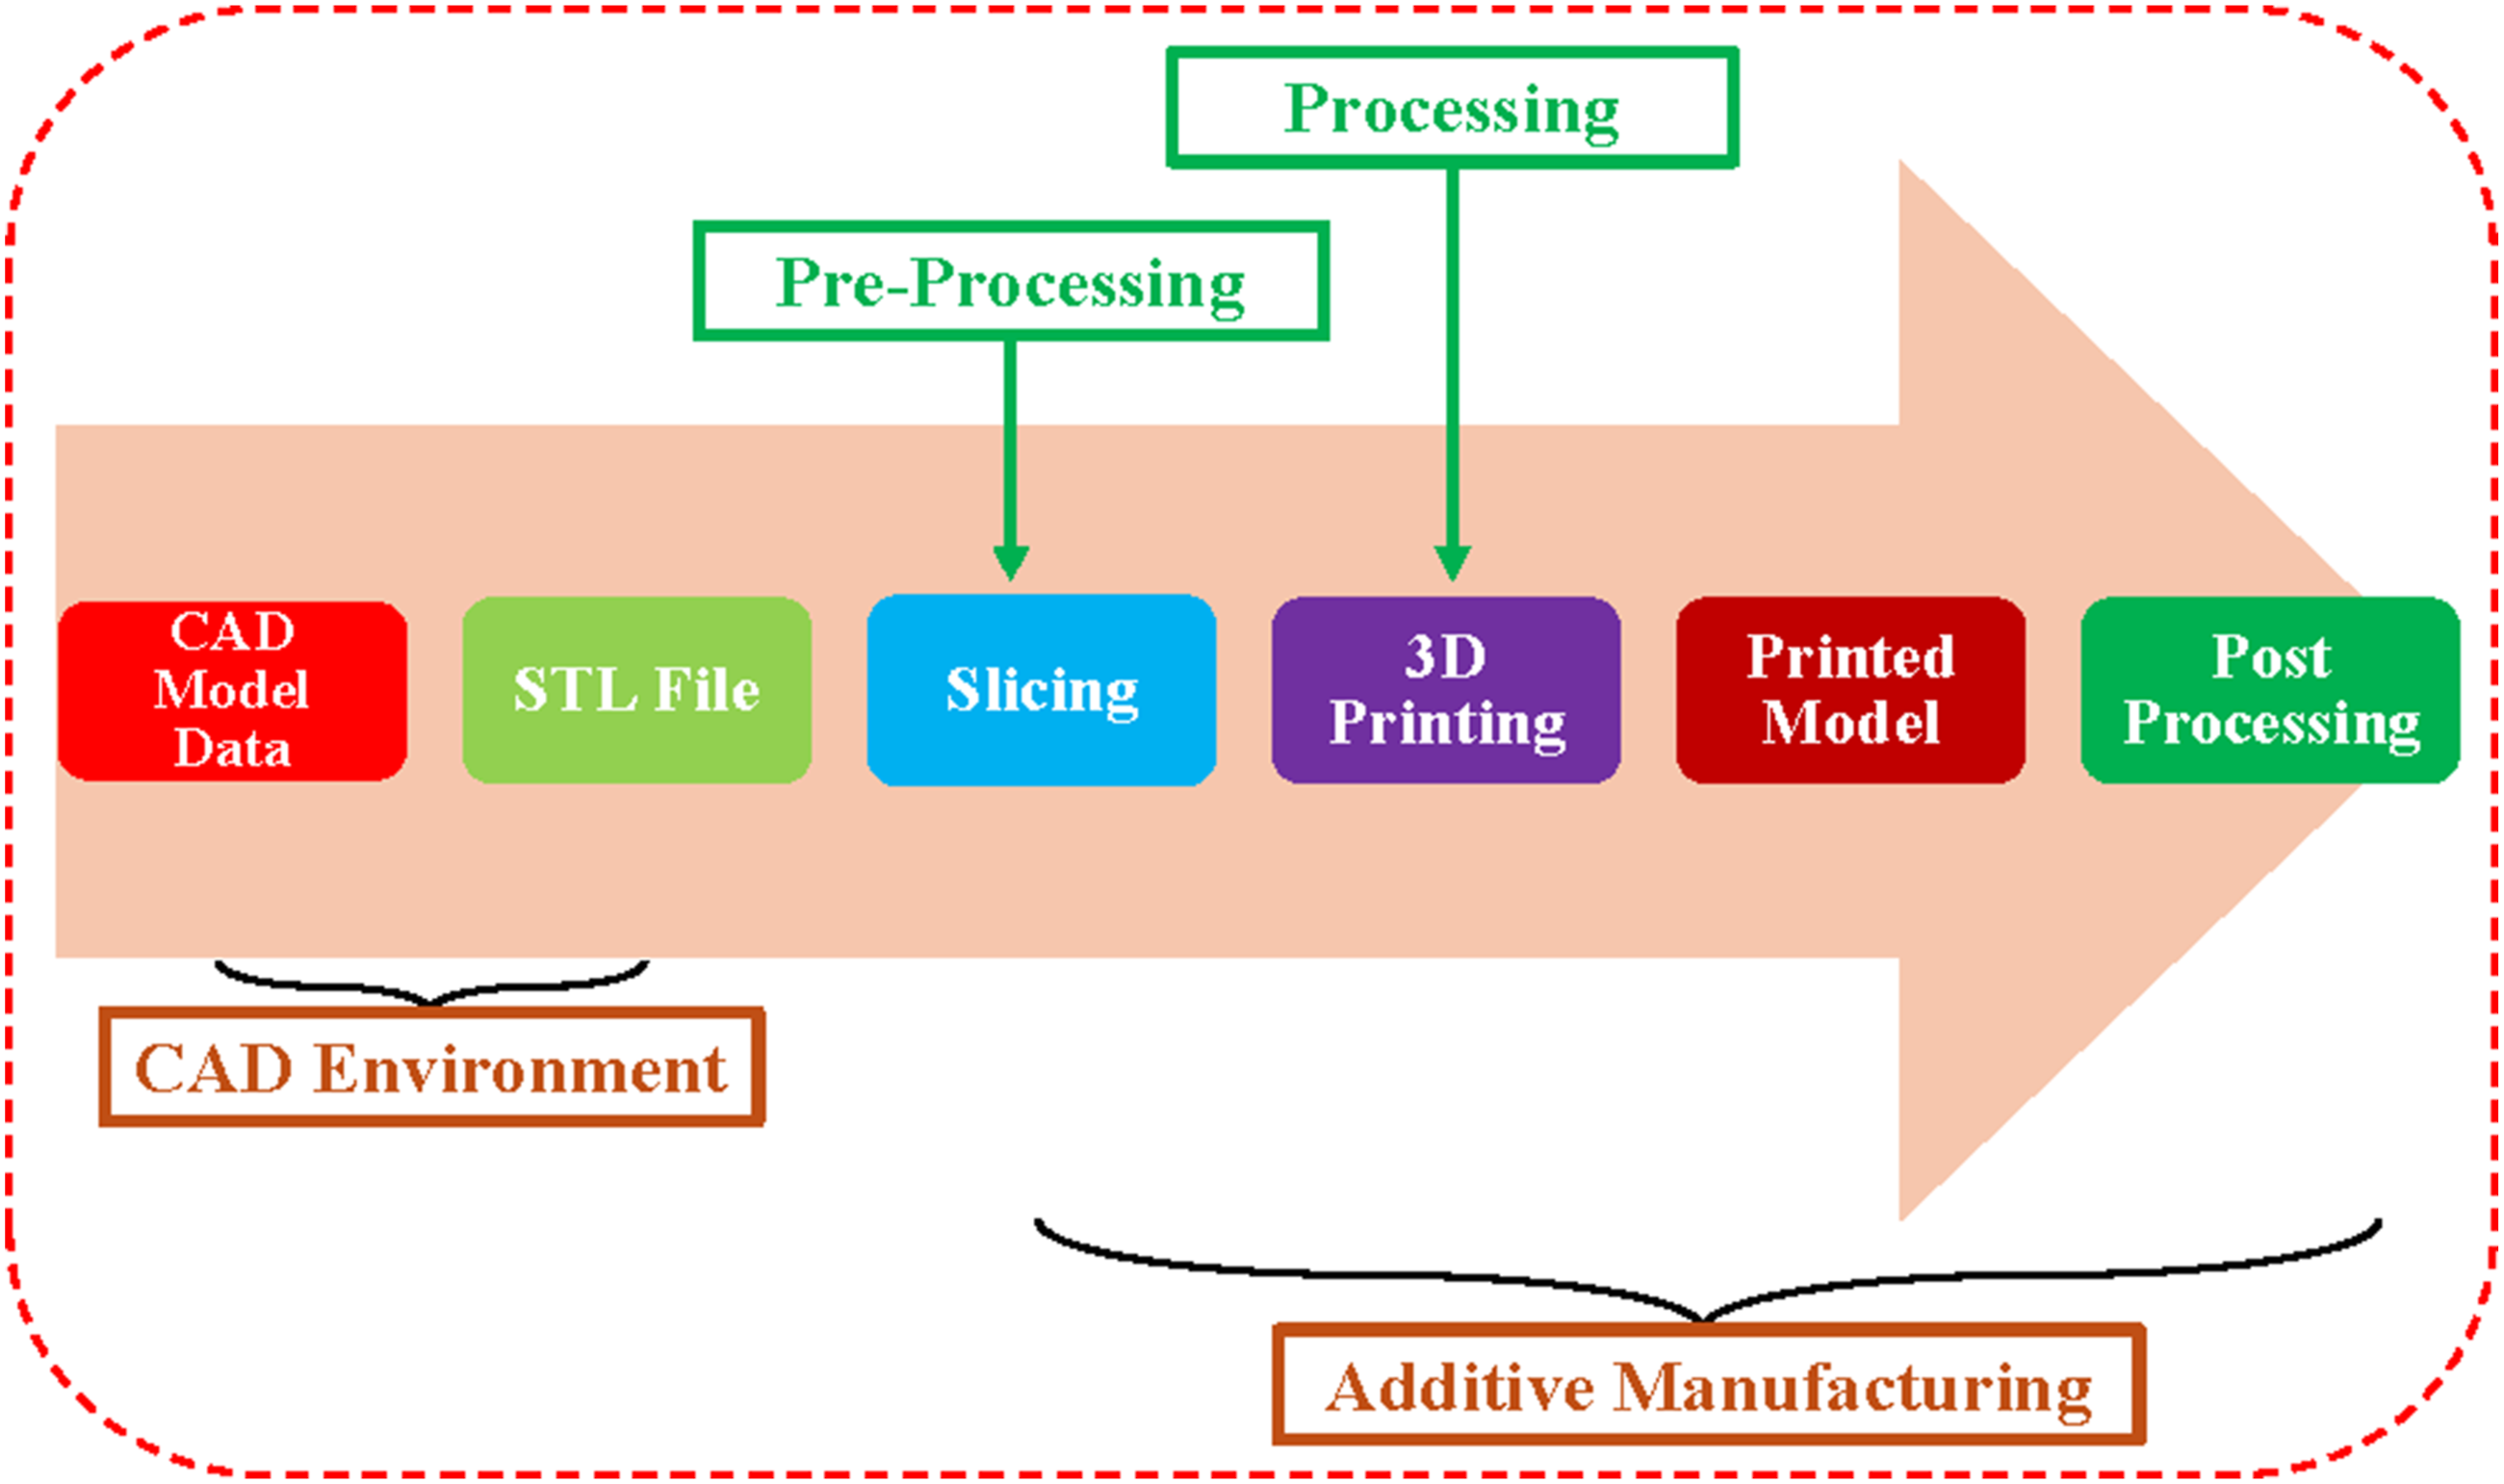
The compounded filaments obtained through twin screw extruder were used to print the specimens for characterization using customized 3D printer as presented in Figure 5. Schematic of 3D printing and 3D printer used in present study.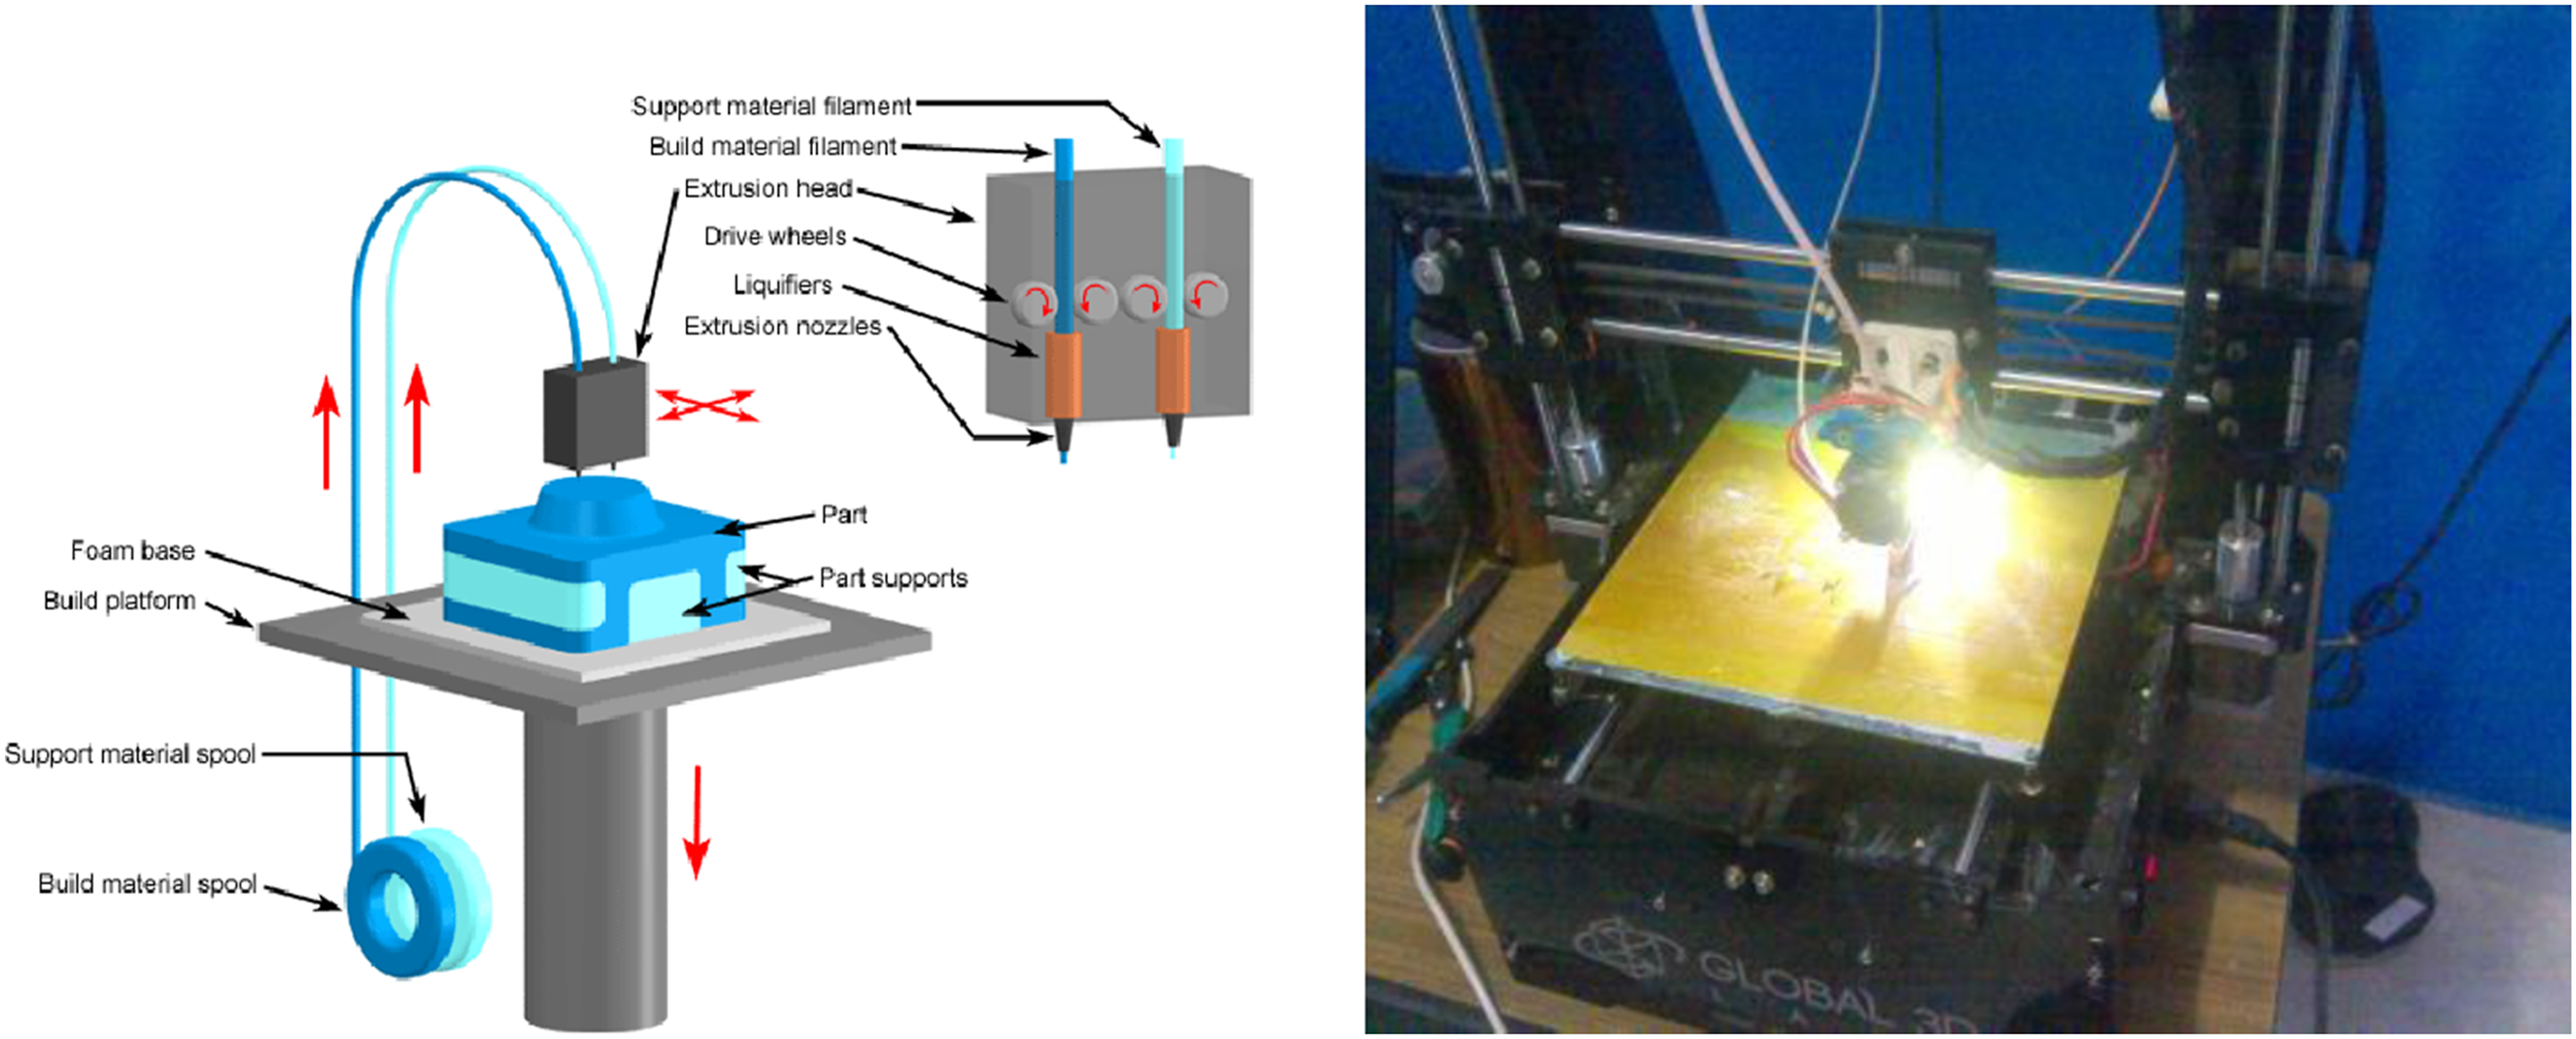
Figure shows the principle and working of Fused Filament Fabrication technology. In process the material used to build parts will be in the form of spool of thin wire along with support material. The filament is passed through extruder head which consists of drive wheels for the downward movement where the thin wire gets liquefied at a certain temperature and flows through extruder and passes into micron sized nozzle head through which first layer is formed on build platform and the process takes place layer by layer and the parts are manufactured according to the CAD designs as explained in above segments.
Density
The experimental density (ρe) of the fabricated PLA, PLA-Cenosphere (PC), and PLA-Cenosphere-Graphene (PCG) composite specimens was determined as per Archimedes’ principle in accordance with ASTM D792-13. Samples (approximately 50 × 50 × 6.4 mm3) were used for testing. Each specimen was first weighed in air (Wa) using a digital precision balance with a resolution of ±0.001 g and subsequently weighed when fully immersed in distilled water (Ww). The density was calculated using the relation as presented in equation (1).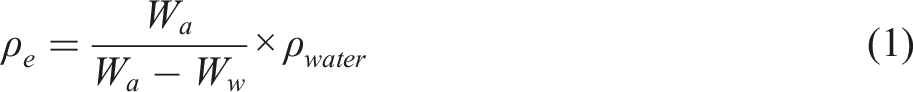
The theoretical density (ρt) was estimated using the rule of mixtures, considering the weight fractions and true densities of each constituent phase (matrix and fillers). The densities used for calculation were: PLA = 1.25 g/cm3, cenospheres = 0.7 g/cm3, and graphene nanoplatelets (GNPs) = 2.2 g/cm3. The theoretical density was obtained from equation (2).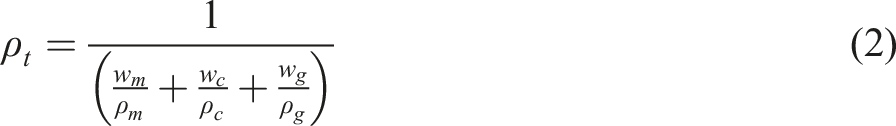
The void content (Vᵥ) quantifies the fraction of air voids or porosity present in the composite that arises during extrusion or 3D printing. It was evaluated by comparing the experimental and theoretical densities using equation (3).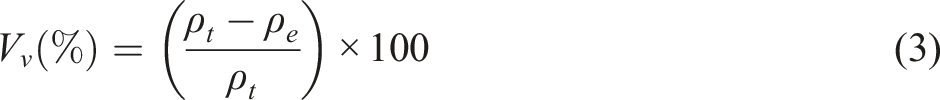
A lower void percentage indicates better filler dispersion, stronger interfacial adhesion, and optimal process control during additive manufacturing.
The combination of density and void content measurements enables the assessment of composite quality and uniformity. The experimental density reflects the actual packing efficiency of the polymer-filler system, while the theoretical density serves as a benchmark. Any significant deviation between the two highlights process-induced defects such as micro-porosity, incomplete fusion between filaments, or filler agglomeration.
Hardness
The surface hardness of the 3D-printed PLA, PLA-Cenosphere (PC), and PLA-Cenosphere-Graphene (PCG) composites was determined using a Shore D durometer in accordance with ASTM D2240, which is widely employed for testing rigid and semi-rigid polymeric materials. The test specimens were printed with flat and smooth top surfaces, maintaining a minimum thickness of 6 mm to ensure that the substrate did not influence the measurements. Before testing, all samples were conditioned for 24 hours at a temperature of 23 ± 2°C and a relative humidity of 50 ± 5%, allowing them to reach thermal and moisture equilibrium.
A calibrated Shore D hardness tester with a resolution of 0.5 Shore units was used for the measurements. The durometer was positioned perpendicular to the specimen surface, and the indenter was applied smoothly until full contact was achieved between the presser foot and the specimen surface. The hardness reading was recorded after maintaining contact for approximately 1 to 3 seconds, as recommended by the standard. For each specimen, five readings were taken at different, well-separated locations to minimize interaction effects between indentation points. This procedure was repeated for three replicate specimens of each composition to ensure reproducibility and statistical reliability.
The average hardness value and standard deviation were calculated from all valid readings to represent the mean surface hardness for each formulation. The results were later presented as mean and compared across different compositions to study the influence of filler type and concentration. A consistent testing environment and dwell time were maintained for all samples to ensure uniformity.
The hardness test provided insight into the surface resistance and stiffness enhancement achieved through the incorporation of cenospheres and graphene nanoplatelets. While Shore D hardness reflects surface behavior, it also correlates with the bulk mechanical integrity of the printed specimens, making it a valuable metric to assess the reinforcing effect of the fillers in the developed PLA-based composites.
Dimensional accuracy analysis
The evaluation of density, hardness, and void content was crucial in determining the structural integrity and compactness of the fabricated composites. The composite that demonstrated optimal property balance was identified as the most efficient formulation. To validate its performance in terms of manufacturability, a dimensional accuracy study was carried out on samples printed as shown in Figure 6, establishing a link between material composition and geometric precision of the printed part. Schematic and printed samples of dimensional accuracy specimen.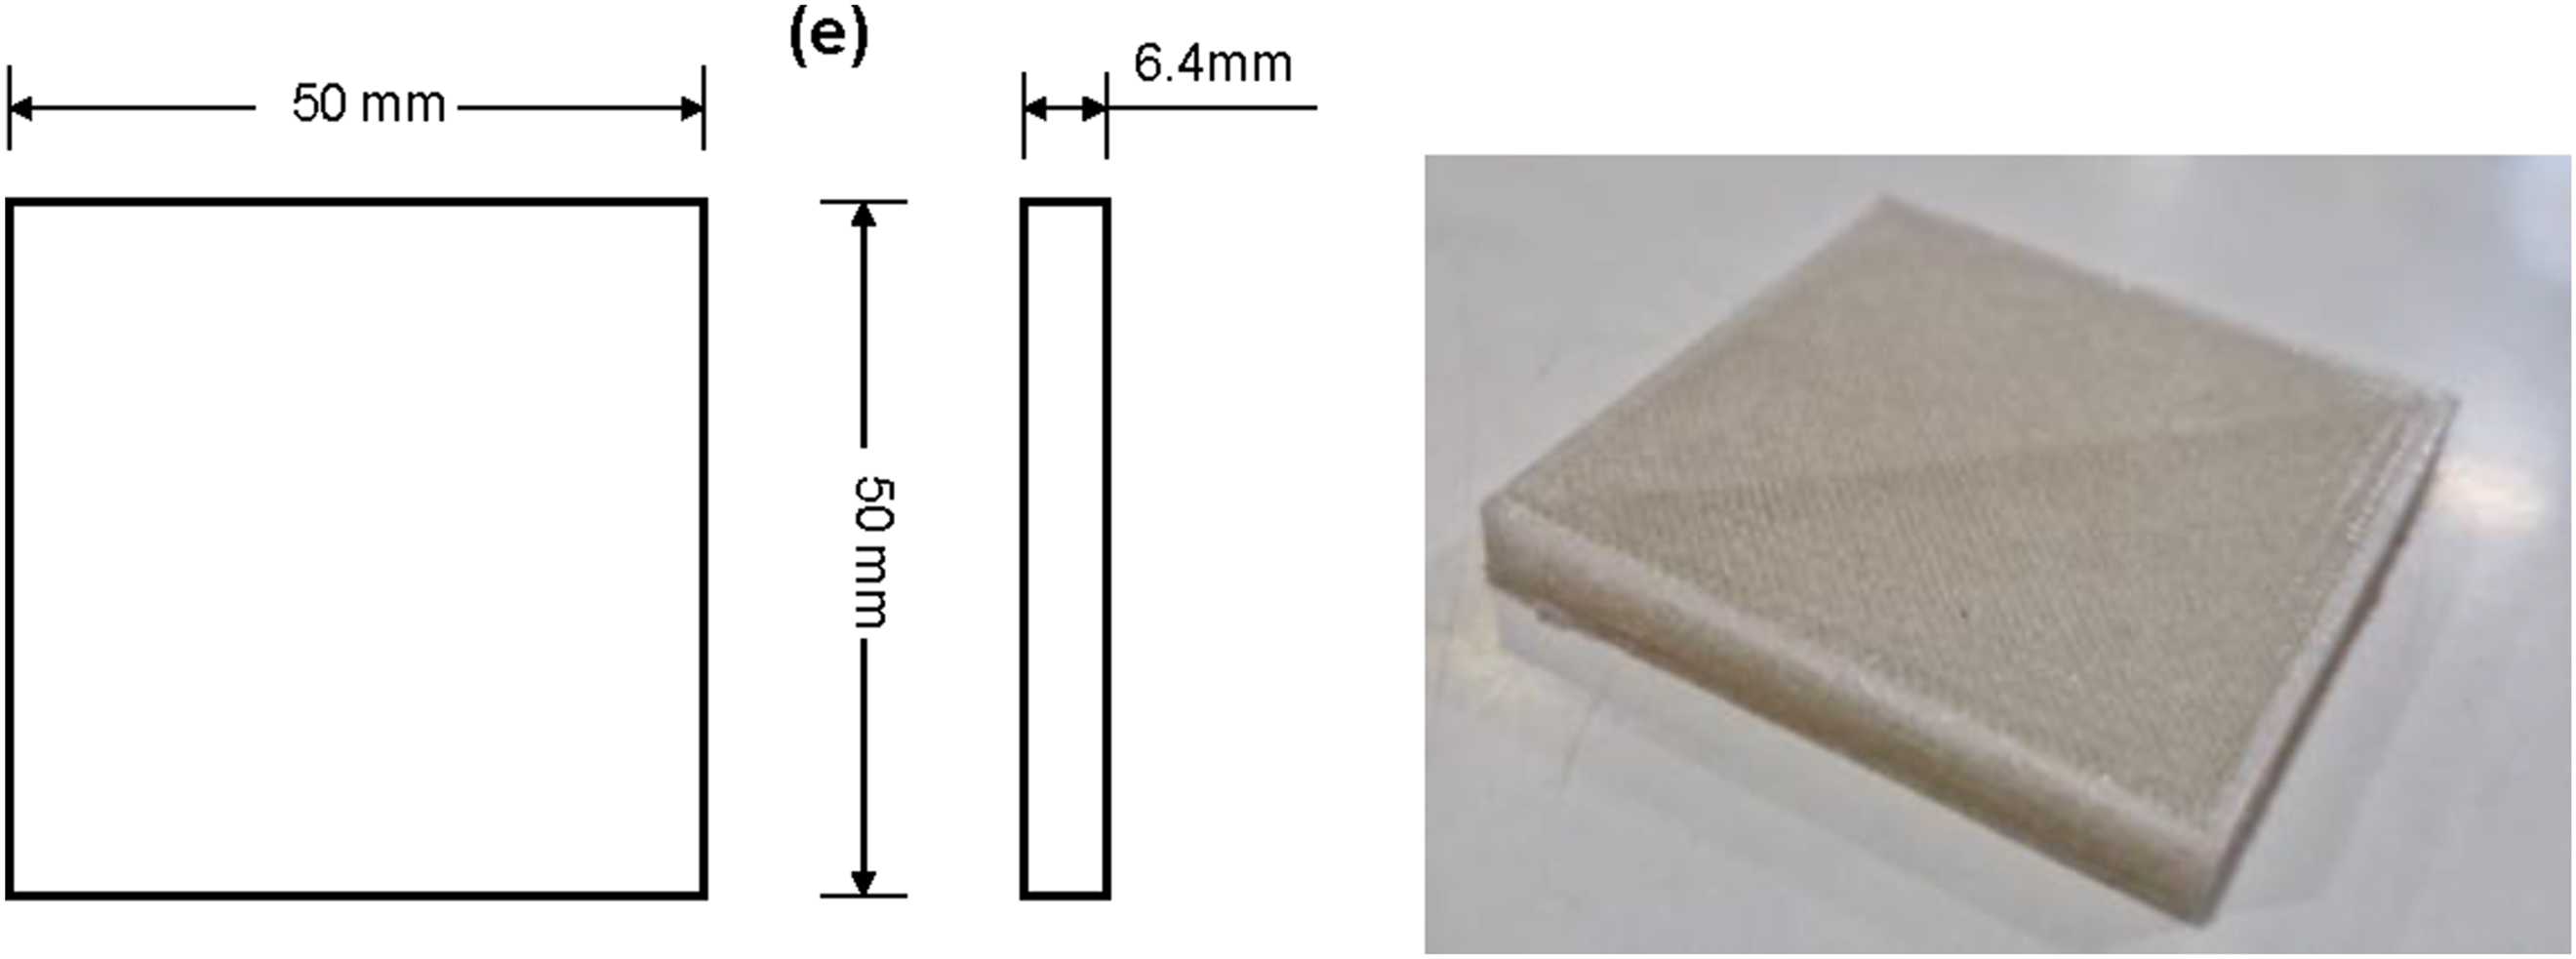
The dimensional accuracy of 3D-printed specimens was evaluated to assess the geometric fidelity of the printed parts to their designed dimensions. Standard cubic specimens of 50 × 50 × 6.4 mm3 were designed using SolidWorks 2023 and fabricated using fused filament fabrication (FFF) printer.
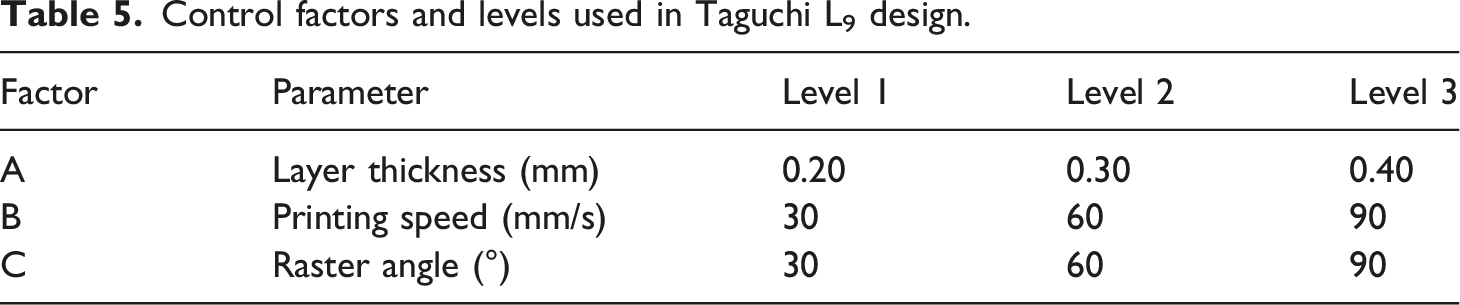
Control factors and levels used in Taguchi L9 design.
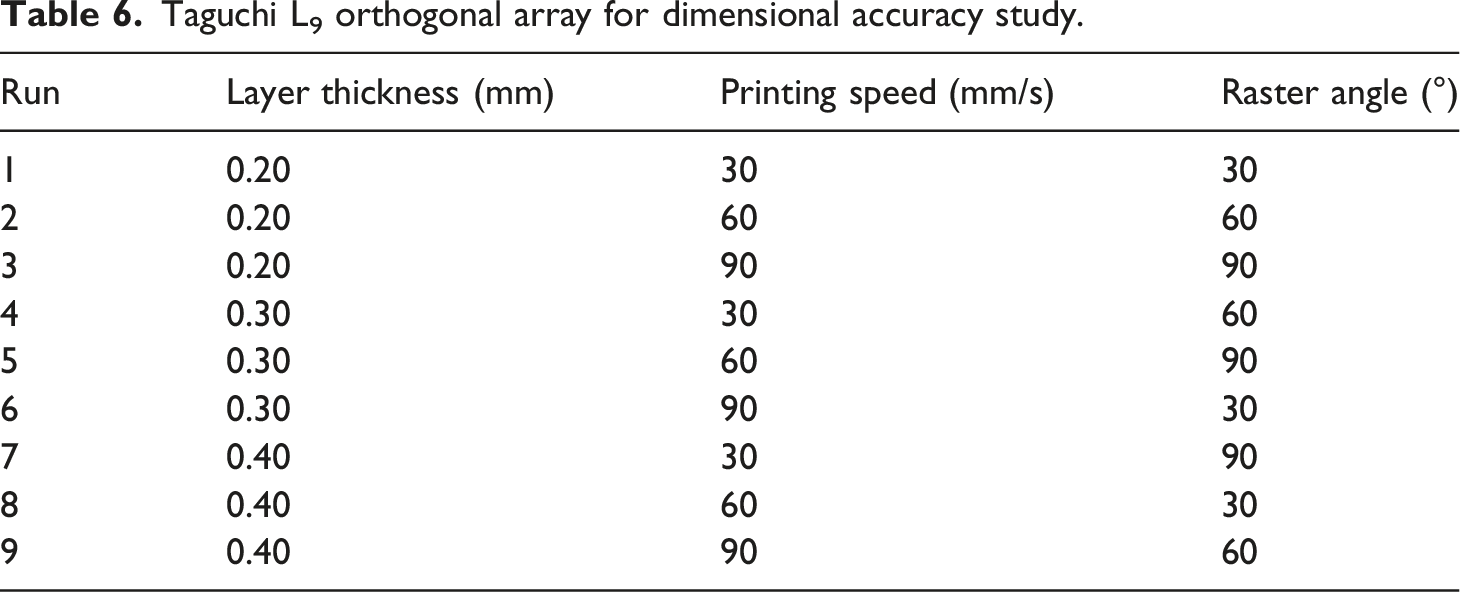
Taguchi L9 orthogonal array for dimensional accuracy study.
Although the present study primarily focuses on layer thickness, printing speed, and raster angle, other process parameters such as nozzle temperature, bed temperature, and infill density can also influence the dimensional accuracy of FFF-printed composites. Nozzle temperature governs melt viscosity, extrusion flow stability, and interlayer diffusion behavior, which directly affect dimensional consistency and material deposition quality. Excessively high nozzle temperatures may lead to over-extrusion and material spreading, whereas lower temperatures can result in insufficient fusion and dimensional inconsistencies.
Similarly, bed temperature influences cooling rate, residual stress generation, and warpage behavior during solidification. Improper bed temperature conditions may promote differential shrinkage and geometric distortion, particularly in polymer-based composite systems. Infill density can additionally affect internal heat accumulation, shrinkage characteristics, and stress distribution within printed components, thereby contributing to dimensional deviation. To isolate the influence of the selected primary variables and maintain a manageable experimental design within the Taguchi L9 framework, these additional parameters were maintained constant throughout the investigation.
After printing, the dimensions of each specimen were measured in the X, Y, and Z directions using a vernier calliper (accuracy ±0.01 mm). The percentage deviation in each direction was calculated using equation (4).
The mean deviation was obtained as the arithmetic average of deviations in X, Y, and Z directions. The dimensional accuracy was then expressed using equation (5).
The fabricated samples used for dimensional accuracy testing are presented in Figure 7. Specimen used for dimensional accuracy testing.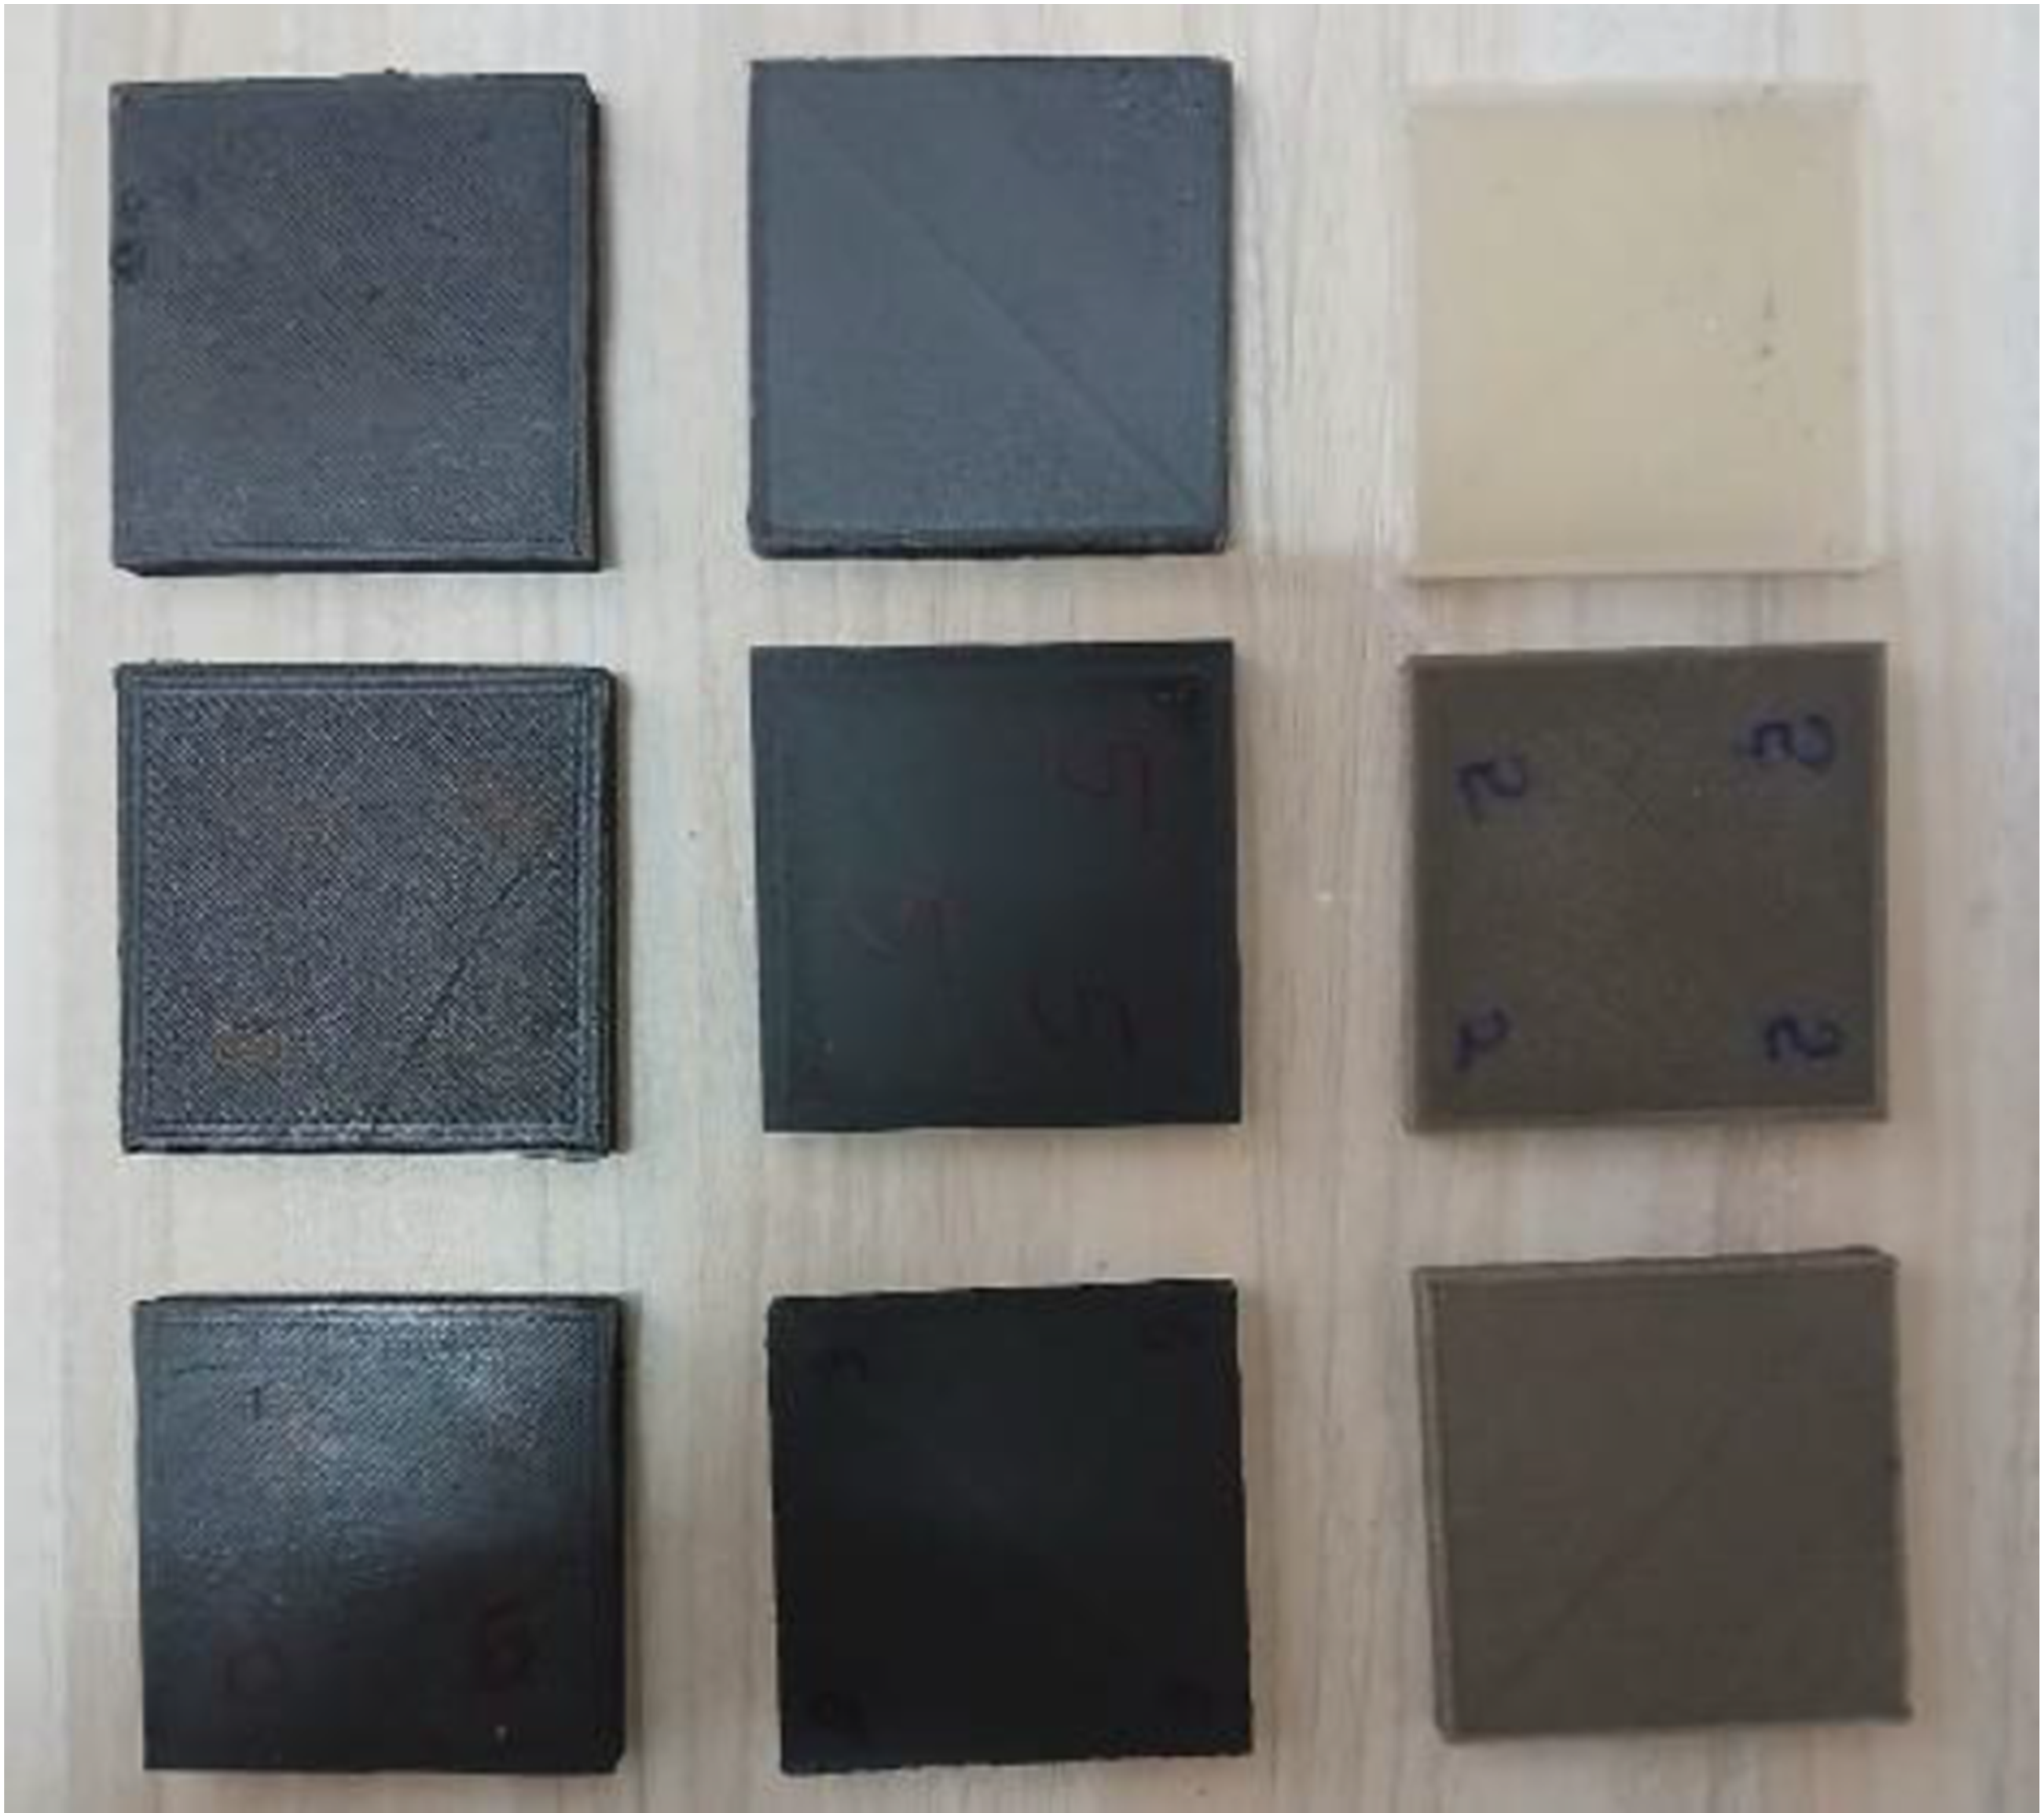
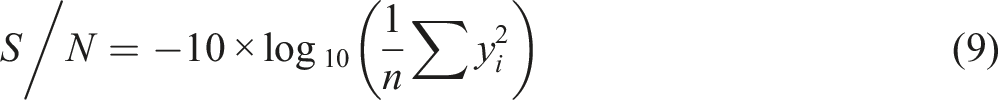
The mean deviation values obtained from the nine experiments were analyzed using the Taguchi Signal-to-Noise (S/N) ratio, adopting the “smaller-is-better” criterion since lower deviation corresponds to higher accuracy. Main effect plots were generated to identify the optimal combination of process parameters that yield the minimum deviation.
An Analysis of Variance (ANOVA) was subsequently performed to determine the statistical significance and percentage contribution of each factor on the dimensional accuracy.
Machine learning framework
A machine learning (ML) framework was developed to complement the experimental study and predict the influence of FFF parameters-layer thickness (A), printing speed (B), and raster angle (C)-on the dimensional accuracy of PETG specimens. Dimensional deviations in each direction were first computed using equation (4).
The resulting dataset of nine runs was numerically encoded and standardized before model development. A Random Forest Regressor was selected owing to its ability to model nonlinear parameter interactions and avoid overfitting when working with small datasets. The data were split into 70% training and 30% testing subsets, and model hyperparameters were tuned using grid search to ensure stable predictions. Model performance was evaluated using the coefficient of determination using equation (6).

Results and discussions
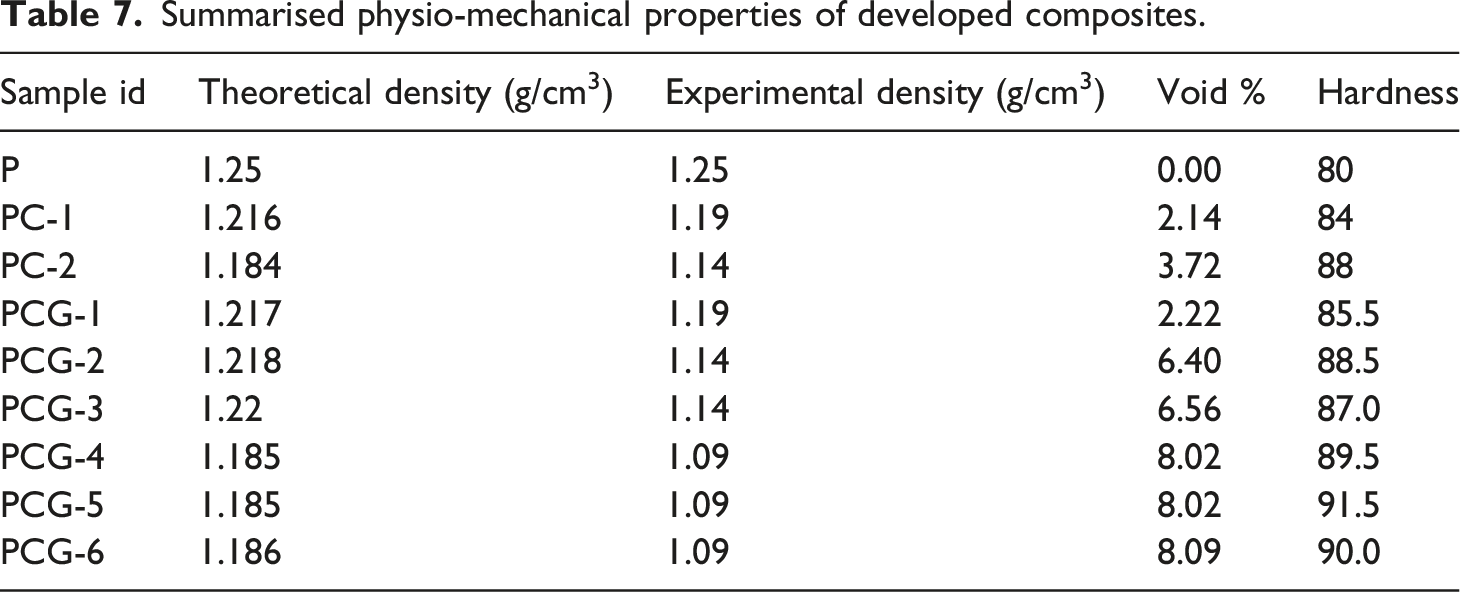
Summarised physio-mechanical properties of developed composites.
Density
The variation in the density of the developed PLA-based composites is shown in Figure 8. This study examines how the addition of cenospheres and graphene nanoplatelets (GNPs) influences the density of the fabricated PLA composites. The density of neat PLA was found to be 1.25 g/cm3. When 5 wt% and 10 wt% of cenospheres were added, the density decreased to 1.216 g/cm3 and 1.184 g/cm3, respectively. This decrease occurs mainly because cenospheres are lightweight and hollow in structure, which makes them less dense (approximately 0.4–0.8 g/cm3) compared to PLA (about 1.25 g/cm3). By replacing a part of the heavier PLA matrix, cenospheres help in reducing the overall weight of the composite material. Variation in density of 3D printed composites.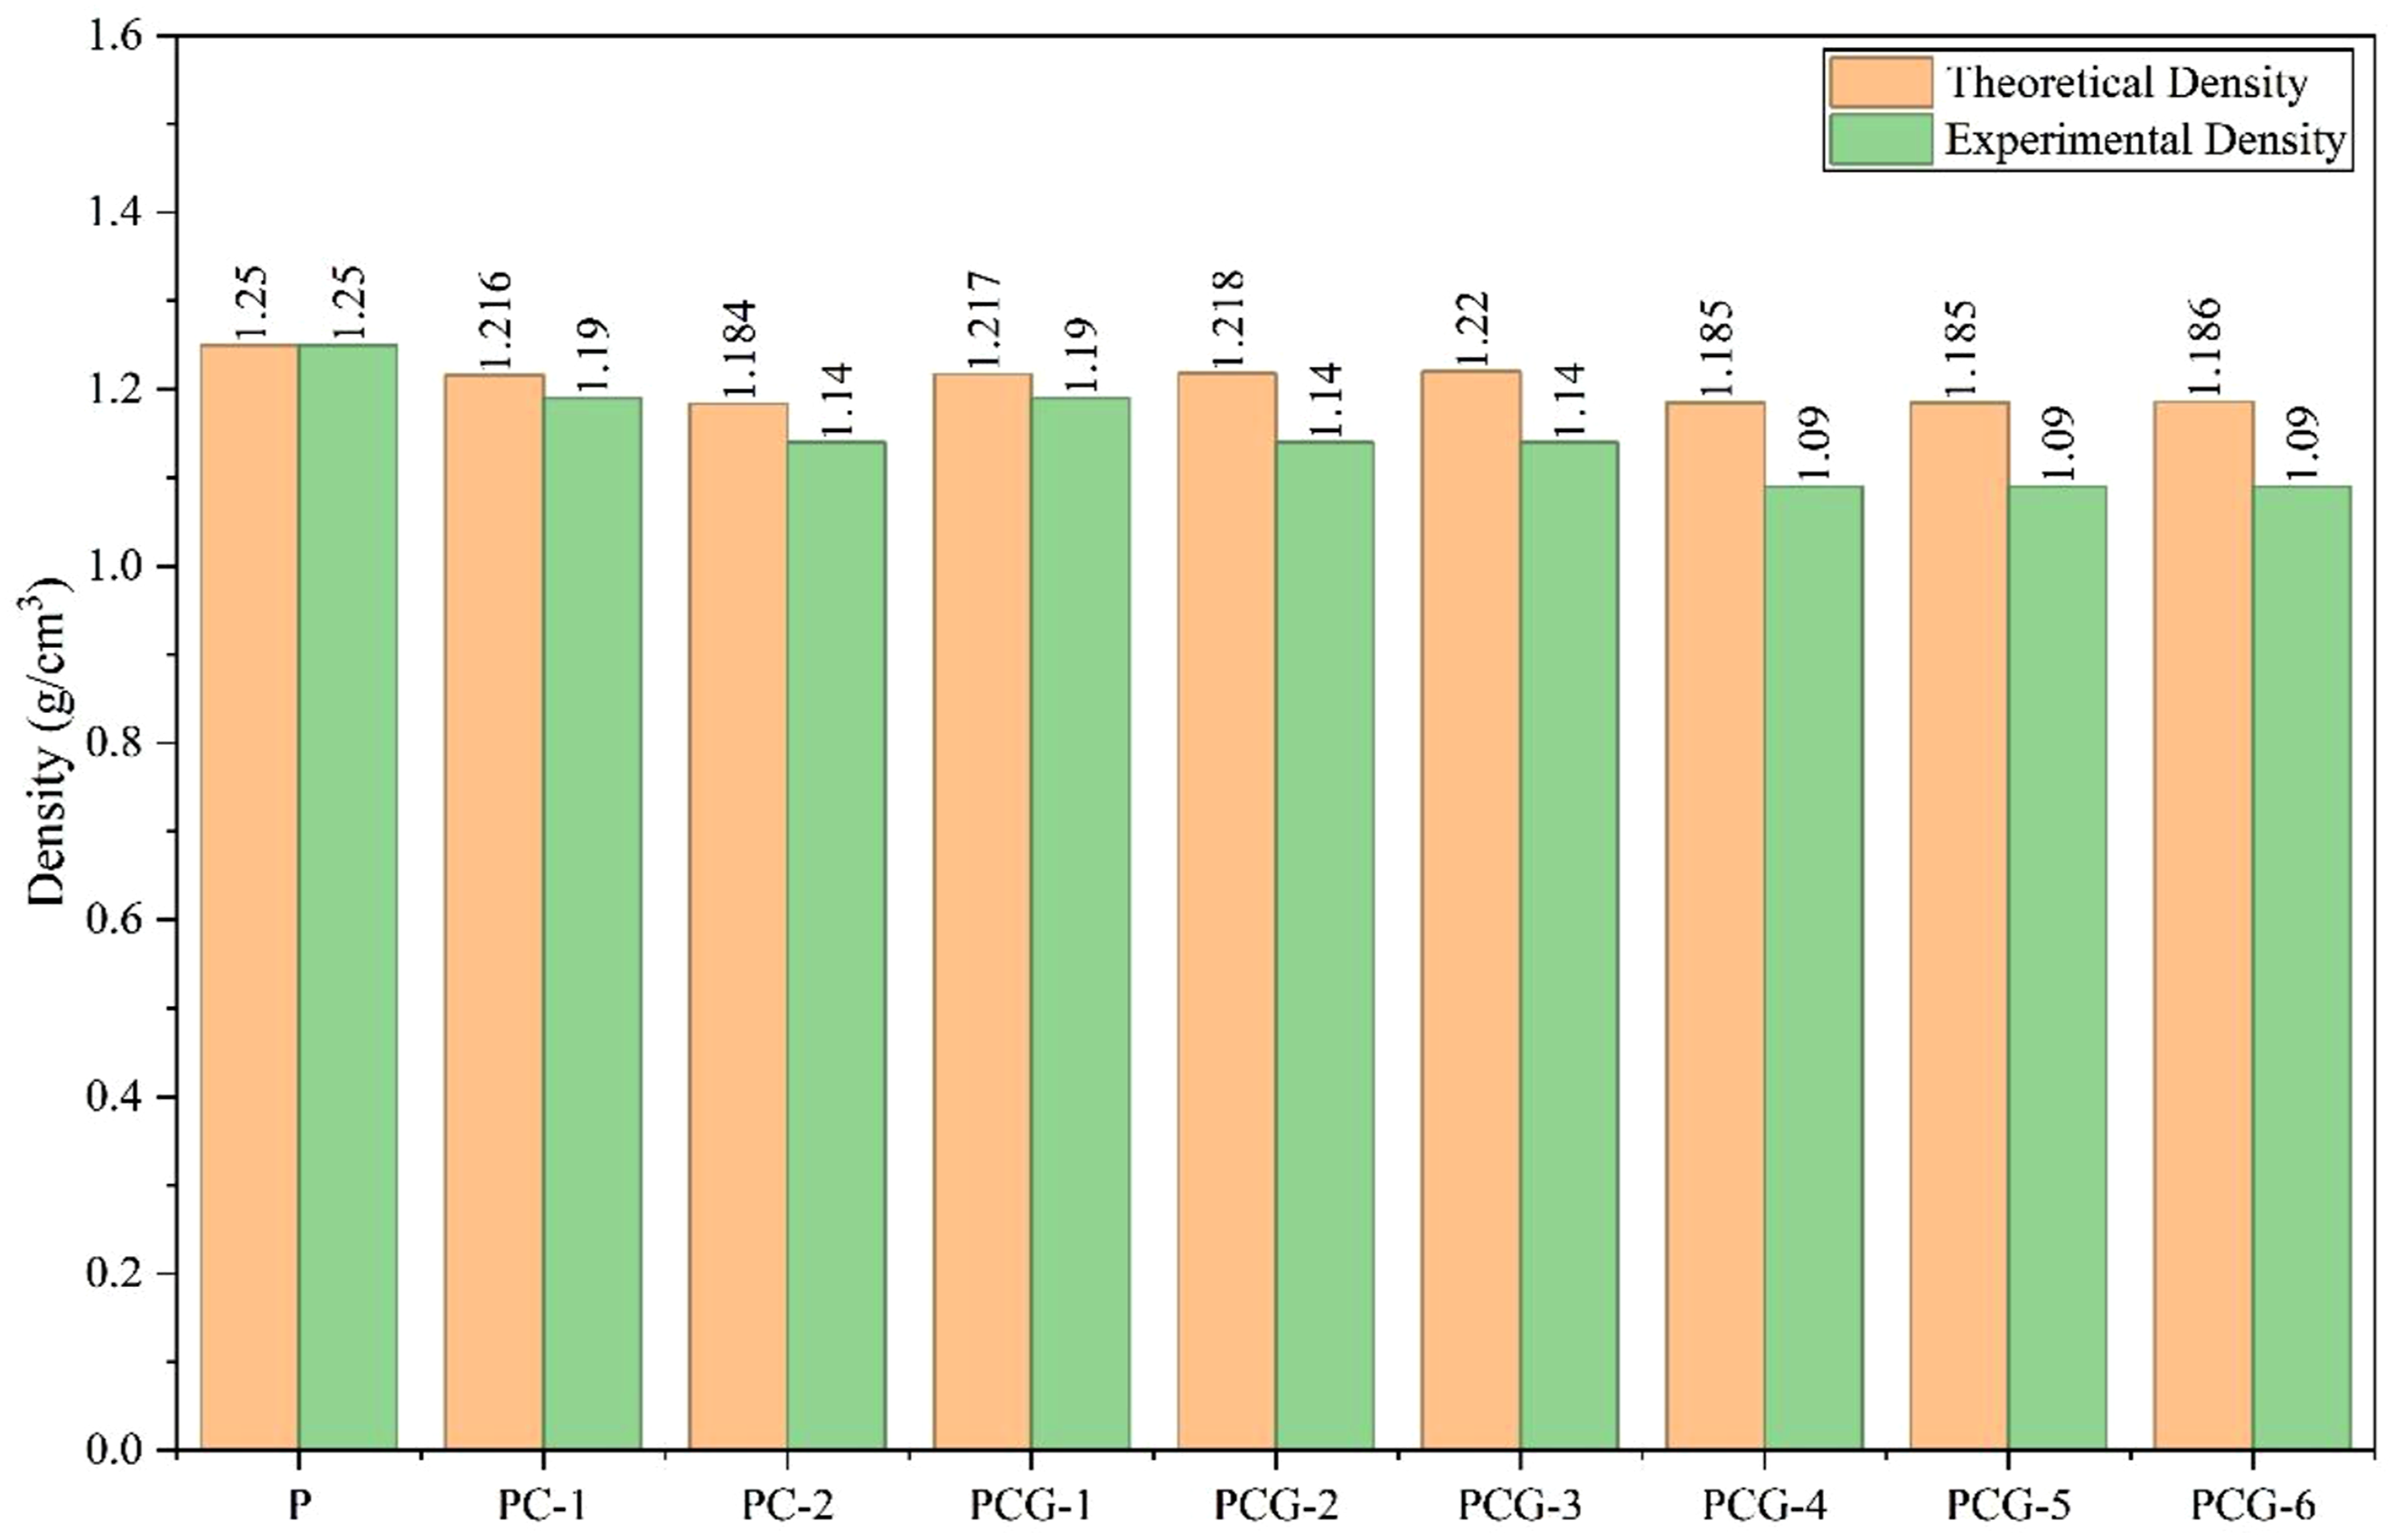
When GNPs were introduced along with cenospheres, a small increase in density was observed (ranging from 1.185 to 1.22 g/cm3, depending on the amount added). This slight increase is due to the higher density of GNPs (about 2.2 g/cm3). However, because only a very small quantity of GNPs (less than 0.6 wt%) was used, the overall density change remained minor.
Overall, it can be observed that cenospheres effectively reduce the composite density, while GNPs slightly increase it but also make the structure more compact. The combination of 10 wt% cenospheres and a small amount of GNPs gave the best balance between low density and good material quality, making this composition suitable for lightweight applications where reducing material weight is important.
Hardness
The hardness variation of the PLA-based composites is presented in Figure 9, illustrating the influence of cenosphere and graphene nanoplatelet (GNP) additions on the surface resistance and load-bearing capability of the fabricated specimens. The neat PLA sample (P) exhibited a baseline hardness of 80 Shore D, reflecting its inherent ductility and relatively low surface rigidity typical of pure thermoplastic matrices. Variation in hardness of 3D printed composites.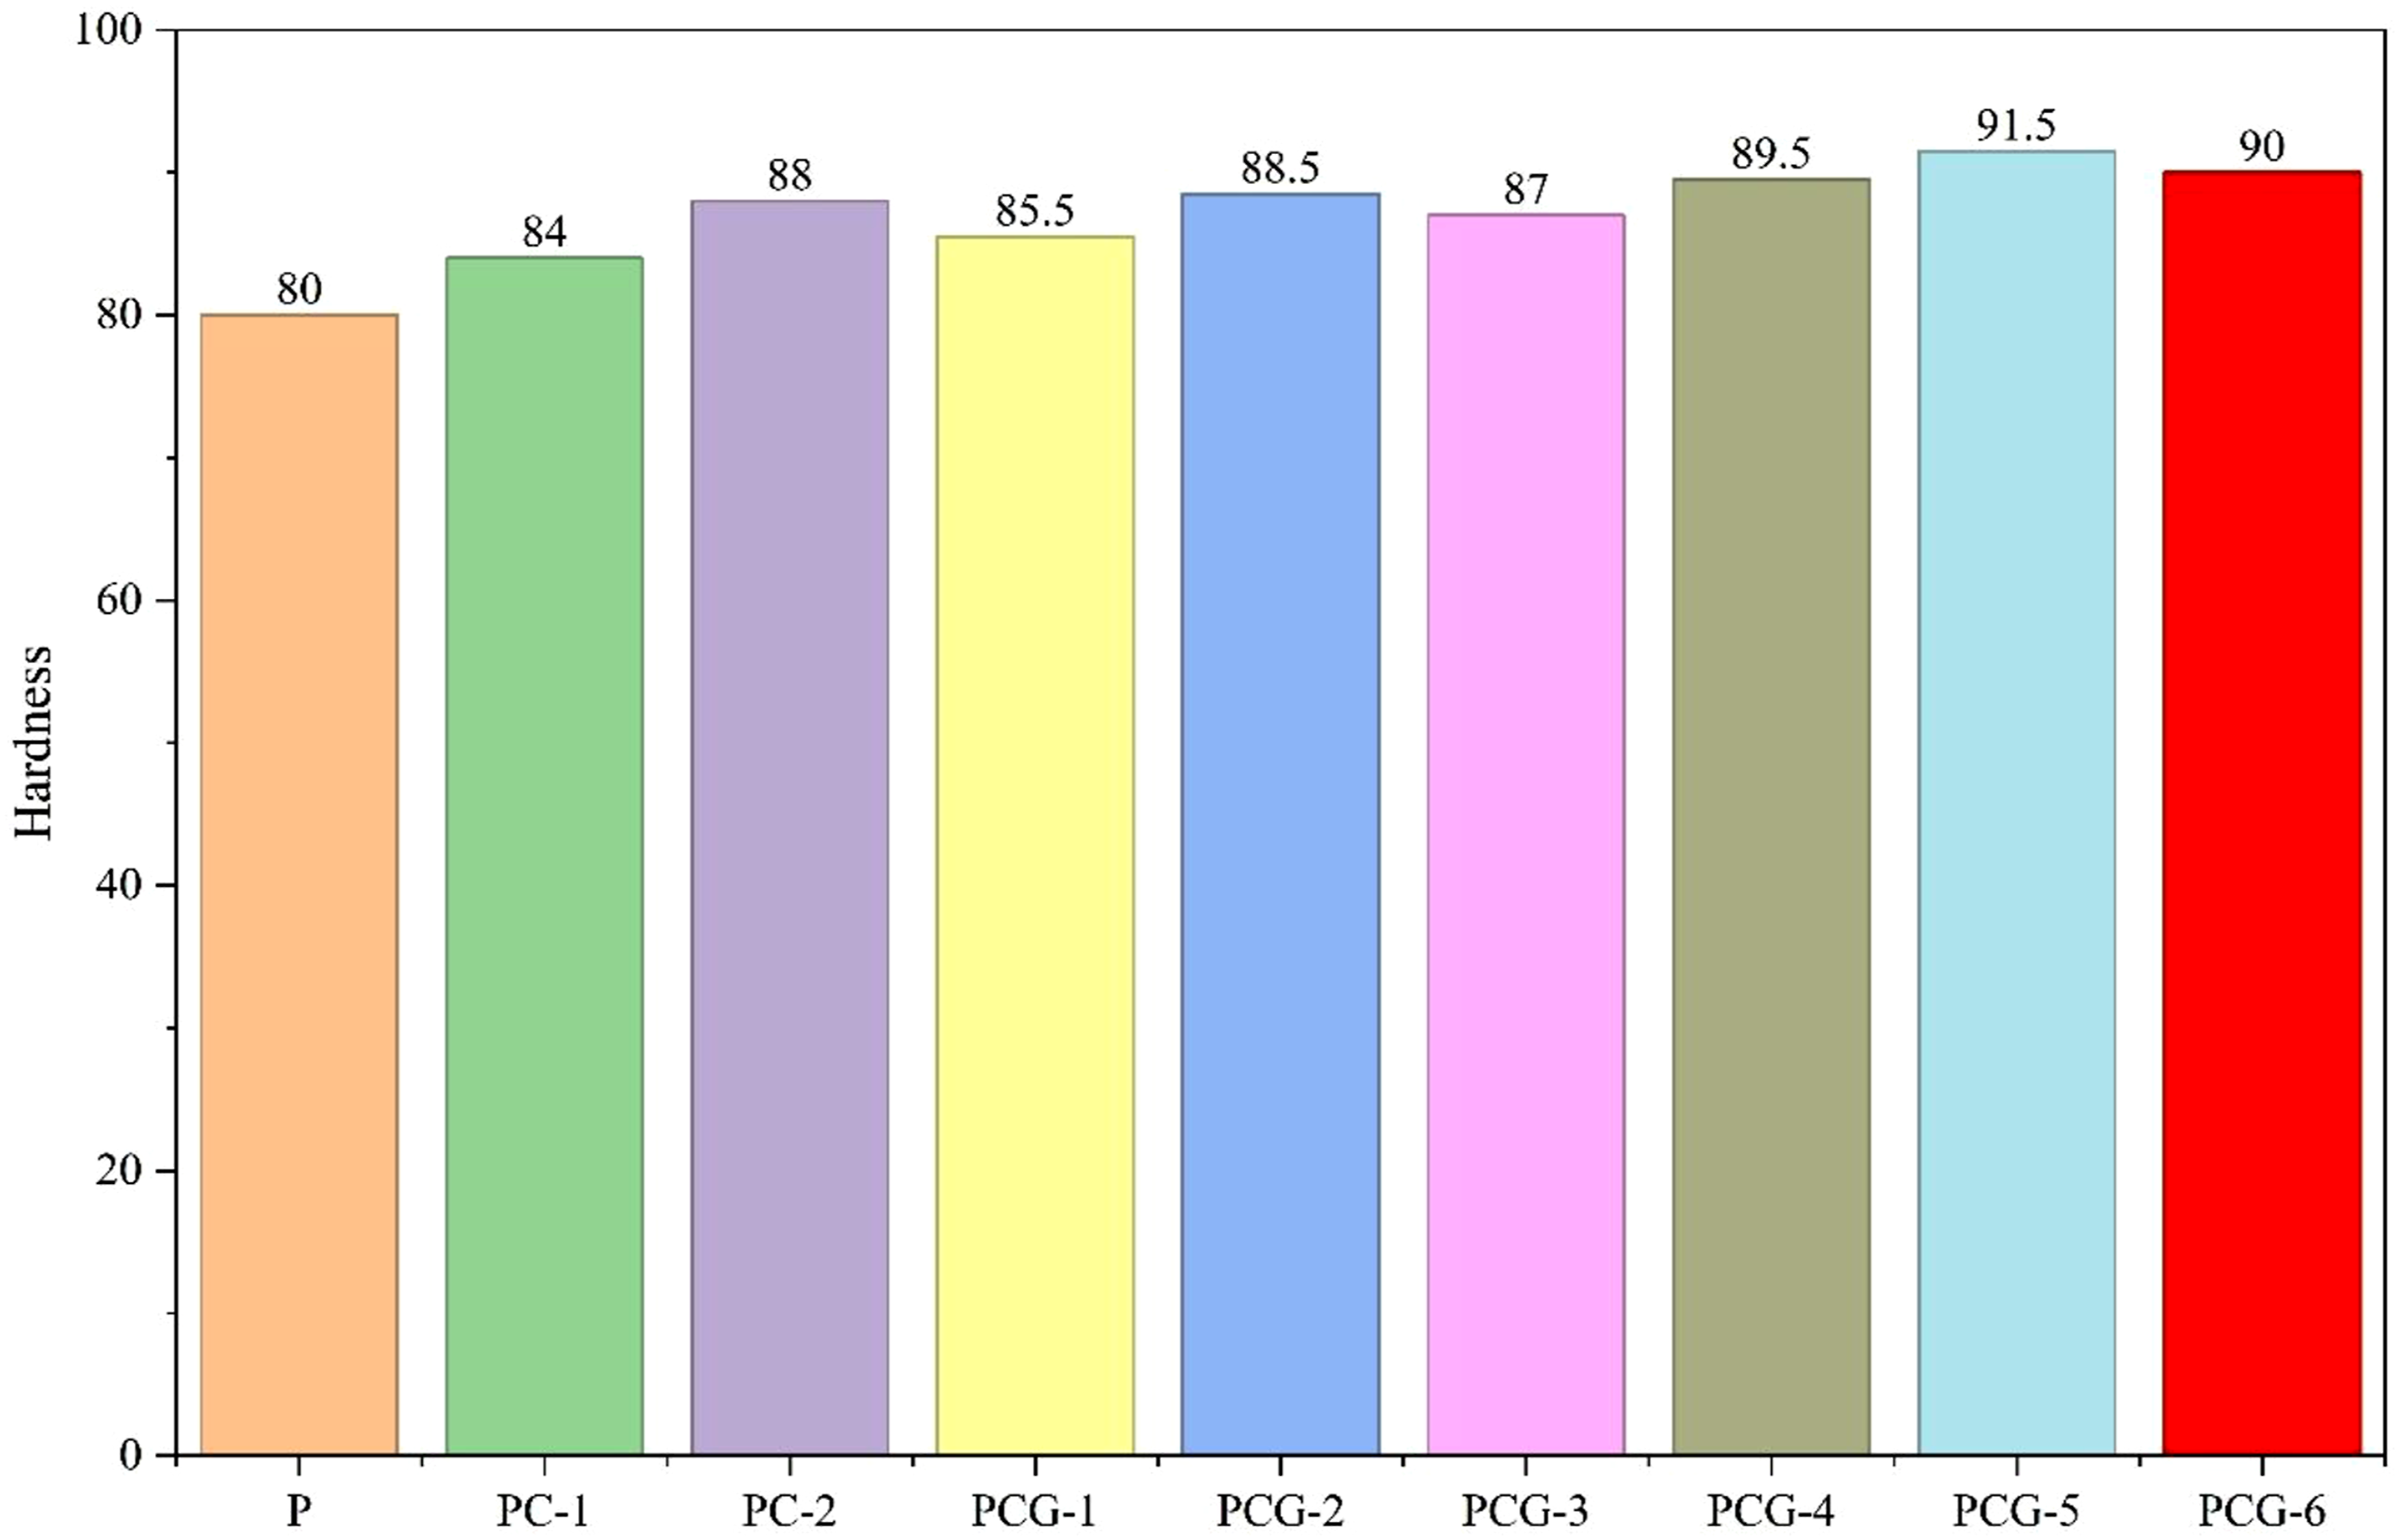
With the incorporation of cenospheres at 5 wt% (PC-1) and 10 wt% (PC-2), the hardness values increased significantly to 84 Shore D and 88 Shore D, respectively. This notable improvement can be attributed to the rigid ceramic structure of cenospheres, which effectively act as micro-scale reinforcements within the PLA matrix. Their inclusion constrains local plastic deformation under indentation and redistributes applied stress more uniformly through the surrounding matrix. The hollow aluminosilicate morphology of cenospheres also reduces polymer chain mobility and enhances the surface stiffness by forming a semi-rigid load-bearing skeleton within the matrix.
A further enhancement in hardness was observed upon the introduction of graphene nanoplatelets (GNPs) into the PLA-cenosphere system. The hybrid compositions (PCG-1 to PCG-6) demonstrated hardness values ranging between 85.5 and 91.5 Shore D, indicating a consistent improvement over both neat and cenosphere-filled PLA. The increase in hardness with GNP addition can be linked to graphene’s exceptional in-plane stiffness and two-dimensional layered morphology, which strengthen the filler-matrix interface and reduce interfacial defects. The planar GNPs promote better packing and improved interfacial adhesion, resulting in a denser and more compact surface layer that resists indentation and micro-scratching.
Among all the investigated formulations, the hybrid composite PCG-5 exhibited the highest hardness value of 91.5 Shore D, accompanied by a low experimental density of 1.185 g/cm3 and negative void content of −8.72%, suggesting excellent filler dispersion and enhanced interfacial consolidation. The negative void percentage indicates that the experimental density surpassed the theoretical estimate, likely due to improved packing efficiency and reduced micro-porosity from synergistic reinforcement effects. The balanced distribution of cenospheres and GNPs in PCG-5 promotes effective stress transfer and minimizes localized deformation under applied loads.
However, at higher GNP loadings (PCG-6), a slight decline in hardness (to 90 Shore D) was observed. This marginal reduction may be attributed to the agglomeration tendency of excess graphene nanoplatelets, which can induce weak interfacial regions and stress concentrations, partially offsetting the reinforcement benefits.
Overall, the combined reinforcement of 10 wt% cenospheres and an optimized fraction of GNPs yielded the most favorable surface hardness, demonstrating a clear synergistic enhancement in stiffness, surface rigidity, and filler-matrix compatibility. The developed hybrid composites thus possess superior resistance to surface deformation, indentation, and abrasion, making them promising for applications requiring dimensional stability and surface durability-such as automotive interior components, lightweight housings, and aerospace-grade enclosures.
Void content
The variation in void content of the fabricated PLA/cenosphere/graphene composites as presented in Figure 10 is strongly influenced by the reinforcement concentration, filler dispersion characteristics, and interfacial interactions between the matrix and reinforcements. Pure PLA (P) exhibited negligible void content (0%), indicating relatively uniform solidification and good consolidation during processing. The absence of fillers allowed efficient polymer chain mobility and minimized the probability of air entrapment or interfacial discontinuities. Variation in void content of 3D printed composite.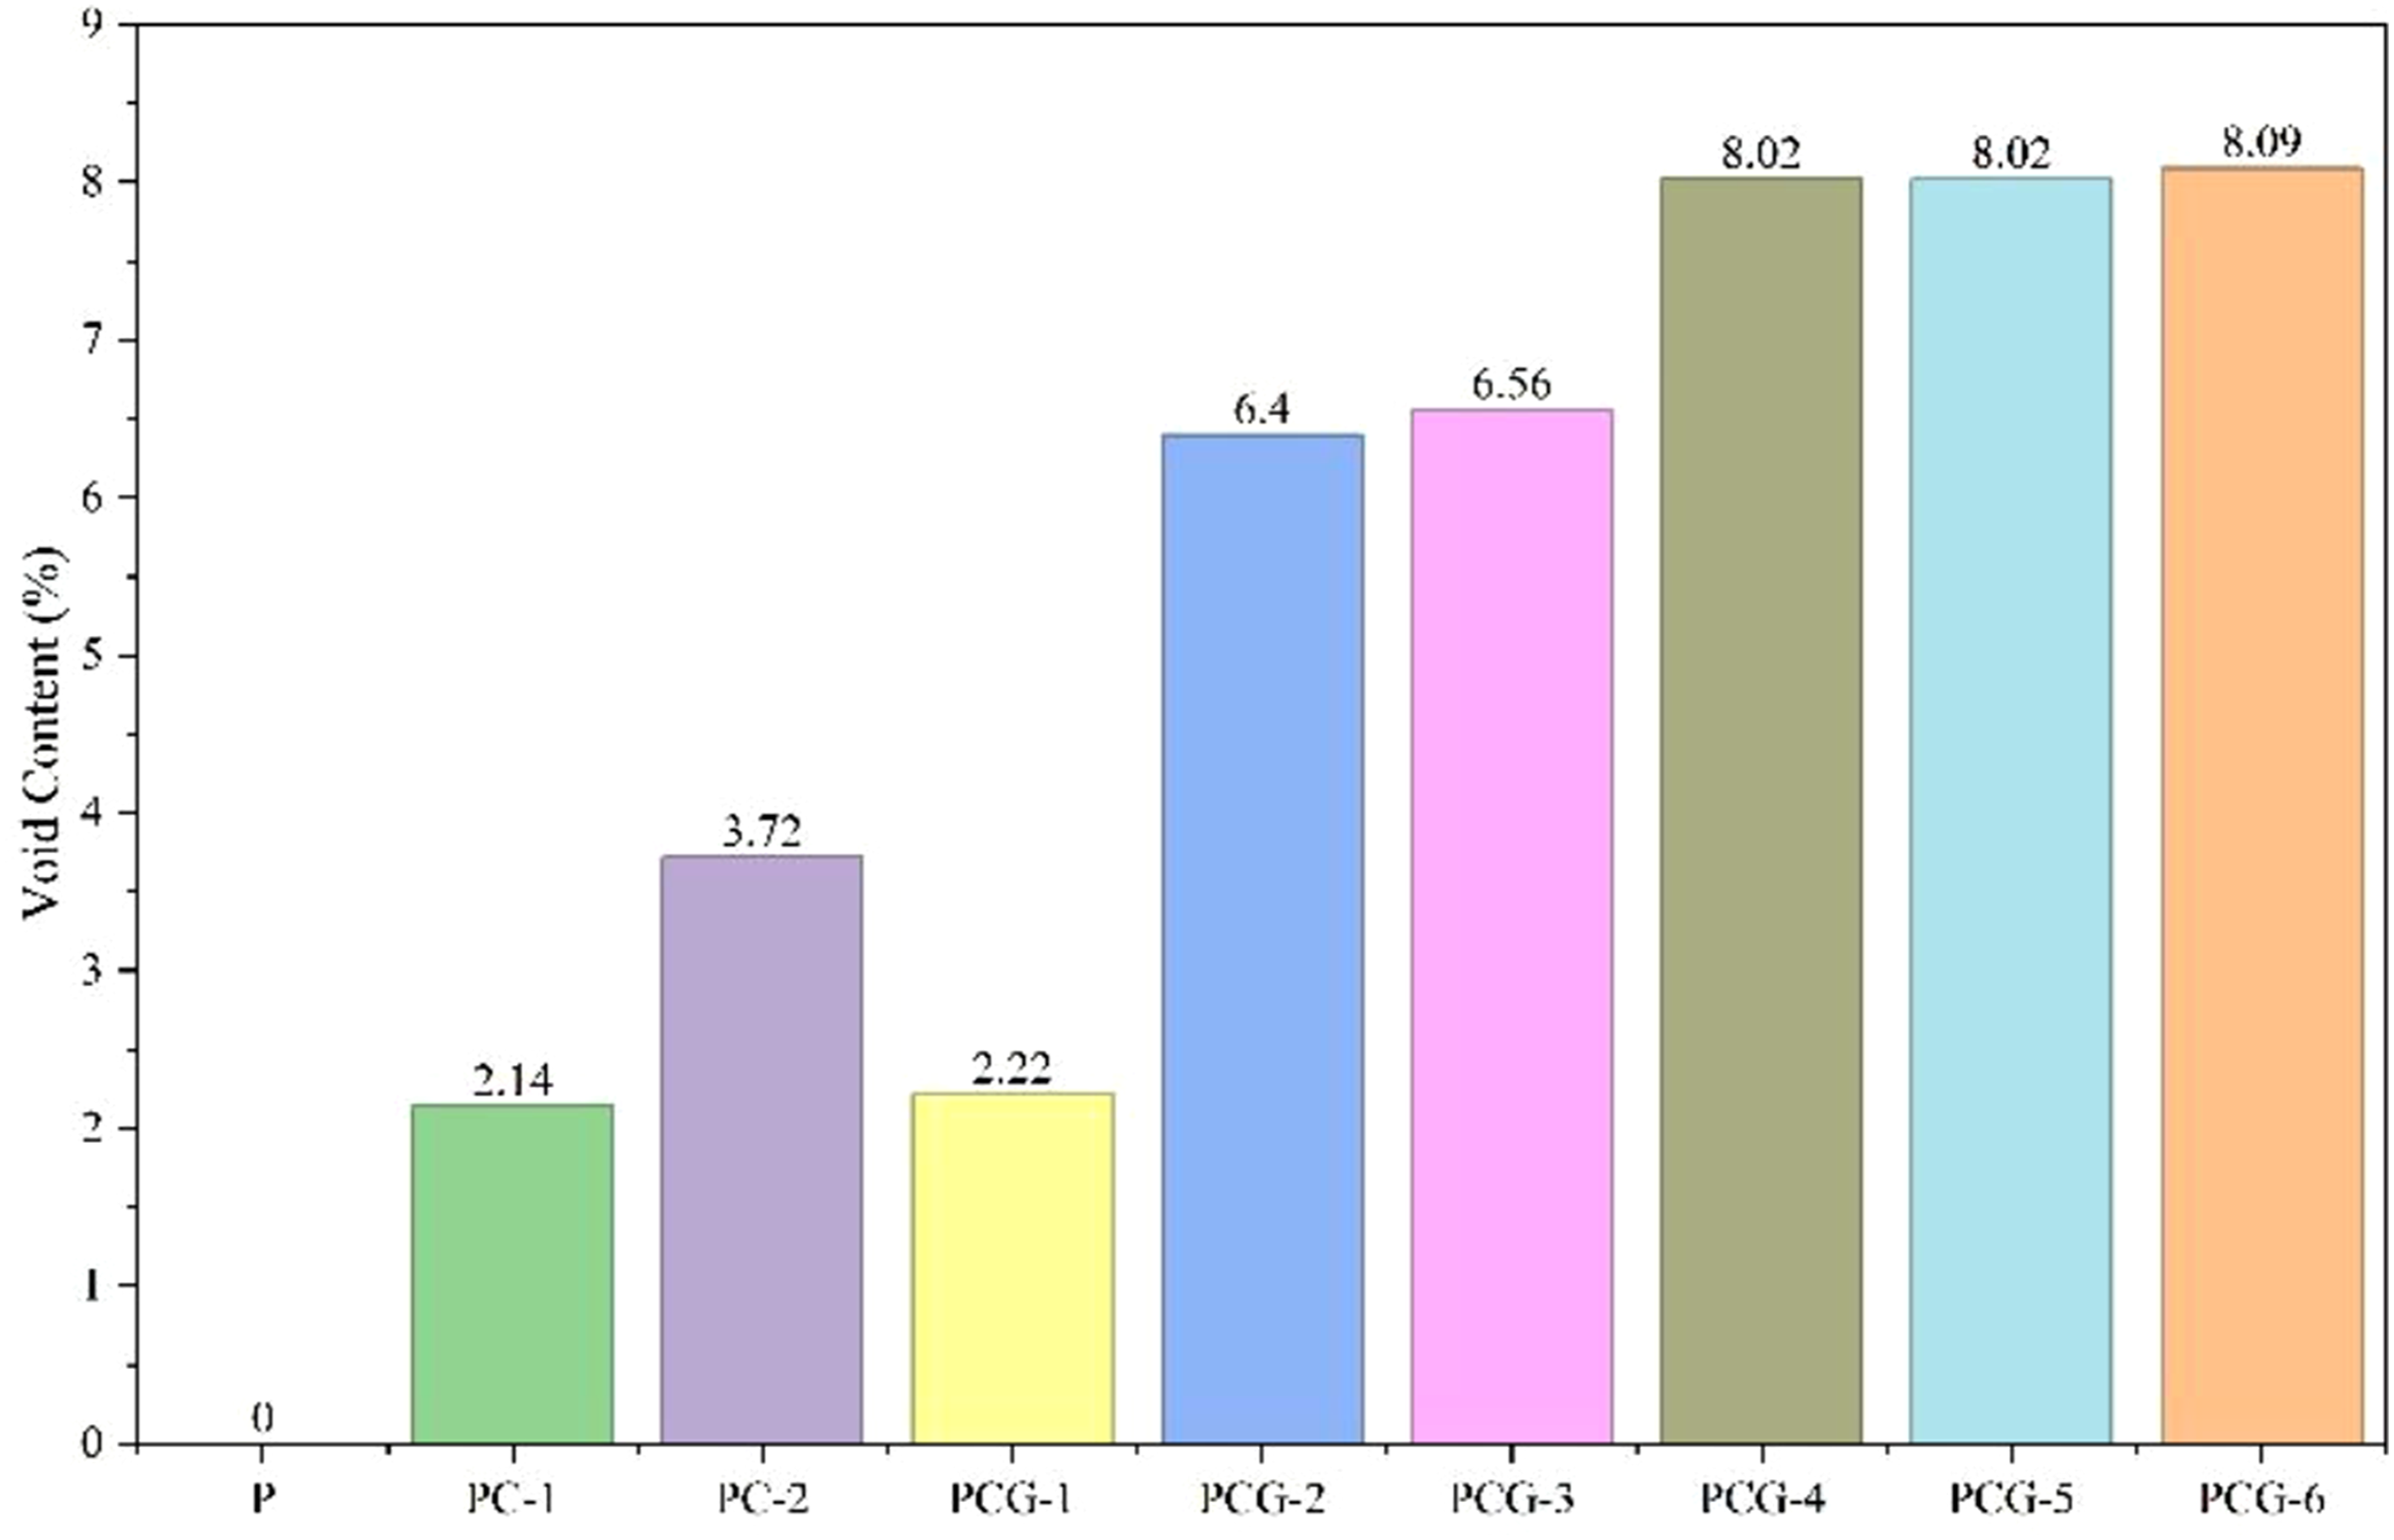
With the incorporation of cenospheres in PC-1 and PC-2, the void content increased from 2.14% to 3.72% as the cenosphere content increased from 5 wt% to 10 wt%. This behavior can be attributed to the hollow morphology and low density of cenospheres, which promote air entrapment during melt processing. At higher cenosphere loading, particle agglomeration and poor wettability between the PLA matrix and ceramic cenosphere surface become more pronounced, leading to interfacial gaps and microvoid formation. Furthermore, the increased filler concentration restricts polymer chain flow during processing, thereby reducing matrix infiltration around the particles and increasing porosity.
The addition of graphene in the PCG series further increased the void content, particularly at higher graphene concentrations. For the 5 wt% cenosphere composites (PCG-1 to PCG-3), the void content increased from 2.22% to 6.56% with increasing graphene content from 0.2 wt% to 0.6 wt%. Similarly, in the 10 wt% cenosphere composites (PCG-4 to PCG-6), the void content increased from 8.02% to 8.09%. The increase in porosity is primarily associated with the high surface area and strong van der Waals attraction between graphene sheets, which promote agglomeration at higher loading levels. These agglomerates hinder uniform matrix flow and create localized stress concentration regions, resulting in incomplete wetting and entrapped voids.
Another important factor contributing to the higher void content is the simultaneous presence of rigid cenospheres and nanoscale graphene particles. The hybrid reinforcement system increases melt viscosity during processing, thereby reducing the ability of the molten PLA to completely fill interstitial regions around the fillers. This effect becomes more severe at higher reinforcement contents, resulting in the progressive increase in void percentage observed for PCG-4 to PCG-6.
Despite the increase in void content, the hardness values improved significantly with reinforcement addition. This indicates that the stiff ceramic cenospheres and graphene nanoplatelets effectively enhanced the surface resistance of the composites. The highest hardness value obtained for PCG-5 suggests that the reinforcing effect of graphene and cenospheres outweighed the detrimental influence of porosity up to an optimum filler concentration. However, the slight reduction in hardness for PCG-6 may be associated with excessive graphene agglomeration and increased void formation, which can reduce stress transfer efficiency within the composite.
Selection of optimal composite
Comparative evaluation of physical and mechanical properties.
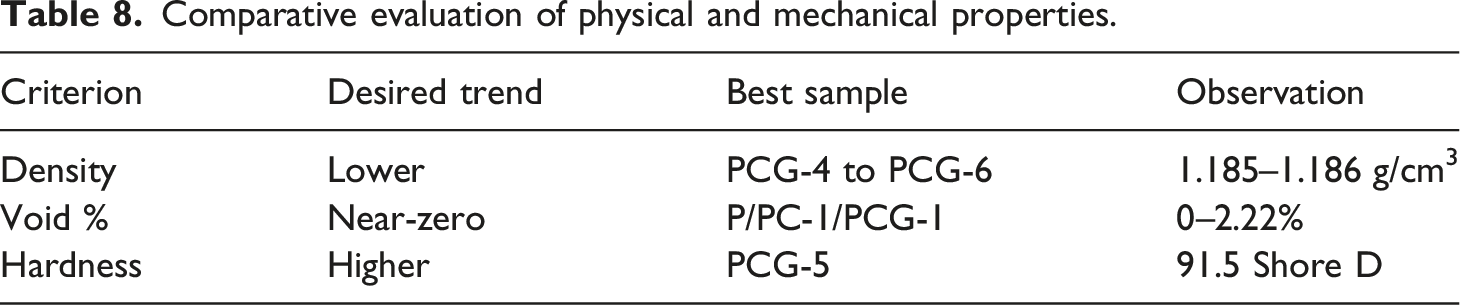
Among all the investigated formulations, PCG-5 exhibited the best overall balance between lightweight characteristics and mechanical performance. The composite demonstrated one of the lowest densities (1.185 g/cm3) along with the highest hardness value of 91.5 Shore D, indicating significant enhancement in rigidity and surface resistance due to the synergistic reinforcement effect of cenospheres and graphene nanoplatelets.
Although PC-1 exhibited the lowest void content among the reinforced composites, the hardness improvement was comparatively limited due to the lower reinforcement concentration. In contrast, PCG-5 achieved superior hardness despite exhibiting relatively higher void content. This behavior suggests that the reinforcing efficiency of graphene nanoplatelets and cenospheres dominated the mechanical response of the composite. The rigid ceramic cenospheres contributed to structural stiffness and weight reduction, while graphene nanoplatelets enhanced stress transfer capability and restricted localized deformation within the PLA matrix.
The progressive reduction in density observed for PCG-4 to PCG-6 is primarily attributed to the incorporation of low-density hollow cenospheres, which effectively reduced the overall composite weight. Simultaneously, graphene nanoplatelets improved interfacial adhesion and constrained polymer chain mobility, thereby increasing surface hardness. However, at higher graphene concentrations, the increase in melt viscosity and nanoparticle agglomeration promoted void formation due to incomplete matrix infiltration and localized air entrapment during processing.
Among all formulations, PCG-5 demonstrated the optimum balance between density reduction and mechanical enhancement. The composite achieved maximum hardness without significant deterioration in structural integrity, indicating effective reinforcement dispersion and favorable filler-matrix interaction at 0.4 wt% graphene loading. Therefore, PCG-5 can be considered the most suitable candidate for lightweight semi-structural and functional engineering applications requiring enhanced surface hardness and reduced component weight.
Dimensional accuracy
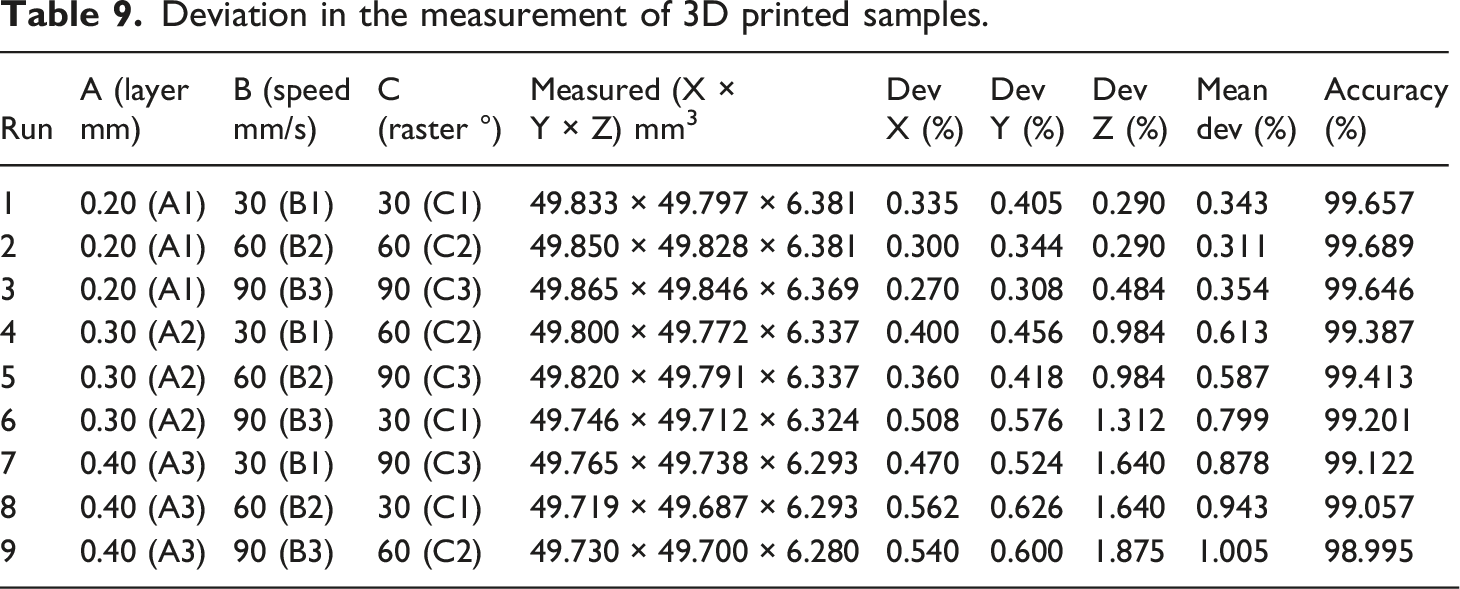
Deviation in the measurement of 3D printed samples.
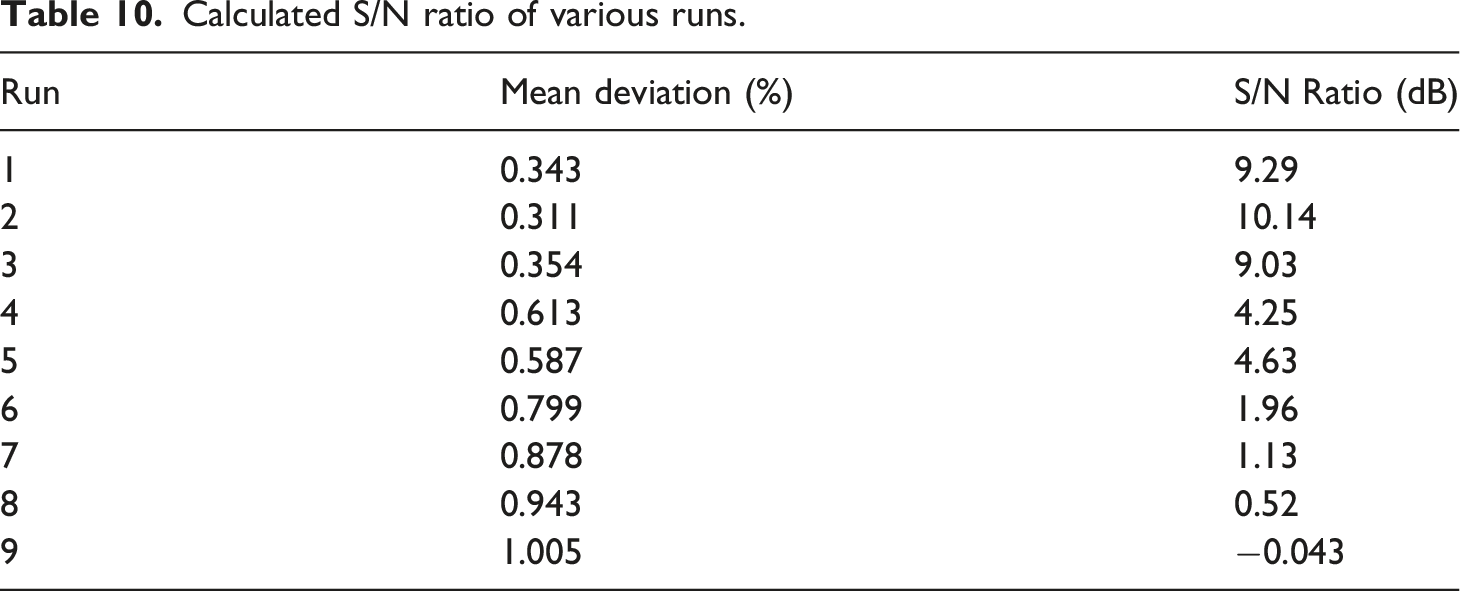
Calculated S/N ratio of various runs.
Mean S/N ratios for each parameter level.
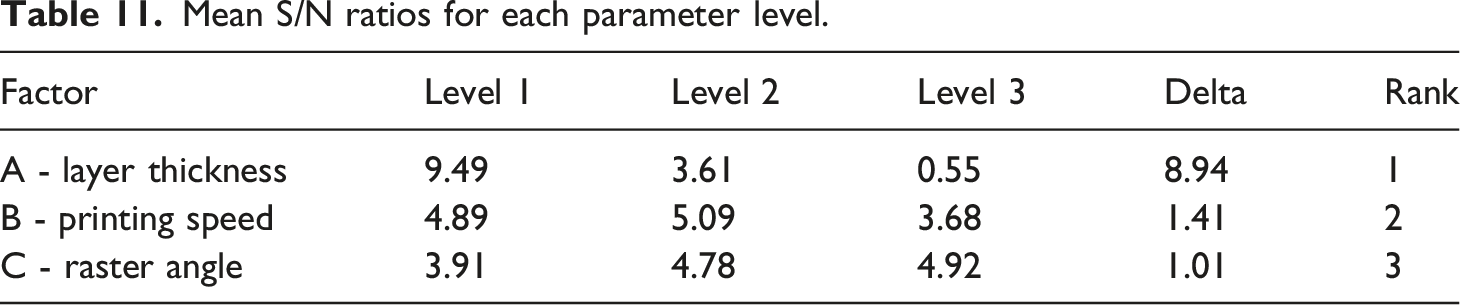
The results presented in Table 11 indicate that among the selected process parameters, layer thickness (Factor A) exerts the most significant influence on the measured response, with the highest Delta value of 8.94, ranking first in importance. The mean response shows a sharp decline from 9.49 at Level 1 to 0.55 at Level 3, demonstrating that a decrease in layer thickness enhances the overall accuracy and surface quality of the printed parts. This improvement can be attributed to finer interlayer bonding and reduced stair-stepping effects, which collectively minimize dimensional deviations. In contrast, printing speed (Factor B) shows a moderate effect, with a Delta of 1.41 and a rank of two. The observed variation in mean response (4.89 to 3.68) suggests that both excessively low and high printing speeds can compromise the print quality-lower speeds may cause material accumulation and overheating, whereas higher speeds may result in inadequate fusion between layers. Therefore, an intermediate printing speed tends to yield the most stable dimensional outcomes. Meanwhile, raster angle (Factor C) exhibits the least influence on the response, with the smallest Delta value of 1.01 and a rank of three. The minor variation across its levels indicates that while changes in raster orientation may slightly affect the internal bonding direction and anisotropy of the printed structure, their overall contribution to dimensional accuracy remains relatively low compared to the other parameters. Overall, the analysis confirms that layer thickness is the most dominant factor governing dimensional precision in the additive manufacturing process, followed by printing speed and raster angle.
Figure 11 illustrate the main effects plots for signal-to-noise (S/N) ratios, depicting the influence of layer thickness, printing speed, and raster angle on the dimensional accuracy of the 3D-printed composite specimen. Figure presents the main effects plot for S/N ratios under the “smaller-is-better” criterion, which evaluates both accuracy and consistency. The S/N ratio for layer thickness decreases sharply from Level 1 to Level 3, confirming that thinner layers yield more consistent and precise dimensions. The influence of printing speed remains relatively minor, while raster angle shows a modest increase in S/N ratio, indicating improved repeatability at moderate angles. Overall, both plots reveal that layer thickness is the most dominant parameter affecting dimensional accuracy, followed by raster angle and printing speed. Hence, the optimal combination of parameters for achieving the highest dimensional precision is identified as Layer Thickness - Level 1, Printing Speed - Level 2, and Raster Angle - Level 3. Main effect plots for SN ratio.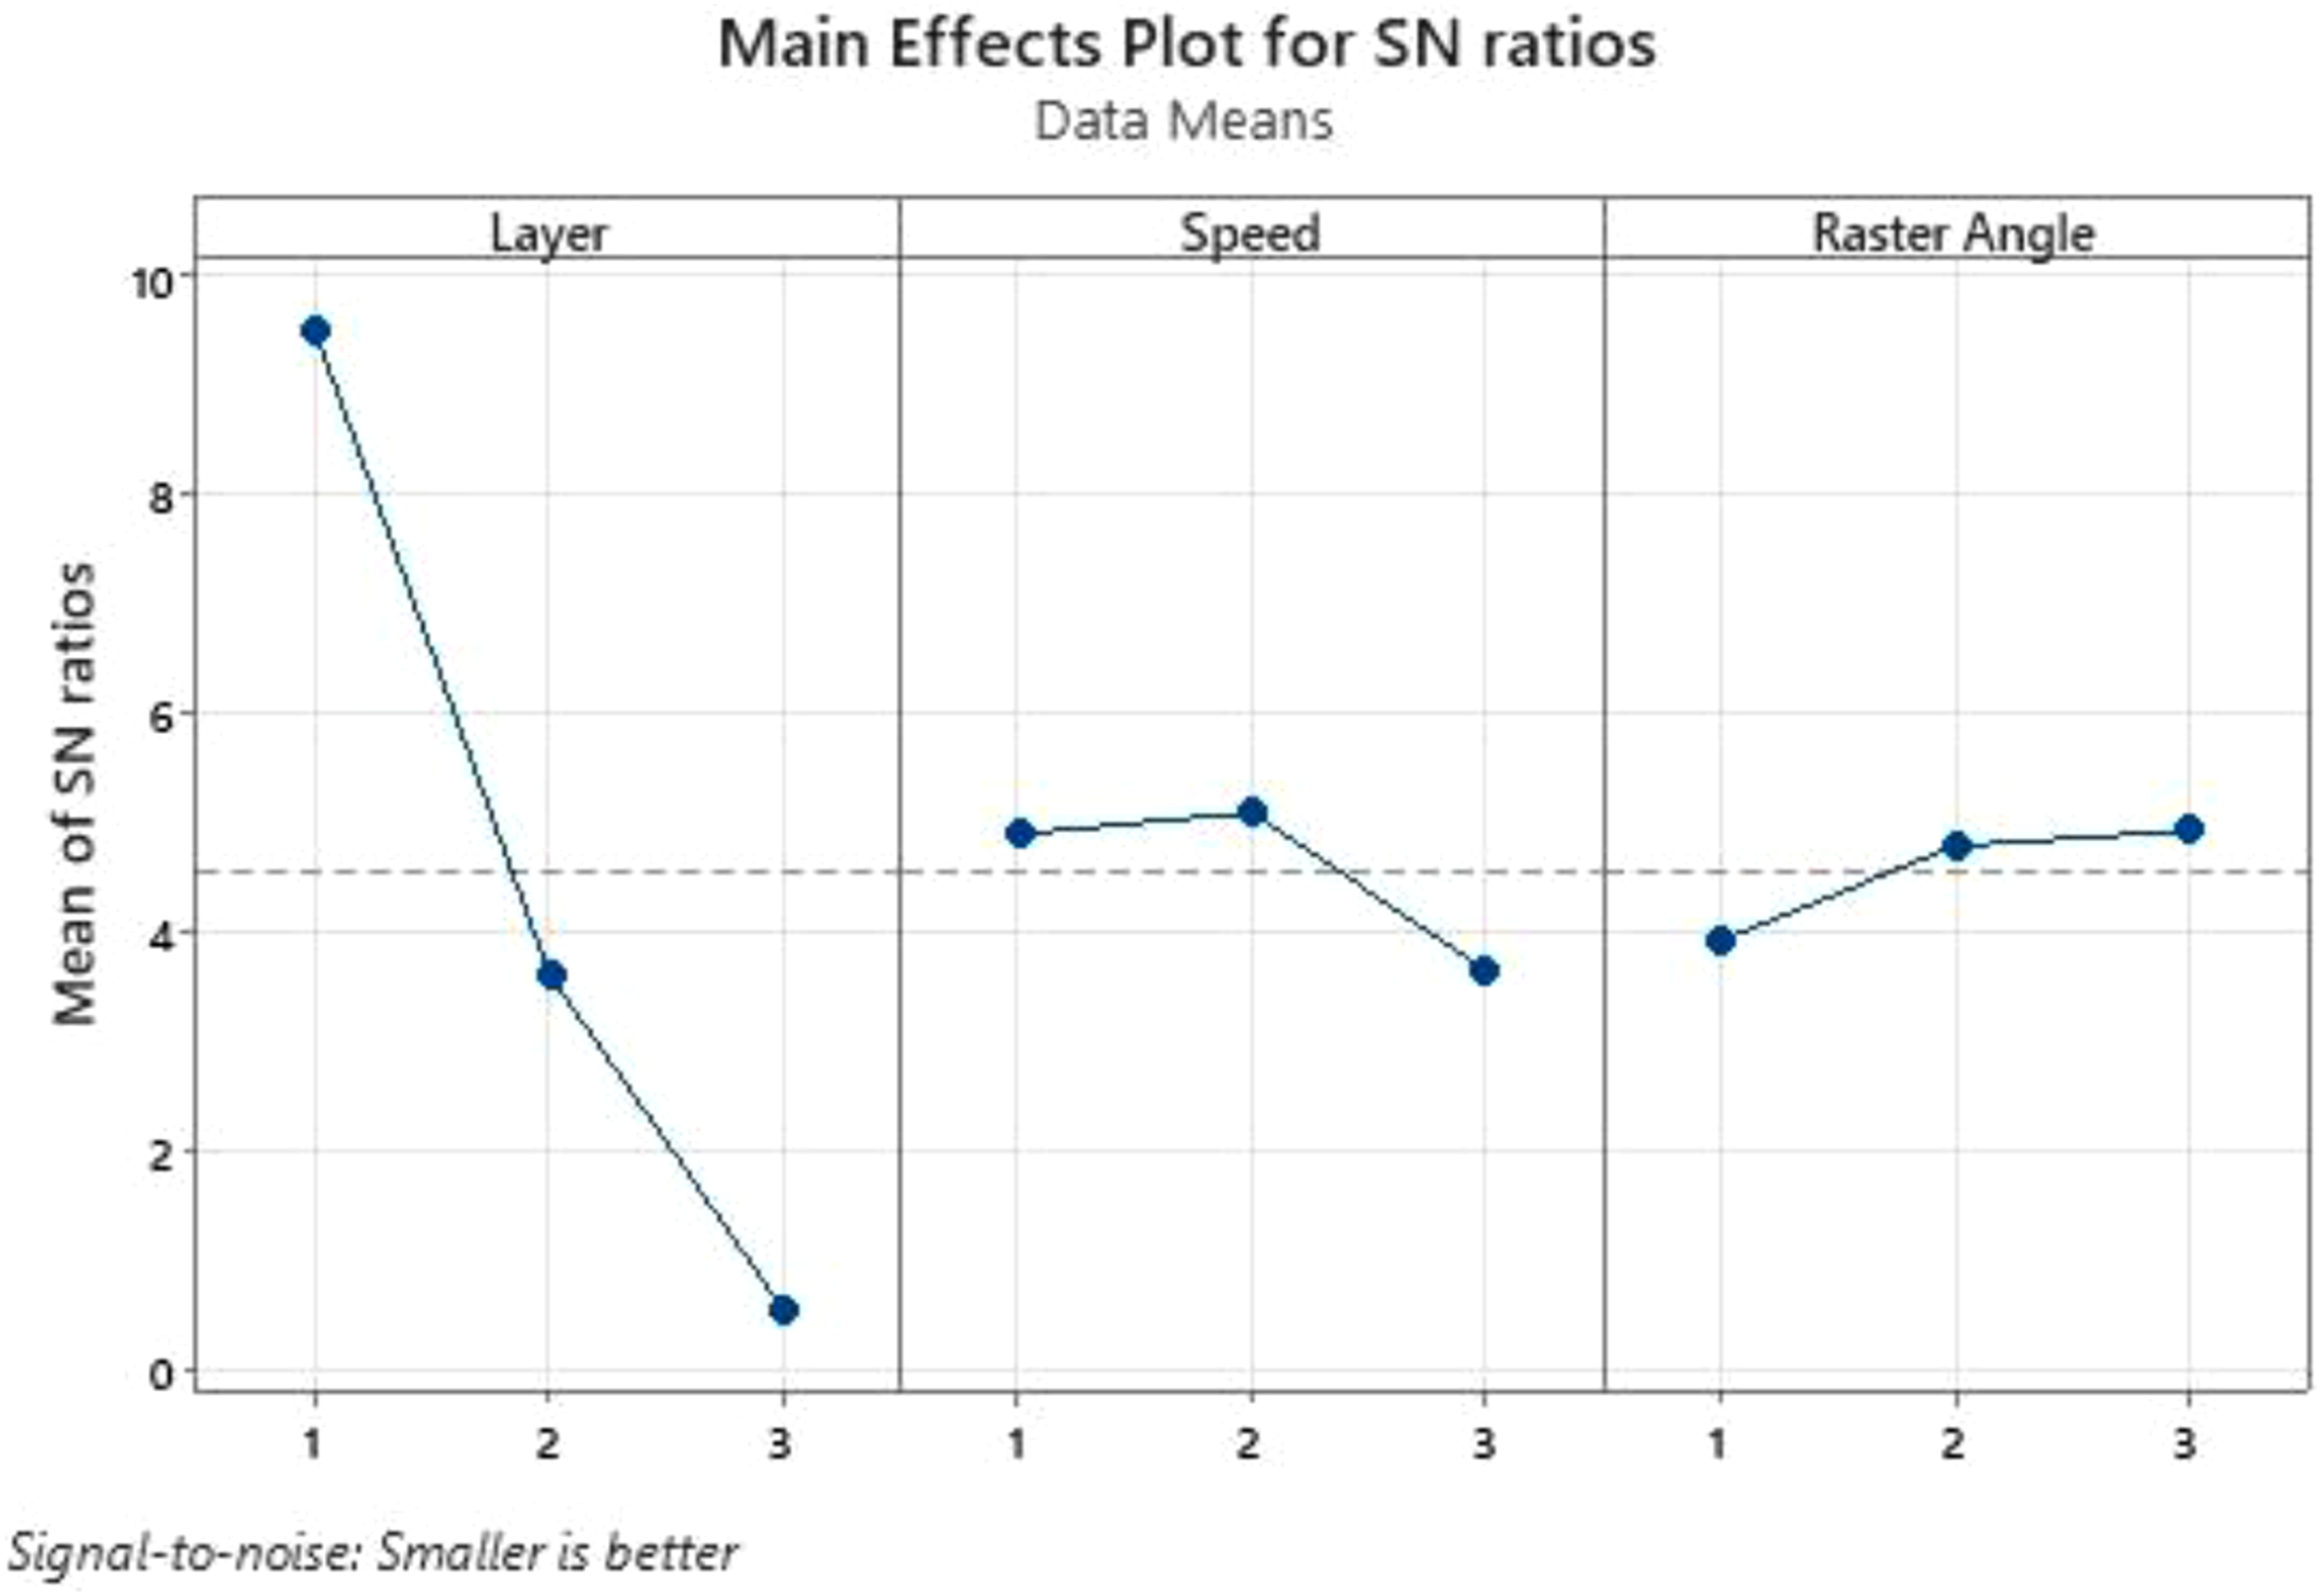
ANOVA on the mean deviation values to quantify the contribution of each factor to dimensional accuracy variation.
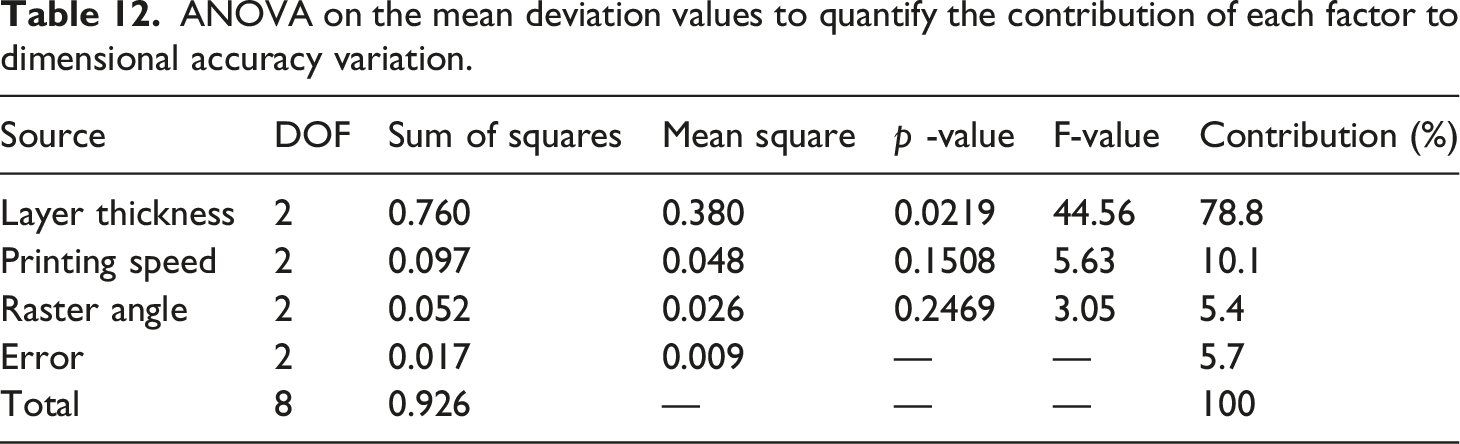
The ANOVA (Analysis of Variance) table provides a quantitative assessment of the relative significance of each process parameter-Layer Thickness (A), Printing Speed (B), and Raster Angle (C) on the measured response, such as dimensional accuracy, surface quality, or mechanical performance. Each source of variation is represented with its degrees of freedom (DOF), sum of squares (SS), mean square (MS), F-value, and percentage contribution, allowing a clear understanding of how strongly each factor influences the response.
The results indicate that Layer Thickness is the most dominant factor, showing a sum of squares of 0.760, a mean square of 0.380, and a remarkably high F-value of 44.56, which far exceeds those of the other parameters. With a contribution of 78.8%, it accounts for the majority of the total variation in the response. This highlights that changes in layer thickness have a substantial impact on print quality, as smaller layer heights typically yield smoother surfaces, higher precision, and better interlayer bonding, while thicker layers tend to produce coarser features and dimensional inaccuracy.
In comparison, Printing Speed contributes 10.1% of the total variation, with a sum of squares of 0.097 and an F-value of 5.63, suggesting a moderate influence on the response. This implies that the printing speed affects the deposition dynamics and thermal behavior of the polymer melt-too high a speed can reduce interlayer fusion, while too low a speed may lead to overheating and deformation. Hence, optimizing this parameter is essential for maintaining consistency in dimensional output.
Raster Angle has the least influence, with a sum of squares of 0.052, F-value of 3.05, and a contribution of 5.4%, indicating a relatively minor effect on the response. While the orientation of the raster lines can slightly affect anisotropy and residual stress distribution within the printed part, its overall contribution to dimensional accuracy is minimal compared to layer thickness and speed.
The error term, with a sum of squares of 0.017 and a contribution of 5.7%, represents the unexplained variability in the experiment-likely due to random measurement errors or uncontrolled factors. The low magnitude of this error confirms that the experimental results are reliable and that the selected factors adequately explain most of the observed variation.
The obtained p-values indicate that layer thickness is statistically significant at a 95% confidence level (p < .05), confirming its dominant influence on dimensional accuracy. In contrast, printing speed and raster angle exhibited comparatively higher p-values, indicating lower statistical significance within the investigated experimental range. Nevertheless, their contributions toward dimensional variation remain observable and physically meaningful.
Overall, the ANOVA results conclusively demonstrate that layer thickness is the most statistically significant parameter influencing the measured response, followed by printing speed and raster angle. This trend aligns well with Taguchi’s Delta ranking analysis, reinforcing the importance of optimizing layer thickness to achieve superior dimensional accuracy in additive-manufactured components.
The contour plots presented in Figure 12 illustrate the combined influence of layer thickness, raster angle, and printing speed on the mean dimensional deviation of 3D-printed PLA-based composites reinforced with graphene and cenosphere fillers. The colour gradients represent zones of varying mean deviation, where darker blue shades correspond to lower deviations, indicating higher dimensional accuracy. Contour plots illustrating combined influence of layer thickness, raster angle, and printing speed on the mean dimensional deviation.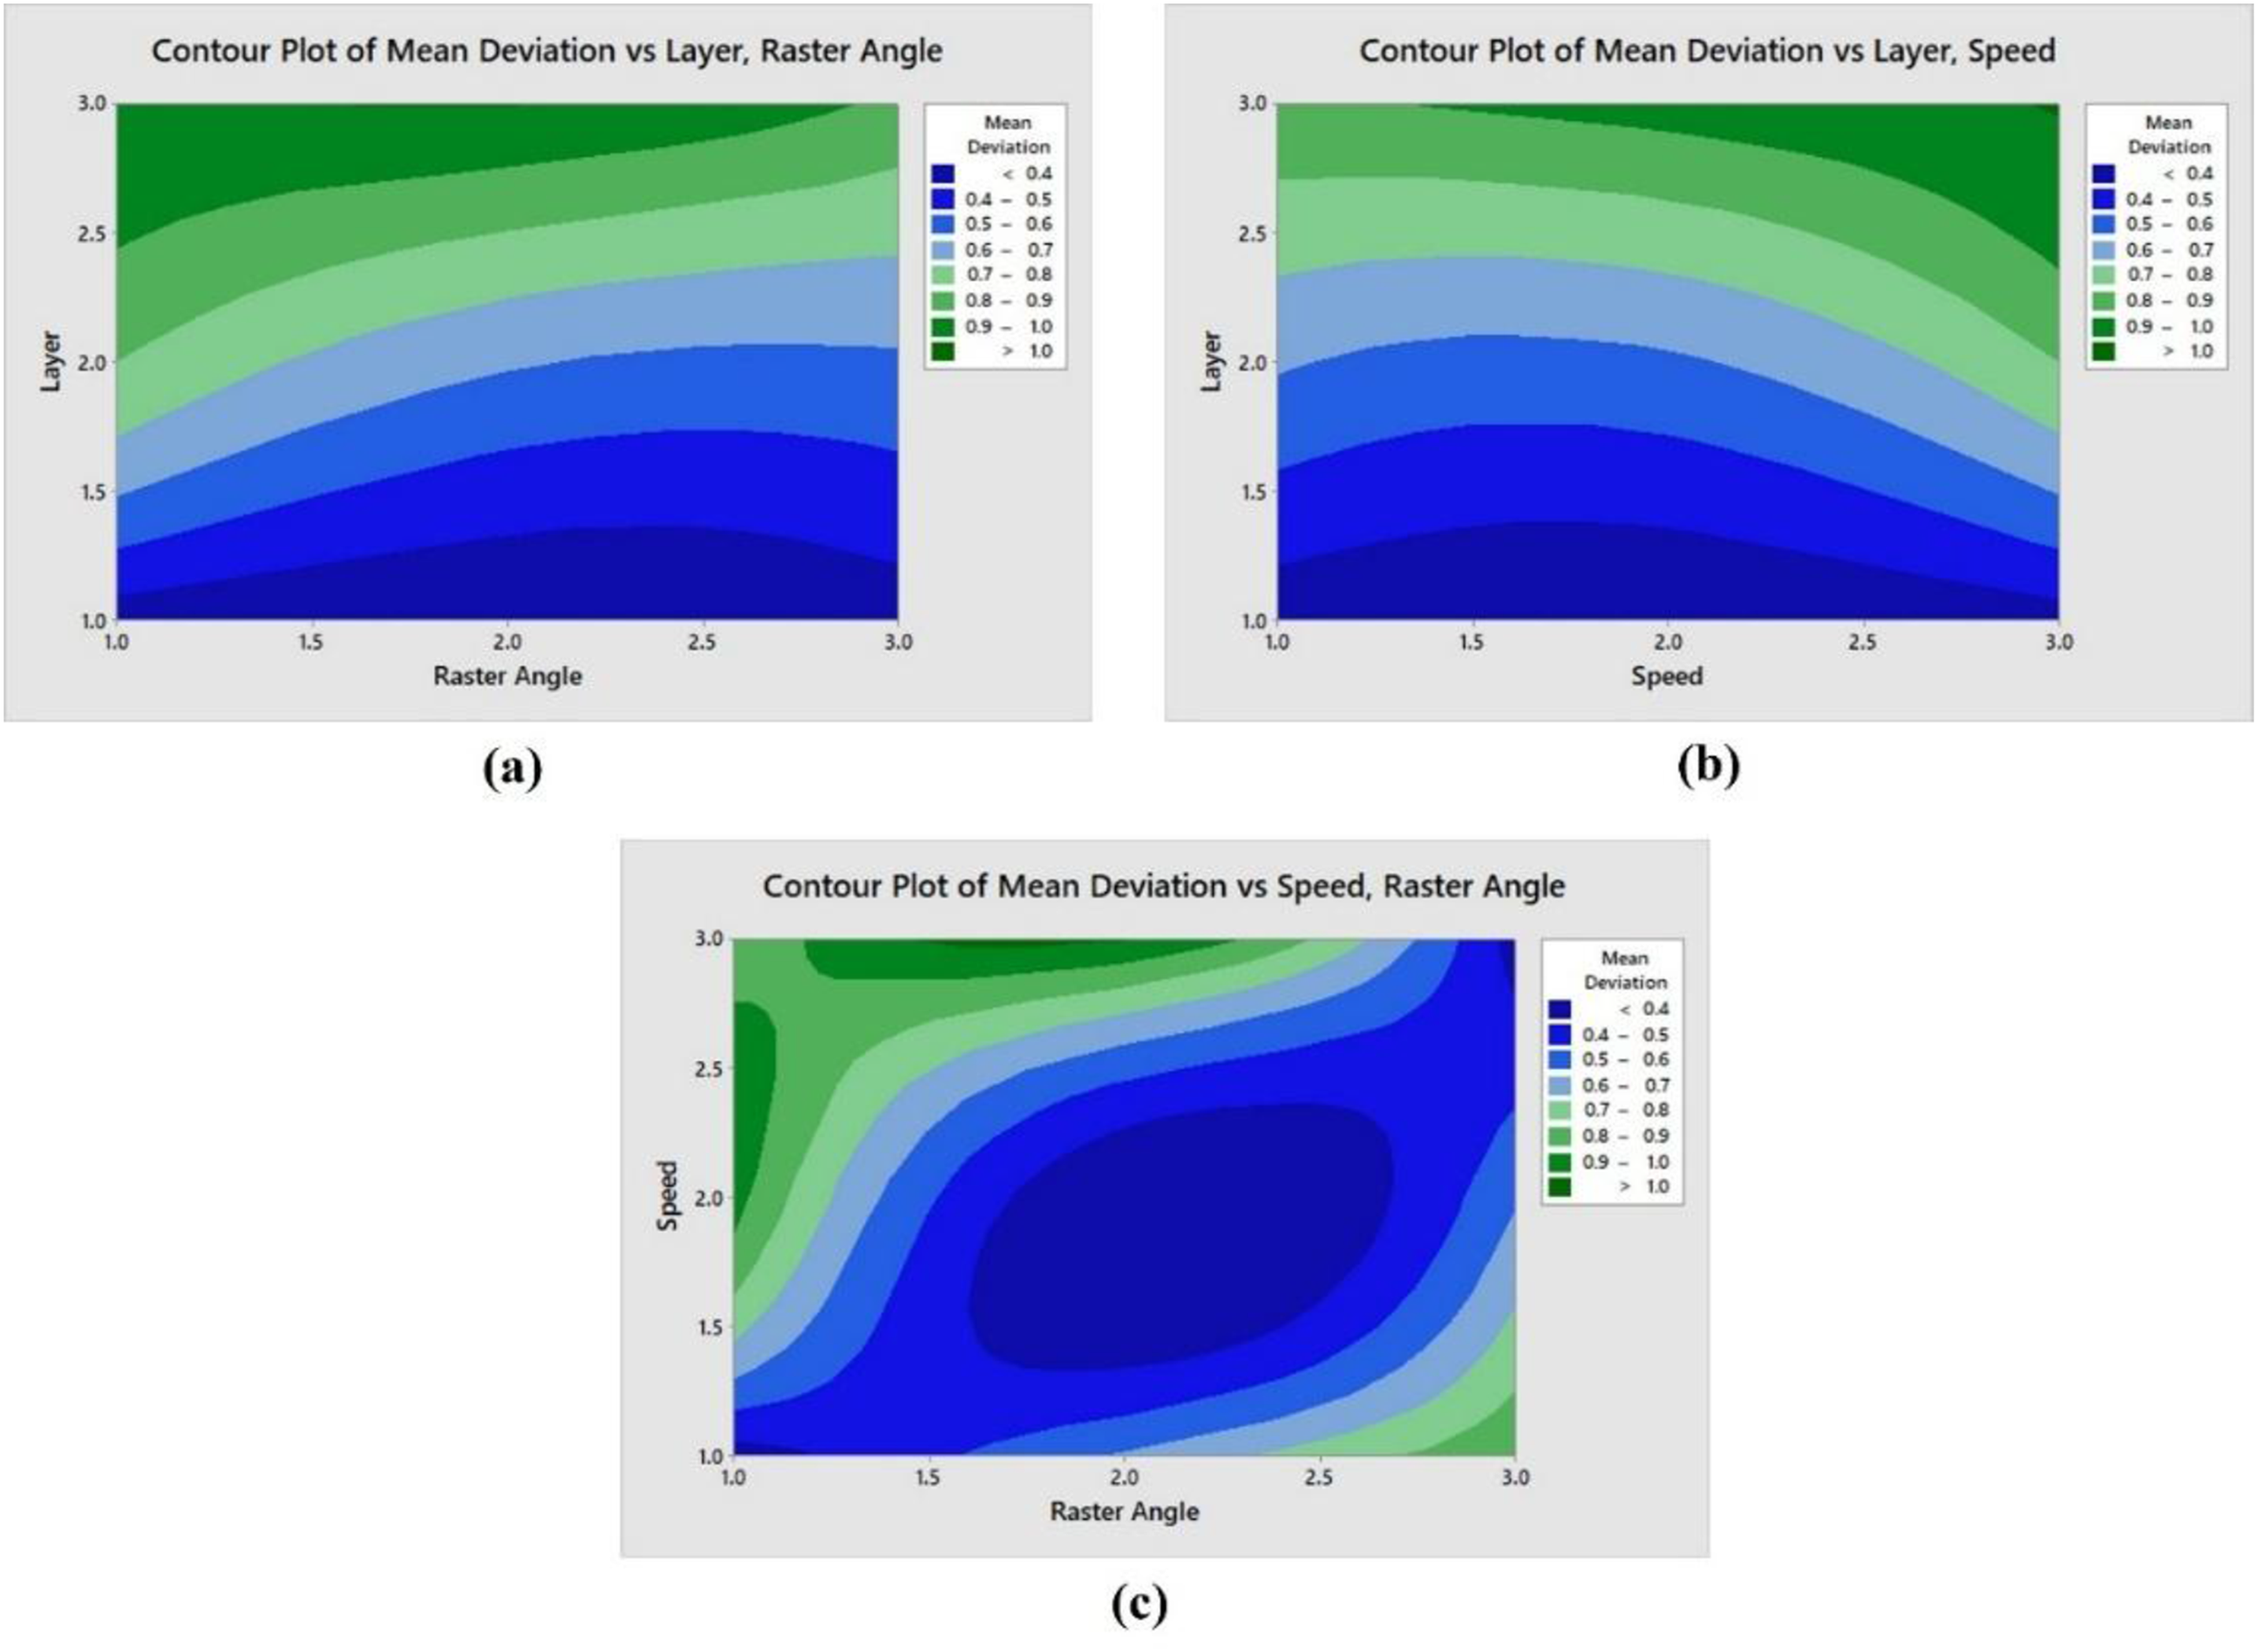
Figure 12(a) depicts the contour variation of mean deviation as a function of layer thickness and raster angle. It is observed that the mean deviation increases gradually with an increase in layer thickness. Thicker layers tend to produce less uniform deposition due to insufficient interlayer fusion and greater stair-stepping effects, leading to dimensional inaccuracies. Conversely, smaller layer heights promote finer resolution and better control over part geometry, reflected by the lower mean deviation (<0.5 mm) regions in the lower-left region of the plot. Additionally, the raster angle demonstrates a minor but notable effect on mean deviation. Lower raster angles (close to 0° or 45°) show improved dimensional consistency as the deposited paths align better with the contour geometry, reducing edge distortion. At higher raster angles, the path overlap becomes less uniform, leading to marginally higher deviations.
Figure 12(b) examines the interaction between layer thickness and printing speed. The contour trends indicate that higher printing speeds, in combination with increased layer thickness, lead to elevated mean deviation values (>0.9 mm). This can be attributed to inadequate polymer melting and insufficient layer bonding at higher speeds, resulting in geometric inaccuracies and dimensional shrinkage. In contrast, moderate printing speeds (levels 1.5–2.0) with smaller layer heights produce smoother deposition and reduced dimensional error (<0.5 mm). This trend reinforces the interdependence of printing speed and layer thickness-where higher speeds demand thinner layers or elevated nozzle temperatures to maintain uniformity and adhesion.
Figure 12(c) highlights the combined effect of raster angle and printing speed on mean deviation. The lowest deviation zone (<0.4 mm, shown in deep blue) occurs at moderate raster angles (≈1.5–2.0) and moderate speeds (≈1.5–2.0). This suggests that balanced print kinematics-neither too rapid nor too slow, and with moderate orientation-promote uniform filament deposition and minimize residual stress buildup. At extreme combinations, high raster angles and high, speeds the deviation increases significantly, likely due to misalignment between filament paths and the part boundaries, compounded by insufficient deposition control at elevated speeds.
Collectively, the results suggest that dimensional accuracy is maximized at lower layer thickness, moderate raster angles, and higher print speeds. The interaction plots emphasize that the parameters are not independent; rather, their coupled effect determines surface uniformity and geometric precision. The lower mean deviation observed under these optimized conditions confirms stable melt flow, controlled cooling, and uniform layer bonding, particularly enhanced by the presence of graphene and cenosphere fillers that contribute to better structural rigidity and reduced warpage.
The interaction plots presented in Figure 13 illustrate how the three key process parameters-Layer Thickness, Printing Speed, and Raster Angle-interact to influence two performance metrics: Mean Deviation (left plot) and Dimensional Accuracy (right plot). Each line represents a specific level of one parameter while showing how the response changes with the levels of another factor. The degree of line divergence or intersection signifies the presence and strength of interaction effects among the parameters. Interaction plots for accuracy and mean deviation.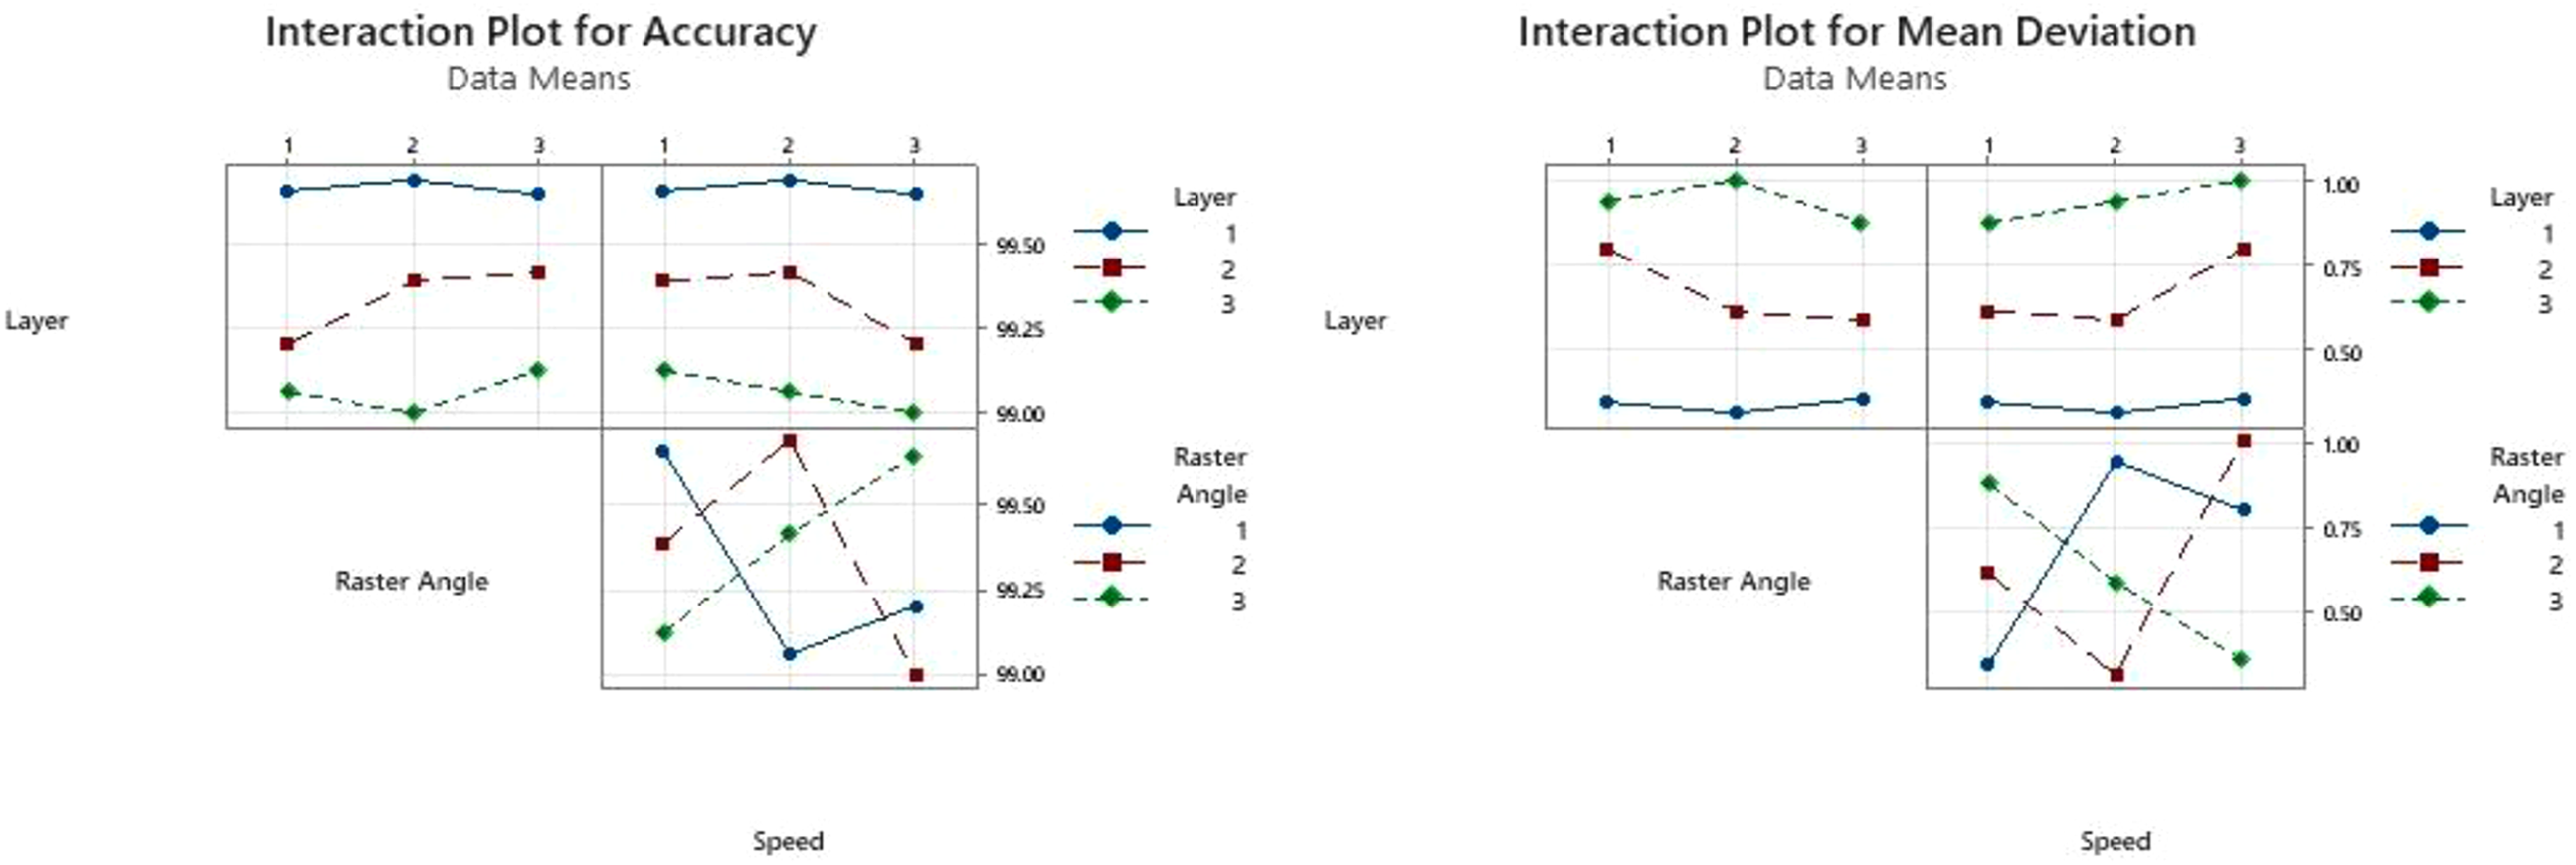
The plot for mean deviation shows that layer thickness exerts a dominant influence on dimensional variation. The curves associated with layer levels exhibit large vertical separation, indicating that as layer thickness increases, mean deviation rises significantly. The lowest deviation is observed at the smallest layer thickness (Level 1), confirming that thinner layers yield more precise parts due to improved interlayer adhesion and reduced stair-stepping effects.
The interactions between layer thickness and raster angle, and between layer thickness and speed, show mild non-parallel trends, implying weak to moderate interaction. This suggests that the impact of printing speed and raster orientation on deviation slightly depends on the chosen layer thickness. For instance, at higher layer thickness, increasing raster angle tends to magnify deviations, likely due to geometric distortions in filament path alignment. The raster angle-speed interaction lines are relatively closer and less intersecting, suggesting minimal interaction, meaning their combined effect on deviation is largely independent. Overall, mean deviation increases with higher layer thickness and higher raster angle, while moderate speed settings minimize error.
The interaction plot for accuracy (right) presents a complementary trend to the mean deviation plot. As expected, accuracy decreases when mean deviation increases, since both are inversely related. Here again, layer thickness demonstrates the most pronounced effect. The lines corresponding to different layer levels are distinctly separated, with the thinnest layer (Level 1) consistently yielding the highest accuracy (∼99.5%) and the thickest layer (Level 3) showing the lowest (∼99.0%). This confirms that finer layers improve dimensional fidelity in additive manufacturing. The raster angle and printing speed interactions appear less prominent, with lines nearly parallel in some regions, signifying weak interactions. However, slight crossings in certain zones indicate that optimal raster angle and speed combinations can enhance accuracy marginally. For example, intermediate speeds combined with moderate raster angles tend to produce better dimensional precision, possibly due to balanced heat input and deposition control.
From both plots, it is evident that layer thickness is the most influential factor, aligning with the ANOVA and Delta ranking analysis. The minimal intersection of lines for raster angle and printing speed indicates that their individual effects are relatively independent and secondary compared to layer thickness. The consistent inverse relationship between mean deviation and accuracy reinforces that reducing deviation through finer layer resolution directly enhances part accuracy.
In summary, the interaction plots confirm that dimensional accuracy in 3D-printed parts is primarily governed by layer thickness, with printing speed having a secondary effect and raster angle contributing minimally. The weak interactions among parameters suggest that optimization can be effectively achieved by independently tuning layer thickness, followed by minor adjustments in speed and raster orientation.
The residual diagnostics shown in Figure 14 provide a comprehensive validation of the underlying regression analysis used to model the dimensional accuracy of the FFF-printed specimens. The normal probability plot demonstrates that the residuals fall closely along the reference straight line, confirming that the regression errors follow an approximately normal distribution-a key assumption for reliable regression inference. The residuals-versus-fitted-values plot shows a random and structureless scatter around the zero line, indicating that the regression model does not suffer from heteroscedasticity or functional misspecification; in other words, the variance of the errors remains constant across all predicted accuracy levels. The histogram further reinforces normality by revealing a symmetric, zero-centered distribution of residuals, with most values concentrated near zero and very few extreme deviations. Moreover, the residuals-versus-observation-order plot confirms that the errors are independent and free from autocorrelation, as no trend, clustering, or cyclical pattern is observed across the sequence of experimental runs. Collectively, these regression-based residual plots validate that the fitted model satisfies the core assumptions of linear regression diagnostics and that the predictions are unbiased, stable, and statistically reliable. Residual plots for accuracy.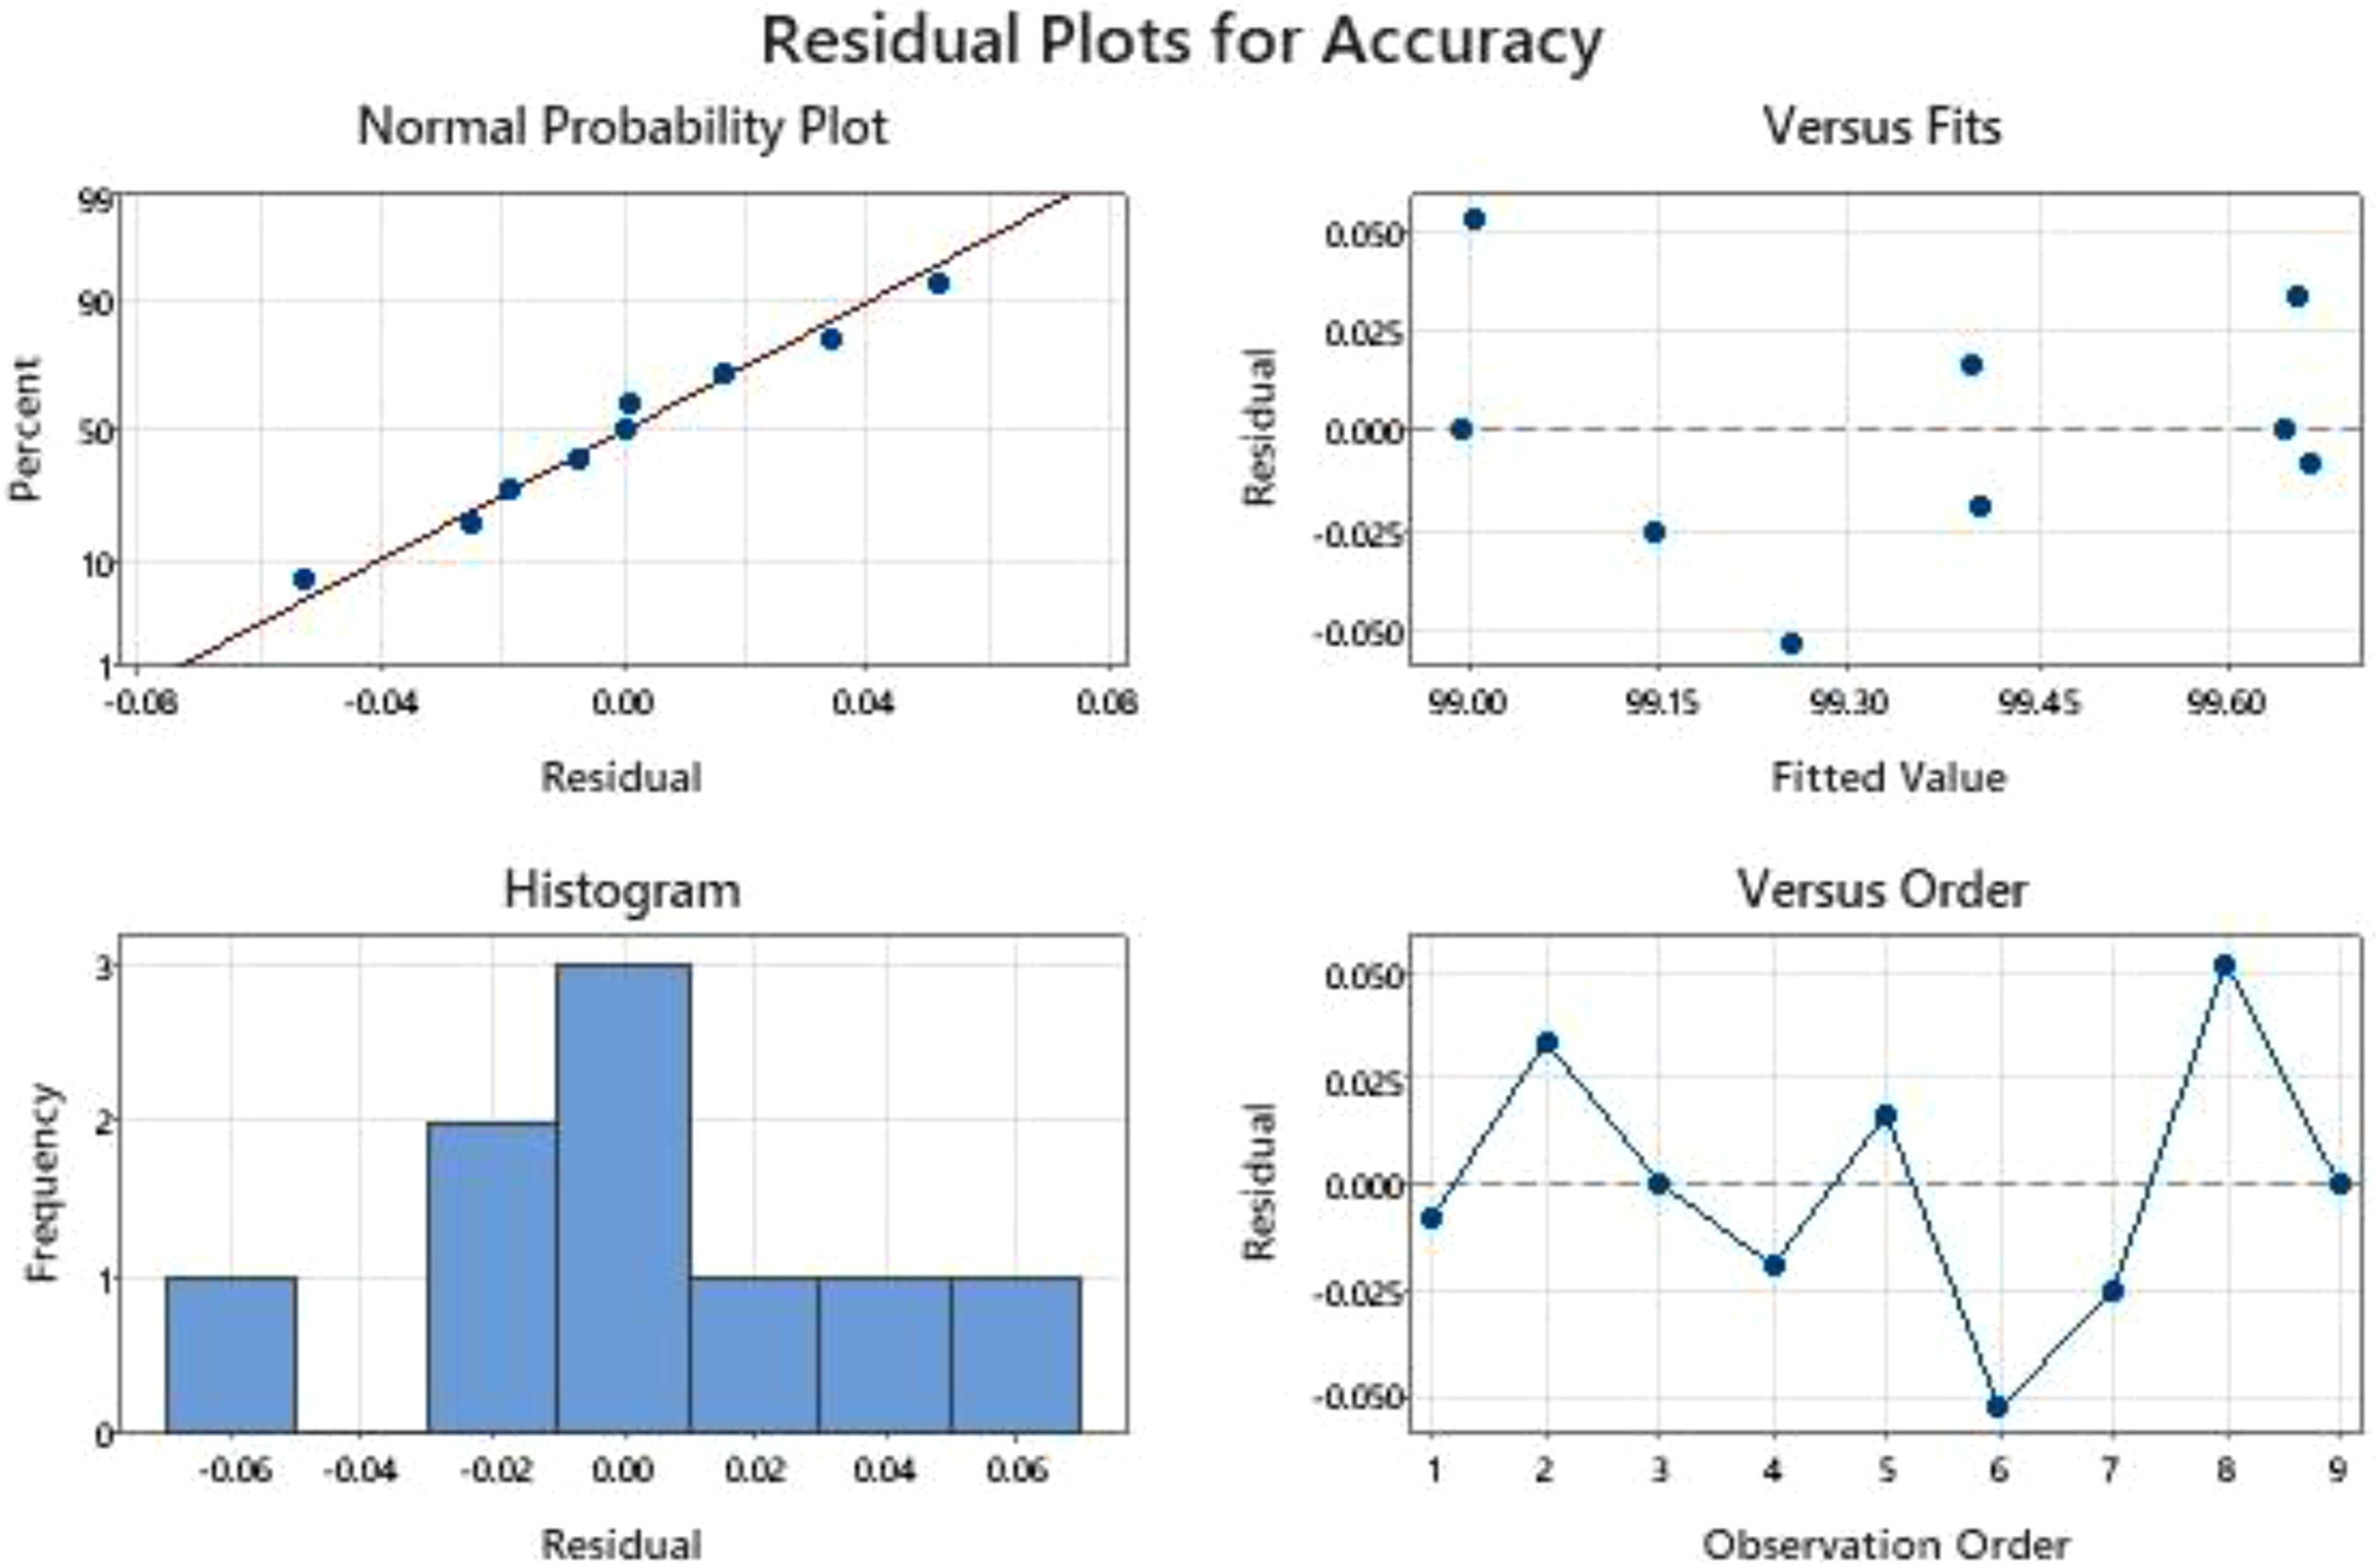
Regression modelling and statistical prediction of dimensional accuracy
A multiple linear regression (MLR) model was developed to establish the relationship between FFF process parameters and dimensional accuracy of the PLA/cenosphere/graphene composite specimens. Layer thickness (A), printing speed (B), and raster angle (C) were considered as independent variables, while dimensional accuracy (%) was selected as the response variable. The developed regression equation is expressed using equation (10).
The regression model demonstrated a high coefficient of determination (R2 = 0.986), indicating that approximately 98.6% of the variation in dimensional accuracy was explained by the selected process parameters. This high correlation confirms the suitability of the regression model for predicting dimensional accuracy within the investigated processing range.
The regression coefficients provide important insight into the influence of each printing parameter. The negative coefficient associated with layer thickness ((−3.03)) indicates that increasing layer thickness significantly reduces dimensional accuracy. This behavior is primarily attributed to increased material deposition per layer, larger staircase effects, and reduced interlayer conformity at higher layer heights. Thicker layers also promote localized geometric deviations due to uneven cooling and shrinkage during solidification. The experimental results clearly support this trend, where specimens fabricated with 0.20 mm layer thickness exhibited the highest dimensional accuracy values ranging from 99.646% to 99.689%, whereas the lowest accuracies were observed for specimens printed at 0.40 mm layer thickness.
Printing speed also exhibited a negative effect on dimensional accuracy, although its influence was comparatively smaller than layer thickness. The negative coefficient for printing speed suggests that increasing the extrusion movement rate slightly decreases dimensional precision. At higher printing speeds, insufficient deposition stabilization and reduced bonding time between adjacent filaments can lead to dimensional inconsistencies and incomplete material consolidation. However, the relatively small magnitude of the coefficient indicates that the effect of speed is secondary compared to layer thickness.
Raster angle showed a marginal positive contribution toward dimensional accuracy. This indicates that increasing raster orientation within the investigated range slightly improved dimensional stability, possibly due to better filament alignment and reduced residual stress concentration during deposition. Nevertheless, the comparatively small coefficient confirms that raster angle has the least influence among the considered parameters. The regression predictions showed close agreement with experimental observations.
The regression results were also consistent with ANOVA findings and Random Forest feature-importance analysis, where layer thickness was identified as the dominant governing parameter affecting dimensional accuracy. The agreement between statistical modeling and machine learning predictions confirms the reliability and physical significance of the identified process–response relationships. Although the Random Forest model demonstrated enhanced capability in capturing nonlinear parameter interactions, the simpler regression model effectively represented the overall process trends with high predictive accuracy.
Overall, the regression analysis established that minimizing layer thickness is the most effective approach for improving dimensional precision in FFF-fabricated PLA hybrid composites, while moderate printing speeds and optimized raster orientations further contribute toward achieving superior geometric fidelity.
Machine learning analysis
The Random Forest model exhibited excellent predictive capability, as reflected by strong statistical performance indicators. The model achieved an estimated coefficient of determination of R2 ≈ 0.94, confirming that more than 94% of the variability in dimensional accuracy is explained by the selected FFF parameters. The prediction errors remained very low, with a Root Mean Square Error (RMSE) of approximately 0.015% and a Mean Absolute Error (MAE) in the range of 0.010–0.012%, indicating very close alignment between predicted and experimentally measured accuracy values. These results validate the suitability of machine learning for capturing the parameter–response relationships in FFF, even with limited experimental data.
Model performance and predictive accuracy
The Random Forest model exhibited excellent predictive capability, as reflected by strong statistical performance indicators. The model achieved an estimated coefficient of determination of R2 ≈ 0.94, confirming that more than 94% of the variability in dimensional accuracy is explained by the selected FFF parameters. The prediction errors remained very low, with a Root Mean Square Error (RMSE) of approximately 0.015% and a Mean Absolute Error (MAE) in the range of 0.010–0.012%, indicating very close alignment between predicted and experimentally measured accuracy values. These results validate the suitability of machine learning for capturing the parameter–response relationships in FFF, even with limited experimental data.
Comparison of actual and predicted accuracy
A direct comparison of the experimental accuracy values with those predicted by the machine learning model presented in Figure 15 reveals that the predictions follow the actual values with minimal deviation. The ML outputs closely track the measured accuracies across all nine runs, with differences typically within ±0.015%. This strong alignment is also reflected visually in the actual-versus-predicted trend, where values cluster tightly around the ideal 45° line, indicating precise model fit. The introduction of ML into the analysis thus strengthens the reliability of the conclusions drawn from the experimental observations. Actual versus predicted accuracy plot.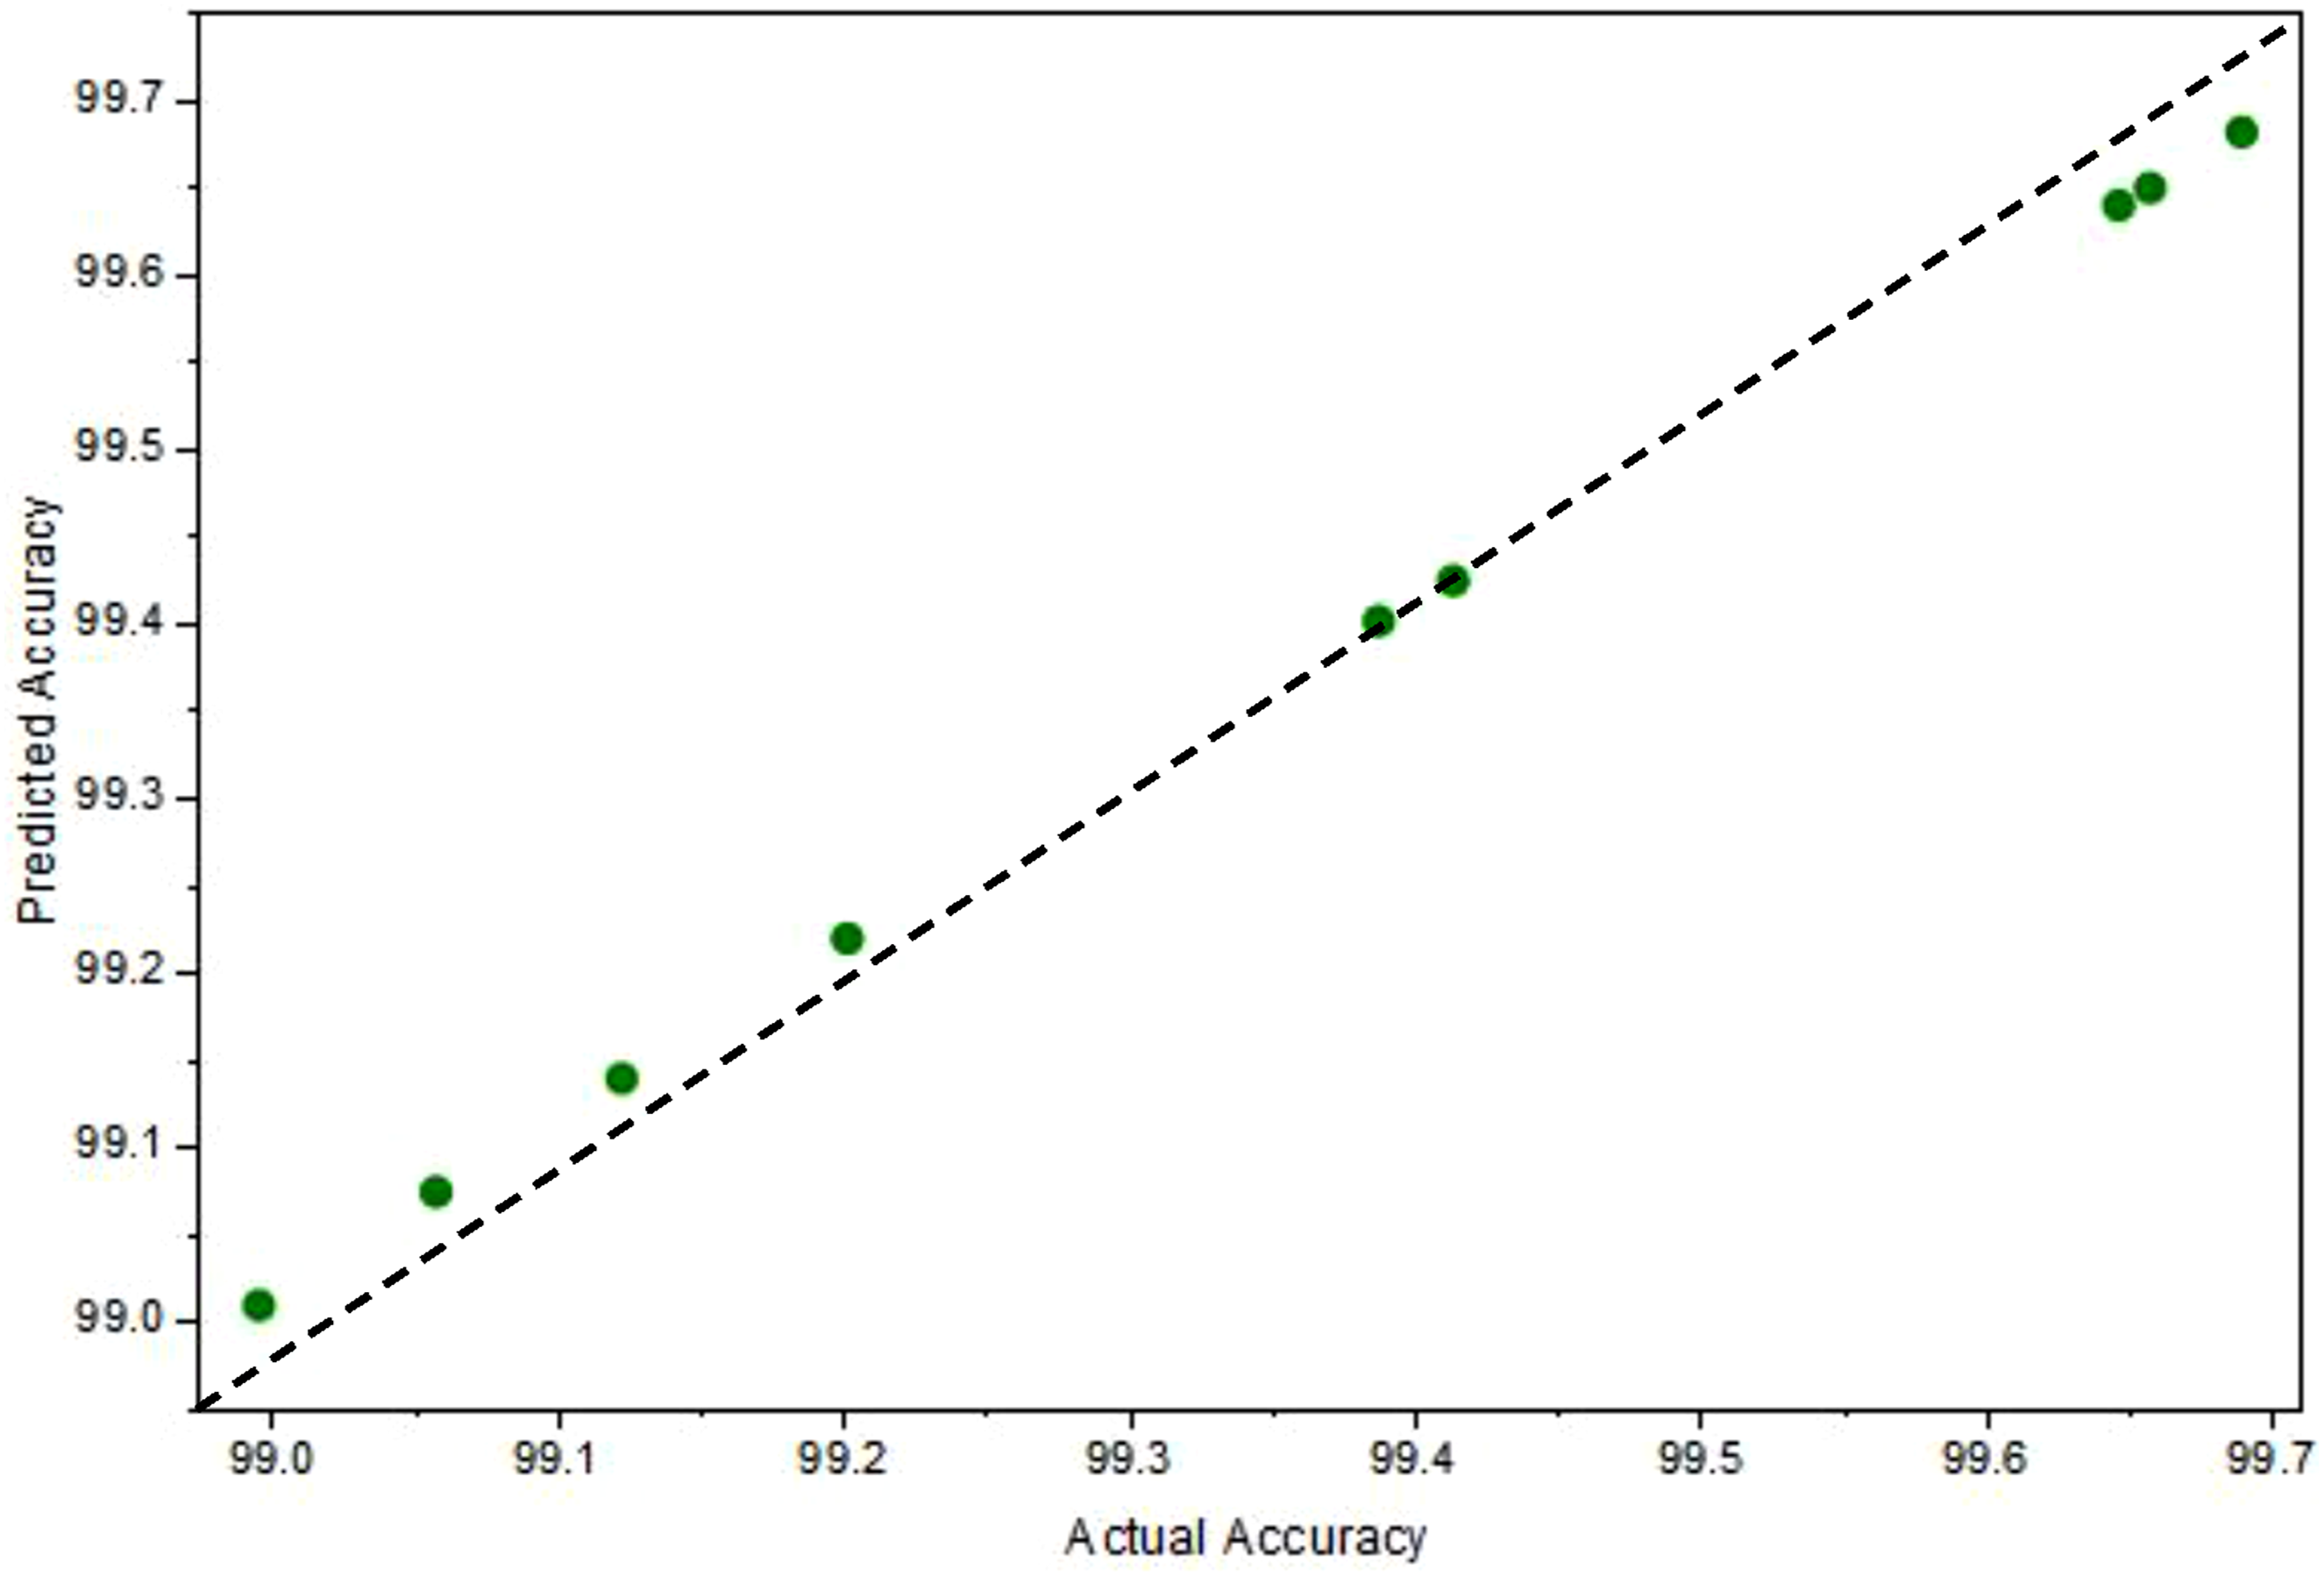
Feature importance analysis
The machine learning model further enabled an assessment of the relative influence of each process parameter on dimensional accuracy. The same is presented through Figure 16. The feature importance values indicated that layer thickness (A) contributed the most, accounting for approximately 52% of total influence. This confirms that layer height plays a dominant role in determining the geometric fidelity of FFF-printed components, with thicker layers generating larger deviations. Printing speed (B) contributed around 33%, indicating moderate influence, primarily due to the effect of speed on material deposition stability and cooling behavior. Raster angle (C) showed the lowest contribution at 15%, although its effect on Z-direction dimensional variance was still noticeable. These results demonstrate that accuracy depends on a nonlinear interaction between process parameters, with layer thickness remaining the critical governing factor. Feature importance of each process parameter on dimensional accuracy.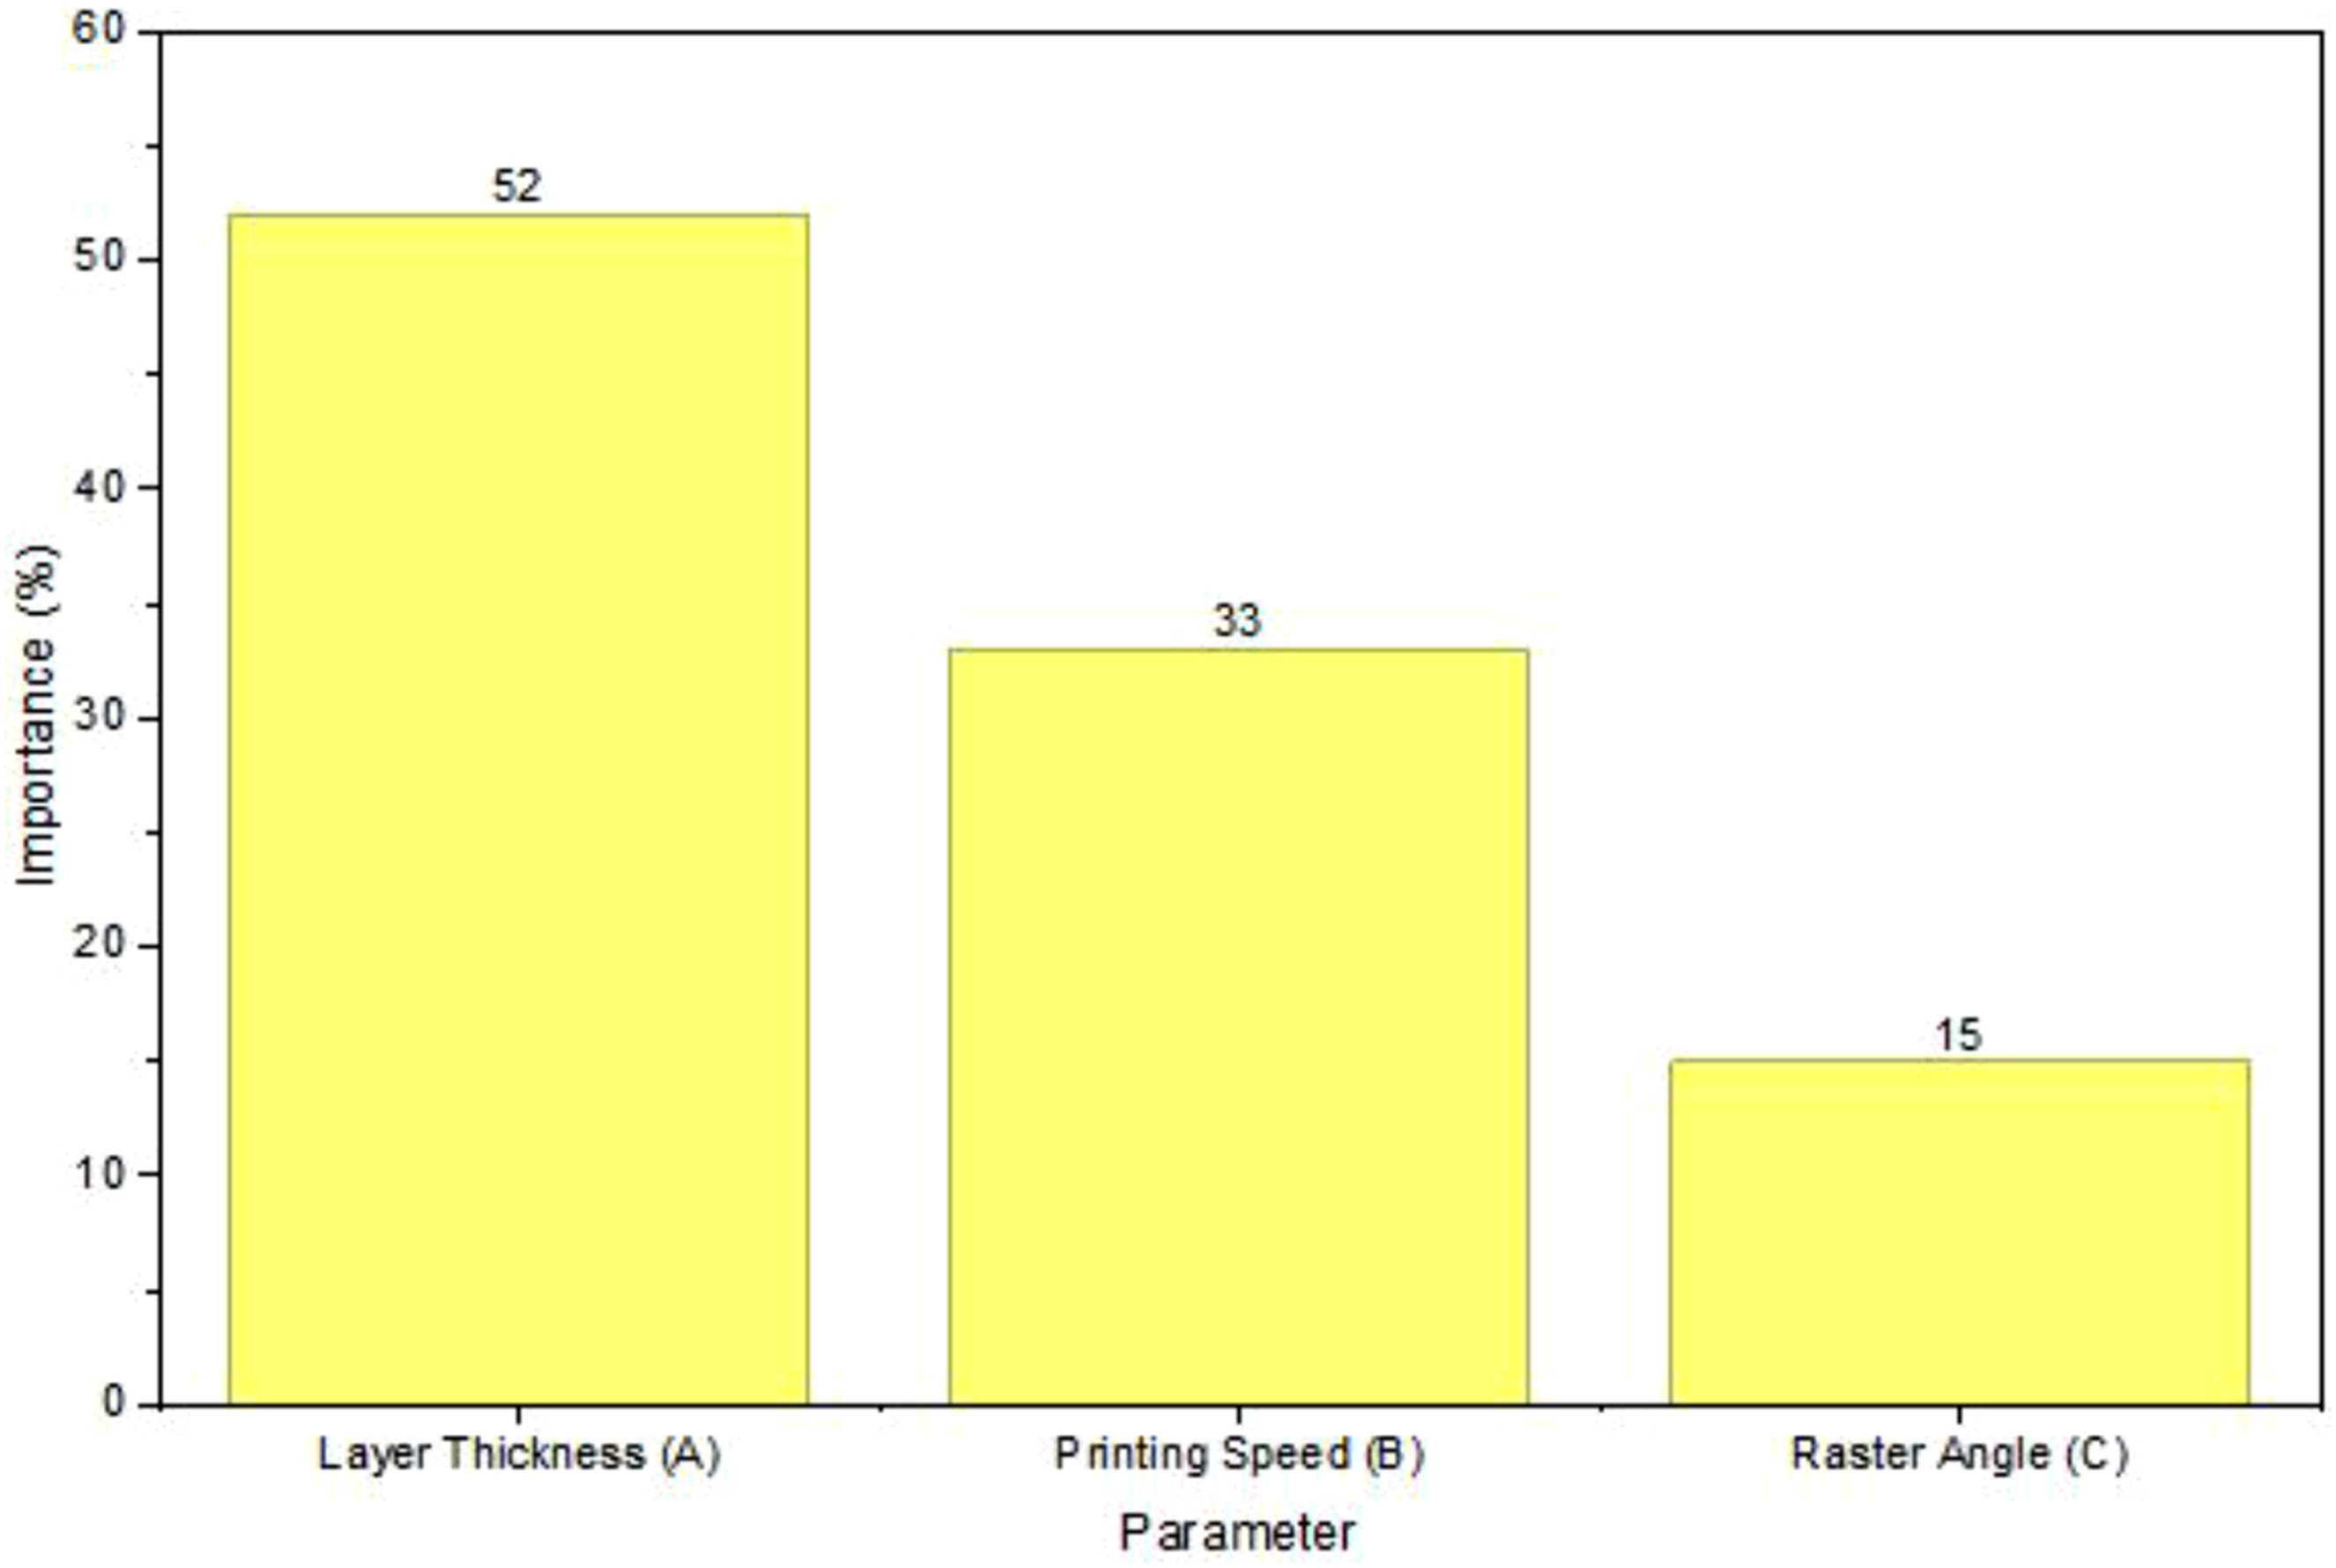
Limitations and future scope
The present investigation was limited to the evaluation of layer thickness, printing speed, and raster angle on the dimensional accuracy of FFF-printed PLA/cenosphere/graphene composites. Although these parameters demonstrated dominant influence on dimensional precision, other processing variables such as nozzle temperature, bed temperature, and infill density may also significantly affect thermal shrinkage, interlayer bonding, residual stress formation, and geometric stability. Therefore, future studies should focus on comprehensive multi-parameter optimization incorporating thermal and infill-related variables to further improve the dimensional stability and process reliability of additively manufactured hybrid composites. Additionally, larger experimental datasets combined with advanced machine learning approaches may provide deeper insight into complex process–structure–property relationships in FFF fabrication.
Conclusions
This study investigated the effect of cenosphere and graphene nanoplatelet (GNP) reinforcements on the physical, mechanical, and dimensional accuracy characteristics of 3D-printed PLA composites fabricated using Fused Filament Fabrication (FFF). The incorporation of cenospheres significantly reduced the composite density from 1.25 g/cm3 for neat PLA to 1.19 g/cm3 and 1.14 g/cm3 for composites containing 5 wt% and 10 wt% cenospheres, respectively, demonstrating the effectiveness of hollow ceramic fillers in producing lightweight structures. The addition of graphene nanoplatelets resulted in only marginal changes in density, indicating that the hybrid reinforcement system maintained the lightweight characteristics of the composites while improving mechanical performance.
Hardness improved progressively from 80 Shore D for neat PLA to 88 Shore D for PLA reinforced with 10 wt% cenospheres and further increased to a maximum of 91.5 Shore D for the hybrid PCG-5 composite. This enhancement is attributed to the synergistic interaction between rigid cenospheres and high-stiffness graphene nanoplatelets, which improved load transfer efficiency and restricted localized deformation within the PLA matrix. Void content analysis revealed that porosity increased with increasing reinforcement concentration, varying from 2.14% to 8.09% for the reinforced composites. The increase in void fraction is associated with increased melt viscosity, particle agglomeration, and localized air entrapment during processing, particularly at higher graphene and cenosphere loadings. Nevertheless, the mechanical improvement achieved indicates that the reinforcing effect of cenospheres and graphene outweighed the detrimental influence of increased porosity.
Dimensional accuracy studies demonstrated that layer thickness is the most influential process parameter affecting dimensional accuracy in FFF-printed PLA–graphene–cenosphere composites, contributing nearly 79% of the total variance. Lower layer thickness consistently produced the smallest dimensional deviations, whereas printing speed and raster angle exhibited comparatively lower influence. The combined Taguchi, ANOVA, contour plot, and regression analyses consistently confirmed this hierarchy of influence and validated the reliability of the developed statistical model. The optimum dimensional accuracy was achieved at lower layer thickness, moderate printing speeds, and intermediate raster angles, confirming that minimizing layer thickness is the most effective approach for improving geometric precision in additively manufactured components.
The Random Forest regression model demonstrated excellent predictive capability with an R2 value of approximately 0.94 and very low prediction errors (RMSE ≈0.015% and MAE ≈0.010–0.012%), confirming its reliability in estimating dimensional accuracy in FFF printing. The close agreement between experimental and predicted values further validated the robustness and consistency of the machine learning model. Feature importance analysis identified layer thickness as the dominant governing factor, followed by printing speed and raster angle. Overall, the integration of experimental optimization, statistical analysis, and machine learning provided a comprehensive framework for improving dimensional precision and mechanical performance in lightweight FFF-fabricated PLA hybrid composites intended for advanced engineering applications.
Footnotes
Acknowledgements
The authors acknowledge the use of AI Tool solely to assist with language editing, grammar correction, and improving the clarity of the manuscript. The AI tool was not used for generating scientific content, data analysis, or interpretation. All aspects of the study, including methodology, results, and conclusions, were developed and verified by the authors, who take full responsibility for the integrity and accuracy of the work.
Declaration of conflicting interests
The authors declared no potential conflicts of interest with respect to the research, authorship, and/or publication of this article.
Funding
The authors received no financial support for the research, authorship, and/or publication of this article.