
Abstract
This study investigates the compressive behaviour of fused filament fabricated (FFF) acid-functionalized multi-walled carbon nanotube (MWCNT)-reinforced polylactic acid (PLA) composites through integrated experimental, statistical, and machine-learning (ML) approaches. PLA–MWCNT composite filaments containing 10 wt% MWCNTs were fabricated through melt compounding and re-extrusion, followed by FFF printing using varying raster build orientation (RBO), raster bead height (RBH), hot-end temperature (HET), and raster build pattern (RBP). A full-factorial experimental design comprising 54 parameter combinations was employed to evaluate compressive performance. The results identified RBO as the dominant process parameter governing compressive behaviour, followed by RBP and RBH. The maximum compressive strength of 121.89 MPa was achieved at 225°C HET, 0° RBO, 0.10 mm RBH, and honeycomb RBP. The improved compressive behaviour at lower RBH and 0° RBO was associated with enhanced interlayer load transfer and reduced interface-dominated failure. Honeycomb structures exhibited superior compressive stability relative to gyroid structures due to improved load-transfer continuity and structural stiffness. Comparative SEM, DSC, TGA, and FTIR characterization of neat PLA and PLA–MWCNT composites was performed to strengthen the structure–property interpretation of the material system. SEM analysis revealed relatively distributed MWCNT-rich regions without severe large-scale agglomeration. DSC analysis indicated modified crystallization behaviour after MWCNT incorporation, while TGA demonstrated improved thermal stability with increased onset degradation temperature from 320°C to 338.03°C. FTIR analysis confirmed the characteristic functional groups of PLA without significant alteration of the primary chemical structure after MWCNT incorporation. Among the developed ML models, random forest regression achieved the highest prediction accuracy with R2 = 0.9686 and RMSE = 2.59 MPa, while SHAP analysis confirmed RBO as the most influential parameter affecting compressive performance. The integrated DOE–RSM–ML–SHAP approach provides an interpretable experimental–ML framework for prediction and analysis of compressive behaviour within the investigated parameter space for lightweight and structural applications.
Introduction
The growing ecological burden associated with petroleum-based polymers has accelerated global efforts toward developing sustainable materials capable of reducing long-term environmental degradation.1,2 PLA, synthesized from renewable feedstocks such as corn starch and sugarcane, has consequently emerged as a widely adopted biopolymer due to its biodegradability, high stiffness, dimensional stability, and compatibility with existing thermoplastic processing routes.3,4 Despite these advantages, pristine PLA suffers from low toughness, limited ductility, and moderate impact resistance,5 5 restricting its wider use in structural and load-bearing applications where higher mechanical robustness is required.6,7
To address these constraints, polymer scientists have increasingly incorporated nanoscale carbonaceous reinforcements such as graphene nanoplatelets,3,8 CF,9–11 and MWCNTs.12–14 These reinforcements are characterized by high aspect ratio, exceptional stiffness, and strong interfacial adhesion that significantly enhance tensile, flexural, and compressive properties through improved stress transfer and microstructural reinforcement.12,15 PLA–MWCNT composites, in particular, exhibit superior mechanical and multifunctional behavior, including enhanced stiffness, electrical conductivity, and thermal stability.16,17 However, the final performance of such nanocomposites is intricately linked not only to filler type and dispersion quality but also to the PPPs employed during fabrication.18–20
FFF as shown in Figure 1 has become one of the most widely used polymer AM approaches due to its low material wastage, geometric versatility, and capability for customized production.21–25 Nonetheless, FFF-printed components are inherently anisotropic and their mechanical behavior is highly sensitive to PPPs such as RBO,26,27 raster build height RBH,28–30 HET,31–33 and RBP.34–37 Variations in these PPPs influence bead geometry, polymer chain diffusion, crystallization behavior, void formation, and the efficiency of interlayer bonding all of which directly dictate compressive, tensile,38,39 and flexural performance.40–42 Schematic view of FFF representing PPP used in this study.
A substantial body of literature has examined the influence of FFF PPPs on mechanical behavior. Chacón et al. 43 reported strong orientation-dependent variations, where vertical builds suffered from poor interlayer fusion and thus lower tensile strength. Maguluri et al. 44 demonstrated that higher HET (≥220°C) improve bonding by increasing melt fluidity, while inappropriate combinations of raster build speed and RBH can induce micro voids. Hanon et al. 45 found that smaller RBH (0.10–0.15 mm) favor enhanced raster fusion and improved strength. Gonabadi et al. 46 and Yu et al. 47 showed that infill density and RBO dominate mechanical performance, while RBP often plays a secondary role. Previous studies on neat PLA fabricated through FFF have demonstrated that compressive behavior is highly dependent on process parameters such as raster orientation, layer height, raster width, and infill configuration. Claudio et al. 48 reported CS of approximately 61–73 MPa for FFF-printed neat PLA under optimized compression-oriented printing conditions using ASTM D695 testing.
Specific to PLA-MWCNT systems, prior studies revealed that nanotube addition substantially augments stiffness and CS49,50; however, effective performance is contingent upon homogeneous dispersion and optimized PPPs. Vidakis et al. 51 demonstrated that MWCNT incorporation improved mechanical strength by promoting a percolated reinforcement network. Tyagi et al. 52 presented compression studies on PLA–MWCNT and PLA–CF composites, emphasizing the sensitivity of compressive stability to nozzle diameter and RBP.
Parallel to these developments, ML has emerged as a powerful tool for modeling and predicting AM process outcomes.53–55 Neural networks, 56 random forests, gradient boosting models, 57 and hybrid Taguchi–ML58,59 frameworks have demonstrated exceptional accuracy in predicting tensile, flexural, and compressive behavior of polymer composites. However, many of these models function as black boxes, limiting their interpretability and hindering their practical adoption. Recent advances in explainable artificial intelligence, particularly SHAP,60,61 provide a mechanism to quantify the contribution of individual PPPs, offering insights into how each PPP influences mechanical performance that something essential for reliable AM optimization.
Literature survey showing the research gaps in recent studies.
Based on these gaps, the central hypothesis of this investigation asserts that a hybrid experimental–ML methodology can (i) model nonlinear dependencies between PPPs and CS with high fidelity, (ii) reveal dominant and interacting PPPs through SHAP-based interpretability, and (iii) outperform traditional statistical methods in prediction accuracy and insight generation. This hypothesis is grounded in the expectation that integrating DOE-based structure, ML-driven prediction, and SHAP-enabled explainability will provide a holistic understanding of the process–structure–property relationships governing PLA–MWCNT composite behavior. This framework was further supported through SEM, DSC, TGA, and FTIR characterization to correlate compressive behavior with the thermal and physicochemical characteristics of the PLA–MWCNT composite system.
To validate this hypothesis, the present work introduces a fully integrated experimental–ML Framework that combines Taguchi design, ANOVA, and RSM with advanced regression algorithms and SHAP analysis. Compression specimens are fabricated by systematically varying RBO, RBH, HET, and RBP to construct a comprehensive dataset linking PPP to compressive response. The unique scientific contribution of this study is the development of an integrated process–structure–property framework for FFF-printed PLA–MWCNT composites combining full-factorial experimentation, compressive characterization, SEM-based morphology assessment, DSC/TGA/FTIR thermal and physicochemical characterization, statistical modelling, ML prediction, and SHAP-based interpretability. Each method is selected to provide complementary insights ranging from statistical significance and robustness to nonlinear prediction and interpretability rather than redundant analysis. Specifically, the full-factorial design ensured complete experimental coverage, ANOVA and RSM provided statistical and regression-based interpretation, Taguchi SNRA enabled robustness-oriented trend analysis, while ML and SHAP captured nonlinear prediction behavior and model interpretability. Together, this framework addresses the limitations identified in Table 1, delivering an interpretable, generalizable, and optimization-capable methodology for manufacturing high-performance PLA–MWCNT composites using FFF.
Materials and methods
Materials
Details of PLA matrix and MWCNT reinforcement used for the preparation of PLA–MWCNT nanocomposite filament, including supplier information, key physical properties, and pre-processing treatments.
To improve dispersion within the PLA matrix and promote interfacial adhesion, the as-received MWCNTs were acid-functionalized using a 3:1 mixture of H2SO4 and HNO3 under ultrasonic agitation for 2 h, followed by repeated washing with deionized water until neutral pH and subsequent vacuum drying at 80°C. This treatment promotes the formation of surface oxygen-containing groups, improving wettability and compatibility with the polar PLA matrix.
To prepare the PLA–MWCNT nanocomposite, the functionalized MWCNTs were incorporated at a fixed loading (10 wt% in this study) into the PLA matrix. Both PLA pellets and MWCNTs were dried at 80°C for 12 h under vacuum immediately prior to compounding to ensure minimal moisture content. Melt mixing was carried out in a single-screw extruder (L/D = 40, screw diameter = 20 mm) operating with a temperature profile of 170–190°C and a screw speed of 60 rpm, as schematically illustrated in Figure 2. The extruded composite filament was produced with a nominal diameter of 1.75 ± 0.05 mm and air-cooled under controlled conditions to maintain dimensional stability. To enhance dispersion uniformity and reduce residual voids, the filament was pelletized and re-extruded once more under identical processing conditions. To further evaluate the morphological characteristics and dispersion behaviour of MWCNTs within the PLA matrix after melt compounding and re-extrusion, SEM analysis was performed on the fabricated PLA–MWCNT composite filament. Prior to imaging, the samples were sputter-coated with a thin conductive gold layer to minimize surface charging during electron-beam exposure. The SEM micrographs were acquired at different magnifications to qualitatively investigate nanotube distribution, localized agglomeration, matrix–reinforcement interaction, and surface morphology of the composite filament. Schematic of the PLA-MWCNT nanocomposite preparation process via melt mixing, filament extrusion, cooling, and winding of filament.
The lower-magnification SEM micrograph (Figure 3(a)) revealed relatively uniform distribution of MWCNT reinforcement throughout the PLA matrix without evidence of severe large-scale agglomeration. The observed morphology indicates that the melt-mixing and re-extrusion process enabled acceptable dispersion of MWCNTs within the polymer matrix. In addition, the composite surface exhibited comparatively homogeneous morphology with no major phase separation or discontinuous filler-rich domains. SEM micrographs of the fabricated PLA–MWCNT composite filament (a). Lower magnification (1000x), and (b). Higher Magnification (2500x).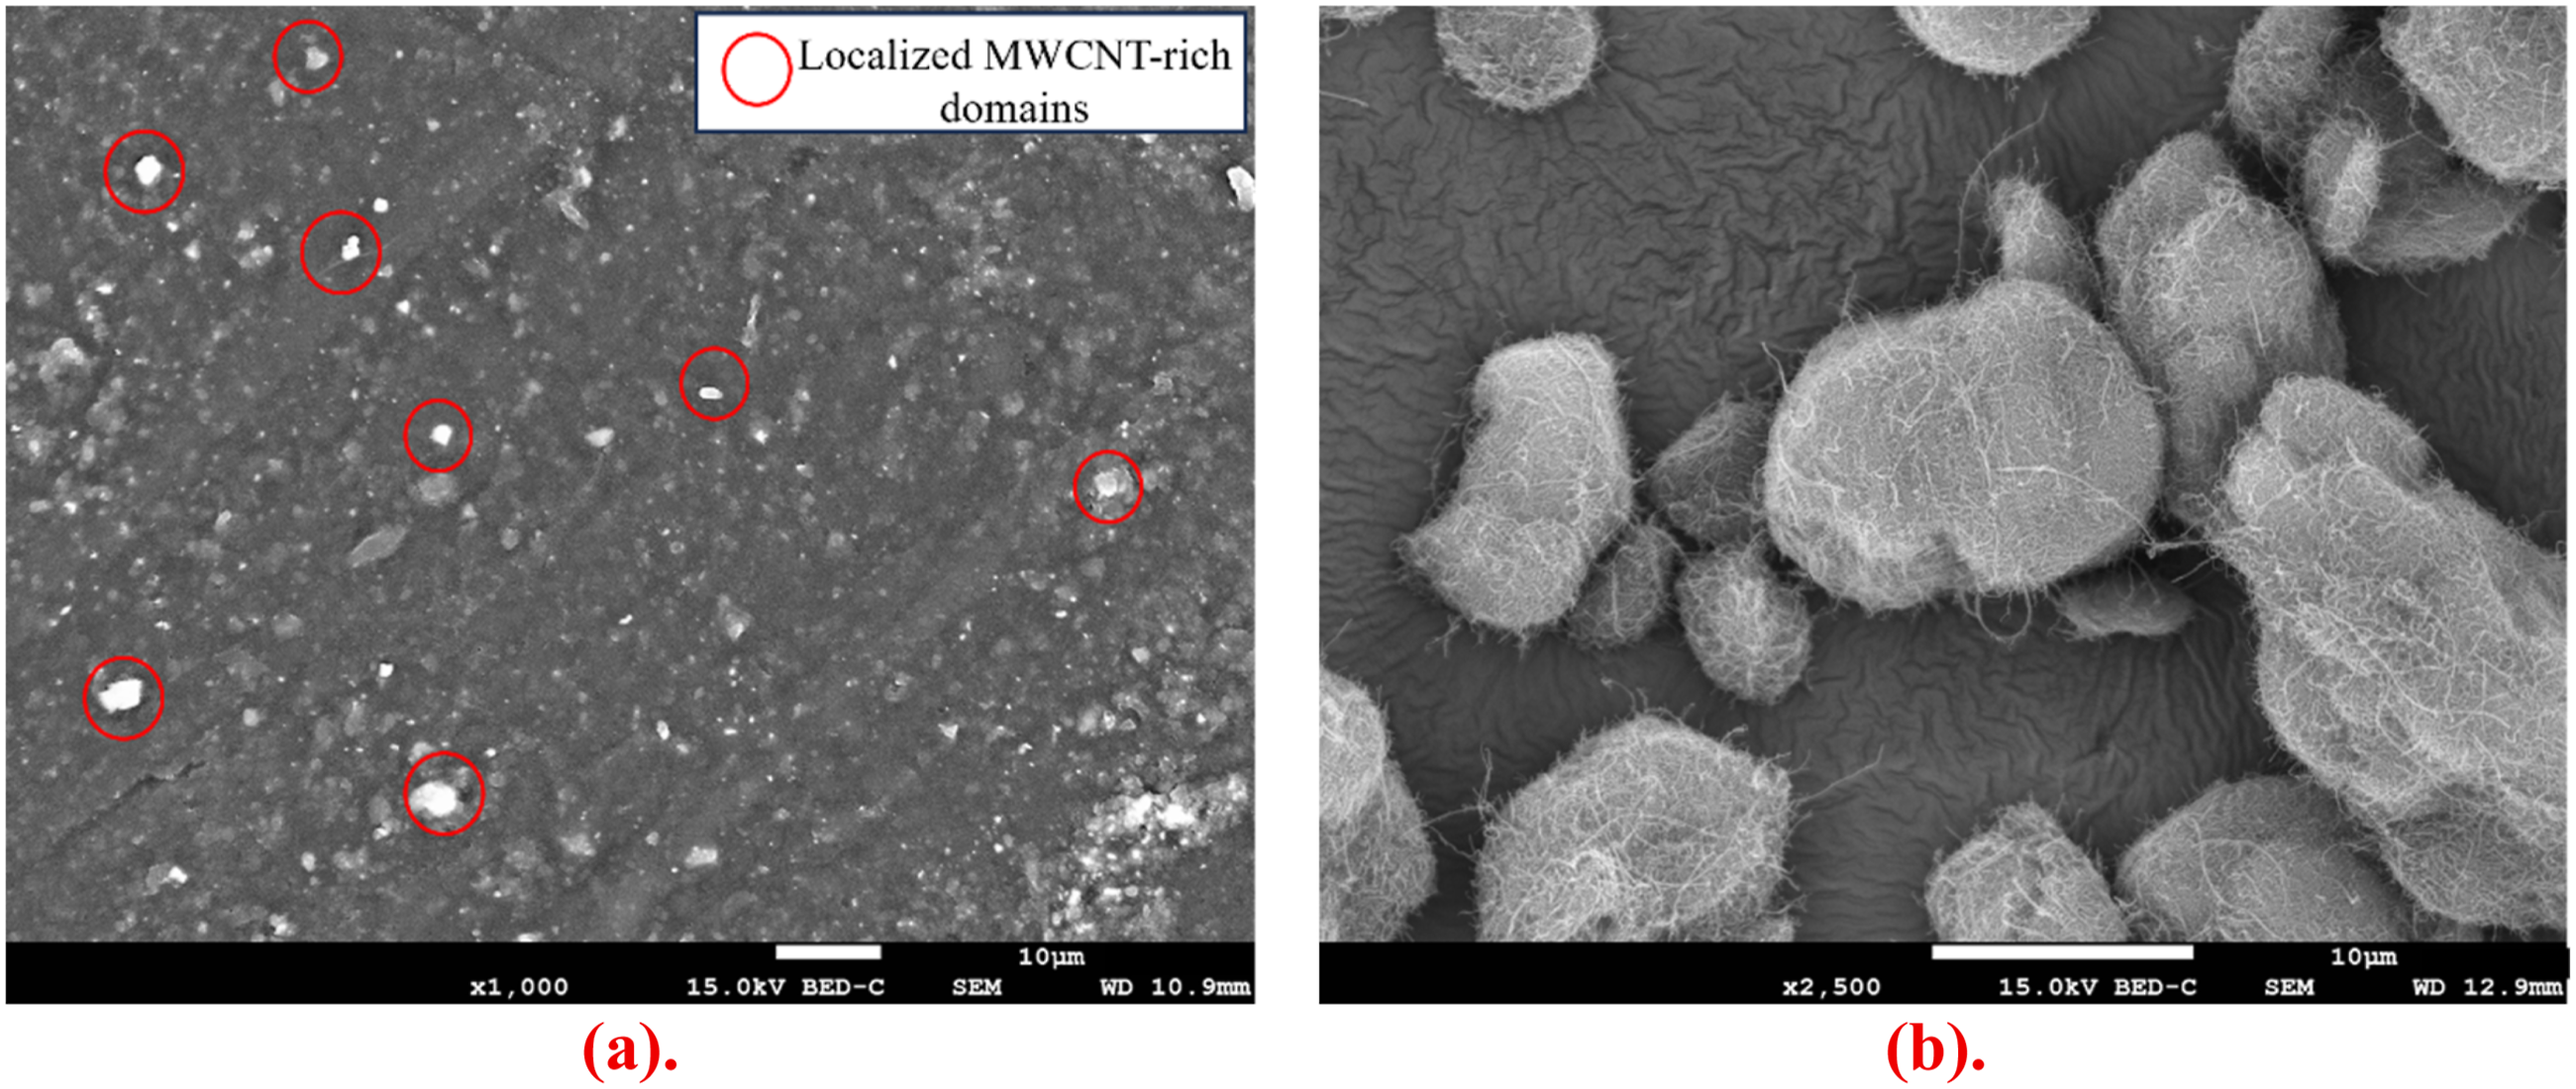
The higher-magnification SEM image (Figure 3(b)) showed localized interconnected nanotube-network regions embedded within the PLA matrix along with some clustered MWCNT structures. Such interconnected morphology may facilitate improved stress-transfer behaviour and enhanced thermal stability due to the formation of localized reinforcement pathways within the composite system. The observed microstructural features also suggest effective physical interaction between the PLA matrix and the incorporated MWCNTs.
The resulting PLA–MWCNT filament was visually and dimensionally inspected for surface smoothness, absence of agglomerates, and diameter consistency along its length. Only spools exhibiting uniform filament quality were retained for subsequent FFF printing. All filaments were stored in vacuum-sealed containers with desiccant until use to prevent moisture uptake between compounding and printing.
Methods
Thermal and physicochemical characterization
DSC was employed to evaluate the thermal transitions and crystallization behaviour of neat PLA and PLA–MWCNT composites. The DSC measurements were performed using a DSC 8000 (PerkinElmer Inc., USA) under a nitrogen atmosphere with a purging gas flow rate of 20 mL/min. Approximately 5–10 mg of each sample was sealed in aluminium pans and heated from 25°C to 250°C at a constant heating rate of 10°C/min. The Tg, Tcc, Tm, and associated thermal transitions were analysed to investigate the influence of MWCNT incorporation on the thermal behaviour and crystallization characteristics of the PLA matrix.
TGA was performed to evaluate the thermal degradation behaviour and thermal stability of neat PLA and PLA–MWCNT composites using a STA 2500 Regulus simultaneous thermal analyzer (NETZSCH, Germany). Approximately 8–10 mg of each sample was heated from 25°C to 600°C at a constant heating rate of 10°C/min under a nitrogen atmosphere with gas flow rates of 20 mL/min (purging) and 50 mL/min (protective). The onset Td, maximum degradation temperature, and residual mass fraction were analysed to determine the effect of MWCNT reinforcement on the thermal stability of the composite system. The thermal degradation curves were processed and analysed using OriginPro 2021 software.
FTIR spectroscopy was employed to analyse the characteristic functional groups and physicochemical interactions in neat PLA and PLA–MWCNT composites. All measurements were performed at room temperature (25°C) using an FTIR spectrometer (Spectrum Two, UATR Two, PerkinElmer, USA) operating in ATR mode over the spectral range of 4000–500 cm−1 with a scan count of 10. The spectra were comparatively analysed to identify changes in peak intensity and band position associated with MWCNT incorporation and possible interfacial interactions within the PLA matrix. The FTIR spectra were processed using OriginPro 2021 software. FTIR characterization was carried out using an FTIR spectrometer in the wavelength range of 4000–500 cm−1 to identify the characteristic functional groups and possible physicochemical interactions between PLA and MWCNTs. The spectra of neat PLA and PLA–MWCNT composites were comparatively analysed to evaluate changes in peak intensity and band position associated with MWCNT incorporation and interfacial interaction within the composite system.
Fabrication of compression test specimens
Fabrication of the PLA–MWCNT compression specimens was carried out using FFF under a controlled experimental design that systematically varied the most influential PPPs. In this study, four primary PPPs were selected based on their established impact on mechanical anisotropy, interlayer bonding, and internal stress distribution: • • • •
Fixed and variable PPPs used for the fabrication of PLA–MWCNT compression test specimens.
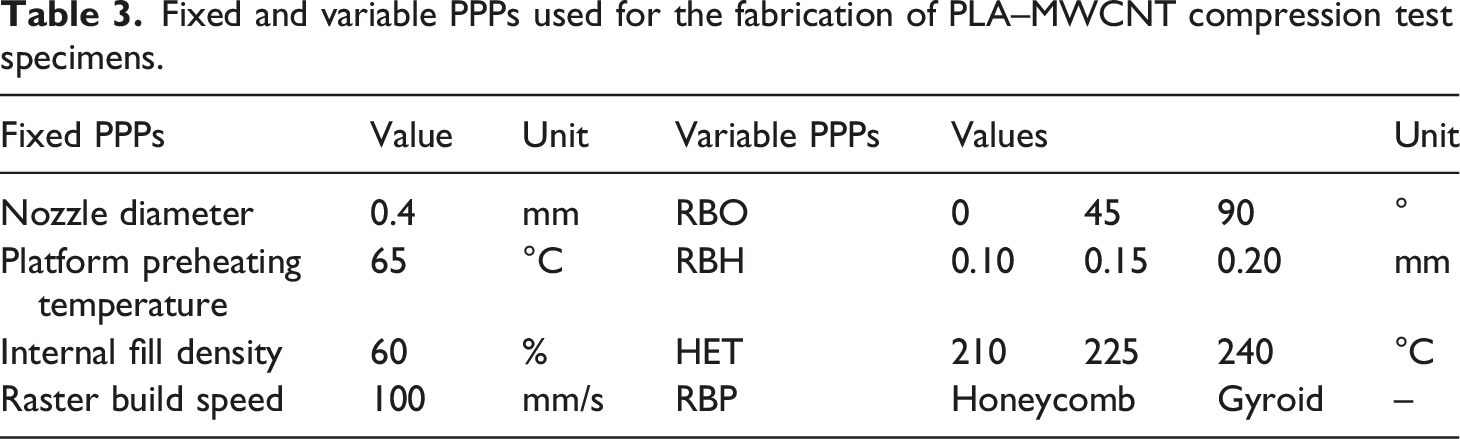
Printing was performed using a commercial FFF printer (Anycubic i3 Mega) equipped with a 0.4 mm brass nozzle. The platform preheating temperature was maintained at 65°C to promote adhesion of the first layer without inducing warping. Slicing of the CAD models was carried out using Anycubic Slicer Next, which generated the tool paths and G-code corresponding to the specified PPPs. Compression specimens were designed in Autodesk Fusion 360 following the geometry prescribed by ASTM D695 for compressive testing of rigid plastics. The models were exported in STL format and imported into the slicing software for toolpath generation. Representative CAD geometries of the compression specimens and their printed counterparts are shown in Figure 4. (a). CAD, and (b). FFF fabricated testing specimen of ASTM-D695 standard.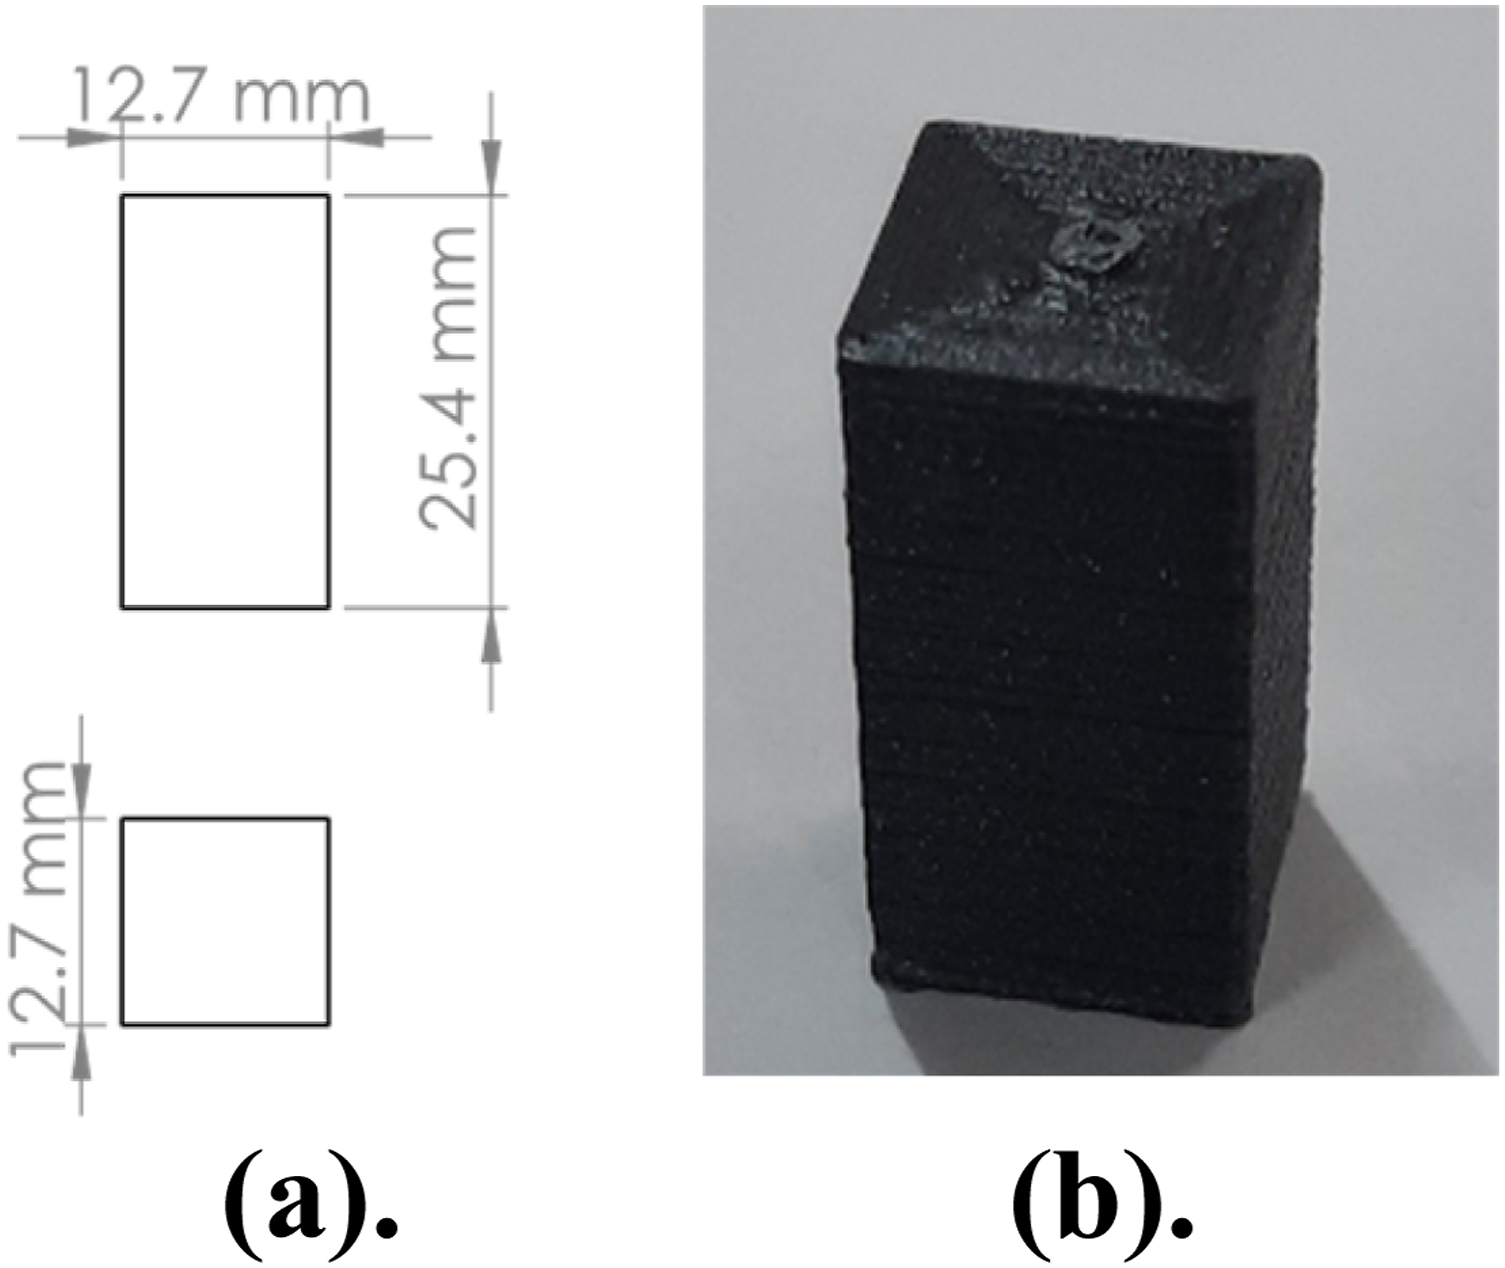
All printed specimens were conditioned at ambient laboratory conditions for at least 24 h prior to mechanical testing to minimize thermal residual effects. Subsequent sections detail the compression testing protocol, data acquisition, and the development of ML and RSM for prediction and analysis of compressive performance.
Mechanical testing procedures
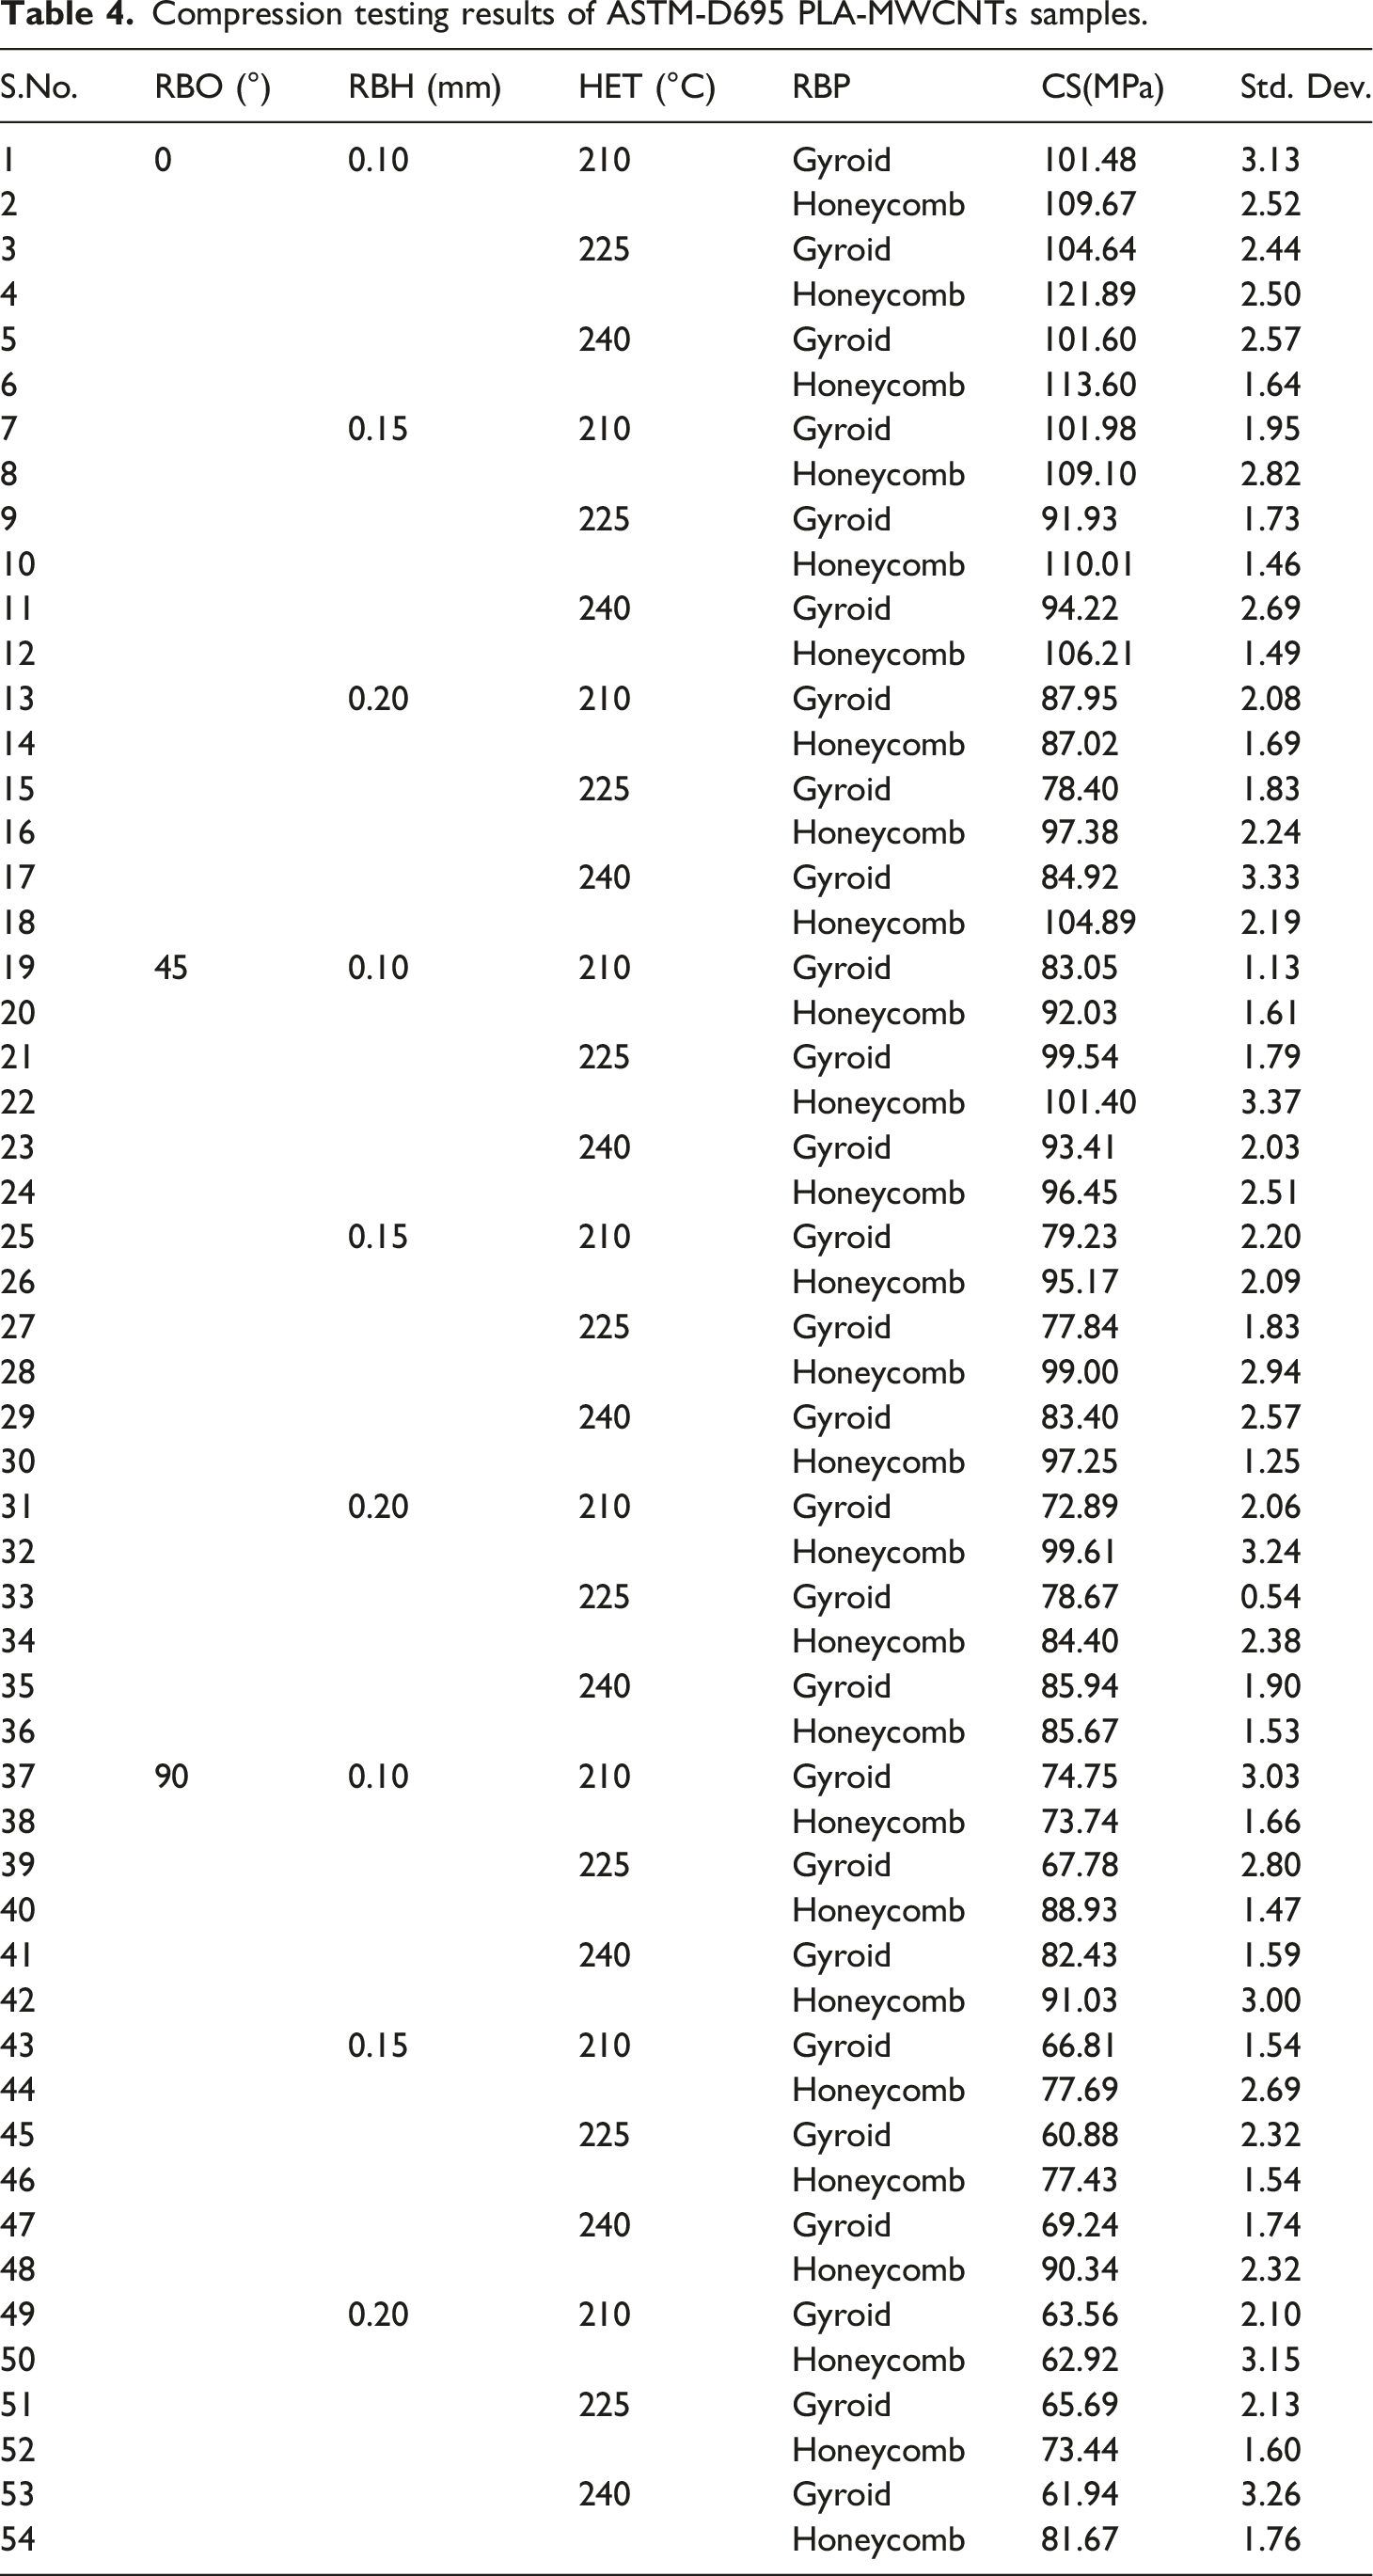
Compression testing results of ASTM-D695 PLA-MWCNTs samples.
Statistical analysis
The experimental compression dataset was analysed using statistical tools to quantify the influence of the selected FFF PPPs—RBO, RBH, HET, and RBP—on the CS of PLA–MWCNT composites. ANOVA was performed to determine the significance and percentage contribution of each PPP as well as to identify any meaningful interaction effects. Since the objective was to maximize CS, the “larger-the-better” SNRA was applied to identify favourable parametric trends. To capture the parametric relationships in mathematical form, RSM was employed to develop second-order polynomial regression models. RBP, being a binary categorical parameter, was encoded numerically using 1 for gyroid and 2 for honeycomb during the RSM analyses. This encoding was used only for computational representation of the categorical infill structures. These models provided initial predictive insight and served as a benchmark against which the accuracy and nonlinearity-capturing capability of ML models were later compared. Contour plots and response surfaces were generated to visualize how variations in individual PPP influenced CS and to highlight regions of nonlinear behaviour that statistical models may not fully capture.
In the present study, the full-factorial design was employed for systematic experimental data generation across the complete parameter space. Taguchi analysis was not used as the primary design-of-experiments approach, but rather as a post-processing robustness-analysis tool based on SNRA. ANOVA quantified the statistical contribution of each process parameter, while RSM established regression-based parameter–response relationships. The Taguchi SNRA analysis was further used to evaluate robustness trends and consistency of parameter effects under process variability.
ML modelling and validation
A supervised ML framework was developed to model and predict the CS of PLA-MWCNT composites from the four selected FFF PPP. The dataset was divided into training (80%) and testing (20%) subsets to ensure unbiased performance evaluation. Four regression algorithms—DTR, CBR, and RFR, and RR—were implemented due to their ability to handle nonlinear and multi-dimensional relationships. Hyperparameters for each model were optimized using grid-search CV. Model performance was evaluated using the R2, RMSE, and MAE. The model demonstrating the highest accuracy and lowest prediction error was selected as the primary prediction engine. The ML framework enabled the identification of nonlinear patterns associated with interlayer bonding, RBP, thermal behaviour, and anisotropy—patterns that conventional statistical models cannot adequately represent.
Model interpretability using SHAP analysis
To ensure transparency and scientific interpretability of ML predictions, SHAP analysis was applied to the best-performing regression model. SHAP values quantify the individual contribution of each input PPP—RBO, RBH, HET, and RBP—to the predicted CS. This interpretability framework allowed for ranking feature importance, identifying dominant and secondary PPP, and understanding synergistic or antagonistic interactions across the design space. SHAP summary (beeswarm) plots provided global feature influence, while dependence and force plots revealed local parameter effects and prediction decomposition. SHAP analysis enabled direct validation of whether the model behaviour aligned with known process physics, such as improved bonding at higher temperatures or orientation-dependent anisotropic effects, thereby bridging experimental understanding and data-driven modelling.
Result and discussion
DSC analysis
The DSC thermograms of neat PLA and PLA–MWCNT composites are presented in Figure 5. Both materials exhibited the characteristic thermal-transition behaviour of PLA, including Tg, Tcc, and Tm. However, noticeable differences in the thermal-transition behaviour were observed after MWCNT incorporation, indicating the influence of nanotube reinforcement on the crystallization kinetics and thermal behaviour of the PLA matrix. DSC thermograms of neat PLA and PLA–MWCNT composites.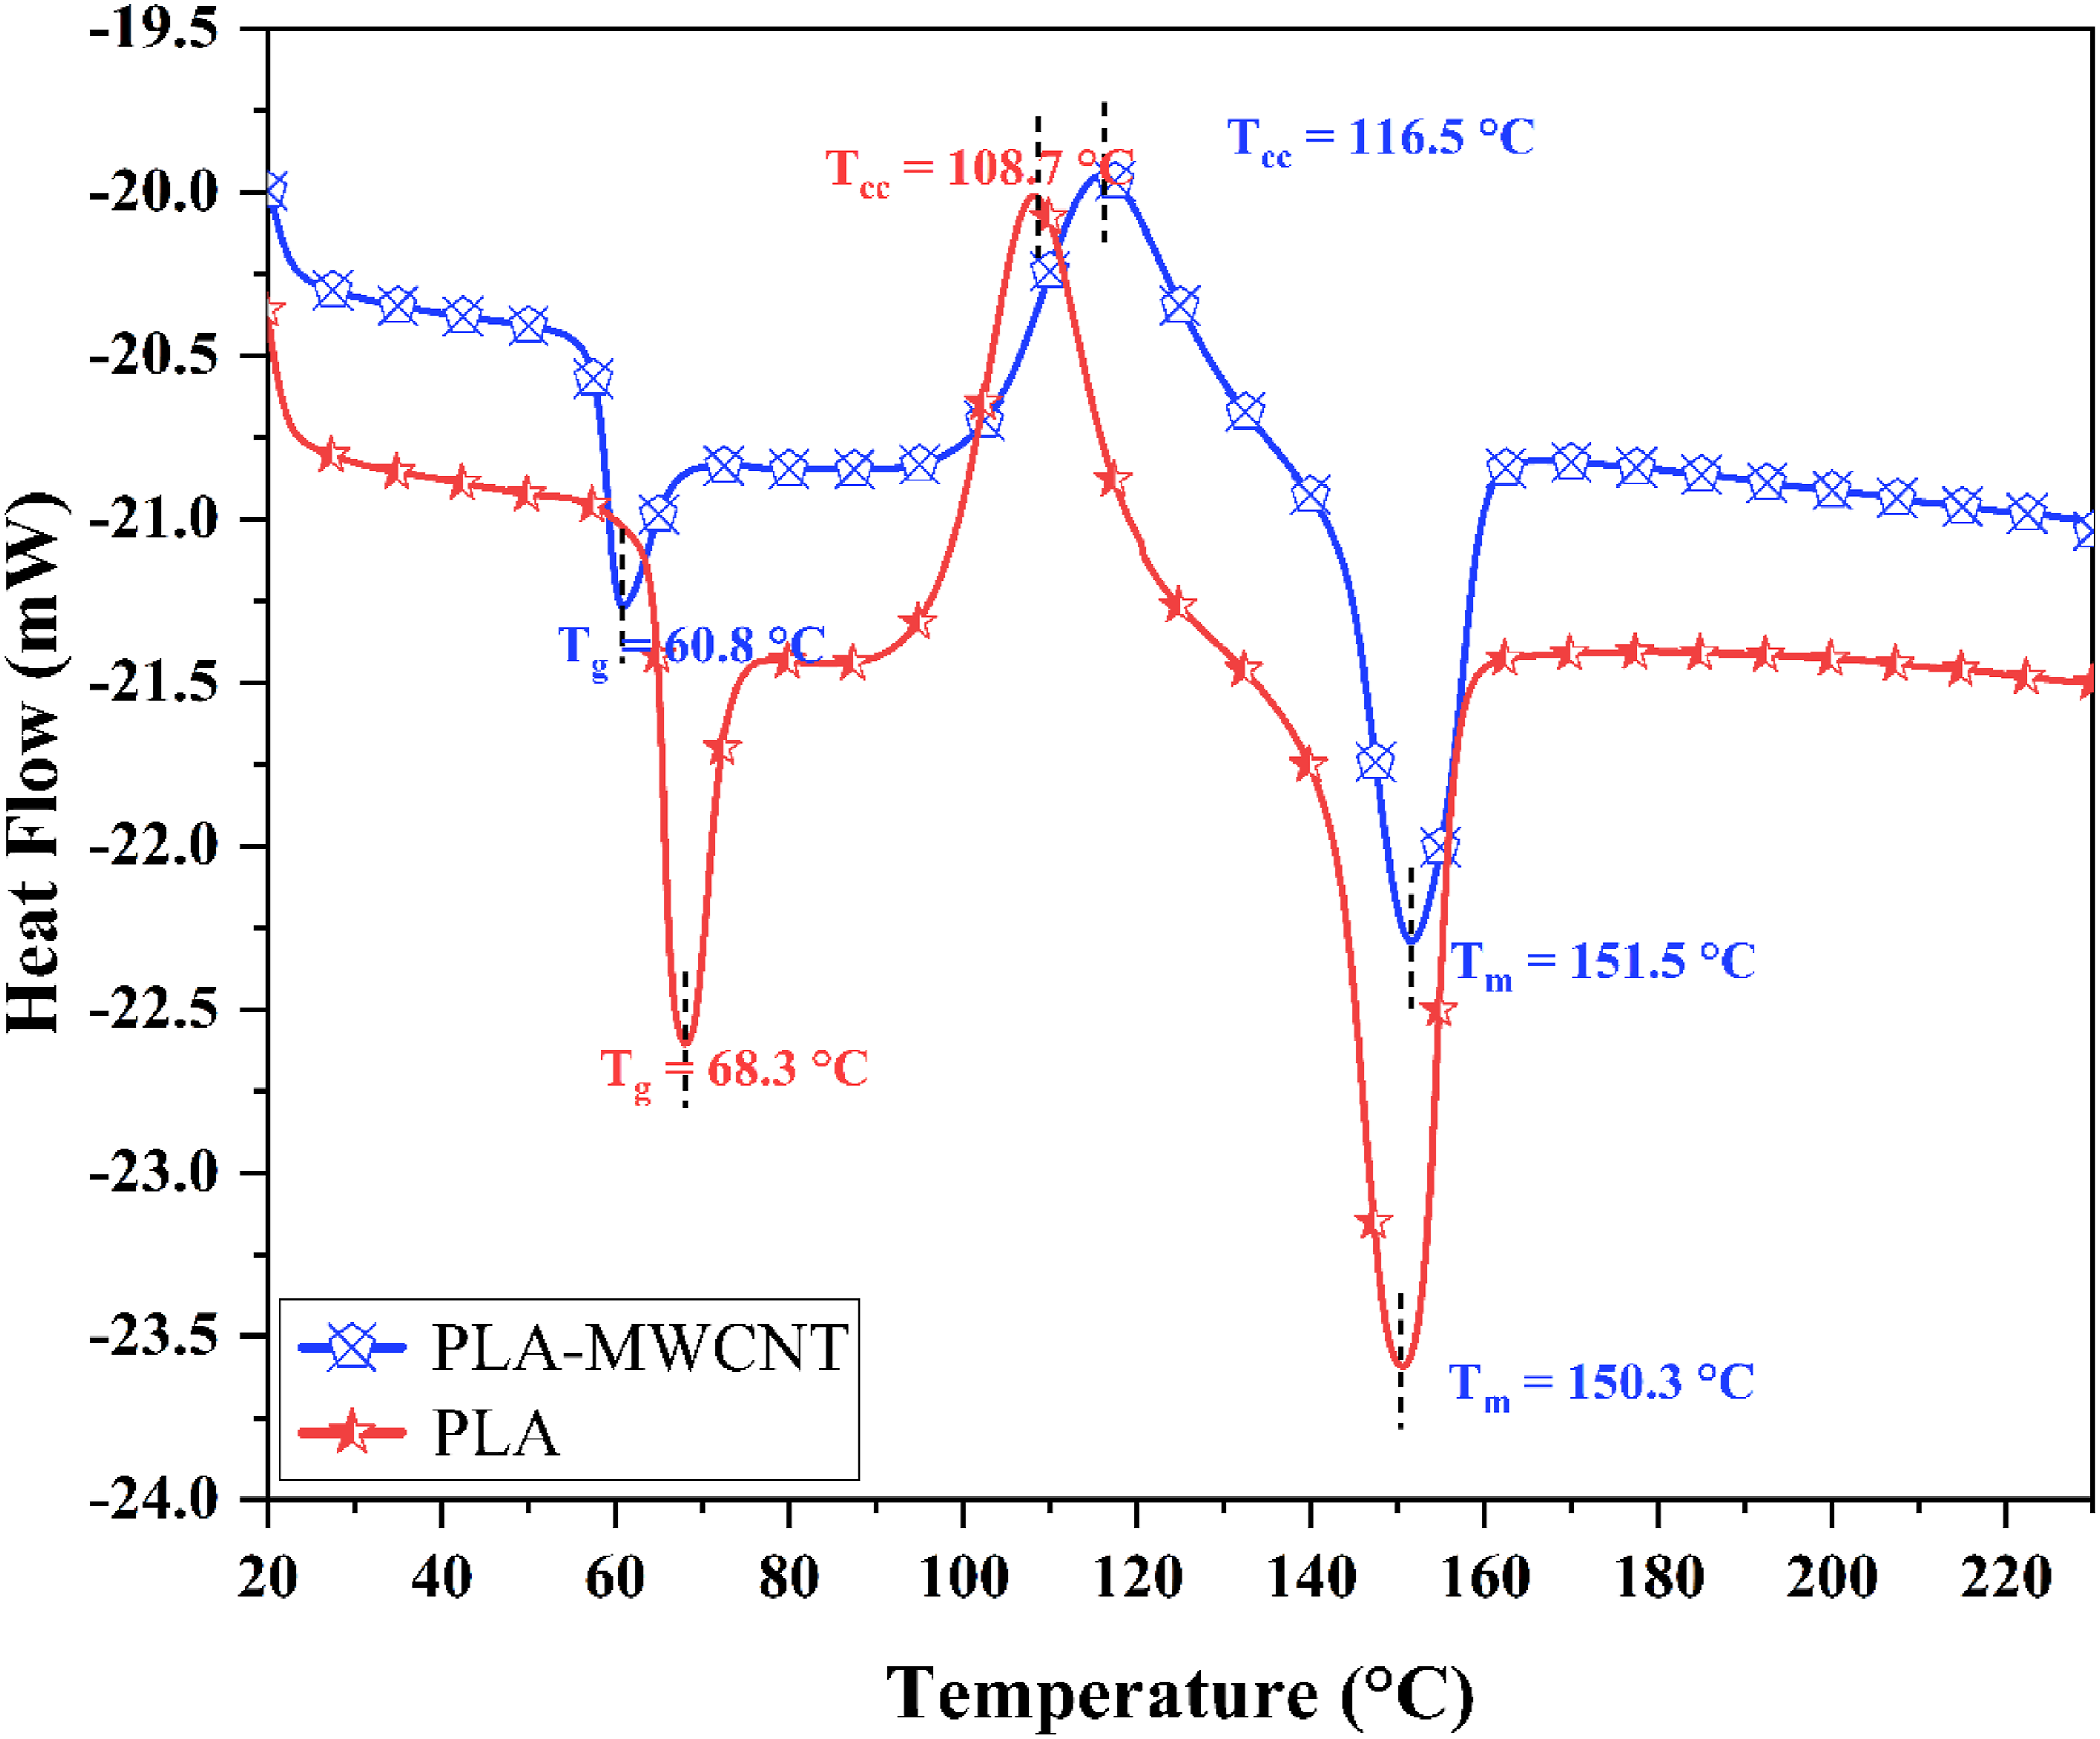
The neat PLA exhibited a Tg of 68.3°C, whereas the PLA–MWCNT composite showed a reduced Tg of 60.8°C. The reduction in Tg suggests that the incorporation of MWCNTs slightly modified the mobility of the amorphous polymer chains, possibly due to localized changes in chain packing and interfacial interaction within the composite system.
A significant variation was observed in the cold crystallization behaviour. The Tcc shifted from 108.7°C for neat PLA to 116.5°C for the PLA–MWCNT composite, corresponding to an increase of approximately 7.8°C. This shift indicates that MWCNT incorporation altered the crystallization kinetics of the PLA matrix. The delayed crystallization behaviour may be associated with restricted polymer-chain rearrangement caused by the presence of the nanotube reinforcement network, which hinders molecular diffusion during crystallization.
The melting behaviour also exhibited slight modification after MWCNT incorporation. The neat PLA showed a Tm of 150.3°C, while the PLA–MWCNT composite exhibited a slightly higher Tm of 151.5°C. The marginal increase in melting temperature suggests improved thermal stability and modified crystal formation behaviour within the composite structure. In addition, the comparatively broader melting profile observed for the PLA–MWCNT composite indicates the presence of heterogeneous crystal morphology and variation in crystal perfection induced by nanotube incorporation.
TGA analysis
The thermal degradation behaviour and thermal stability of neat PLA and PLA–MWCNT composites were evaluated using TGA and DTG analysis, as shown in Figure 6. Both materials exhibited a single-stage dominant thermal degradation behaviour, corresponding to the decomposition of the PLA polymer backbone. However, noticeable differences in degradation onset temperature, degradation profile, and residual mass fraction were observed after MWCNT incorporation. TGA and derivative thermogravimetric (DTG) curves of neat PLA and PLA–MWCNT composites.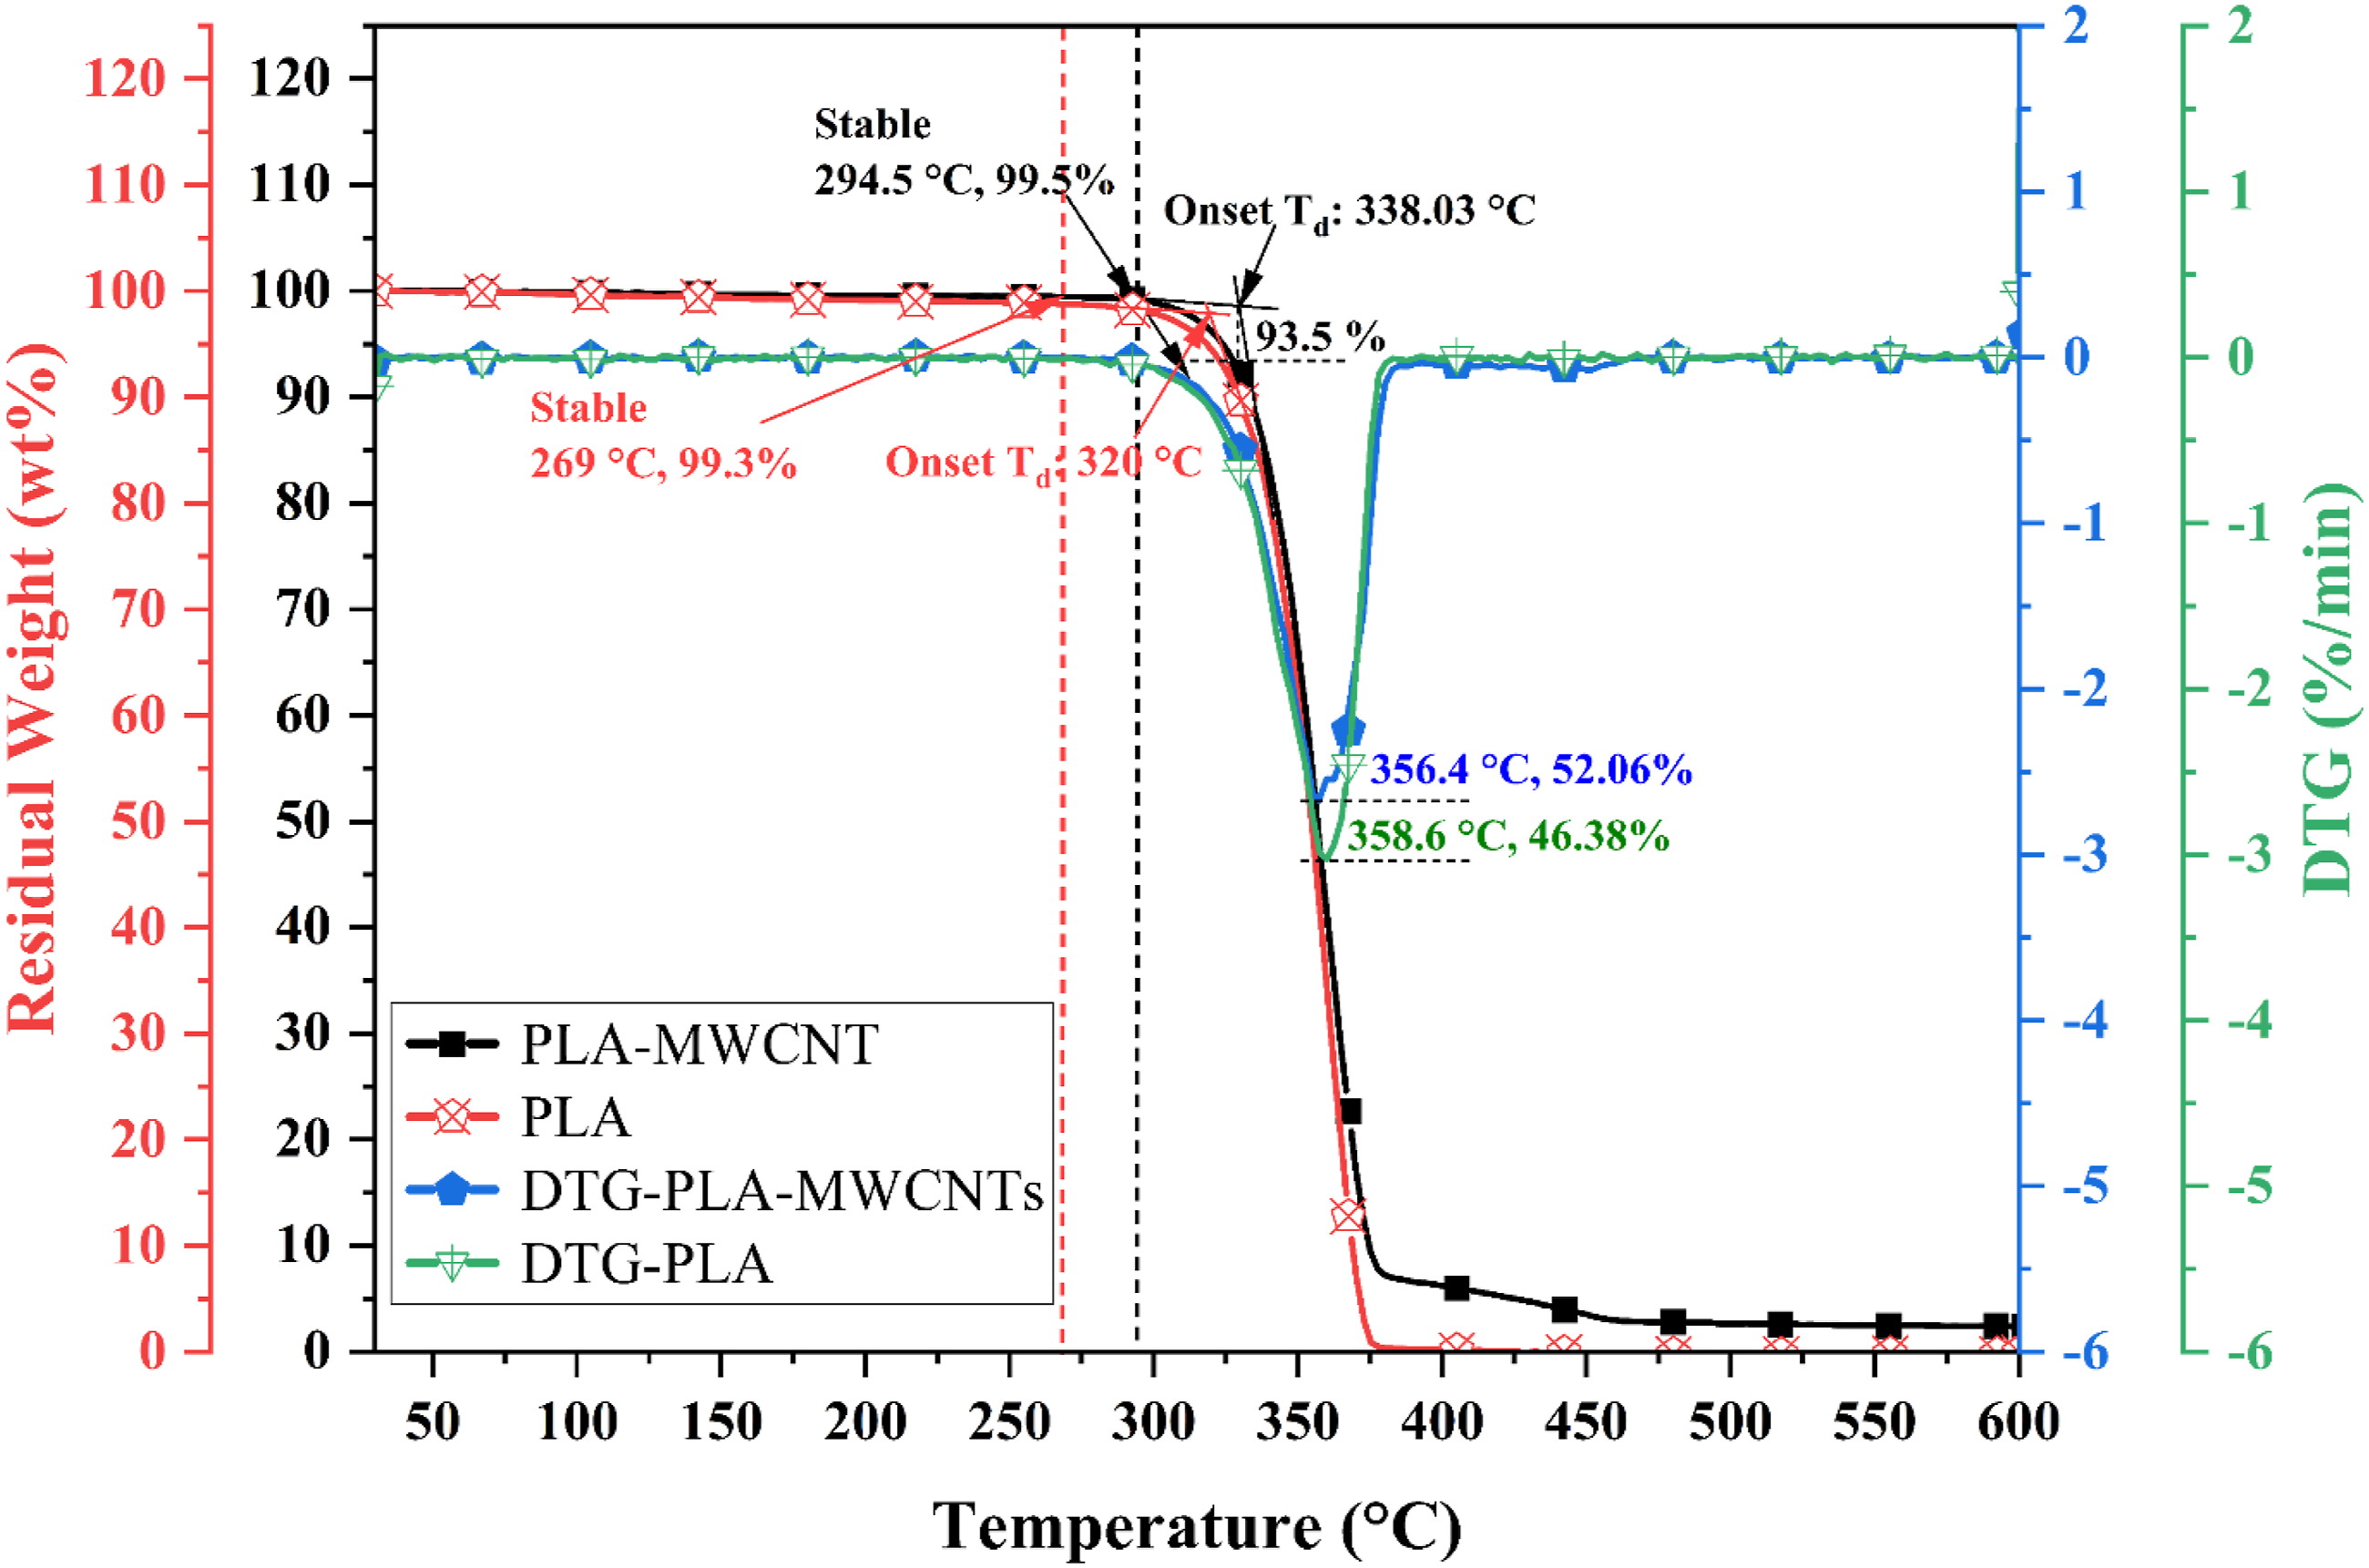
Neat PLA remained thermally stable up to approximately 269°C with a residual weight retention of 99.3%, whereas the PLA–MWCNT composite exhibited improved thermal stability up to 294.5°C with 99.5% residual weight retention. The onset degradation temperature (onset Td) increased significantly from 320°C for neat PLA to 338.03°C for the PLA-MWCNT composite, corresponding to an improvement of approximately 18°C. This enhancement indicates that MWCNT incorporation delayed the thermal decomposition process of the PLA matrix.
The improved thermal stability of the PLA–MWCNT composite can be attributed to the barrier effect and thermal shielding behaviour of the incorporated MWCNTs. The nanotube network restricts polymer-chain mobility and reduces heat-transfer-induced chain scission during thermal exposure. In addition, the presence of MWCNTs may hinder the diffusion of volatile degradation products generated during decomposition, thereby delaying thermal degradation kinetics.
The DTG curves further confirmed the modified degradation behaviour after MWCNT incorporation. The maximum degradation peak of neat PLA occurred at approximately 358.6°C, whereas the PLA–MWCNT composite showed a slightly shifted degradation peak at 356.4°C with comparatively broader degradation behaviour. The broader degradation profile of the composite indicates altered thermal decomposition kinetics associated with the presence of the nanotube reinforcement network within the PLA matrix.
Another significant observation was the residual char formation at elevated temperature. Neat PLA showed almost complete thermal decomposition with negligible residual mass beyond 400°C, whereas the PLA–MWCNT composite retained measurable residual mass up to 600°C. This residual char behaviour is associated with the thermally stable carbonaceous structure of MWCNTs, which remains stable even after degradation of the PLA matrix.
FTIR analysis
The FTIR spectra of neat PLA and PLA–MWCNT composites are presented in Figure 7. Both materials exhibited the characteristic absorption bands of PLA, including O–H stretching vibration near 3654 cm−1, C–H stretching vibration around 2980 cm−1, ester carbonyl (C = O) stretching near 1750 cm−1, C–O–C stretching vibration around 1190 cm−1, and C–O stretching vibration near 1079 cm−1.
77
FTIR spectra of neat PLA and PLA–MWCNT composites.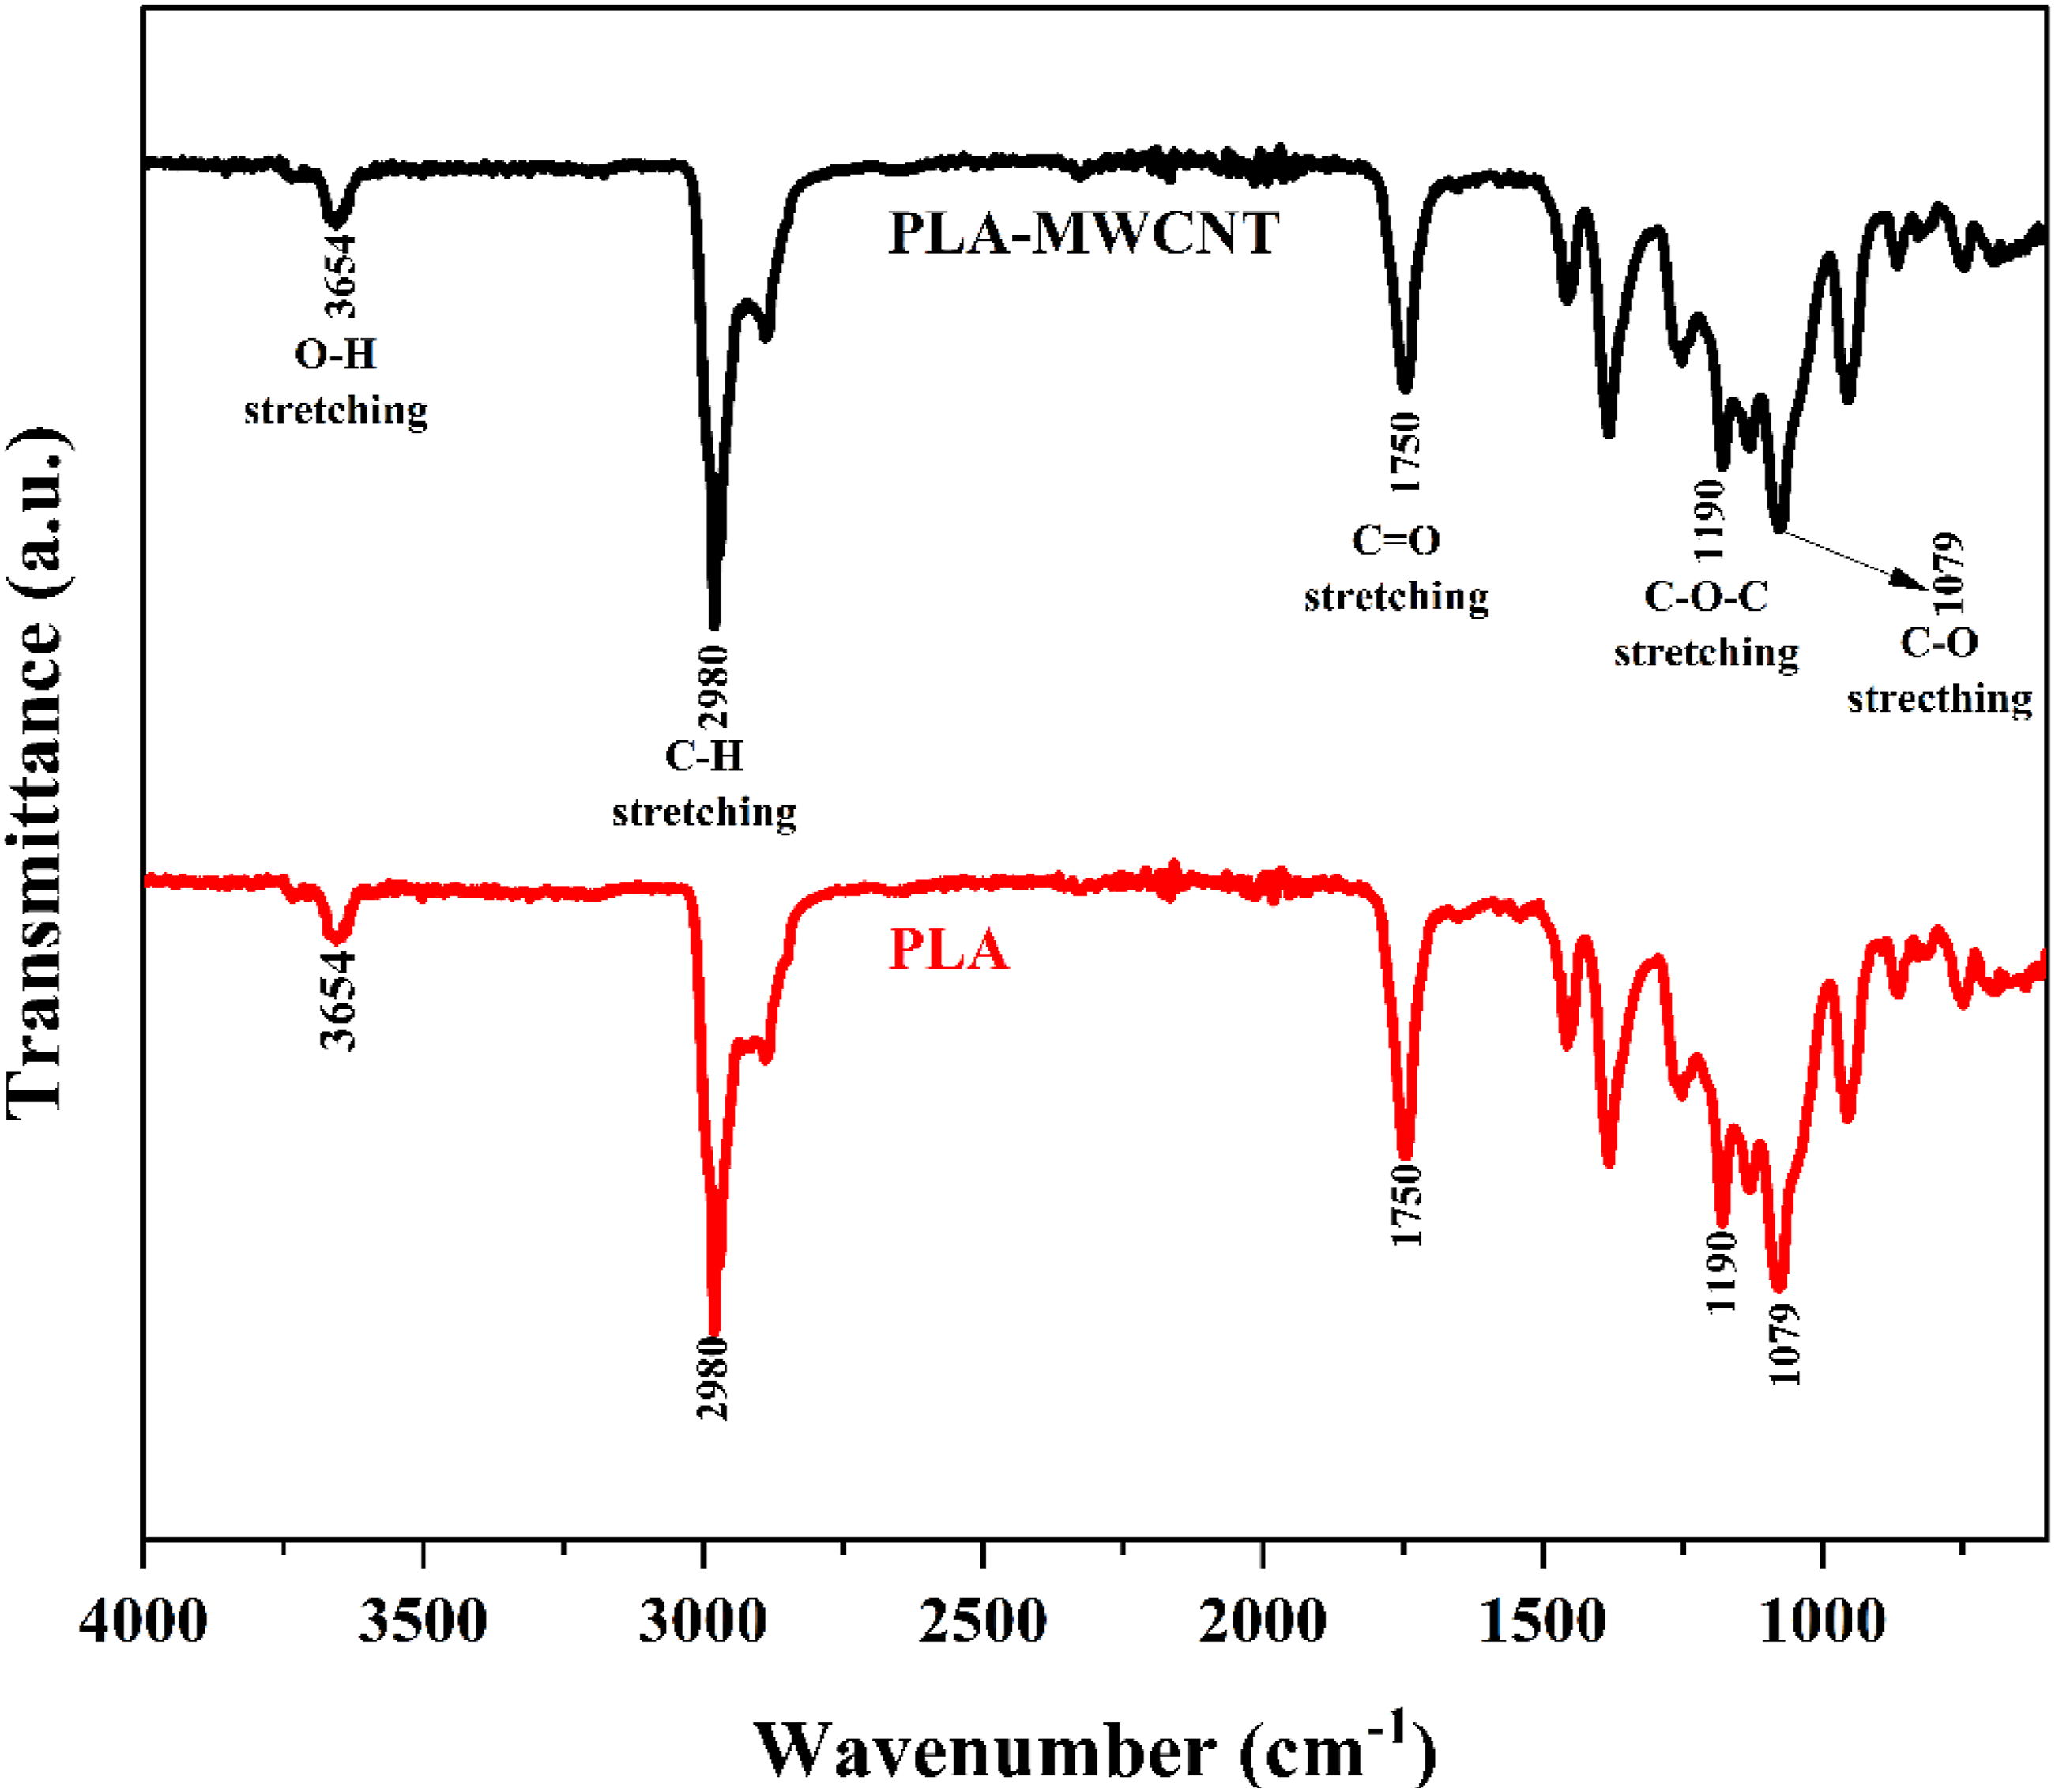
No significant peak shift or new absorption band formation was observed after MWCNT incorporation, indicating that the primary chemical structure of PLA remained largely unchanged during composite fabrication. However, slight variations in peak intensity were observed in the PLA–MWCNT composite, which may be associated with physical interaction and distribution of MWCNTs within the PLA matrix.
Experimental analysis
Effect of RBH
The variation in RBH exhibited a consistent and quantifiable influence on the CS of PLA–MWCNT specimens across all combinations of RBO, HET, and RBP as shown in Figure 8. Effect of RBH on the CS of PLA-MWCNTs specimens at varying HET, RBO, and RBP.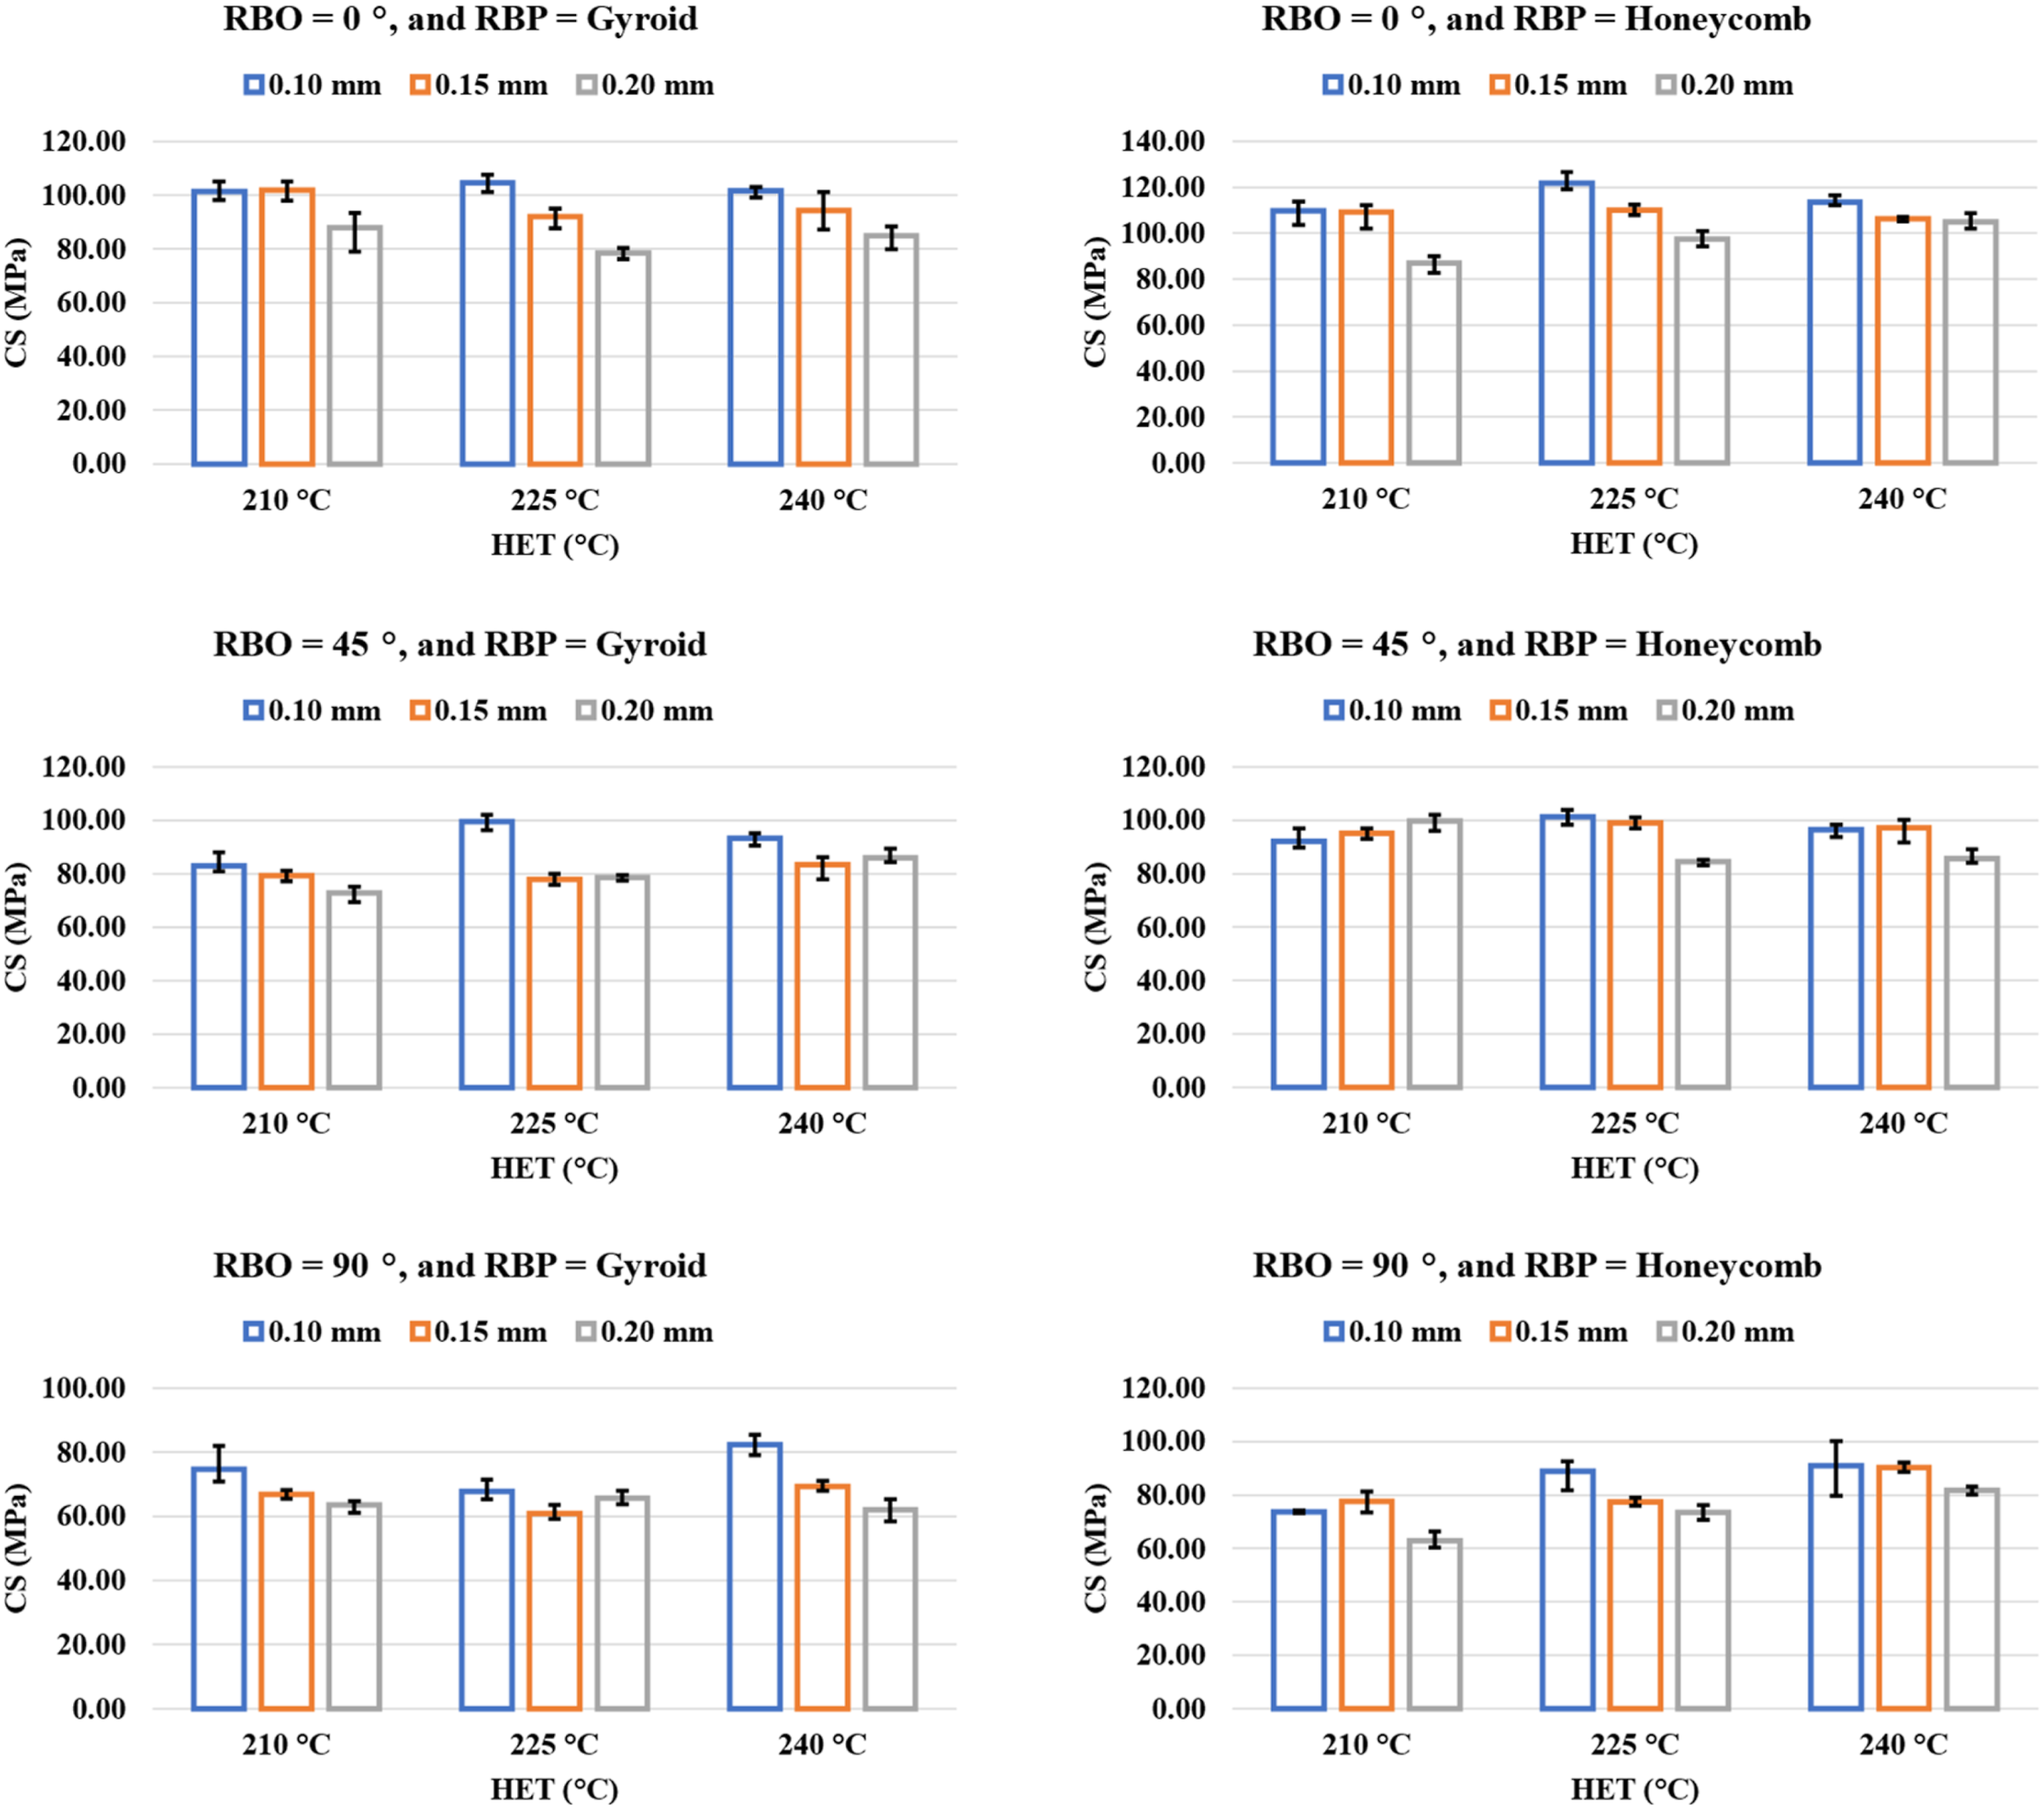
For samples printed at 0° RBO, the reduction in CS with increasing RBH was substantial; for instance, at 210°C with a gyroid RBP, increasing the RBH from 0.10 to 0.20 mm decreased the CS from 101.48 to 87.95 MPa, corresponding to a 13.34% reduction, while the honeycomb RBP showed an even sharper decline of 20.69% under the same conditions. Similar behaviour was observed at elevated temperatures, where the gyroid specimens at 225°C experienced a 25.06% decrease (104.64 to 78.40 MPa) and honeycomb specimens showed a 20.09% reduction when RBH increased from 0.10 to 0.20 mm. This trend persisted at 240°C, where gyroid and honeycomb RBP exhibited 16.39% and 7.67% reductions, respectively. At 45° RBO, the detrimental effect of larger RBH remained evident; gyroid specimens at 210°C dropped from 83.05 to 72.89 MPa (12.23%), while honeycomb specimens at the same settings showed a 6.90% decrease. A similar decline was recorded at 225°C, where gyroid RBP exhibited a 21.26% reduction between 0.10 and 0.20 mm, and honeycomb RBP showed a 16.77% reduction. Even at 90° RBO—where the inherent anisotropy already lowers CS—the influence of larger RBH remained negative. At 210°C, gyroid samples dropped from 74.75 to 63.56 MPa (14.95%), while honeycomb samples decreased from 73.74 to 62.92 MPa (14.64%). Across all orientations and temperatures, the data consistently show that increasing RBH weakens compressive performance due to reduced interlayer contact area, increased bead height, and higher void content, all of which restrict effective stress transfer and promote premature failure under load. 78 Overall, RBH was identified as a universally detrimental parameter, with CS reductions ranging from 6.50% up to 25.06%, confirming that finer deposition layers promote stronger interlayer diffusion and enhanced load-bearing capacity in PLA–MWCNT FFF composites.
Effect of RBO
RBO exhibited one of the strongest and most consistent influences on the CS of the PLA–MWCNT specimens due to its direct role in defining the alignment of deposited layers relative to the applied load. Across all HET and RBH, 0° RBO produced the highest CS, followed by 45°, whereas 90° RBO yielded the weakest performance, clearly demonstrating the anisotropic nature of the FFF process as shown in Figure 9. For instance, at RBH = 0.10 mm and 210°C HET, the gyroid RBP showed a reduction from 101.48 MPa at 0° to 83.05 MPa at 45° (a 18.16% decrease) and further to 74.75 MPa at 90° (a 26.33% drop relative to 0°). The trend was even more pronounced for honeycomb RBP at the same settings, where strength fell from 109.67 MPa (0°) to 92.03 MPa (45°) (16.10% decrease) and finally to 73.74 MPa (90°) (32.79% decrease). A similar behaviour was observed at 225°C, where honeycomb specimens at RBH = 0.10 mm dropped from 121.89 MPa (0°) to 101.40 MPa (45°) (16.84% decrease) and then to 88.93 MPa (90°) (27.03% decrease). Even at 240°C, where thermal diffusion partially compensates for interlayer weaknesses, the anisotropic effect persisted, with honeycomb samples decreasing from 113.60 MPa (0°) to 96.45 MPa (45°) (15.06% decrease) and further to 91.03 MPa (90°) (19.85% decrease). This consistent reduction in strength with changing orientation is attributed to the orientation of deposited filaments: at 0°, the load is applied parallel to the filament roads, enabling axial stress transfer and minimal dependence on interlayer weld strength. Effect of RBO on the CS of PLA-MWCNTs specimens at varying HET, RBH, and RBP.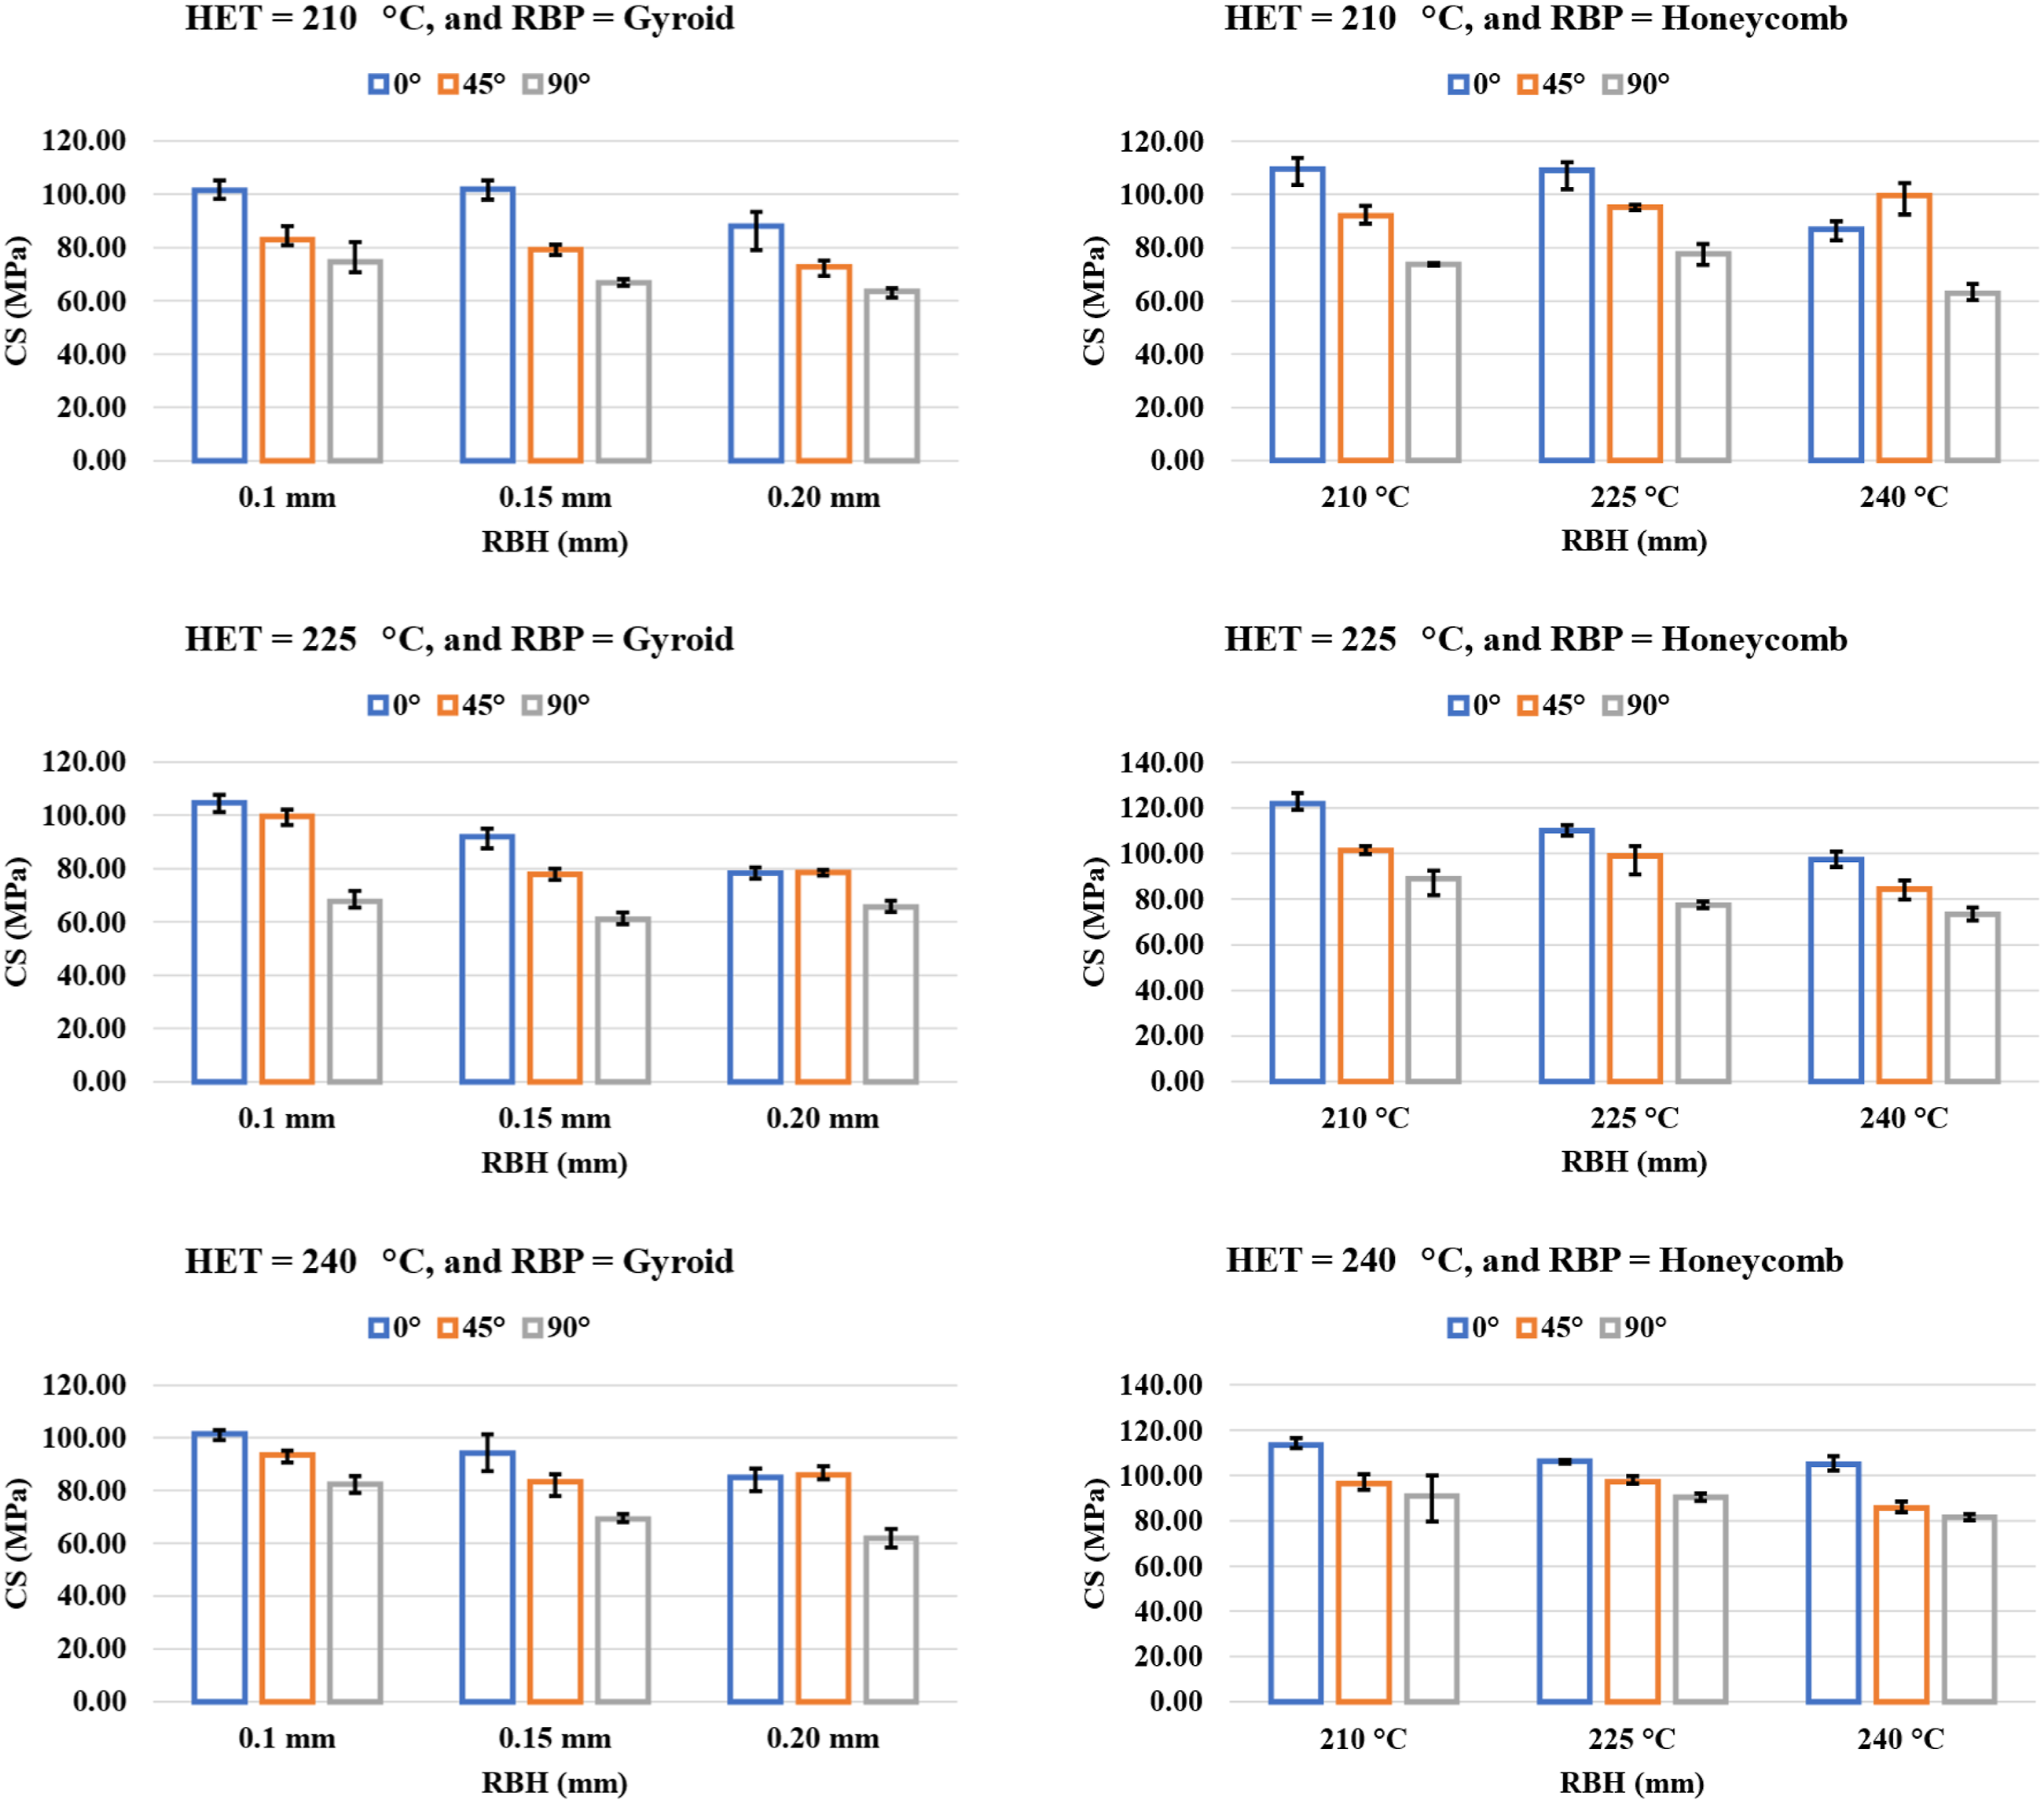
At 45°, the applied load is partially borne by interlayer bonds, resulting in mixed-mode loading and reduced structural stiffness. At 90°, the load is applied perpendicular to the layers, making compressive resistance entirely dependent on interlayer adhesion; thus, micro-voids, weak fusion, and layer–layer interfaces trigger premature buckling and delamination. Across the entire dataset, the CS reduction from 0° to 90° ranged from 19% to 33%, confirming that RBO is a dominant parameter controlling anisotropy and failure mechanisms in FFF-printed PLA–MWCNT composites
Effect of HET
HET exhibited a strong and systematic influence on the CS of PLA–MWCNT specimens as shown in Figure 10 due to its direct control over melt viscosity, polymer chain mobility, and interlayer diffusion. At 0° RBO, the highest CS were consistently obtained at 225°C, particularly for the honeycomb RBP where strength increased from 109.67 MPa at 210°C to 121.89 MPa at 225°C, representing an 11.13% enhancement, before slightly decreasing to 113.60 MPa at 240°C (a 6.79% drop relative to 225°C). A similar trend was observed for the gyroid RBP, though less pronounced; strength increased from 101.48 MPa (210°C) to 104.64 MPa (225°C) (3.11% improvement) and then decreased to 101.60 MPa (240°C) (2.91% reduction). At 0.15 mm RBH, the same behaviour persisted: honeycomb specimens increased from 109.10 to 110.01 MPa at 225°C (0.83% increase) and then slightly decreased to 106.21 MPa at 240°C (3.45% decrease). These results collectively indicate that 225°C represents an optimal processing window for orientation-aligned samples due to superior molecular diffusion and reduced interfacial porosity. Effect of HET on the CS of PLA-MWCNTs specimens at varying RBH, RBO, and RBP.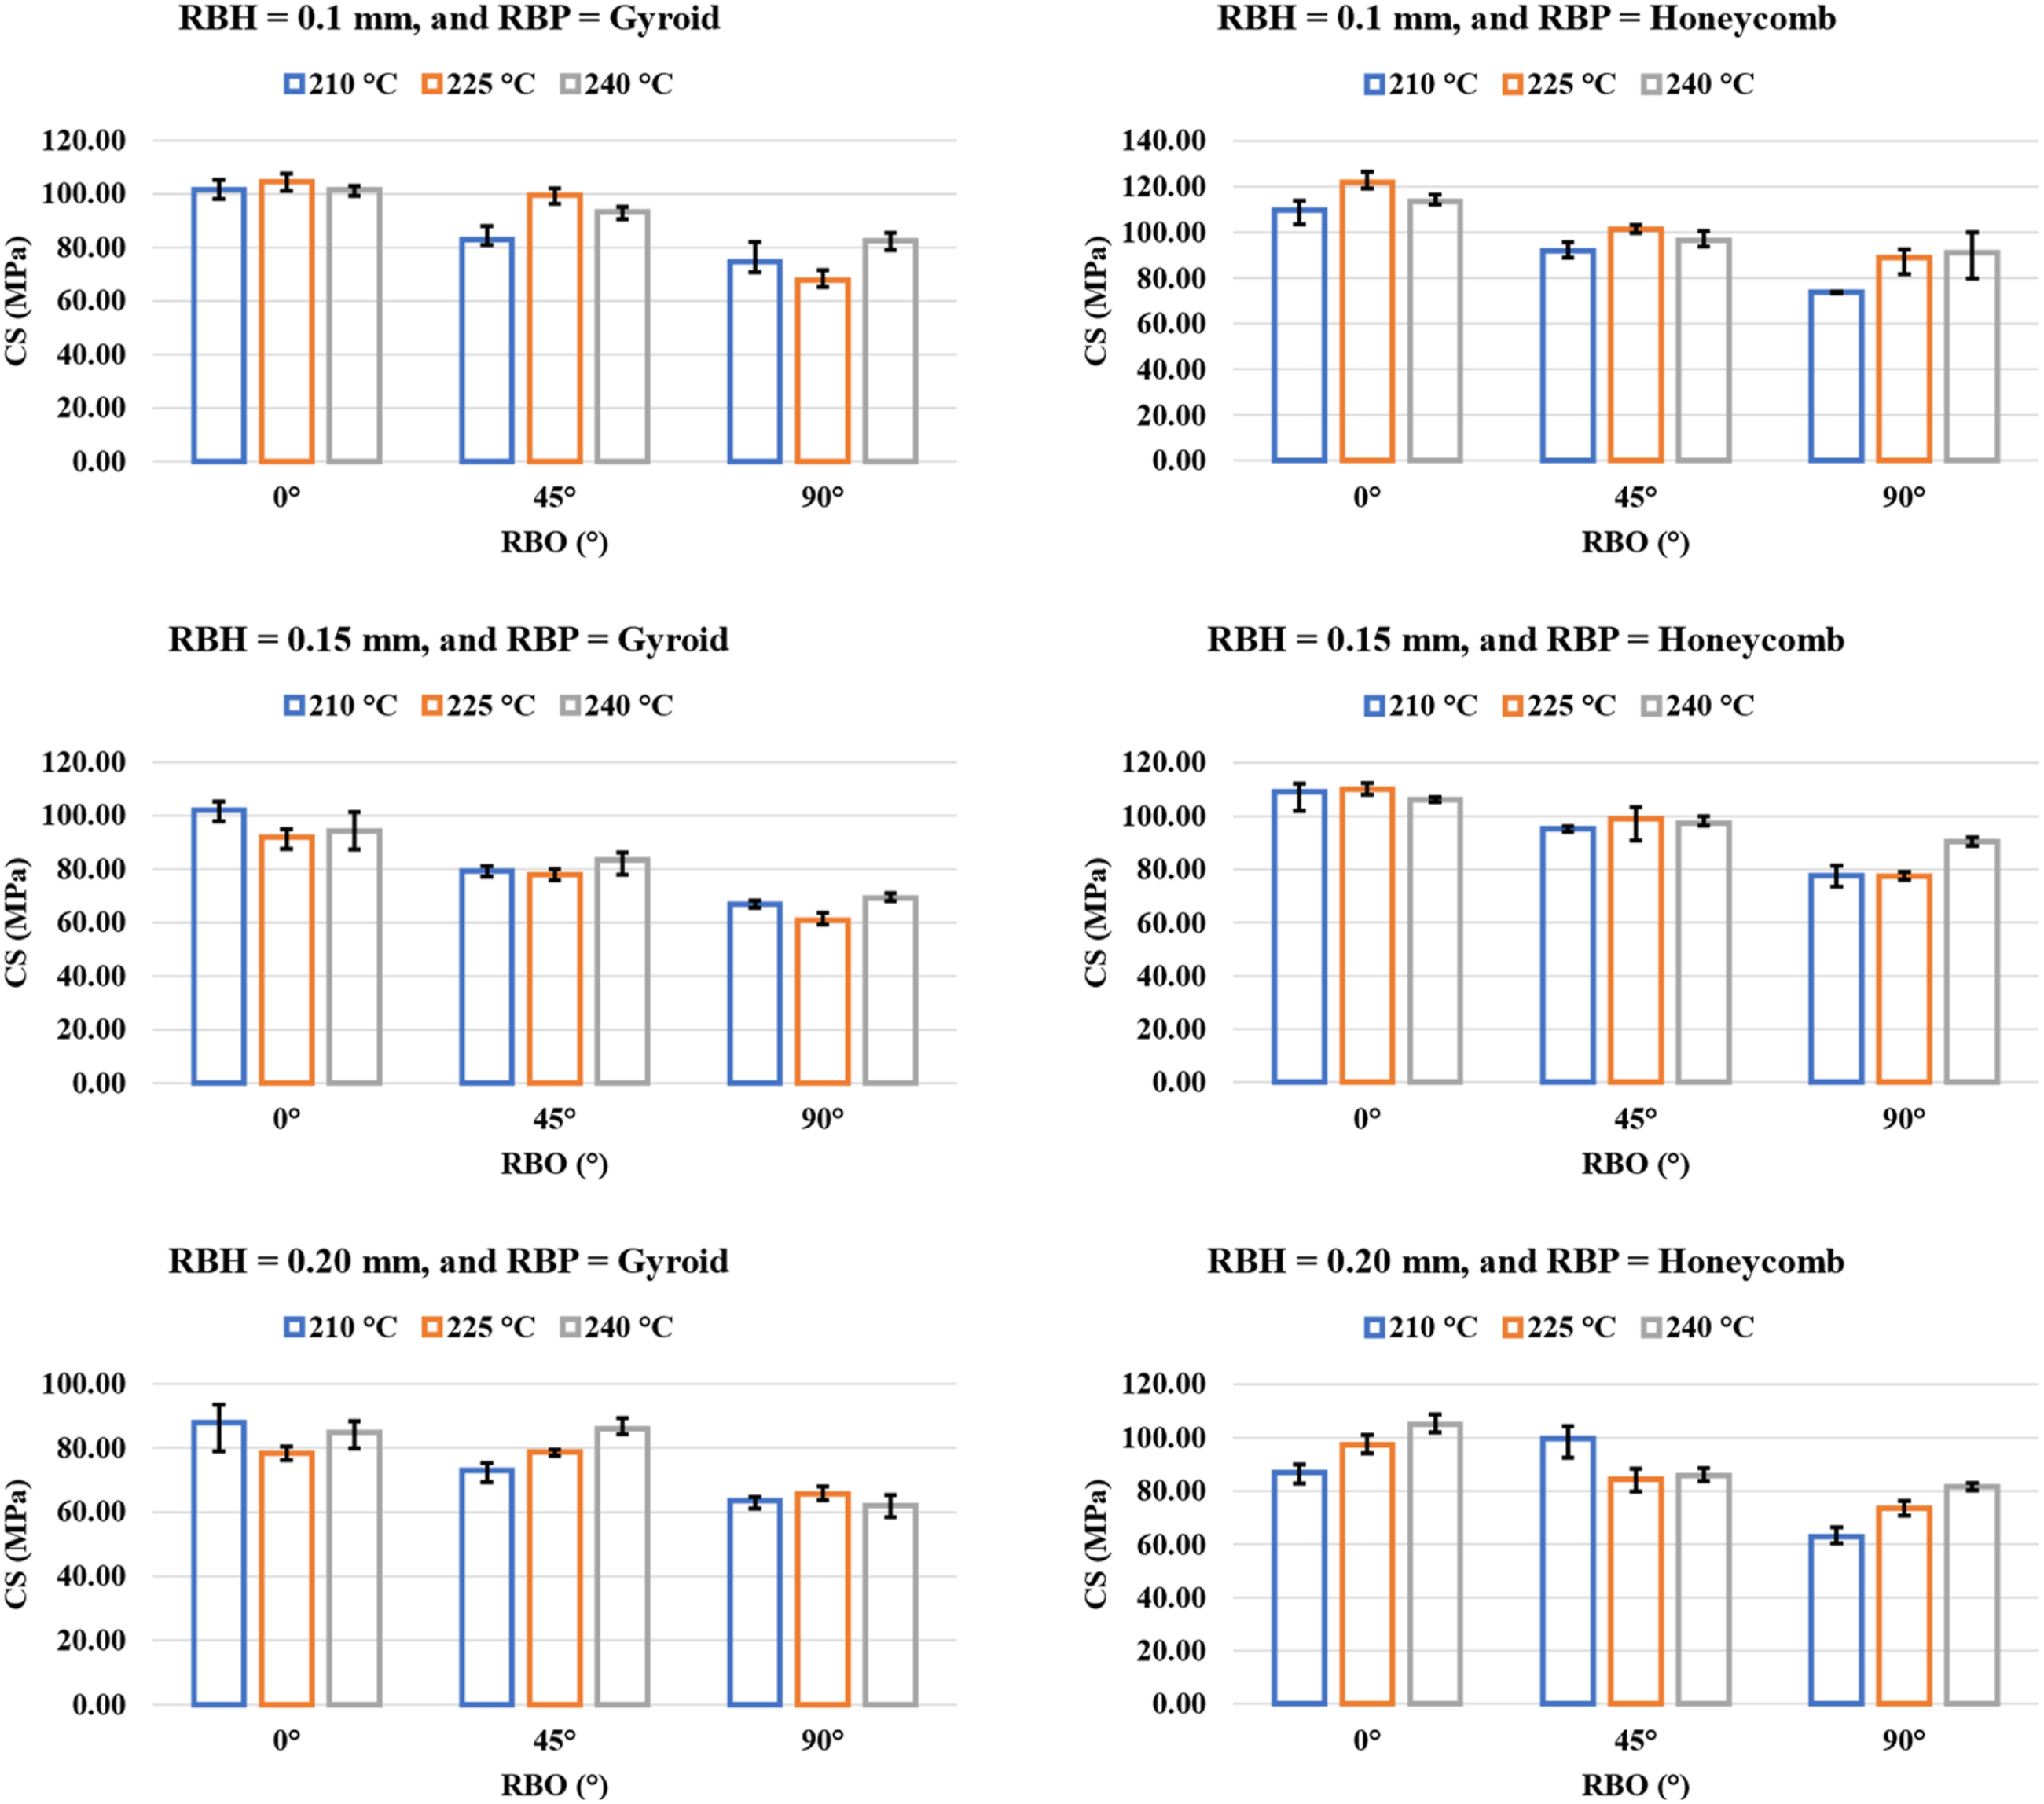
At 45° RBO, which introduces increased geometric anisotropy, the effect of HET remained consistent. For honeycomb specimens at RBH = 0.10 mm, CS increased from 92.03 MPa (210°C) to 101.40 MPa (225°C) (10.17% increase) and then decreased to 96.45 MPa (240°C) (4.89% decrease relative to 225°C). Gyroid samples showed a similar pattern, peaking at 99.54 MPa at 225°C, representing a 19.86% increase relative to 83.05 MPa at 210°C, followed by a 6.16% decline at 240°C. At RBH = 0.20 mm, honeycomb RBP still peaked at 210°C (99.61 MPa) but dropped by 15.23% and 14.03% at 225°C and 240°C, respectively, indicating that thicker layer’s benefit less from increased thermal energy due to limited diffusion depth and greater heat dissipation.
At 90° RBO, the weakest mechanical condition due to layer-normal loading, temperature effects remained clear. Honeycomb specimens at RBH = 0.10 mm increased sharply from 73.74 MPa (210°C) to 88.93 MPa (225°C) (20.56% increase) and further to 91.03 MPa (240°C) (2.36% increase over 225°C). Gyroid samples showed a similar but slight improvement, rising from 74.75 MPa to 82.43 MPa between 210°C and 240°C (10.28% increase). For RBH = 0.15 mm, the honeycomb RBP again demonstrated a substantial improvement from 77.69 MPa (210°C) to 90.34 MPa (240°C) (16.28% increase). These results suggest that when printing at orientations with inherently poor interlayer alignment, higher HET (up to 240°C) help compensate for weak bonding by enhancing polymer chain interdiffusion and reducing interfacial voids.
Overall, the data show that HET has a dual-regime effect. At lower HET (210°C), insufficient melt flow reduces interlayer adhesion, leading to lower CS. At intermediate HET (225°C), optimal viscosity and mobility facilitate stronger weld formation, yielding the highest strength in most cases—especially for 0° and 45° RBO. At excessively high HET (240°C), partial thermal degradation, increased melt fluidity, and structural distortion can introduce micro-porosity or uneven bead geometry, causing a slight decrease in strength for aligned layers but benefiting highly anisotropic (90°) builds. Thus, 225°C emerges as the most consistent and effective temperature for maximizing compressive performance, whereas 240°C provides selective improvement only when layer alignment is unfavourable.
Effect of RBP
The influence of RBP on CS demonstrated a clear and consistent trend across all RBO, RBH, and HET: Honeycomb structures outperformed Gyroid in nearly every condition, confirming the superior load-distribution capability and cell-wall stability of the honeycomb architecture. In Figure 10, at 0° RBO and RBH = 0.10 mm, CS at 210°C increased from 101.48 MPa (Gyroid) to 109.67 MPa (Honeycomb), an 8.08% improvement, while at 225°C, strength increased from 104.64 MPa to 121.89 MPa, a significant 16.47% enhancement. Even at 240°C, honeycomb specimens maintained a 11.82% higher strength than gyroid (113.60 vs 101.60 MPa). Similar behaviour occurred at 45° RBO, where honeycomb consistently exceeded gyroid performance; for example, at RBH = 0.15 mm and 225°C, CS rose from 77.84 MPa (Gyroid) to 99.00 MPa (Honeycomb), marking a 27.16% increase. The trend persisted at 90° RBO, the weakest mechanical condition: at RBH = 0.10 mm and 225°C, strength increased sharply from 67.78 MPa (Gyroid) to 88.93 MPa (Honeycomb), a 31.24% gain, and at 240°C from 82.43 to 91.03 MPa, reflecting a 10.45% improvement. Across the full dataset, honeycomb provided 10–32% higher CS than gyroid, depending on RBO and HET conditions. Scientifically, this improvement is attributed to the honeycomb RBP possessing continuous vertical load paths, thicker and more stable walls, and reduced internal shear zones, enabling greater stiffness and resistance to buckling under compressive loading. In contrast, the gyroid structure, while excellent for isotropic energy absorption, contains curved surfaces and continuous void channels that promote localized stress concentrations and early collapse under axial compression. Thus, the results clearly establish Honeycomb as the mechanically superior RBP for maximizing CS in PLA–MWCNT FFF composites.
The maximum CS in this study i.e. 121.89 MPa were comparatively higher than those reported for conventional neat PLA fabricated through FFF under similar compression testing conditions. Claudio et al. 48 reported optimized neat PLA CS in the range of 61–73 MPa depending on process-parameter selection. The comparatively higher strengths observed in the present work may be associated with improved stress-transfer capability and reinforcement effects introduced by MWCNT incorporation.
Failure analysis of compression samples
The failure morphology of the specimens corresponding to the lowest, moderate, and highest CS is presented in Figure 11. The lowest-strength sample (Figure 11(a)), printed at 90° RBO, 0.15 mm RBH, 225°C HET, and gyroid RBP, recorded a CS of 60.88 MPa, the weakest among all configurations. Its cross-section shows complete raster delamination, with outer filaments peeling away from the core. This indicates that the compressive load was primarily resisted by layer interfaces, which represent the weakest plane in 90° RBO. The RBH further reduced contact area, promoting early interlayer shear failure instead of bulk compression. The distorted cross-section and peeling rasters are consistent with failure governed by interlayer fracture rather than material crushing. Failure analysis of compression samples.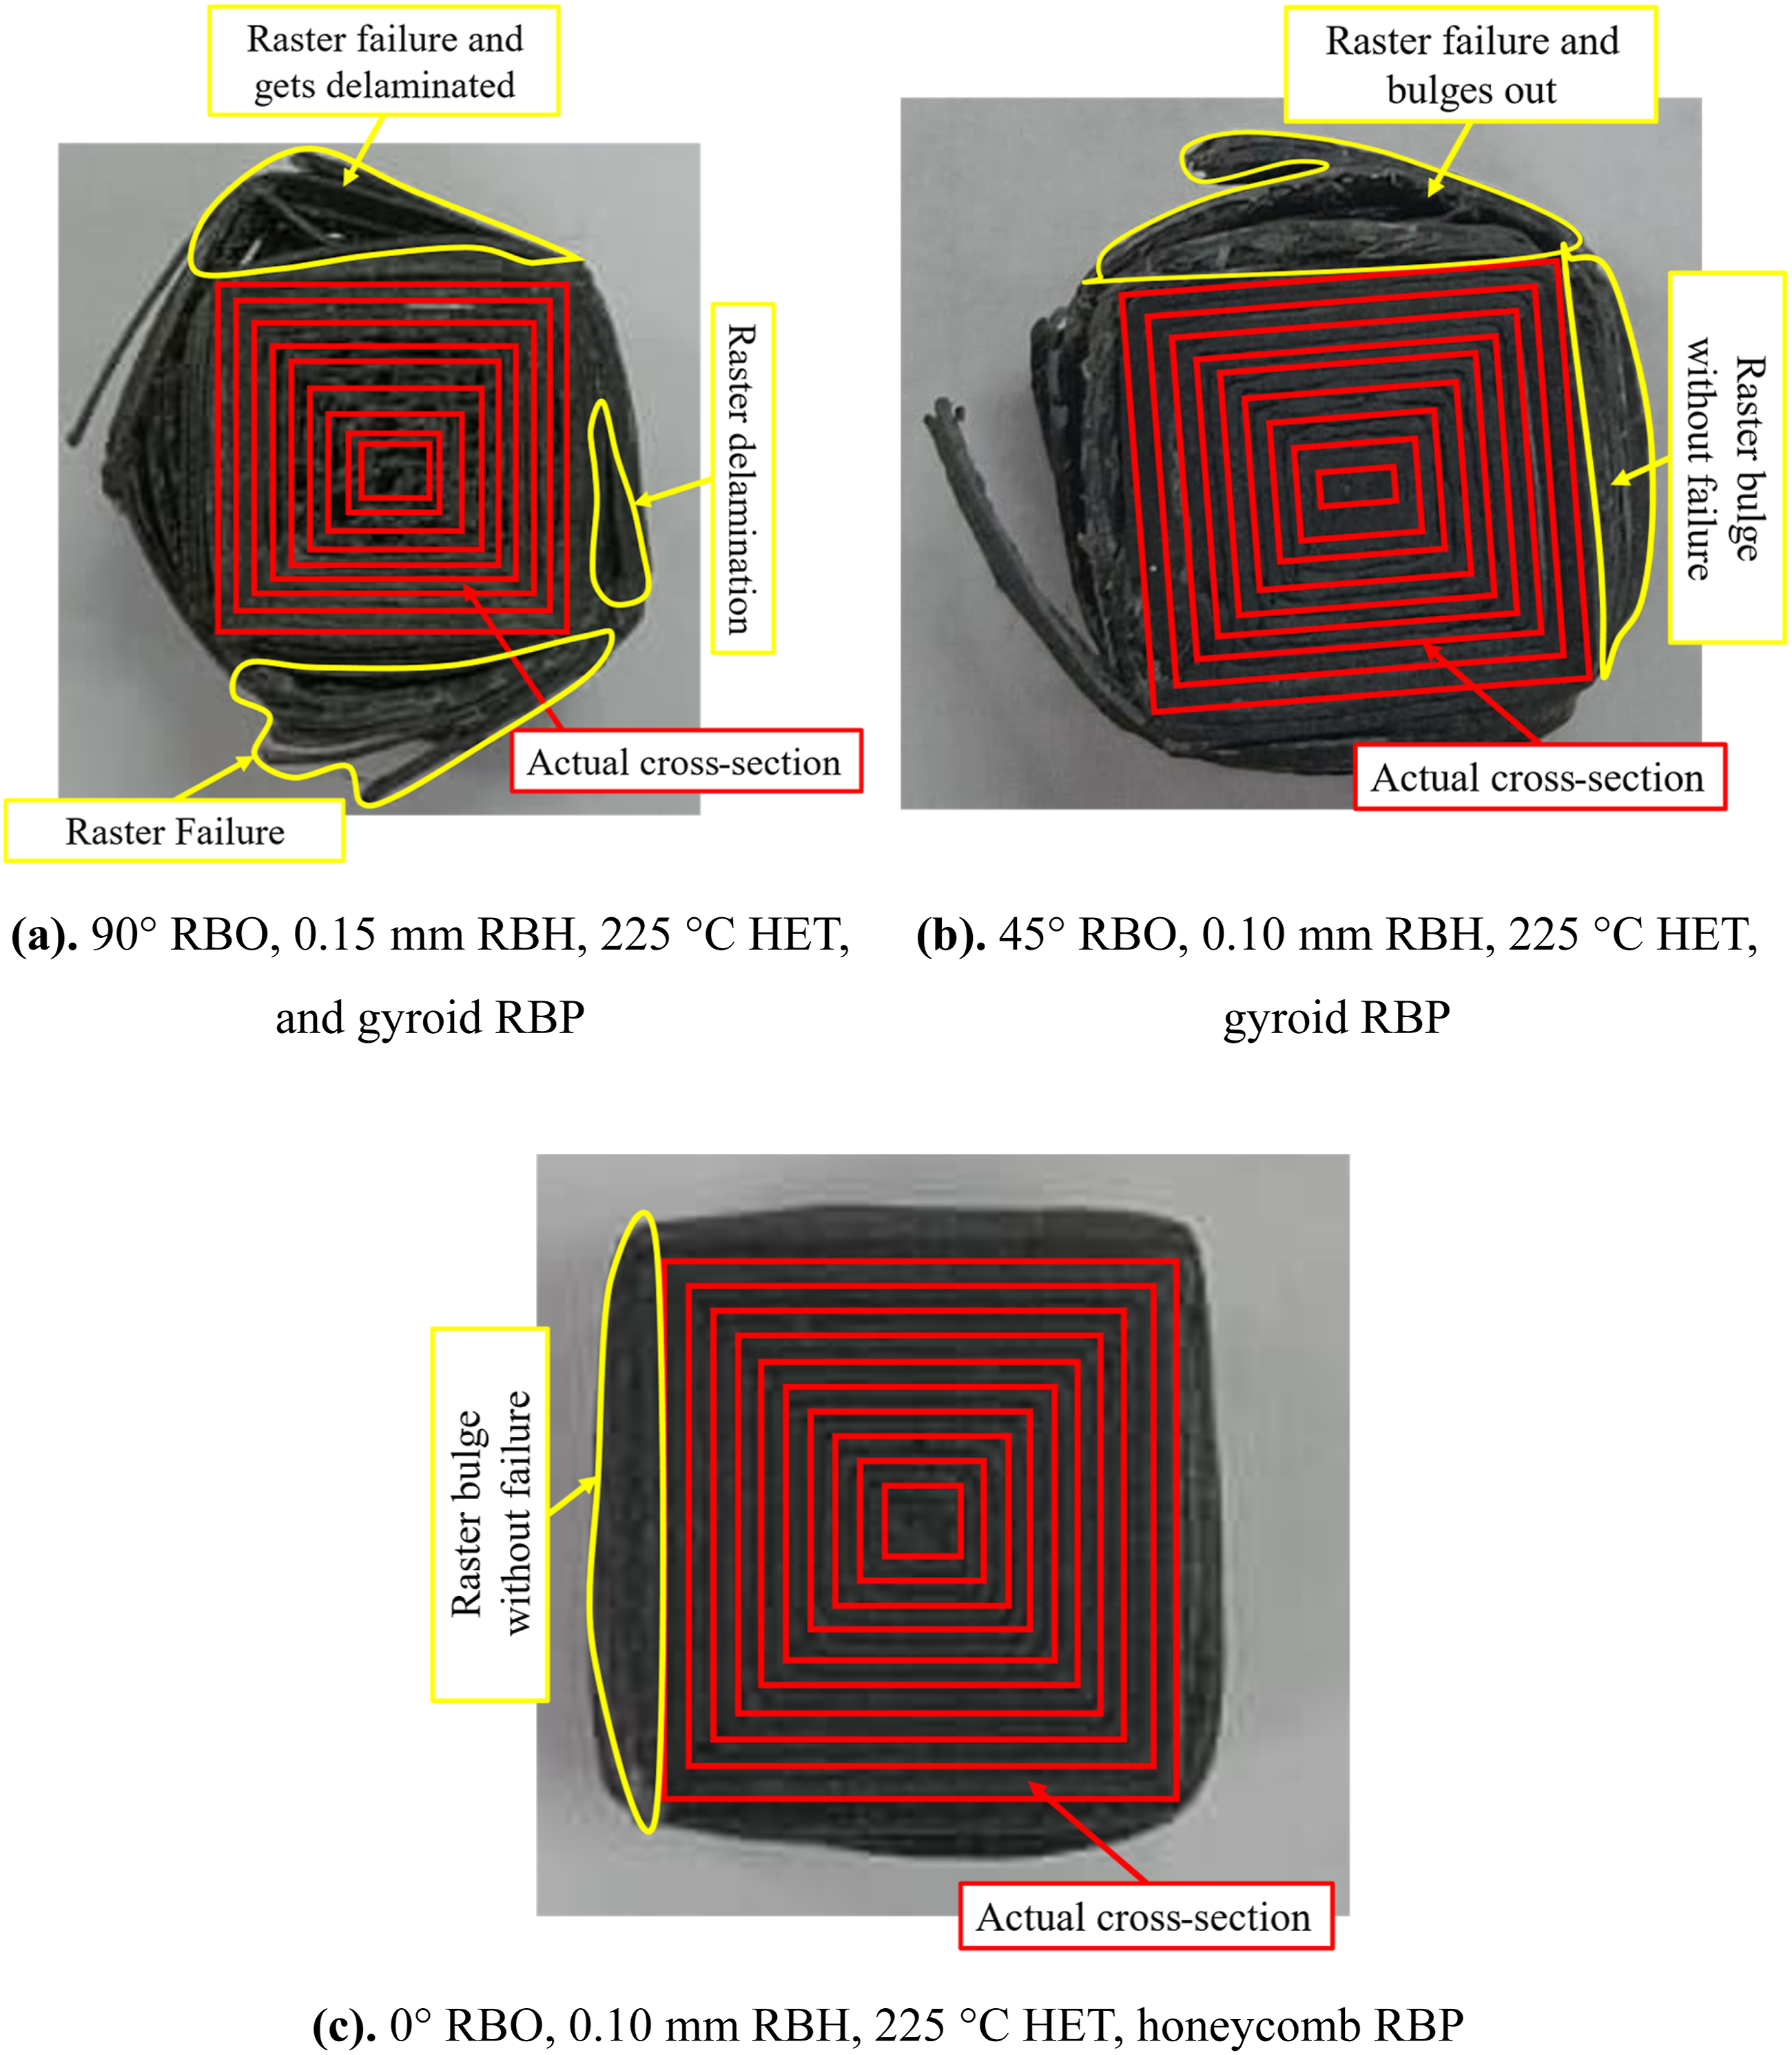
The moderate-strength sample as shown in Figure 11(b), produced at 45° RBO, 0.10 mm RBH, 225°C HET, gyroid RBP, achieved a CS of 99.54 MPa. This sample did not delaminate completely; instead, it exhibited bulging of the perimeter rasters and partial rupture near the upper layers, indicating a mixed shear–compression failure mode. Because the filaments are partially aligned with the loading direction at 45°, some load is efficiently carried along the filament length, while another portion is transmitted through interlayer bonds. The absence of full detachment but presence of bulging indicates intermediate weld strength, consistent with the mid-range CS value.
The highest-strength sample as shown in Figure 11(c), printed at 0° RBO, 0.10 mm RBH, 225°C HET, honeycomb RBP, reached the maximum recorded CS of 121.89 MPa. Its failure morphology shows uniform crushing, with no evidence of delamination or raster splitting. The perimeter rasters only show slight outward bulging, and the internal section remained cohesive, confirming continuous load transmission along the filament direction at 0° RBO. The fine RBH (0.10 mm) improved interlayer contact and reduced void content, while the honeycomb RBP provided stable vertical load paths. The deformation pattern resembles bulk compressive yielding, indicating that failure occurred only after the material approached its intrinsic strength rather than due to interlayer defects.
Overall, the transition from delamination-dominated failure (60.88 MPa) to mixed bulging failure (99.54 MPa) and finally stable crushing (121.89 MPa) directly reflects the influence of RBO, RBH, and RBP on interlayer fusion quality and stress distribution. These observations validate the experimental findings where RBO and RBH were identified as the primary determinants of CS, and honeycomb RBP enabled the structurally most stable failure behaviour.
Statistical analysis using Taguchi ANOVA and RSM
Taguchi ANOVA
ANOVA results showing the statistical significance and percentage contribution of each FFF PPP on CS.
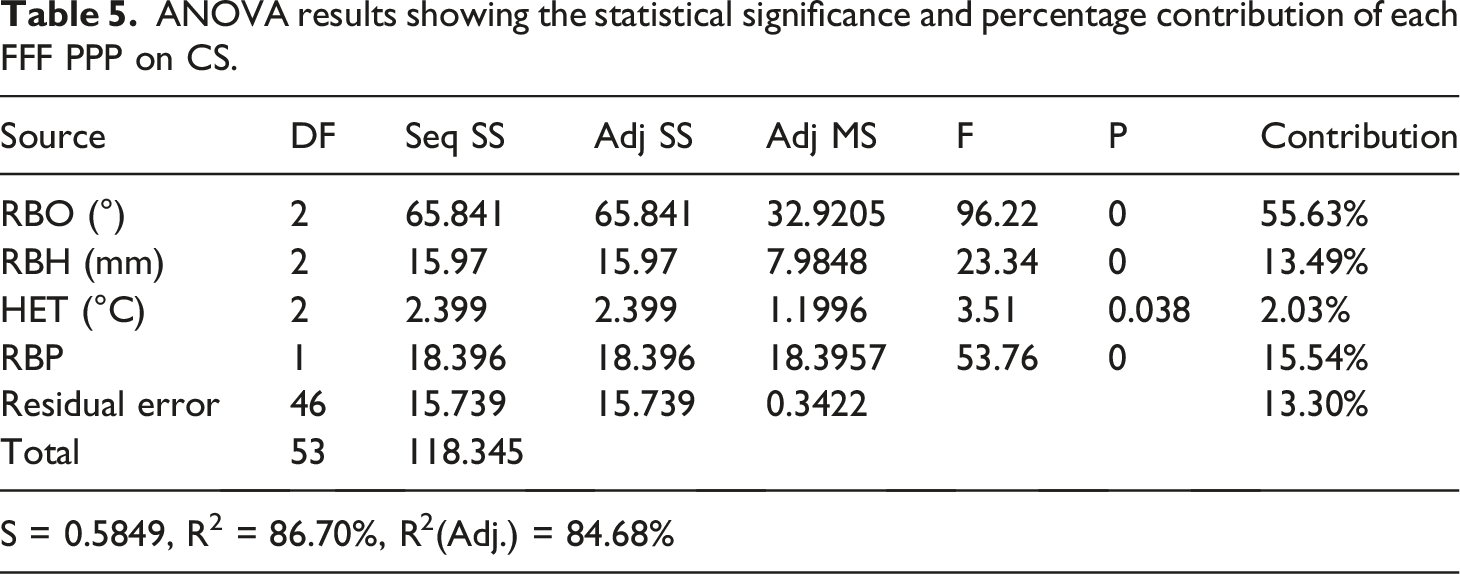
The main effects plot of SNRA as shown in Figure 12(a) support these quantitative findings. The SNRA decreases sharply with orientation from 0° to 45° to 90°, establishing 0° as the optimal RBO. RBH shows a consistent drop from 0.10 to 0.15 to 0.20 mm, indicating weaker interlayer bonding with thicker layers. HET displays a moderate upward trend toward 225–240°C, correlating with improved diffusion and reduced interfacial porosity. RBP shows a clear advantage for the honeycomb RBP over gyroid, consistent with its stiffer and more stable cell-wall loading structure. (a). Main effects plot of SNRA illustrating the individual influence of RBO, RBH, HET, and RBP on CS, (b). Interaction plot of SNRA showing combined effects of the PPPs on CS.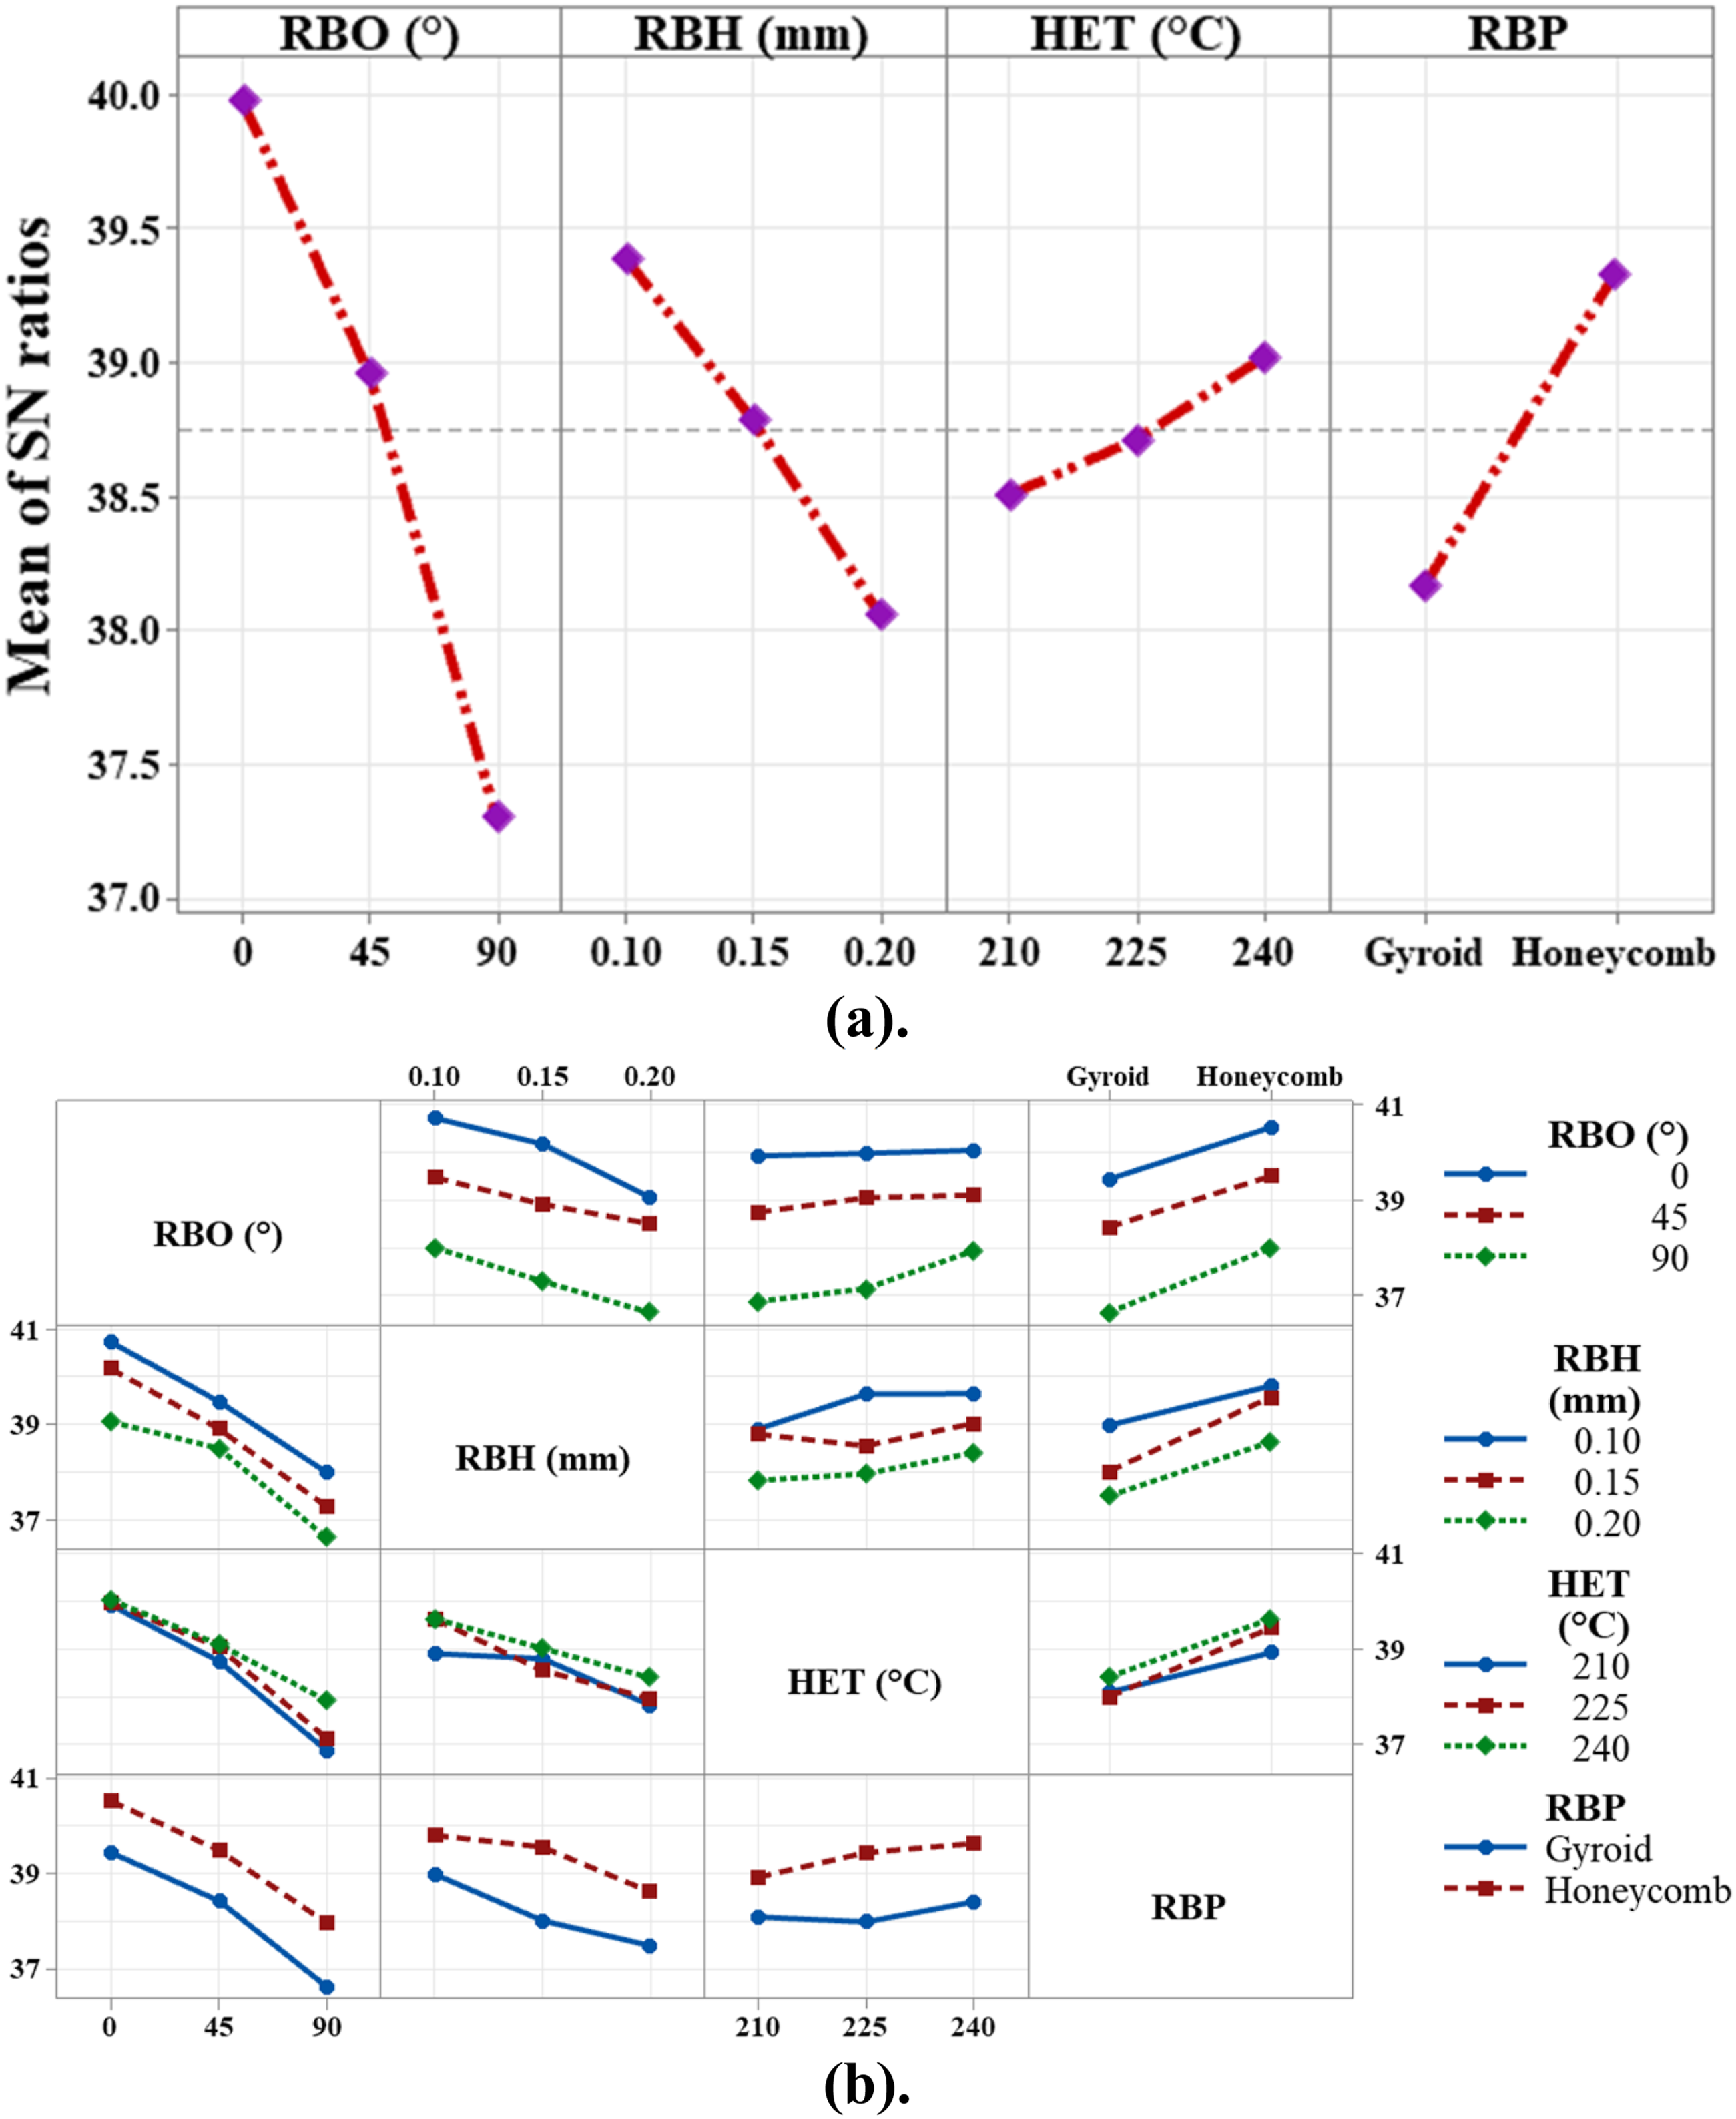
The interaction plot as shown in Figure 12(b) further highlights the interconnected behavior of the PPPs. Interactions between RBO × RBH reveal that increasing RBH is most detrimental at 90° RBO, where compressive load acts directly across the weakest weld interfaces. Similarly, the RBO × RBP interaction shows that the honeycomb RBP mitigates anisotropy better than gyroid, especially at 45° and 90°. The HET × RBO interaction indicates that higher HET partially compensate for orientation-induced weakness by enhancing polymer chain mobility and weld strength.
Overall, the Taguchi analysis shows that CS is primarily governed by orientation-dependent anisotropy, followed by raster geometry and interlayer bonding efficiency. The combination of ANOVA, SNRA trends, and interaction behavior confirms that RBO is the most critical PPP for achieving high compressive performance in PLA–MWCNT FFF composites.
RSM
RSM results summarizing the linear, quadratic, and interaction contributions of the FFF PPPs to CS, along with corresponding F-values and significance level.
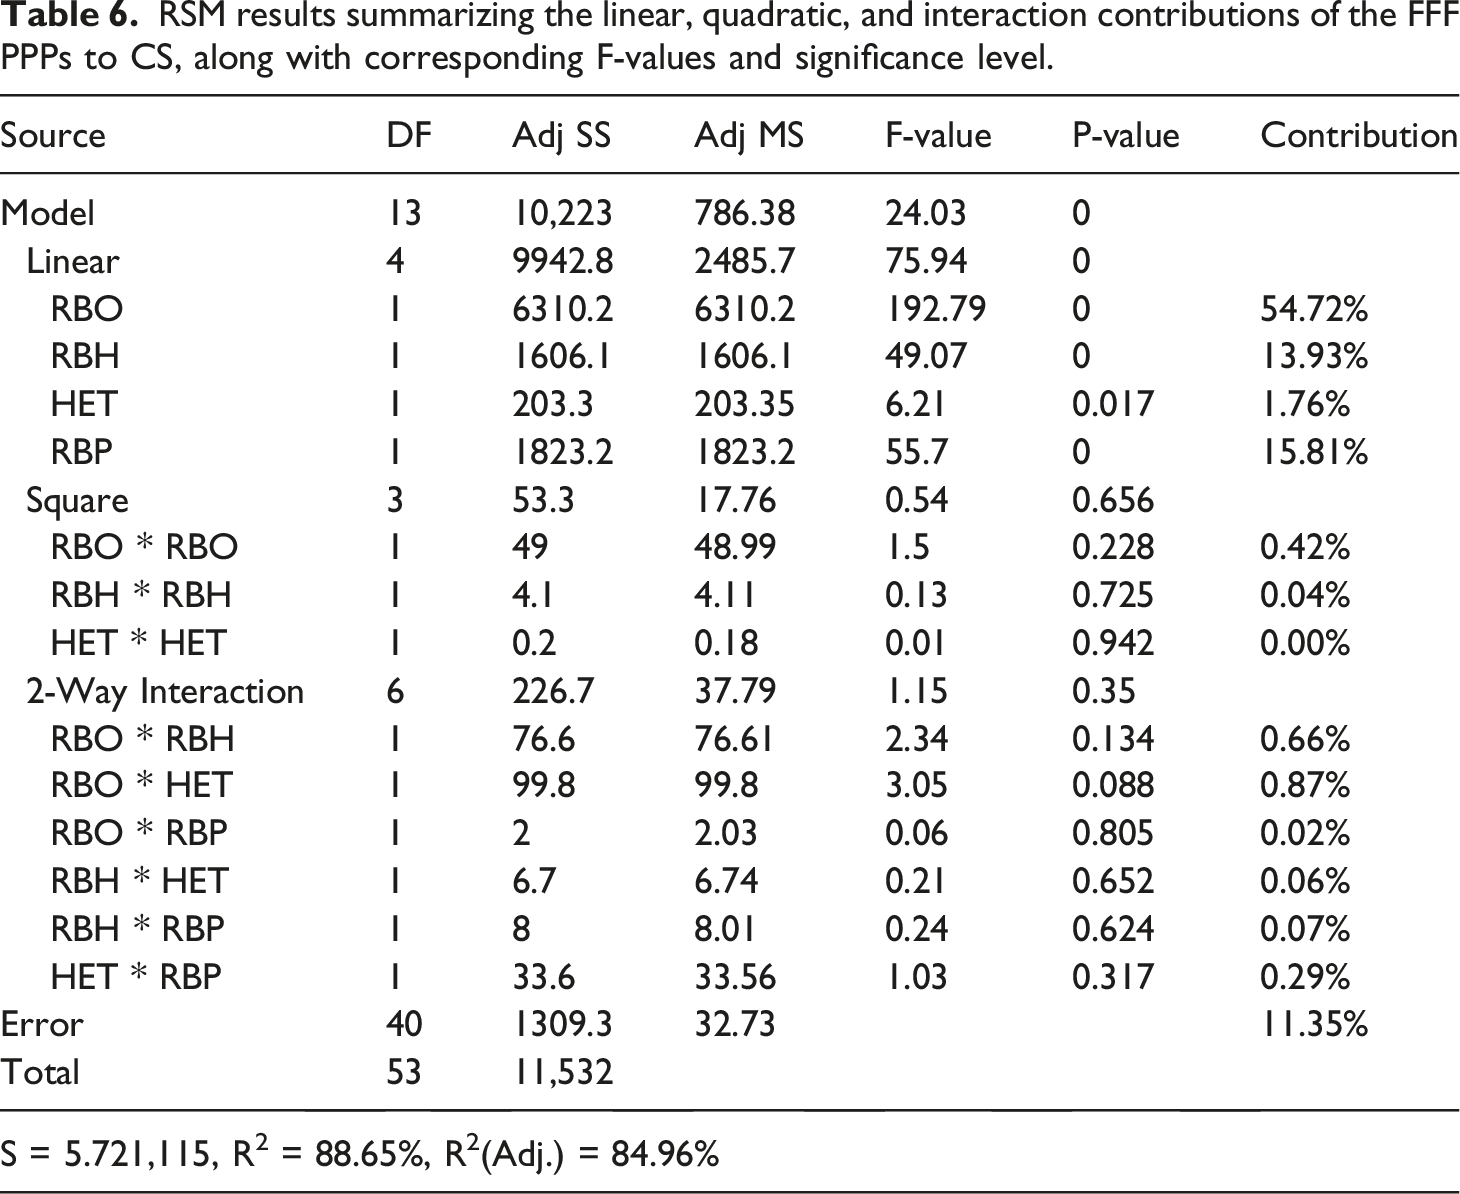
The resulting regression equation provided by RSM, shown in equation (1), serves as a predictive model expressing CS as a function of the four input PPPs.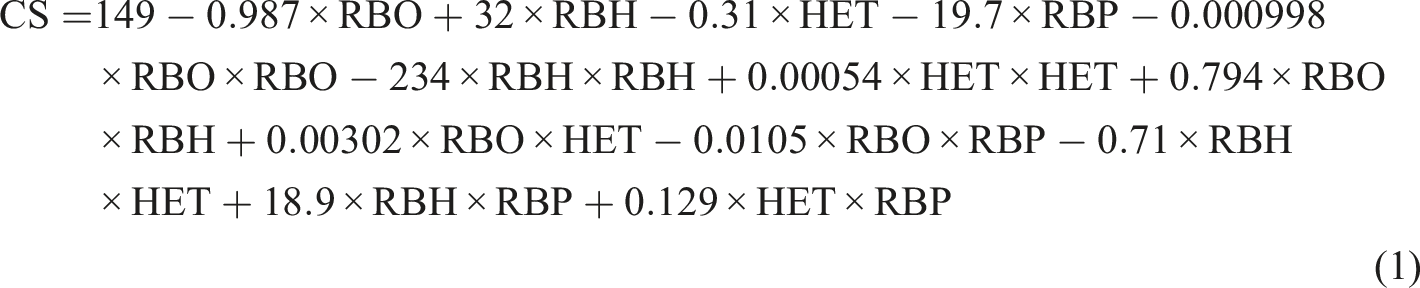
The developed polynomial regression model should therefore be interpreted as an empirical parameter–response approximation valid only within the investigated discrete experimental domain. This polynomial accurately represents the experimental data, as supported by the model statistics (R2 = 88.65%, R2(adj) = 84.96%, S = 5.721), demonstrating strong goodness-of-fit and low residual dispersion. The contour and surface response plots presented in Figure 13 further illustrate these relationships, revealing clear response gradients with respect to RBO, RBP and RBH. The plots also show a mild but consistent strengthening trend at elevated HET due to improved polymer diffusion. Together, these graphical and statistical results reinforce the conclusion that compressive performance in PLA–MWCNT composites is governed primarily by orientation-dependent anisotropy, followed by internal structural architecture and interlayer bonding quality. Surface plots and Contour plots generated from the RSM model showing the combined influence of the FFF PPP on CS.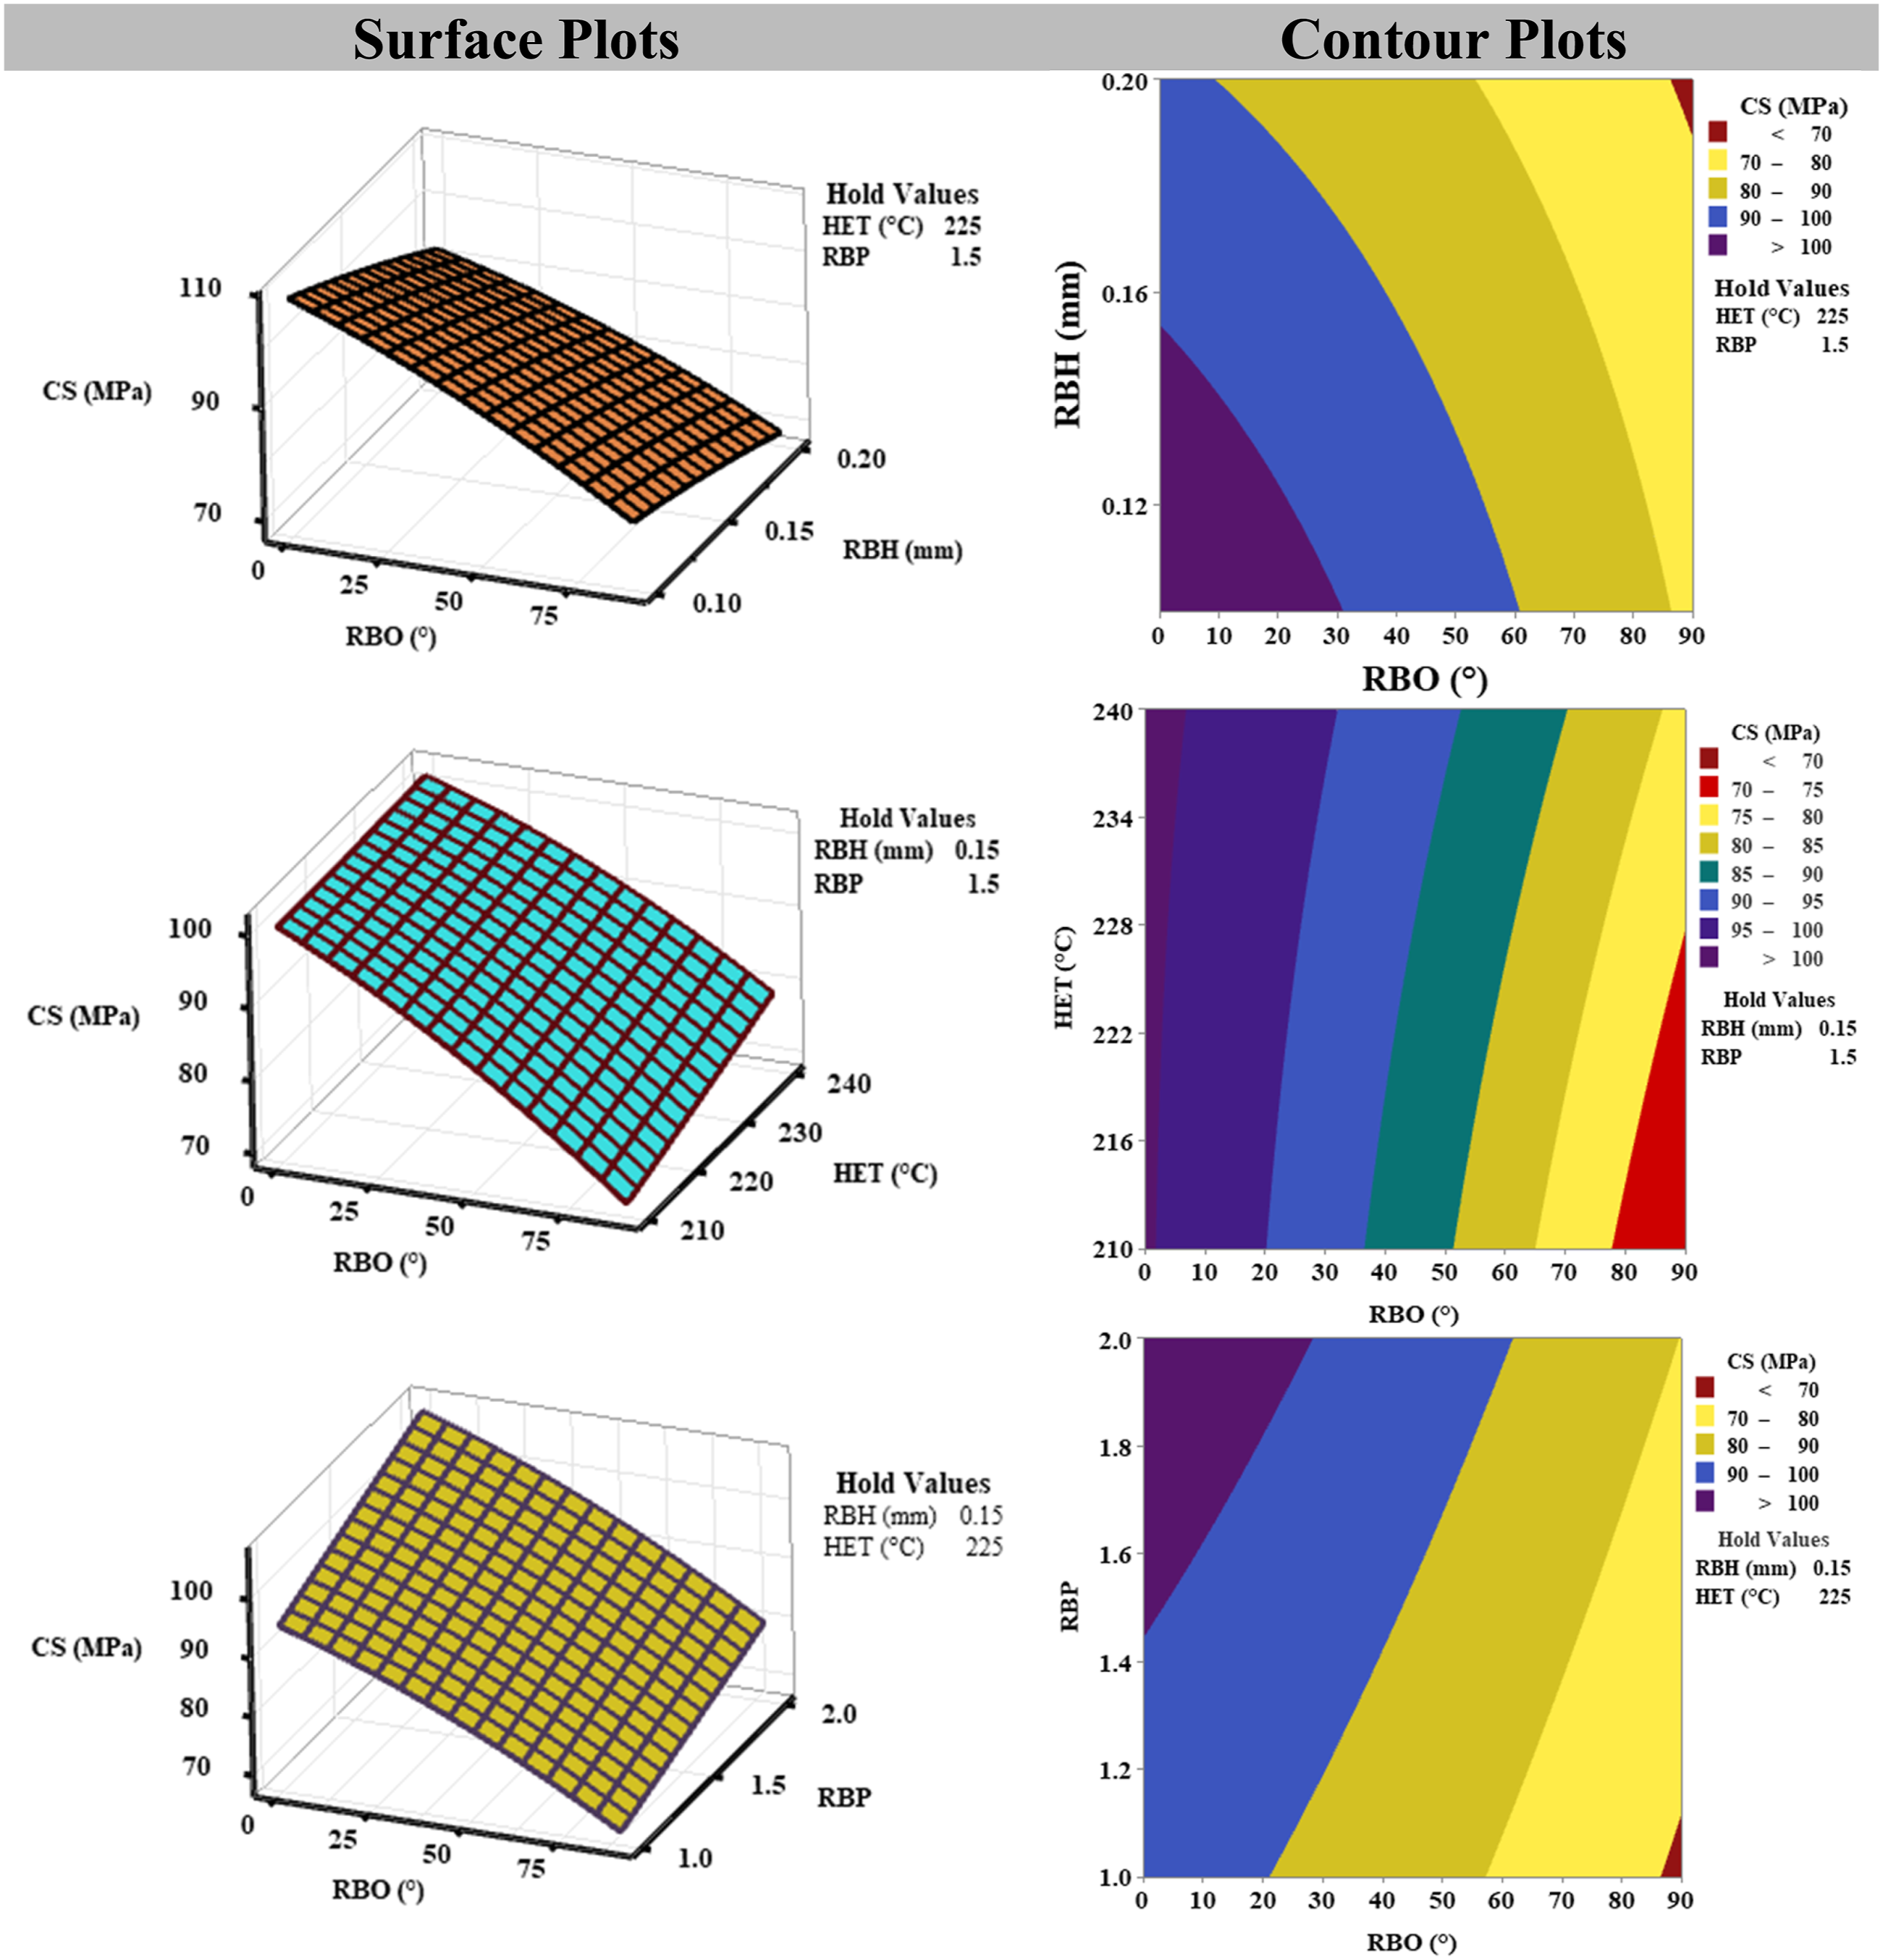
Experimental dataset formulation and conditioning for predictive modelling
The experimental dataset for ML analysis was constructed using the full-factorial combinations of the four FFF PPPs: RBO, RBH, HET, and RBP. The corresponding CS values obtained from mechanical testing served as the target response. All 54 experimental instances were compiled into a structured dataset, ensuring complete coverage of the design space. To ensure proper generalization of models, a pipeline-based framework was used in data processing. The normalization of input variables was performed using a standard scalar on training data. The dataset was then partitioned into training and testing subsets following an 80:20 split for final model evaluation. For ML modelling, the CS values corresponding to each parameter combination were represented by the mean of three replicate measurements. This averaging approach was adopted to minimize the influence of experimental variability and to ensure that the models capture the intrinsic relationship between PPPs and mechanical response. The standard deviation values were used for assessing data consistency but were not included in the model training.
CV and hyperparameter optimization
To minimize overfitting and achieve stable predictive performance, a 5-fold CV strategy was employed during model training. This approach distributed variance evenly across folds and improved the reliability of the parameter tuning process. Hyperparameter optimization was performed using GridSearchCV, individually configured for each regression model. Parameters such as tree depth, number of estimators, learning rate, kernel width, and regularization coefficients were systematically optimized for ensemble and kernel-based models, while margin parameters and tolerance factors were tuned for support vector regression. Despite the moderate size of the dataset, the combination of Grid Search and CV, followed by validation on a separate 80:20 train–test split, ensured that the models generalized well. The consistency between CV scores and final test metrics further confirmed the absence of overfitting and demonstrated the robustness of the modelling workflow.
Computational modelling
A set of supervised ML algorithms was implemented to capture linear, nonlinear, and interaction-driven dependencies between the FFF PPPs and CS. The modelling framework was developed using Python and executed with Scikit-learn, NumPy, Pandas, and XGBoost libraries. Model performance was quantified using multiple regression metrics, including the R2, RMSE, and MAE, providing a comprehensive evaluation of predictive accuracy. To strengthen interpretability, SHAP values were employed as a post-hoc analysis tool, enabling quantification of the individual contribution of RBO, RBH, HET, and RBP to the predicted CS. The SHAP-based insights revealed PPP importance trends consistent with the statistical analysis and highlighted the mechanistic effects of RBO, RBP, and RBH on compressive behaviour. This integrated modelling strategy, combining optimized ML algorithms with SHAP interpretability, establishes a predictive and mechanistically meaningful framework for process–property understanding and data-driven optimization of FFF-printed PLA–MWCNT composites.
Comparative performance of ML models for CS prediction
The comparative evaluation of the supervised ML models for predicting the CS of the PLA–MWCNT composites is presented in Figure 14. Among all the algorithms tested, the RFR delivered the most accurate and stable predictions, achieving the highest R2 = 0.9686 along with the lowest error values (RMSE = 2.5904, MAE = 2.0524). This superior performance illustrates the ability of RFR to effectively capture the strong non-linearity and interaction-driven behaviour inherent in the FFF PPPs. The close alignment between predicted and experimental values shown in Figure 15(a) further confirms the robustness of the RFR model. (a). Comparison of R2 values obtained from the applied machine-learning models, Taguchi analysis, and RSM prediction, Regression plots for predicted versus actual CS results for the ML models: (a). RFR, (b). DTR, (c). CBR, and (d). RR.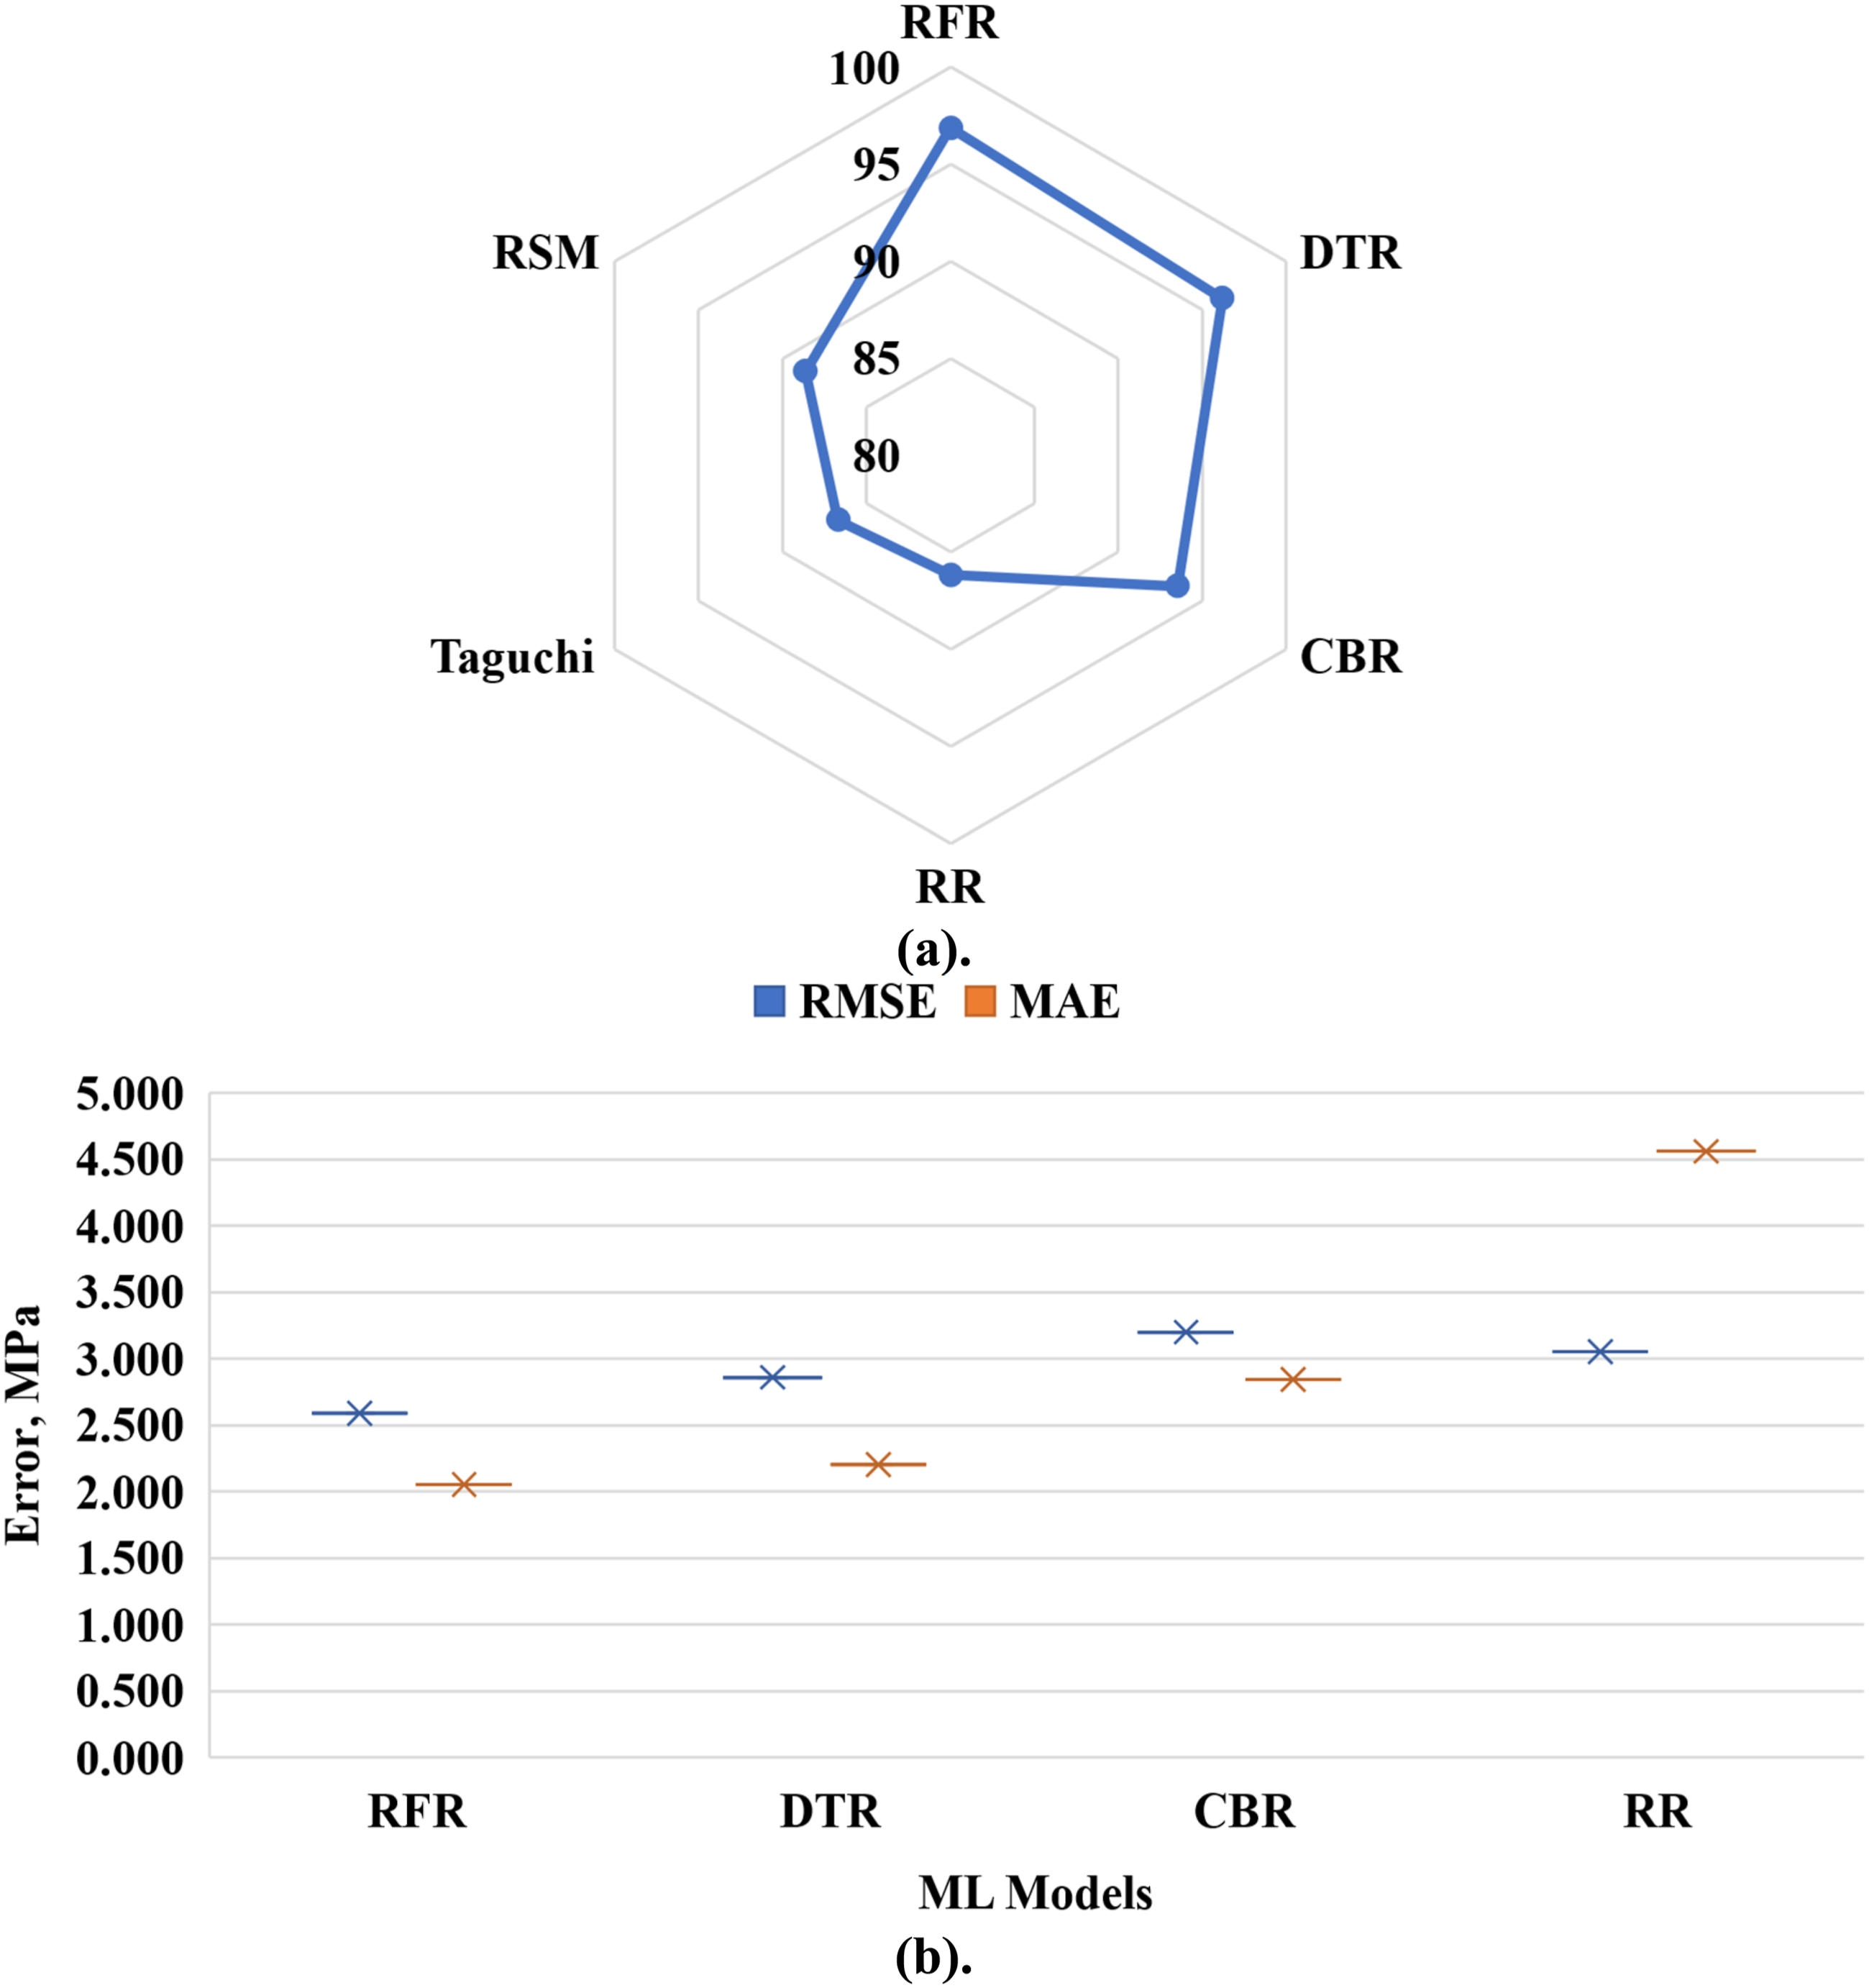
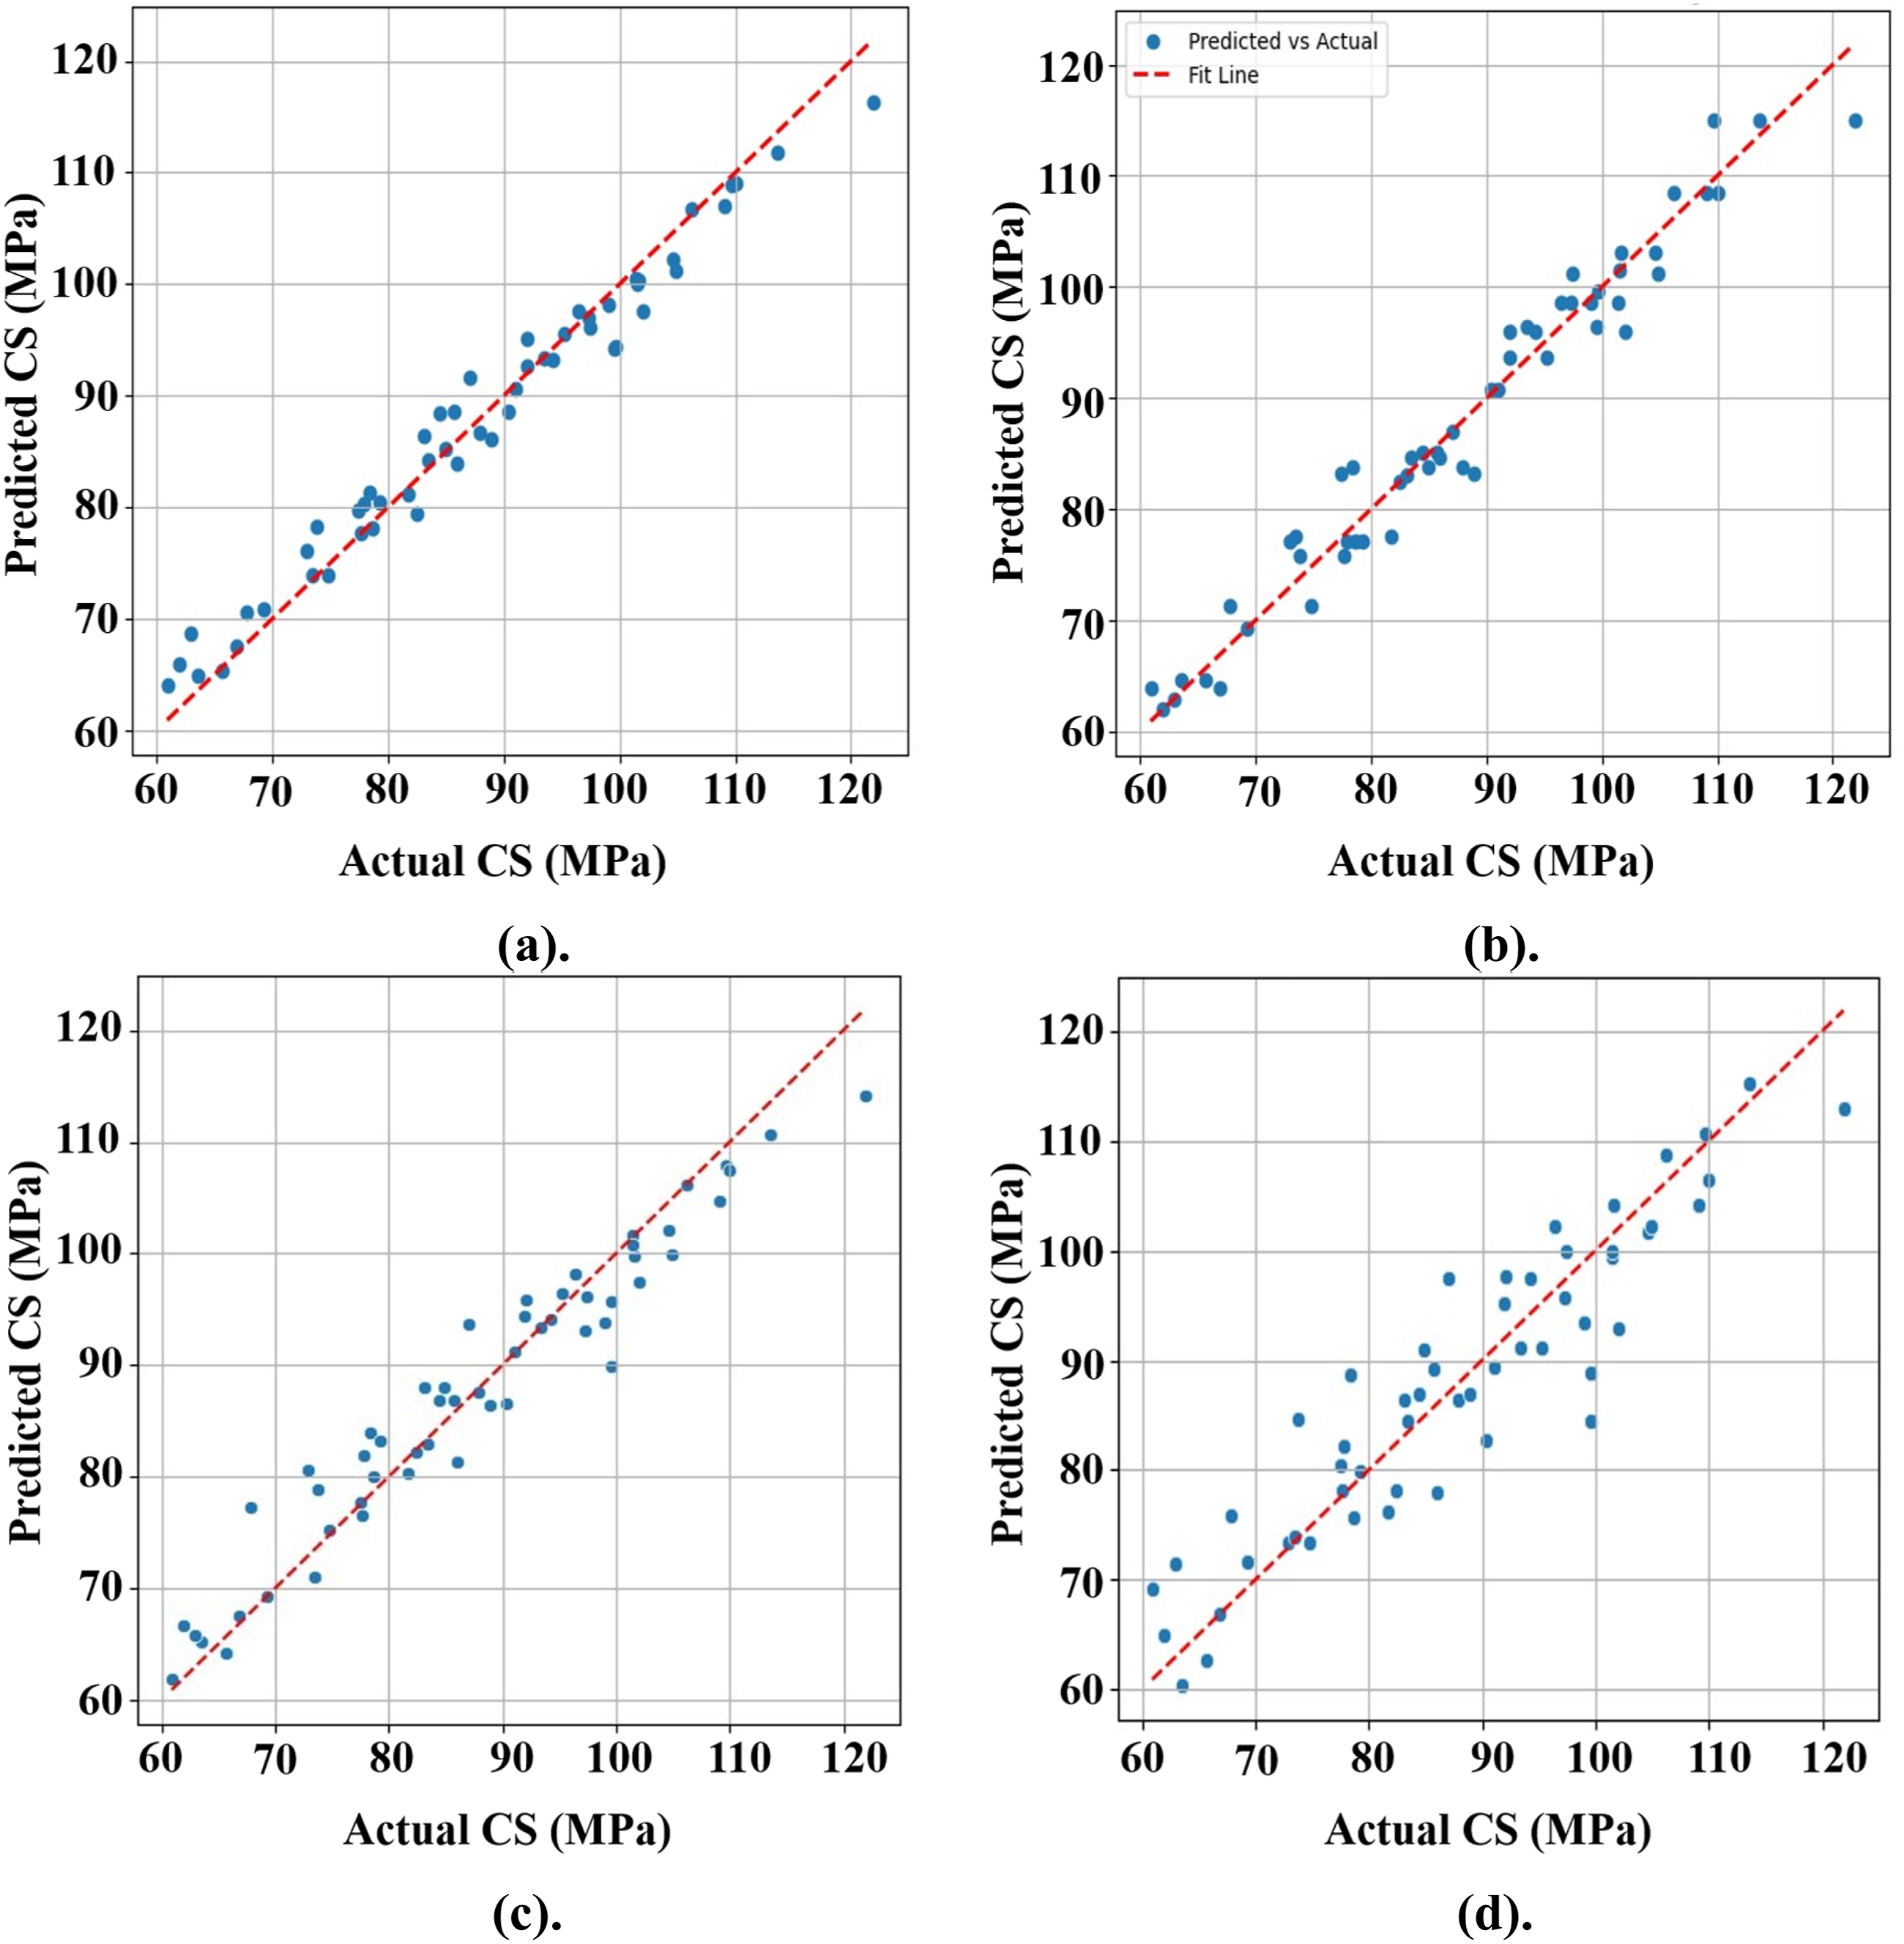
The DTR ranked second in predictive capability, yielding an R2 value of 0.9617, with RMSE = 2.8594, and MAE = 2.2034. While the model successfully captured the non-linear relationships within the dataset, its slightly higher error and reduced R2 compared to RFR reflect the well-known instability of single-tree architectures, which tend to overfit localized regions of the data. The prediction performance illustrated in Figure 15(b) supports this observation. The CBR demonstrated moderate predictive performance, with R2 = 0.9352, RMSE = 3.199 and MAE = 2.8426. Although its gradient-boosting framework enables efficient handling of complex dependencies, its design advantage for categorical variables limits its effectiveness for purely continuous FFF PPPs. As shown in Figure 15(c), the model follows the general trend but with noticeably increased deviation from experimental values.
The RR model exhibited the weakest performance among the evaluated algorithms, with R2 = 0.8618 and considerably higher error levels (RMSE = 5.434 and MAE = 4.303). These results clearly indicate that linear models struggle to represent the highly non-linear interactions between RBO, RBH, HET, and RBP. The prediction scatter shown in Figure 15(d) highlights the limitations of RR in this multi-parameter, non-linear regime.
Overall, the ranking of model performance confirms that ensemble-based and non-linear algorithms are far better suited for predicting CS in FFF-manufactured nanocomposites due to their capacity to model interaction effects and anisotropic behaviour.
SHAP-based interpretability of ML predictions
A comprehensive SHAP interpretability analysis was performed to elucidate how the individual FFF PPPs influence the ML prediction of CS in PLA–MWCNT composite specimens. The combined evaluation using the SHAP 1ummary plot, drop-column feature-importance plot, SHAP force plot, and SHAP decision plot provides a multi-layered and physically consistent understanding of the model’s internal reasoning.
The SHAP summary plot as shown in Figure 16 demonstrates that RBO exhibits the widest distribution of SHAP values and the strongest directional impact on the predicted response. Samples printed at 0° RBO consistently shift predictions upward, while those printed at 45° and 90° RBO induce negative SHAP contributions, confirming the dominant role of RBO-dependent anisotropy in compressive loading. The plot also shows that RBH contributes predominantly negative SHAP values, reaffirming that thicker layers diminish interfacial bonding and increase porosity. RBP exhibits clear positive contributions for honeycomb configurations, reflecting improved stiffness and load-bearing uniformity, while HET demonstrates the smallest overall influence, consistent with its secondary role relative to geometric parameters. Summary of SHAP values showing the overall influence and direction of each FFF PPP on the predicted CS.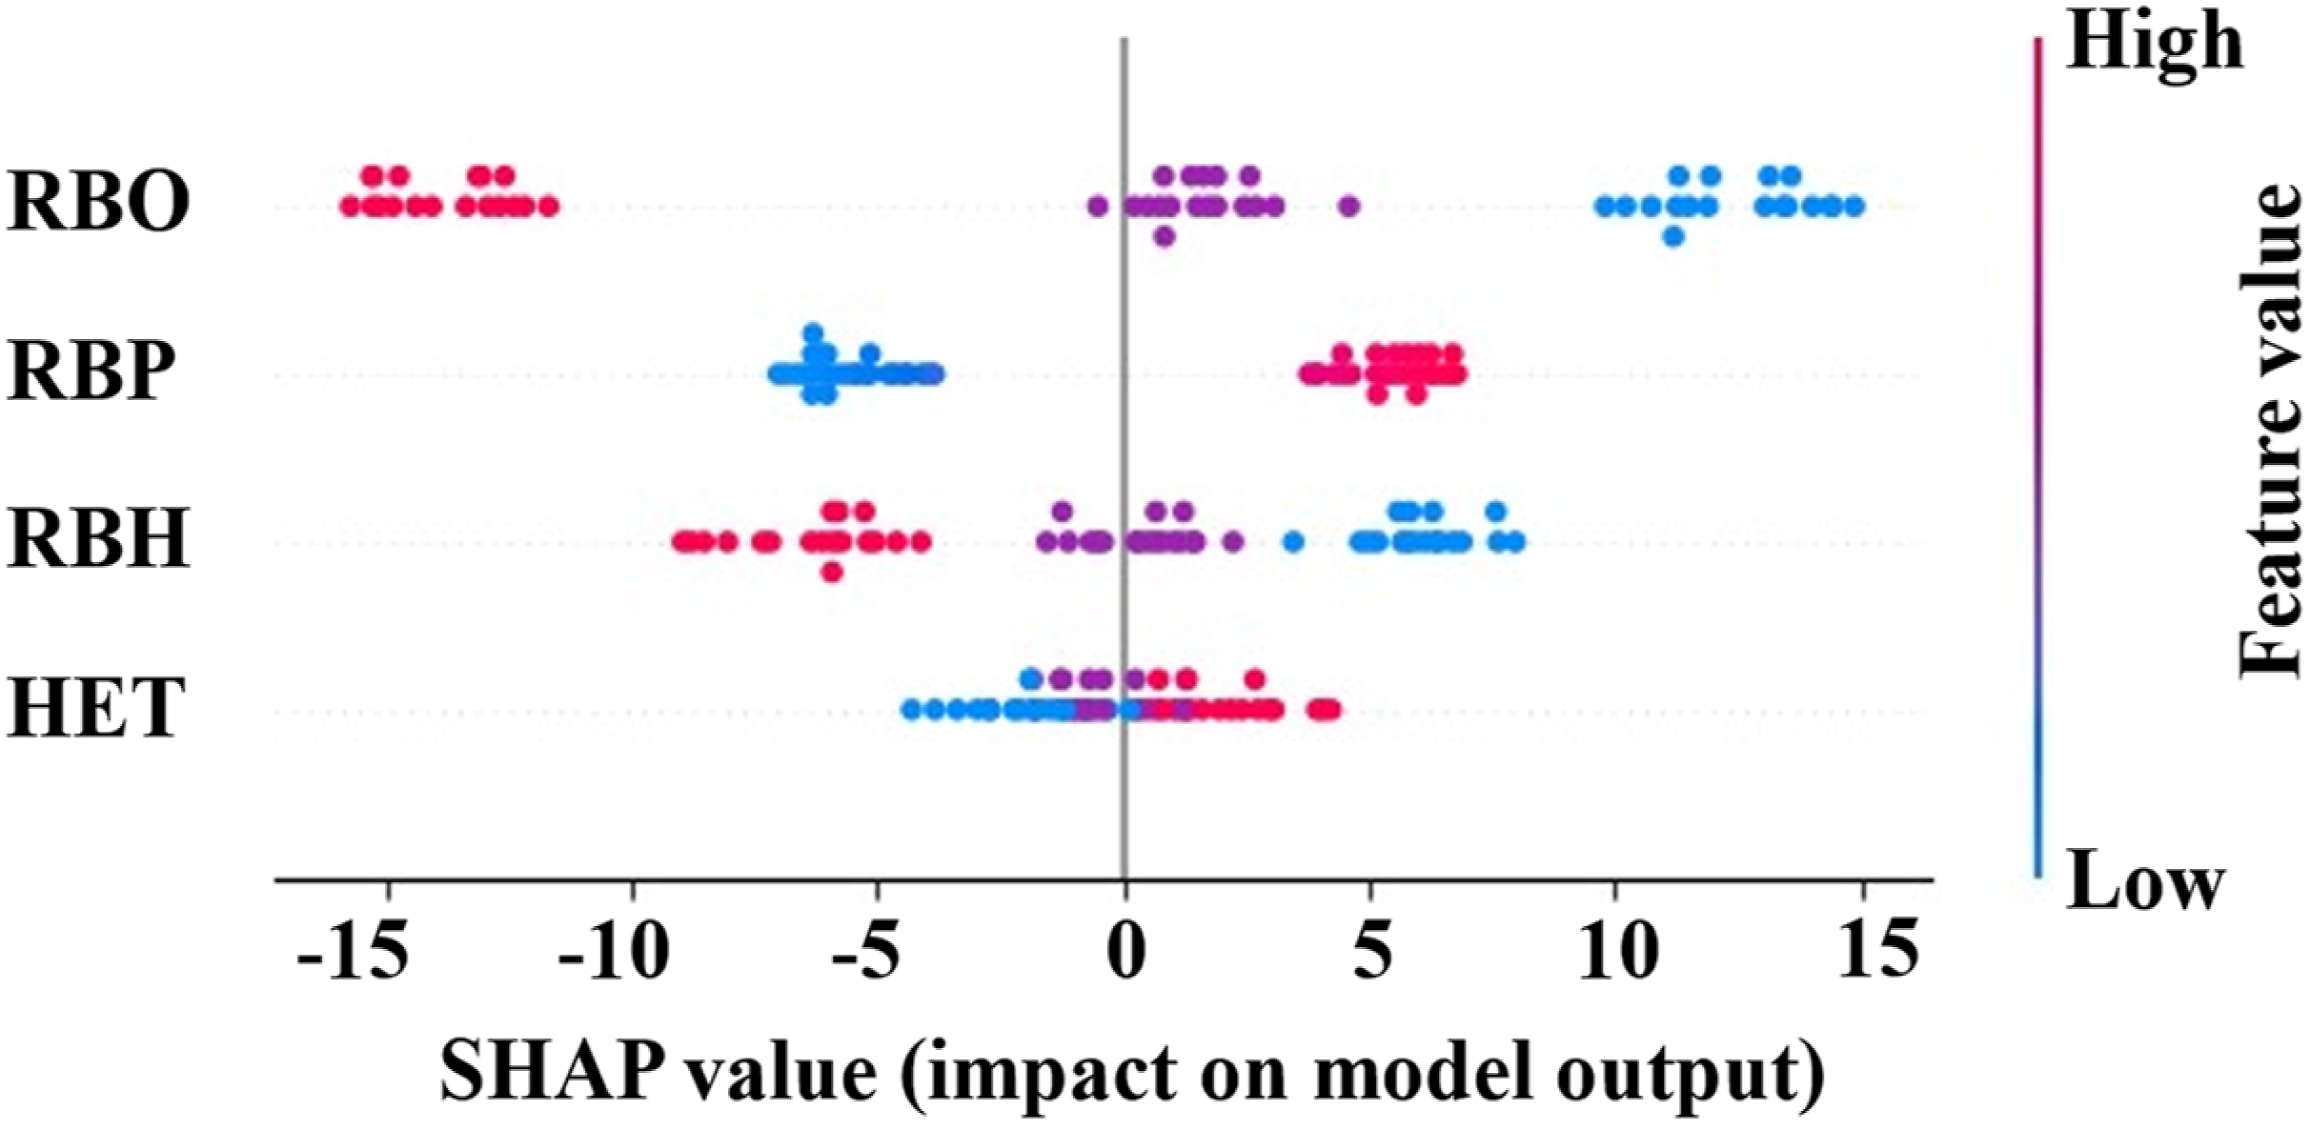
These trends are quantitatively reinforced by the drop-column SHAP feature-importance plot (Figure 17), where removing RBO reduces the model’s R2 by 0.613, confirming it as the most critical factor in the predictive framework. RBP induces the second-largest performance drop (ΔR2 = 0.156), validating its structural influence on CS. RBH shows a moderate contribution (ΔR2 = 0.113), whereas HET presents a small negative ΔR2, indicating that the model already captures temperature effects indirectly through other features. This hierarchy aligns strongly with the Taguchi-ANOVA analysis and experimental observations, providing consistent evidence of feature dominance. Drop-column feature-importance plot indicating the reduction in model performance (ΔR2) when individual PPP are removed.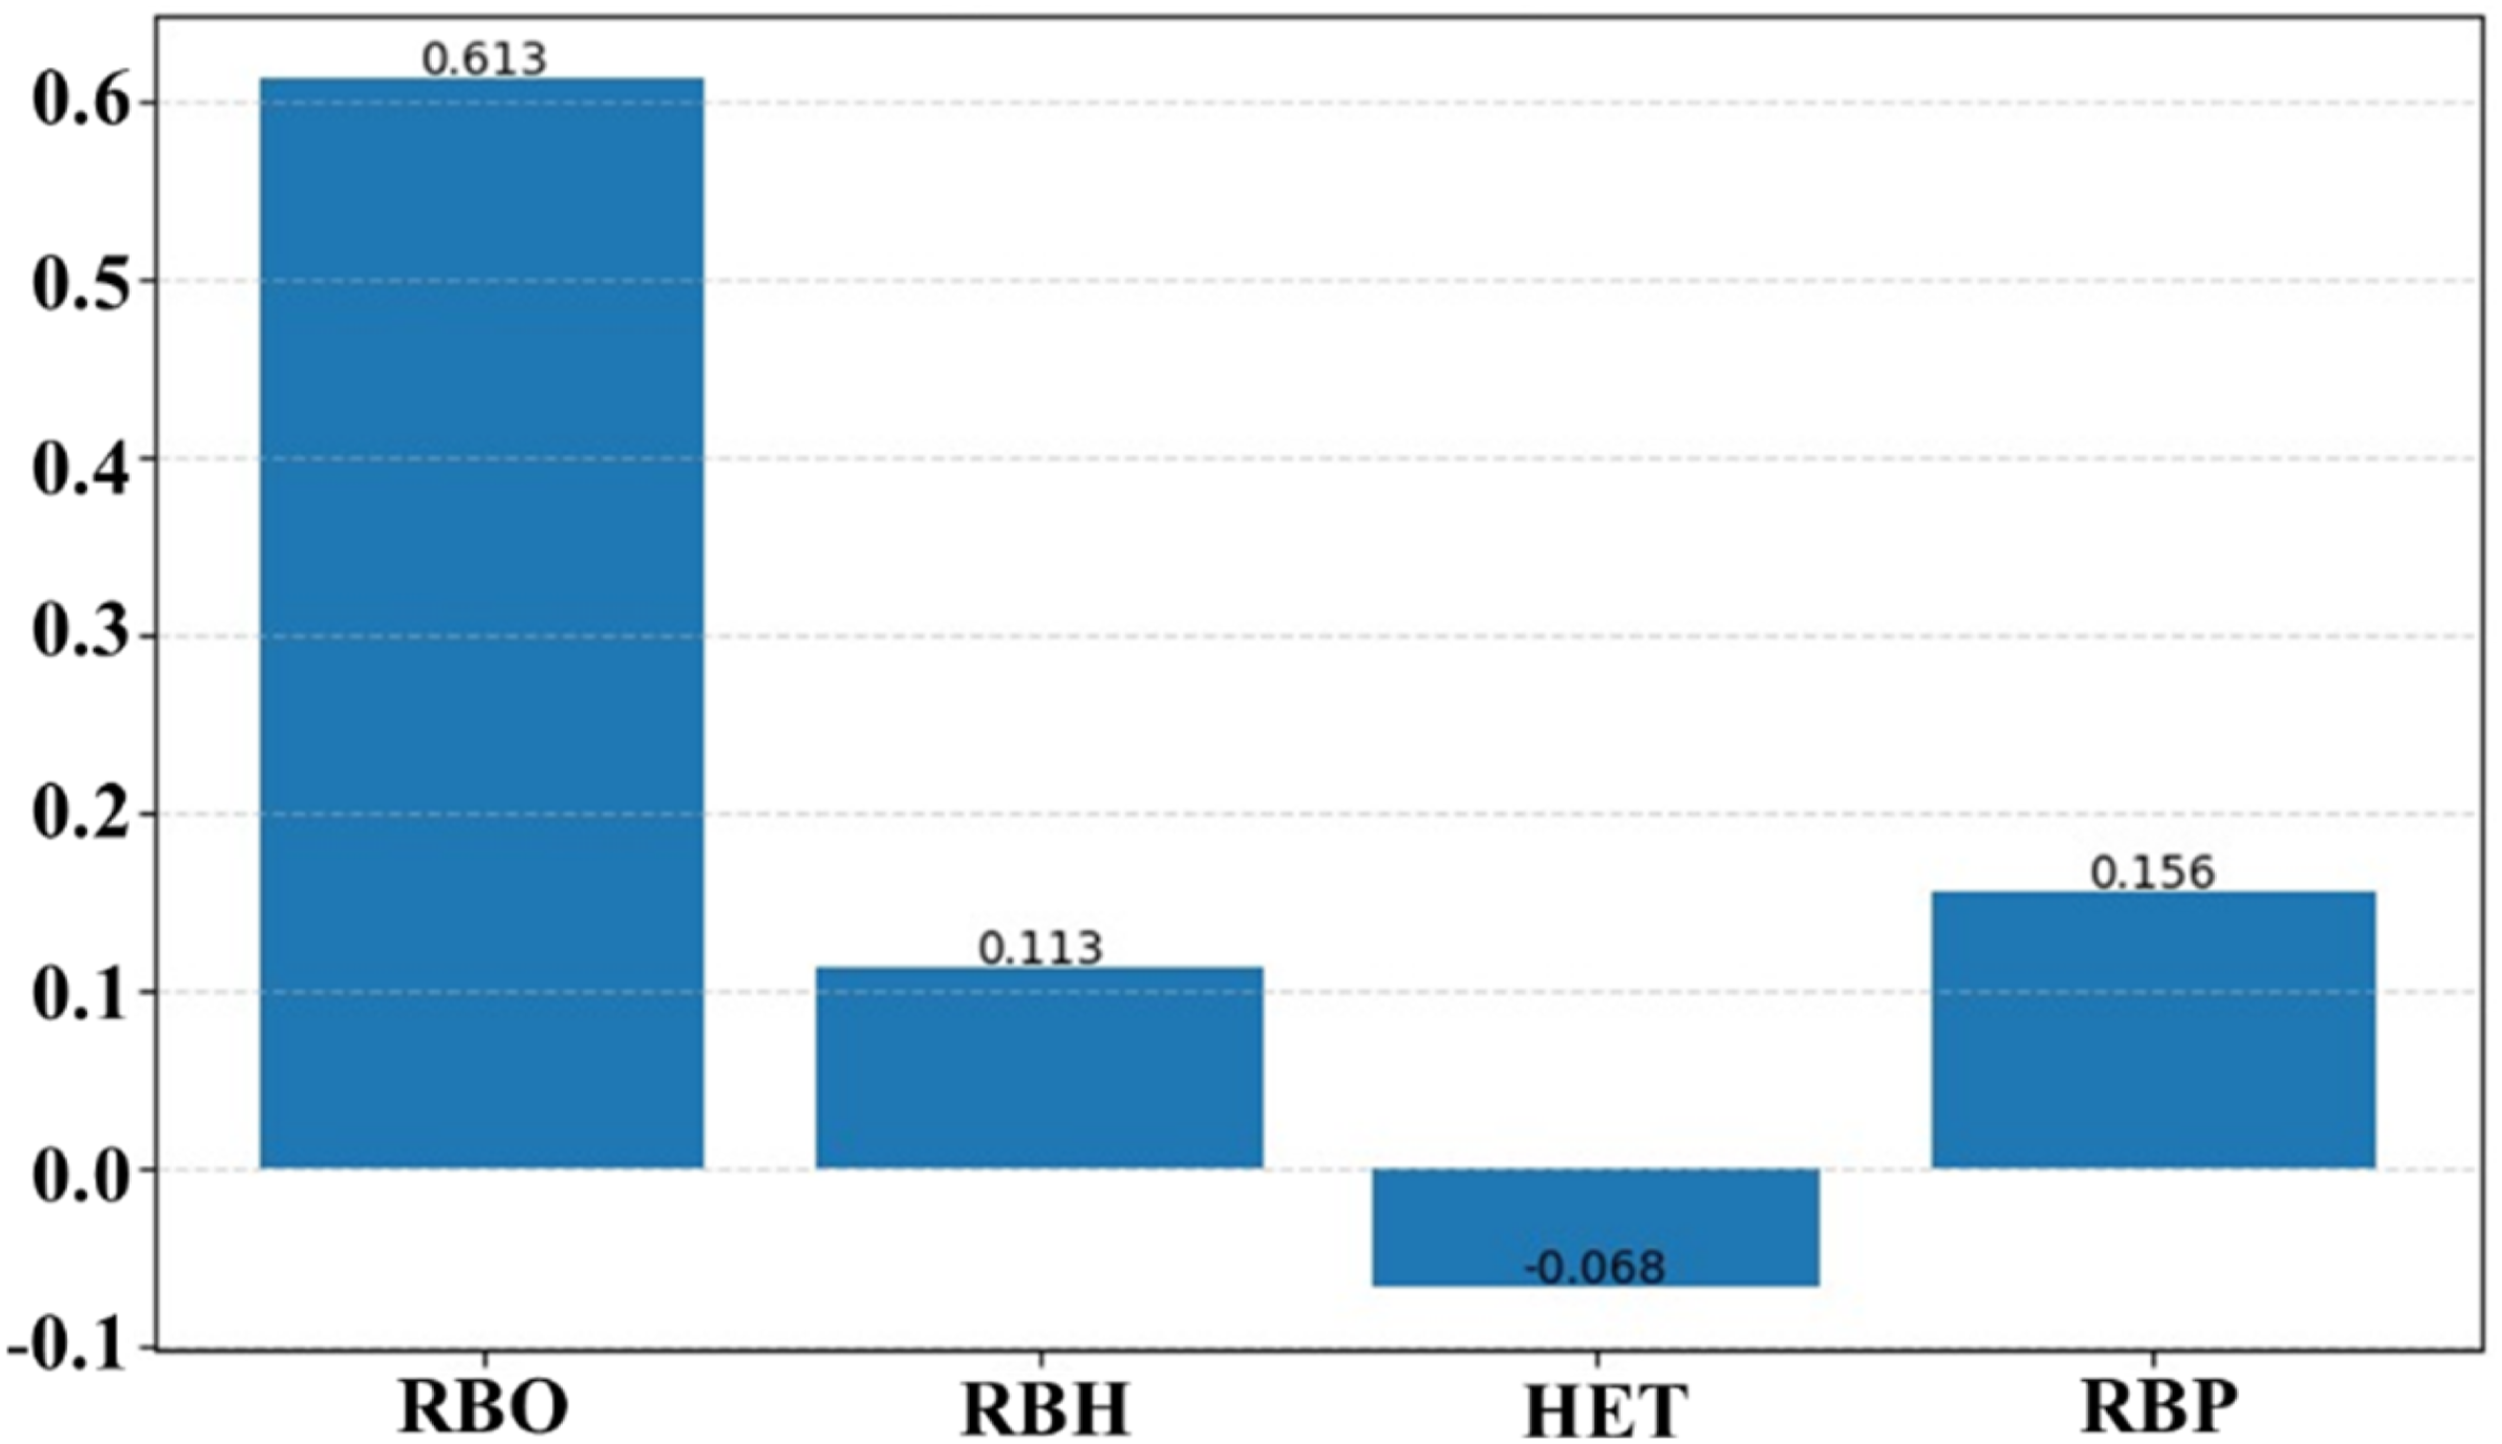
The SHAP force plot as shown in Figure 18 provides an instance-level interpretation, illustrating how each feature shifts the prediction from the global baseline value (87.79 MPa) to the final predicted CS (96.05 MPa). The positive contribution of RBO (+10.89 MPa) and RBP (+6.35 MPa) confirms their strengthening influence for the selected configuration, whereas RBH (−8.67 MPa) generates a strong negative pull, consistent with its detrimental effect on interlayer adhesion. HET contributes minimally (−0.31 MPa), again highlighting its comparatively lower impact relative to geometric and orientation-based factors. This plot visually demonstrates the additive interaction of features and the cumulative pathway that leads to the final model output. SHAP force plot illustrating how each parameter pushes the model prediction from the baseline value toward the final CS prediction for the selected sample.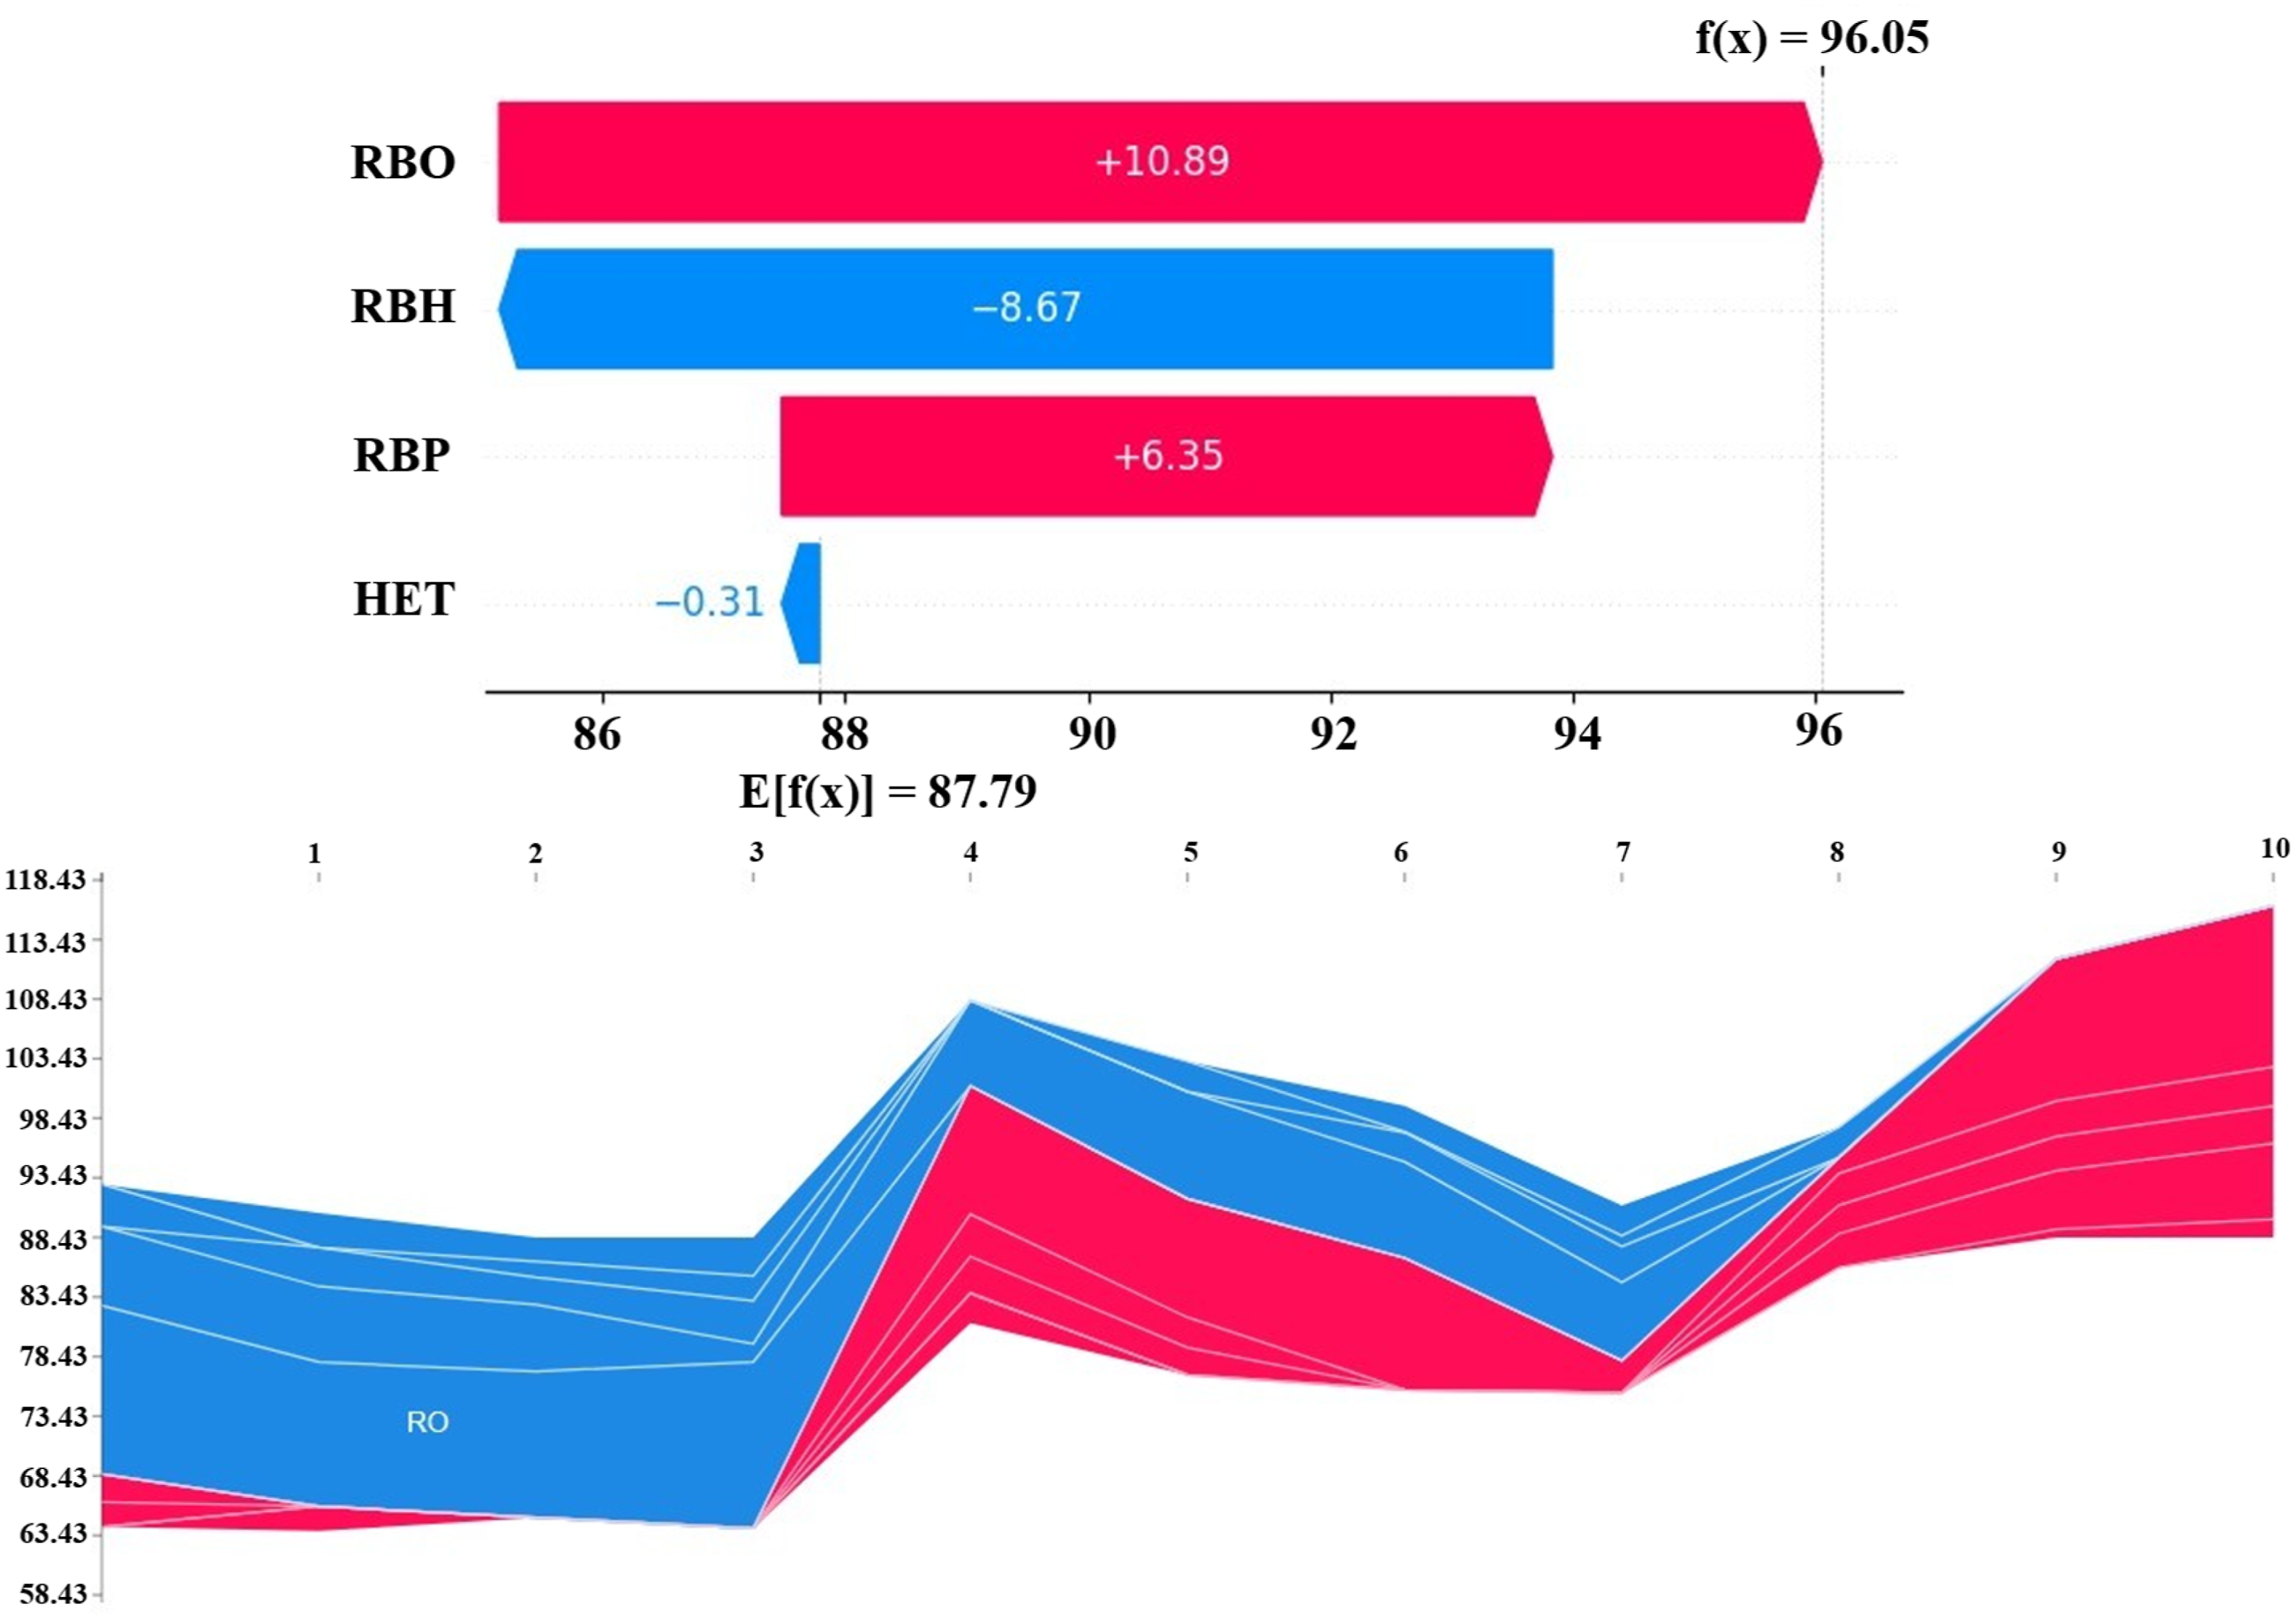
Finally, the SHAP decision plot (Figure 19) illustrates how predictions evolve cumulatively across all samples as each feature is considered. A pronounced divergence is observed at the RBO step, where individual prediction trajectories fan out widely, reflecting its overwhelming influence on prediction variability. Subsequent divergence at the RBH stage indicates its consistent weakening effect across specimens. Positive shifts at the RBP stage correspond to the structural benefits of the honeycomb RBP. The temperature step exhibits minimal spread, corroborating the earlier finding that HET introduces only modest variation in the model’s prediction. The convergence of trajectories near the final prediction highlights the model’s stability and consistent internal logic. SHAP decision plot depicting the cumulative contribution of each parameter to prediction trajectories across all samples.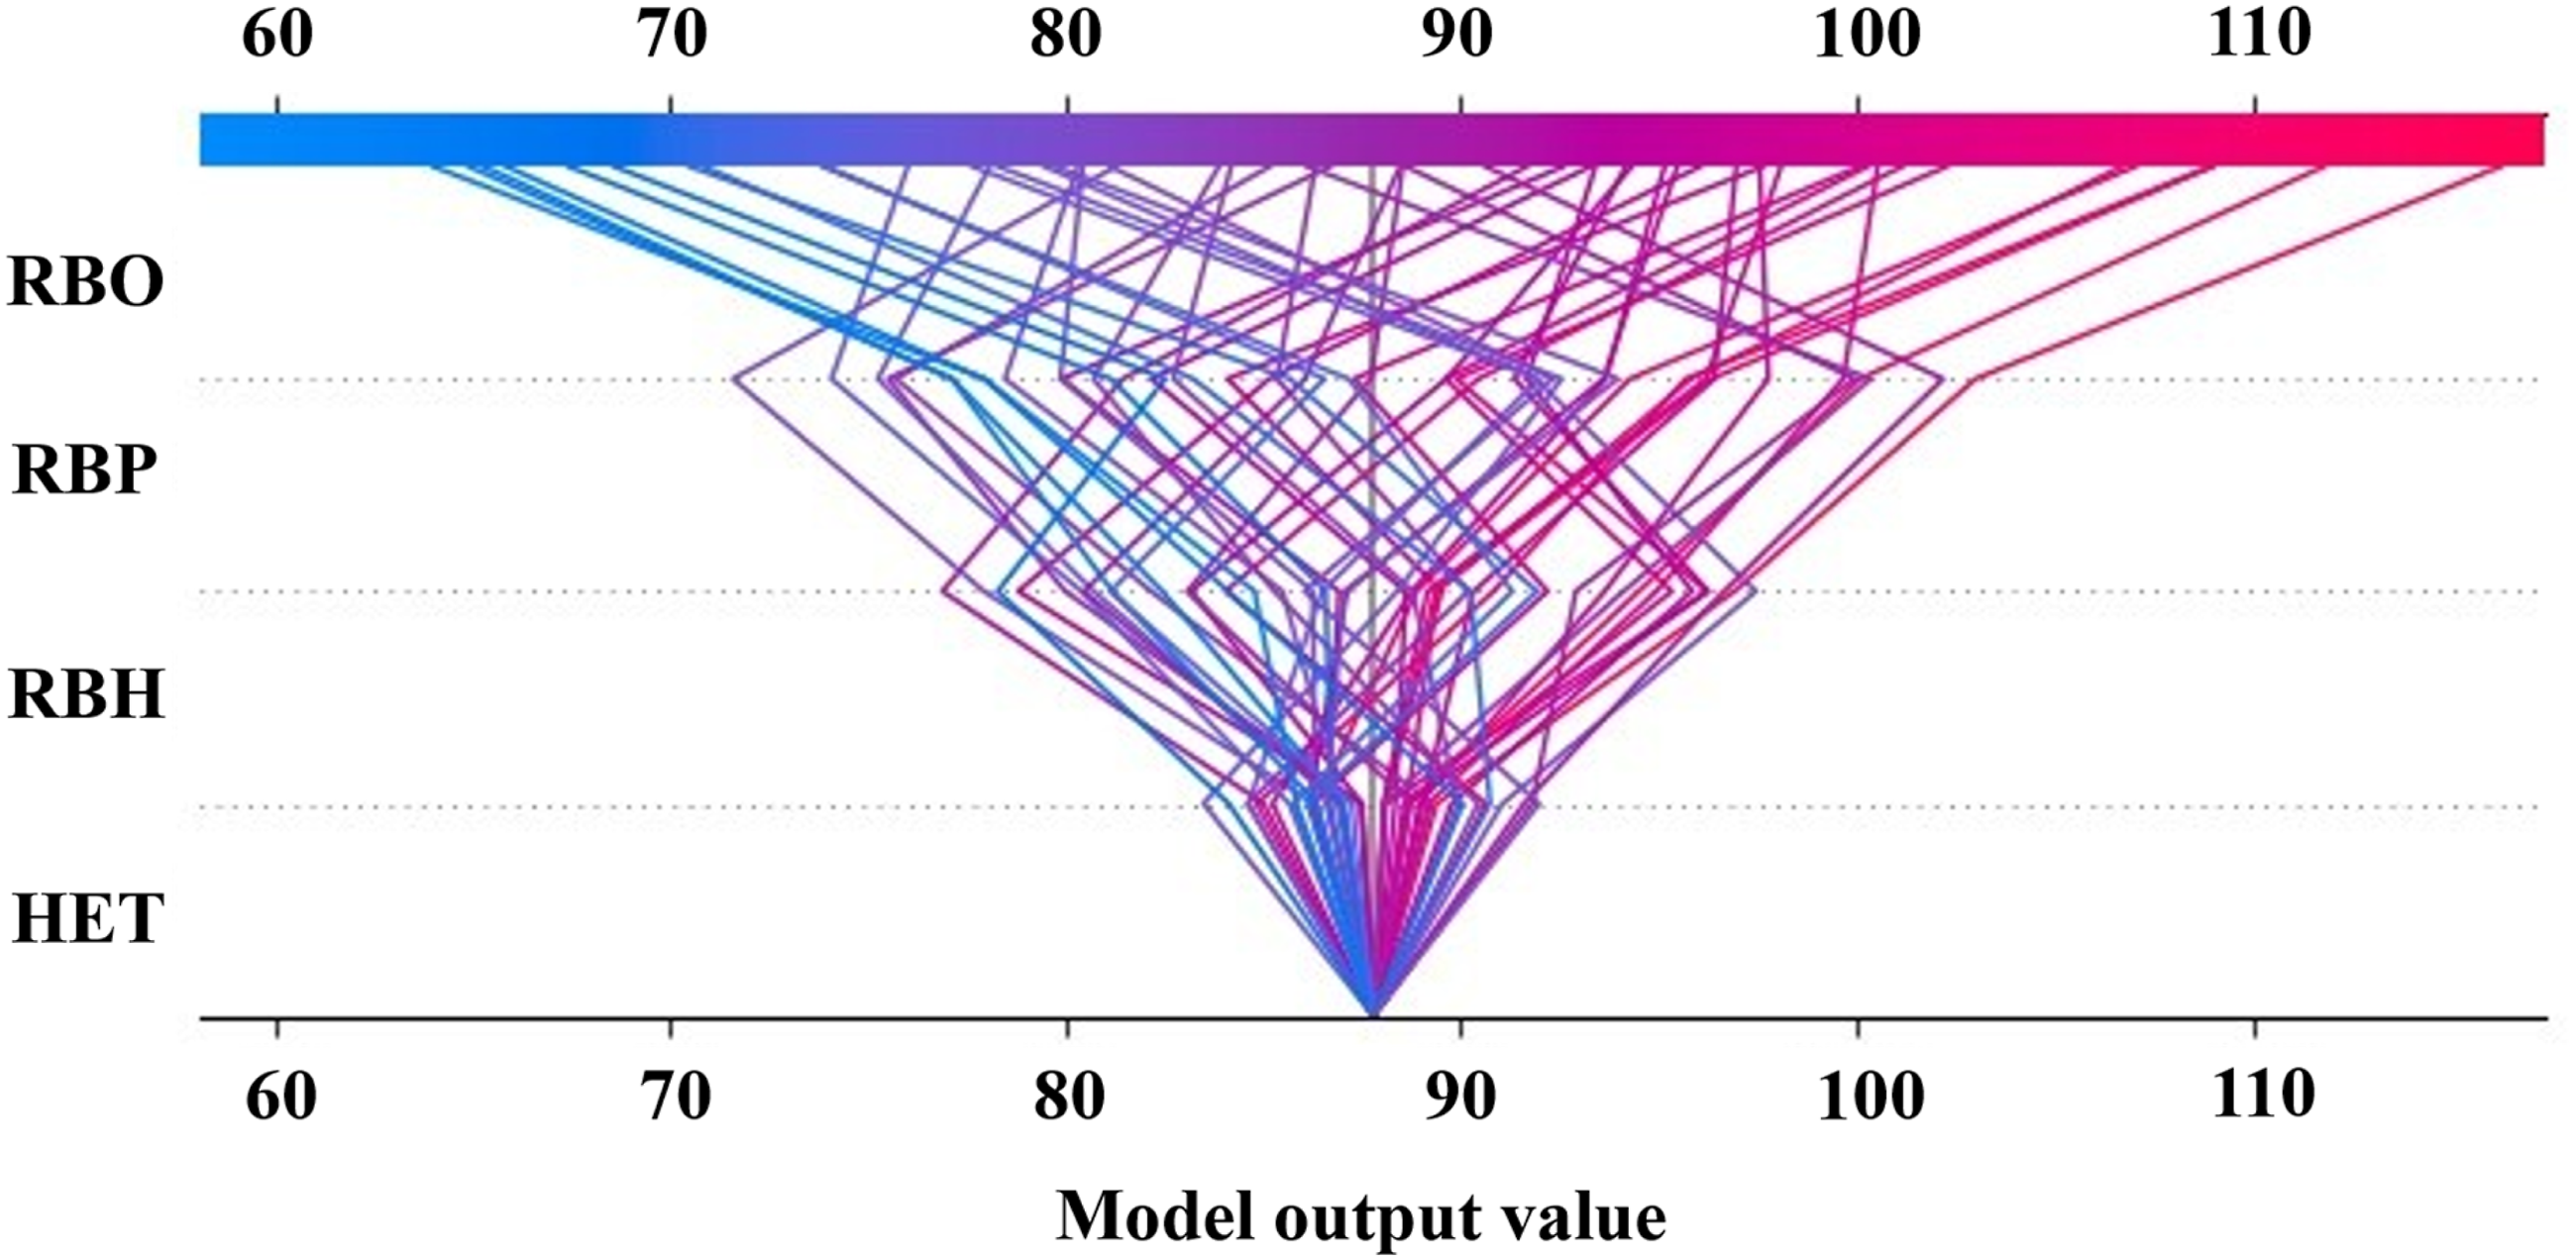
Taken together, the SHAP summary, drop-column importance, force, and decision plot demonstrate perfect alignment with the physical behaviour of FFF-fabricated PLA–MWCNT composites. The analyses confirm that orientation-driven anisotropy is the primary driver of CS, followed by RBP effects and interlayer bonding efficiency governed by RBH, with HET exerting a secondary influence. The strong agreement between SHAP-based interpretability, ANOVA results, and experimental trends validates the reliability of the ML framework and verifies that the model accurately captures the process–structure–property relationships responsible for compressive behaviour in additively manufactured nanocomposites.
Conclusions
This study established an integrated experimental–statistical–ML framework to investigate the compressive behaviour of FFF-printed PLA–MWCNT nanocomposites. A full-factorial experimental design comprising 54 parameter combinations systematically evaluated the influence of RBO, RBH, HET, and RBP on compressive performance. Among the investigated parameters, RBO exhibited the highest contribution toward CS (55.63%), followed by RBP (15.54%) and RBH (13.49%), while HET remained statistically significant with comparatively lower influence.
The highest CS of 121.89 MPa was achieved at 225°C HET, 0° RBO, 0.10 mm RBH, and honeycomb RBP, whereas the lowest CS of 60.88 MPa was observed at 90° RBO, 0.15 mm RBH, 225°C HET, and gyroid RBP. Optimized parameter combinations yielded CS approaching 121–125 MPa, significantly higher than non-optimized conditions (∼70–80 MPa). The superior compressive behaviour at 0° RBO and lower RBH was attributed to improved interlayer load transfer and reduced interface-dominated failure. Honeycomb RBP demonstrated enhanced compressive stability relative to gyroid structures due to improved load-transfer continuity and resistance to localized structural collapse.
Failure morphology analysis revealed severe raster delamination and interface-dominated failure under weak parameter combinations, whereas optimized conditions exhibited comparatively stable and uniform crushing behaviour. These observations confirmed the strong dependence of compressive response on orientation-induced anisotropy, interlayer bonding quality, and internal raster architecture.
Comparative SEM, DSC, TGA, and FTIR characterization of neat PLA and PLA–MWCNT composites demonstrated that MWCNT incorporation modified the thermal-transition and physicochemical behaviour of the PLA matrix. SEM analysis revealed relatively distributed MWCNT-rich regions without severe large-scale agglomeration. DSC analysis indicated modified crystallization behaviour after MWCNT incorporation, while TGA demonstrated improved thermal stability with an increase in onset Td from 320°C to 338.03°C. FTIR analysis confirmed that the primary chemical structure of PLA remained largely unchanged after composite fabrication.
Taguchi–SNRA and ANOVA analyses consistently identified RBO as the dominant process parameter governing compressive behavior, while RSM successfully captured the primary nonlinear parameter–response relationships within the investigated experimental domain. Among the developed ML models, RFR achieved the highest prediction accuracy with R2 = 0.9686, RMSE = 2.59 MPa, and MAE = 2.05 MPa, outperforming the regression-based statistical models. SHAP analysis further identified RBO as the most influential feature governing compressive behaviour and established strong agreement between ML interpretability and experimentally observed failure mechanisms. Overall, the present study provides an interpretable process–structure–property framework for compressive-performance optimization of FFF-printed PLA–MWCNT nanocomposites within the investigated material composition and process-parameter range.
Limitations and future scope
• The present study evaluates only the compressive behaviour of PLA–MWCNT composites. Future work should include tensile, flexural, fatigue, creep, and impact performance for a comprehensive mechanical profile. • A single reinforcement loading of 10 wt% MWCNT was used. Exploring a broader range (1–10 wt%) or hybrid reinforcements (MWCNT + graphene, CF + MWCNT) may uncover synergistic behaviours and improved multifunctionality. • A neat PLA baseline was not included in the present study for mechanical characterization, which limits direct quantification of the reinforcement effect of MWCNTs. Future investigations will include comparative studies with neat PLA to establish a broader material-performance relationship. • All testing was performed under ambient conditions, without evaluating environmental factors such as humidity, thermal cycling, and long-term aging, which are crucial for real-world reliability. • The study used in-house fabricated filaments; variations across commercial filament suppliers were not assessed. Broader validation would improve industrial applicability.
Footnotes
Declaration of conflicting interests
The authors declared no potential conflicts of interest with respect to the research, authorship, and/or publication of this article.
Funding
The authors received no financial support for the research, authorship, and/or publication of this article.