
Abstract
Knowledge is Power Program Delta College Preparatory School (KIPP DCPS), an open-enrollment charter school,1 opened in 2002 in Helena, Arkansas. KIPP DCPS students have consistently outperformed their peers from neighboring districts on year-end student achievement scores, and KIPP’s national reputation led Arkansas lawmakers to exempt KIPP from the state’s charter school cap. Yet, skeptics of KIPP in particular, and charter schools in general, voiced a concern that the apparent KIPP advantage in student achievement may have been due to the prior academic ability of the students who selected into KIPP rather than to the KIPP school itself. Furthermore, some KIPP critics have argued that student attrition at KIPP schools accounts for the apparent KIPP advantage. Until now, no prior study has rigorously compared performance of KIPP students with traditional public school peers on matched observable academic and demographic variables or carefully considered student attrition rates at KIPP DCPS. Here, we begin by summarizing prior evaluations of KIPP schools nationally. Next, we carefully examine student attrition from 2005 through 2011, and we find that KIPP DCPS attrition resembles that found in nearby traditional public schools. Finally, using regression models that control demographic and prior academic indicators, we find that KIPP DCPS students gain significantly more each year on standardized assessments than do their matched peers. These results are important as nearly all prior empirical work on KIPP schools has been conducted in urban settings. Despite the fact that many rural students struggle academically or attend struggling schools, we know relatively little about the potential benefits of No Excuses charter schools in rural areas, such as KIPP DCPS.
Introduction
Knowledge is Power Program Delta College Preparatory School (KIPP DCPS), an open-enrollment charter school, opened in 2002 in Helena, Arkansas. KIPP DCPS students have consistently outperformed their peers in the Helena/West Helena School district; moreover, White and minority students achieve at the same levels, essentially eliminating the achievement gap elsewhere in the state. In part for this reason, when Arkansas lawmakers instituted a cap on the number of open-enrollment charter schools, they exempted KIPP. Today, there are two KIPP schools in Arkansas, KIPP Delta Collegiate Preparatory in Helena, Arkansas, (which serves Grades K-12 as of the 2012-2013 academic year) and KIPP Blytheville Collegiate Preparatory School (KIPP BCPS), another rural KIPP school located in Blytheville, Arkansas (which will serve Grades 5-8 in the 2013-2014 academic year).
Nationally, the KIPP network has won considerable acclaim, with journalists (most notably Mathews, 2009) and qualitative research (Maranto & Shuls, 2011; Thernstrom & Thernstrom, 2003) indicating that disadvantaged students make substantial progress because KIPP builds an academic culture and provides more time to learn. Yet academic performance at KIPP has also been subject to scrutiny (see critical blogs hosted by Jim Horn [www.schoolsmatter.info], Diane Ravitch [www.dianeravitch.net], and a National Education Policy Center study [Miron, Urschel, & Saxton, 2011] for a review). General arguments against the model by the above authors suggest that the high performance at KIPP schools is due to “creaming,” that is, enrolling only the high performing students from traditional public schools (TPS). Attrition of students is another concern, which may buttress the creaming argument if only the brightest or most motivated of the KIPP students remain enrolled. Finally, opponents blame KIPP (and charter schools in general) for taking revenues from the TPS. When a student exits a TPS, their per-pupil expenditure amount follows that student to KIPP.
Despite KIPP’s reputation, no evaluation has used an “apples to apples” comparison of Arkansas KIPP students who have been matched to TPS peers on observable academic and demographic variables present prior to the KIPP student’s eventual enrollment at the charter school. This study will fill the void, evaluating KIPP by addressing the following questions:
Literature Review
KIPP critics point to the premature departure of KIPP students benefiting the aggregate academic performance of the students who remain in KIPP (Miron et al., 2011). This attrition occurs when students leave the charter school before graduating and re-enroll in another school (i.e., traditional public, private school, homeschool, etc.). Critics such as Miron, Urschel & Saxton (2011) claim that such attrition results in selective admission at KIPP as well as “cream-skimming,” that is, only enrolling a school full of the highest performing students culled from the surrounding schools. However, Miron et al. compare attrition and academic performance at individual KIPP campuses with entire school districts. The school campus seems a more appropriate unit of analysis, and campus level studies find that KIPP attrition rates resemble those of the surrounding TPS (Angrist, Dynarski, Kane, Pathak, & Walters, 2010; Mac Iver & Farley-Ripple, 2007; Nichols-Barrer, Gill, Gleason, & Tuttle, 2012; Tuttle, Teh, Nichols-Barrer, Gill, & Gleason, 2011; Woodworth, David, Guha, Wang, & Lopez-Torkos, 2008).
To highlight previous studies on KIPP student performance, a systematic review of the literature examining KIPP student academic performance as compared with their TPS peers was conducted. This systematic review returned seven studies that used either a randomized control trial (RCT) or quasi-experimental design (QED) and included a comparison group of students in the TPS sector. 2 One of the primary goals of this review was to identify high-quality research specifically aimed at evaluating the academic impact of attending a KIPP charter school. One of the key criteria in this review process was to only include research that included an evaluation component, where the exact impact of attending a KIPP school on student achievement could be directly quantified or measured relative to a comparable alternative standard or counterfactual. This guideline was established to ensure that the research used for this review included actual evaluations of KIPP student achievement, rather than opinions for or against attendance at KIPP schools or simply discussions about various aspects of the use of KIPP schools as an agent of school choice.
Application of Selection Criteria
After developing the search criteria, the next step in the review was to apply these criteria to a number of different search options to identify as much high-quality KIPP student achievement literature as possible. For the purposes of this review, we used the following search engines and alternative search options:
University of Arkansas Library Resources: Ebsco Academic Search ProQuest Research Library Education Resources Information Center (ERIC)
Hand searches of academic journals (2001-2011): Journal of Policy Analysis and Management (JPAM) Education Finance and Policy (EFP) Educational Evaluation and Policy Analysis (EEPA)
Google Scholar (for non-journal “gray literature” and policy reports)
Hand searches of published, non-journal research (2001-2011): National Bureau of Economic Research (NBER) Mathematica Policy Research
Henig (2008) review references
KIPP website of Independent Reports (http://www.kipp.org/results/independent-reports)
The primary means by which research was identified was through searches of electronic databases through the University of Arkansas library, specifically Ebsco Academic Search, ProQuest Research Library, ERIC, and the Google Scholar electronic search engine for non-journal “gray literature” studies and policy reports. In these databases, the following search terms were used in combination to maximize the identification of relevant KIPP-related journal articles: “KIPP” OR “Knowledge is Power Program” AND “evaluat*” OR “effect*” OR “impact” AND “school” and NOT “Kipp” with the search field set to “Author.” The search terms with asterisks (“effect*” and “evaluat*”) were included to identify articles in which effectiveness was measured and/or evaluations were conducted. These search parameters resulted in the initial identification of a total of 3,468 journal articles. 3
To ensure that relevant articles on KIPP were not overlooked in our initial searches of the aforementioned databases, we also conducted title reviews of every article from the previous 12 years from four prominent education and economics journals, specifically the JPAM, EFP, EEPA, and the Review of Education Research (RER). During this hand review process, the goal was to identify any article pertaining to KIPP whatsoever for initial inclusion in this review. In total, 48 articles were initially identified for inclusion in this literature review. 4
We also conducted hand searches of articles from the past 12 years from various education policy research organizations and think-tanks. Organizations included in this search process were the NBER, the National Center on Performance Incentives (NCPI), the Rand Corporation, Mathematica Policy Research, and the Manpower Demonstration Research Corporation (MDRC); all relevant organizations were identified through discussions with researchers with significant experience researching the KIPP charter school network. The purpose of these searches was to identify research on KIPP that had not been published in an academic journal, which may not have been located in the two previous search processes. These hand reviews resulted in the initial retention of an additional 23 articles on KIPP. 5
For each of the four search options, our review process started with numerous studies. A series of steps was used to filter out research that did not meet the aforementioned selection criteria or was a duplicate of an article that had already been identified. In our search of electronic academic databases, all of the studies identified based on our search terms were initially retained. With these articles, as well as with the studies identified in the hand reviews of academic journals and non-journal research, we then reviewed the titles of all of the different articles; if an article appeared to address the topic of KIPP charter schools, it was retained for further review. After this title review, all retained articles then went through a review of the abstract and then a final review of the entire article if the review of the abstract showed that the article still fit all of the selection criteria. In the article review, we primarily focused on the methodology used by the authors of each study, to ensure that retained articles were focused on an evaluation of the impact of KIPP charter school attendance on student achievement, while also adhering to the inclusion criteria of this review.
In sum, there were a total of 3,491 KIPP-related articles that were initially identified in this review (3,468 from electronic academic databases, and 23 from the hand review of academic journals and non-journal research). After the title and abstract review, that number was reduced to 21 articles that met all inclusion criteria and were not duplicates of other articles; from those 21 articles, 14 more were removed after we completed a full article review, primarily because these articles were not evaluations of the impacts of student achievement—or they used a research design that was not conducive to the above selection criteria. An example of one such article that was removed from the systematic review results was a meta-analysis of charter school performance literature by Betts and Tang (2011); while the authors included a separate section on KIPP charter school effects, there was no information presented on the comparison groups used in the KIPP studies included in their review; thus, inclusion of this article did not fit with the criteria that guided this literature review. Furthermore, the information in this article was more conducive for the general literature review of this document. As such, the information was still relevant—and utilized—however, not for the purposes of the systematic review.
The results of the seven studies from our systematic review suggest that KIPP students outperform their TPS peers academically. All seven studies found positive results in favor of KIPP suggesting that attendance at a KIPP charter school is associated with higher scores on reading and math tests. (See Table 1.)
Summary of KIPP Articles Focused on Academic Impacts.
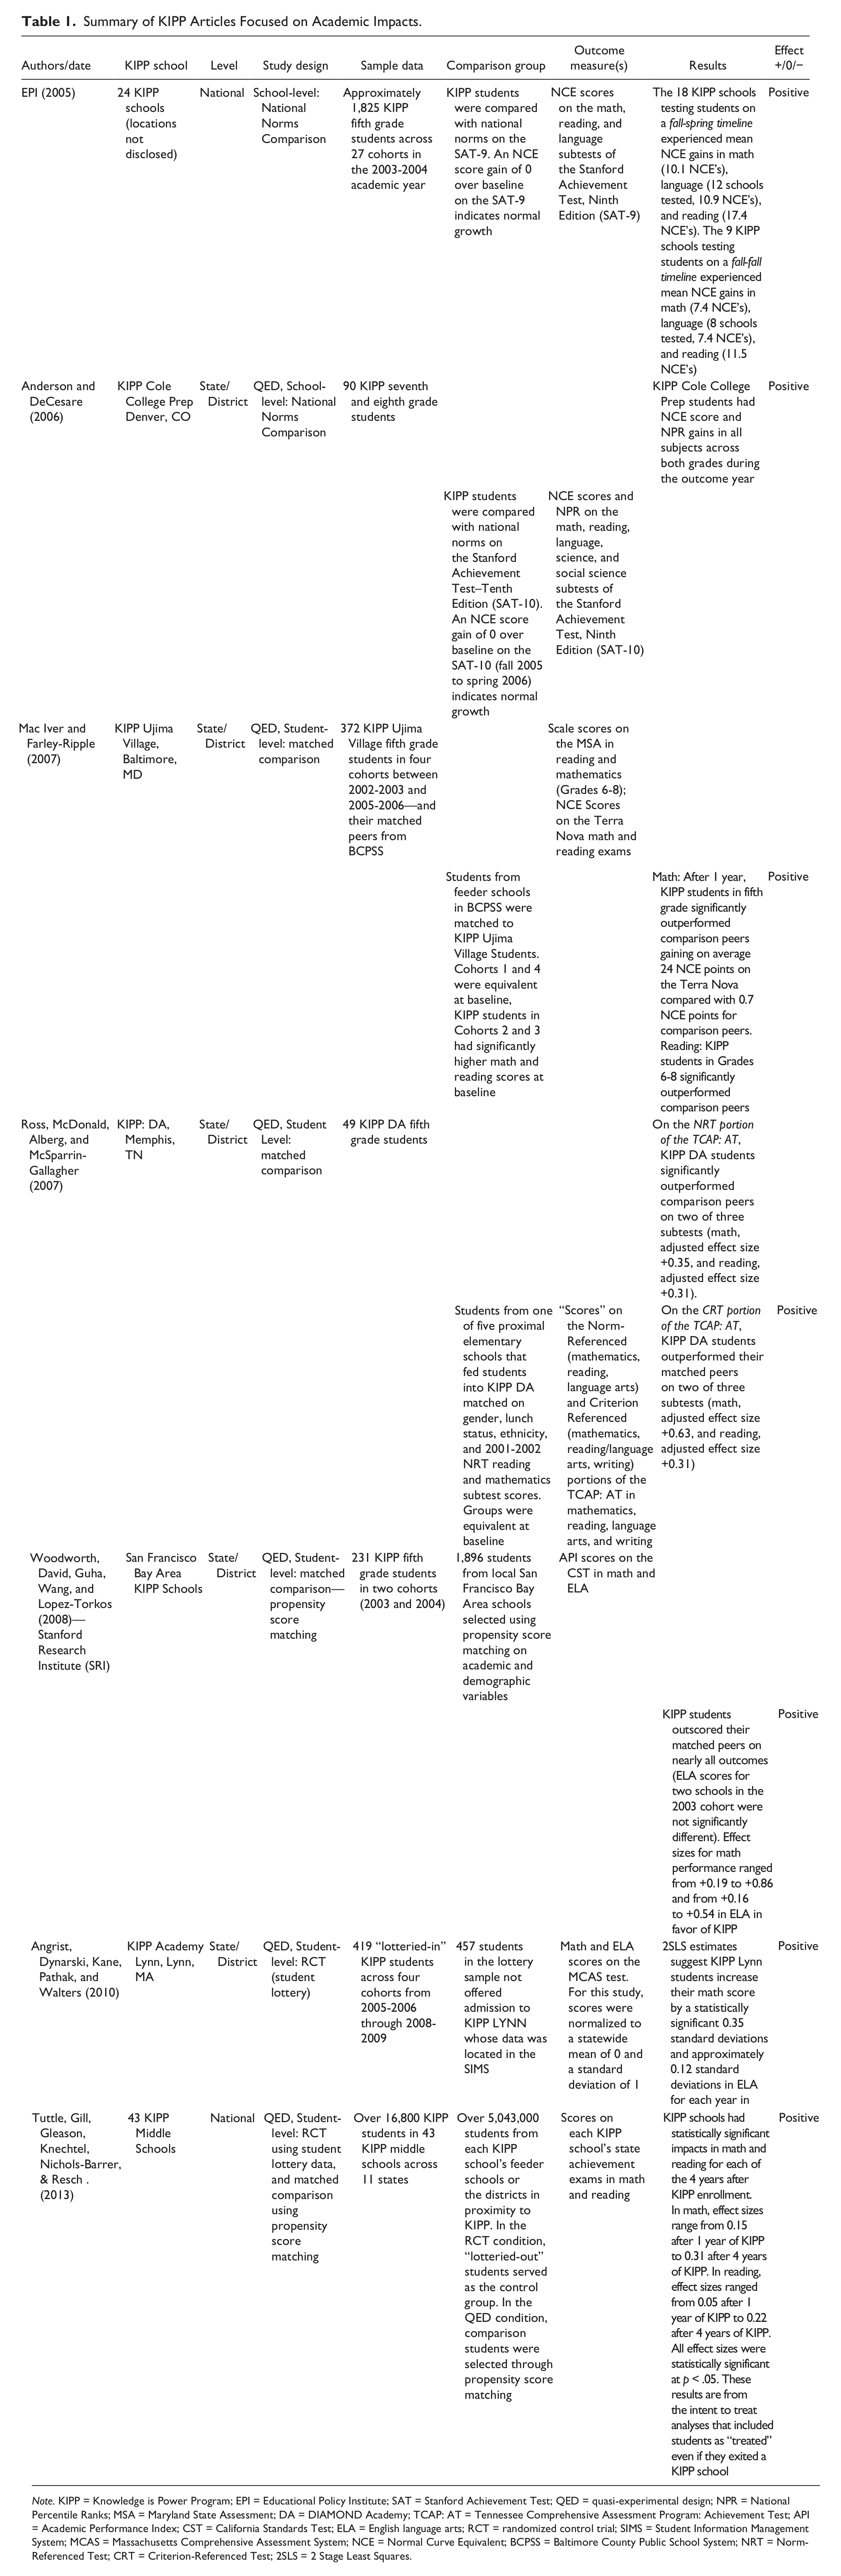
Note. KIPP = Knowledge is Power Program; EPI = Educational Policy Institute; SAT = Stanford Achievement Test; QED = quasi-experimental design; NPR = National Percentile Ranks; MSA = Maryland State Assessment; DA = DIAMOND Academy; TCAP: AT = Tennessee Comprehensive Assessment Program: Achievement Test; API = Academic Performance Index; CST = California Standards Test; ELA = English language arts; RCT = randomized control trial; SIMS = Student Information Management System; MCAS = Massachusetts Comprehensive Assessment System; NCE = Normal Curve Equivalent; BCPSS = Baltimore County Public School System; NRT = Norm-Referenced Test; CRT = Criterion-Referenced Test; 2SLS = 2 Stage Least Squares.
Summary of Literature Review
The seven studies included in the above review represent analyses at three different levels (district, state, and national). Two of the studies reviewed (Angrist et al., 2010, Tuttle, Gill, Gleason, Knechtel, Nichols-Barrier, & Resch, 2013) used the “gold standard” randomized lottery design. Six studies retained in this review used a QED involving either a matched comparison group or compared KIPP performance to national norms. 6 For example, two of the studies (Mac Iver & Farley-Ripple, 2007; Ross, McDonald, Alberg, & McSparrin-Gallagher, 2007) used a student-level matched comparison design, two studies (Tuttle, Teh, Nichols-Barrer, Gill, & Gleason, 2011; Woodworth et al., 2008) also used a student-level design, but the comparison group was selected using propensity score matching. Finally, two studies (Anderson & DeCesare, 2006; Educational Policy Institute [EPI], 2005) compared KIPP student performance with national norms.
In sum, the existing portfolio of empirical studies suggests that attending a KIPP school has generally positive impacts on student achievement. Seven studies using an experimental design or QED were reviewed indicating that there is little evidence to suggest negative academic impacts on students attending a KIPP charter school. Likewise regarding attrition, when a strong design is used, attrition rates at KIPP do not seem to differ significantly from the traditional public feeder school attrition rates. The following study will add to the existing literature review not only by further examining the academic impact of KIPP charter school attendance on student academic achievement (in particular with the case of KIPP DCPS, we are examining the impact of a rural KIPP school) but also in demonstrating the effectiveness of using matched comparison groups to measure these impacts. A description of our methodology is detailed in the next section.
Method
Research Question 1: Attrition
To measure attrition, we considered any Grade 5 student who was enrolled at KIPP DCPS or a TPS but was not enrolled in the same school by Grade 8 as attrited. 7 Overall rates of attrition for each grade level for KIPP and all TPS feeder districts were then calculated. We also calculated an overall attrition rate from Grade 5 to Grade 8 and compare this attrition rate between the two sample conditions. Finally, attrition rates between grade levels are compared statistically using t tests to determine the magnitude of differences, if any, in the attrition rates.
Research Question 2: Achievement Impacts
We also set out to find how KIPP students performed on the ACTAAP as compared with a matched comparison group of students from neighboring districts. This TPS comparison group was comprised of students matched using a one-to-one convention, that is, each KIPP is matched to a student from one of the feeder school districts that KIPP students attended prior to enrolling in the charter school.
KIPP student achievement is analyzed in two ways. First, we analyze performance using an intent to treat (ITT) method which compares students who enter KIPP in Grade 5 at 2006-2007, 2007-2008, or 2008-2009 and continue to treat the students as “KIPP treatment” even if they transfer out of KIPP and return to the TPS. We then examine academic performance for first-time Grade 5 KIPP students who remained in KIPP through Grade 8. The purpose of this treatment on treated (TOT) analysis is to examine the impact of enrolling in KIPP on those who remain in KIPP throughout all of middle school. To analyze KIPP student performance on the Arkansas Benchmark Exam, we used multiple regression analyses to assess the extent to which enrollment in KIPP at Grade 5 impacts student achievement (relative to the performance of students in the TPS comparison peer group). In these regression analyses, we controlled for student achievement indicated by the pre-test scores computed by averaging performance from the students’ Grade 3 and Grade 4 test administrations, and demographic variables such as student free or reduced-priced lunch (FRL) status, race, and gender. 8
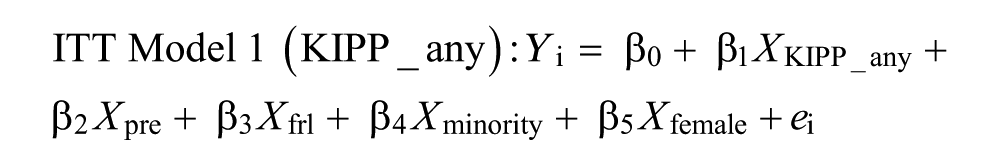
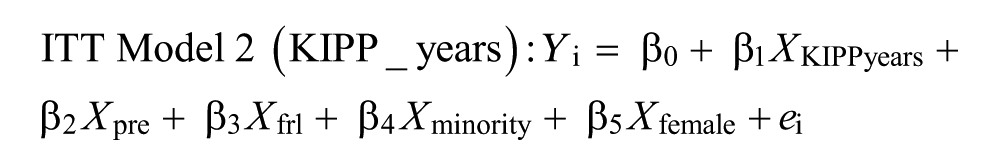
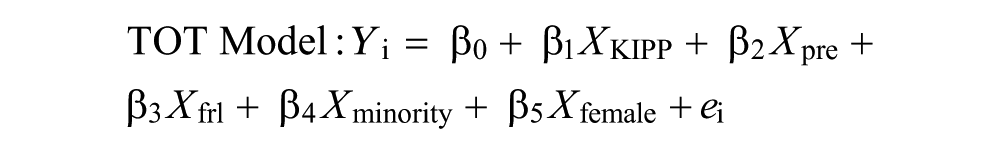
For these purposes then, the unstandardized equation for the regression models used in these analyses can be expressed in the following ways:
where
Yi is the Grade 8 test score (the z-score for the Arkansas Benchmark scaled score) for student i
β0 is the intercept
In ITT Model 1, β1 is the coefficient for predictor XKIPPyears, a binary variable indicating whether a student entered KIPP at fifth grade and remained in the school for at least 1 year between Grade 5 and Grade 8
In ITT Model 2, β1 is the coefficient for predictor XKIPPyears, a set of binary “dummy” variables indicating the number of years a student attended KIPP (if a student attended KIPP for 1 year, KIPP_1_year = 1, if a student attended KIPP for 2 years, KIPP_2_years = 1, and so on)
In the TOT Model: β1 is the coefficient for predictor XKIPP, a binary variable indicating whether a student was a KIPP or TPS comparison student (1 = KIPP, 0 = TPS comparison student)
β2 is the coefficient for predictor Xpre, a continuous variable representing the test z-score for student i from the Grade 5 test administration
β3 is the coefficient for predictor Xtest09, a continuous variable representing the test score for student i from the 2008-2009 school year
β4 is the coefficient for predictor Xfrl, a binary variable indicating whether a student was eligible for free or reduced lunch (1 = FRL eligible, 0 = non-FRL eligible)
β6 is the coefficient for predictor Xminority, a binary variable indicating a student’s ethnicity (1 = minority, African American, Asian, Native American, or Hispanic; 0 = non-minority, Caucasian)
β7 is the coefficient for predictor Xfemale, a binary variable indicating a student’s gender (1 = female, 0 = male)
ei is the residual for student i.
Results
Research Question 1: Attrition
Our first research question was “how many students who enter KIPP as first-time fifth grade students remain in KIPP through their eighth grade year, and to what extent do these attrition rates differ from the public feeder school districts students leave to enroll in KIPP?”
More students attrit from KIPP during the Grades 5 to 6 transition than any of the subsequent transition years. However, the attrition rate in the TPS feeder districts appears to be more stable across the transition years, but still with the fewest students exiting the TPS feeder districts at the Grades 7 to 8 transition period. Furthermore, we compared the differences between KIPP student attrition and TPS peer attrition using a two-tailed t test and found that there was only one transition period (Grades 5 to 6) where the KIPP student attrition rate (22%) was statistically significantly different than the TPS feeder districts (14%, p < .05). In fact, by the Grades 7 to 8 transition year, though not statistically significantly different, the TPS feeder district attrition rates are higher (12%) than KIPP (10%).
Finally, we compared the overall attrition rates between these three groups for Grades 5 through 8. Overall, the story matches that of the individual grade transition periods: KIPP student attrition rates are statistically significantly higher than their TPS peers; however, there are no observable differences in attrition rates between KIPP students and students in the aggregate TPS feeder districts. Next, we address the second research question examining academic achievement for KIPP students and their TPS peers. These comparisons are listed below in Figure 1.
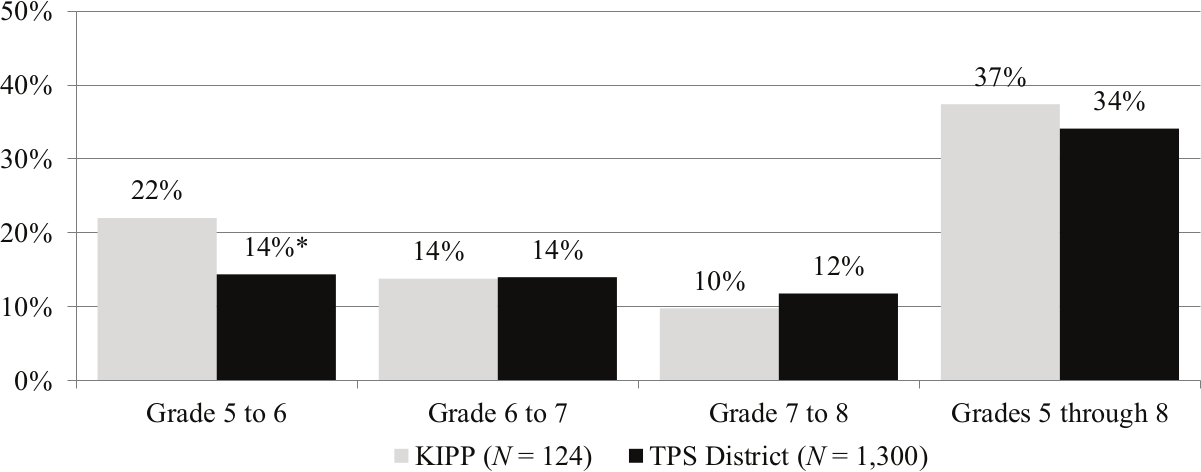
Attrition rate comparisons for KIPP and TPS feeder districts.
Research Question 2: Academic Impacts
Our second research question was “what impact does enrollment at a KIPP charter school in Arkansas have on student achievement?” We answered this question through two analyses: an ITT condition which included those students who left KIPP before Grade 8 yet remained in our data set, and a TOT condition that only analyzed students who started KIPP at Grade 5 and remained in KIPP through Grade 8.
The estimated regression coefficients and standard errors for all of the variables included in the math and literacy ITT regression analyses are presented in Table 2. For the KIPP_any analyses (far left column), the combination of predictor variables for the math analysis was significantly related to the outcome variable (Grade 8 math score on the Arkansas Benchmark Exam), adjusted R2 = .501, F(5, 174) = 37.00, p < .001. The same was true for the KIPP_years analyses (second column from left), adjusted R2 = .506, F(8, 171) = 23.89, p < .001. The combination of predictor variables for the literacy analysis was significantly related to the outcome variable (Grade 8 literacy score on the Arkansas Benchmark Exam), for both the KIPP_any analysis, R2 = .407, F(5, 176) = 25.85, p < .001, and the KIPP_years analysis, adjusted R2 = .424, F(8, 173) = 17.62, p < .001.
Arkansas Benchmark Exam Results in Math and Literacy, Grade 8, Intent to Treat.
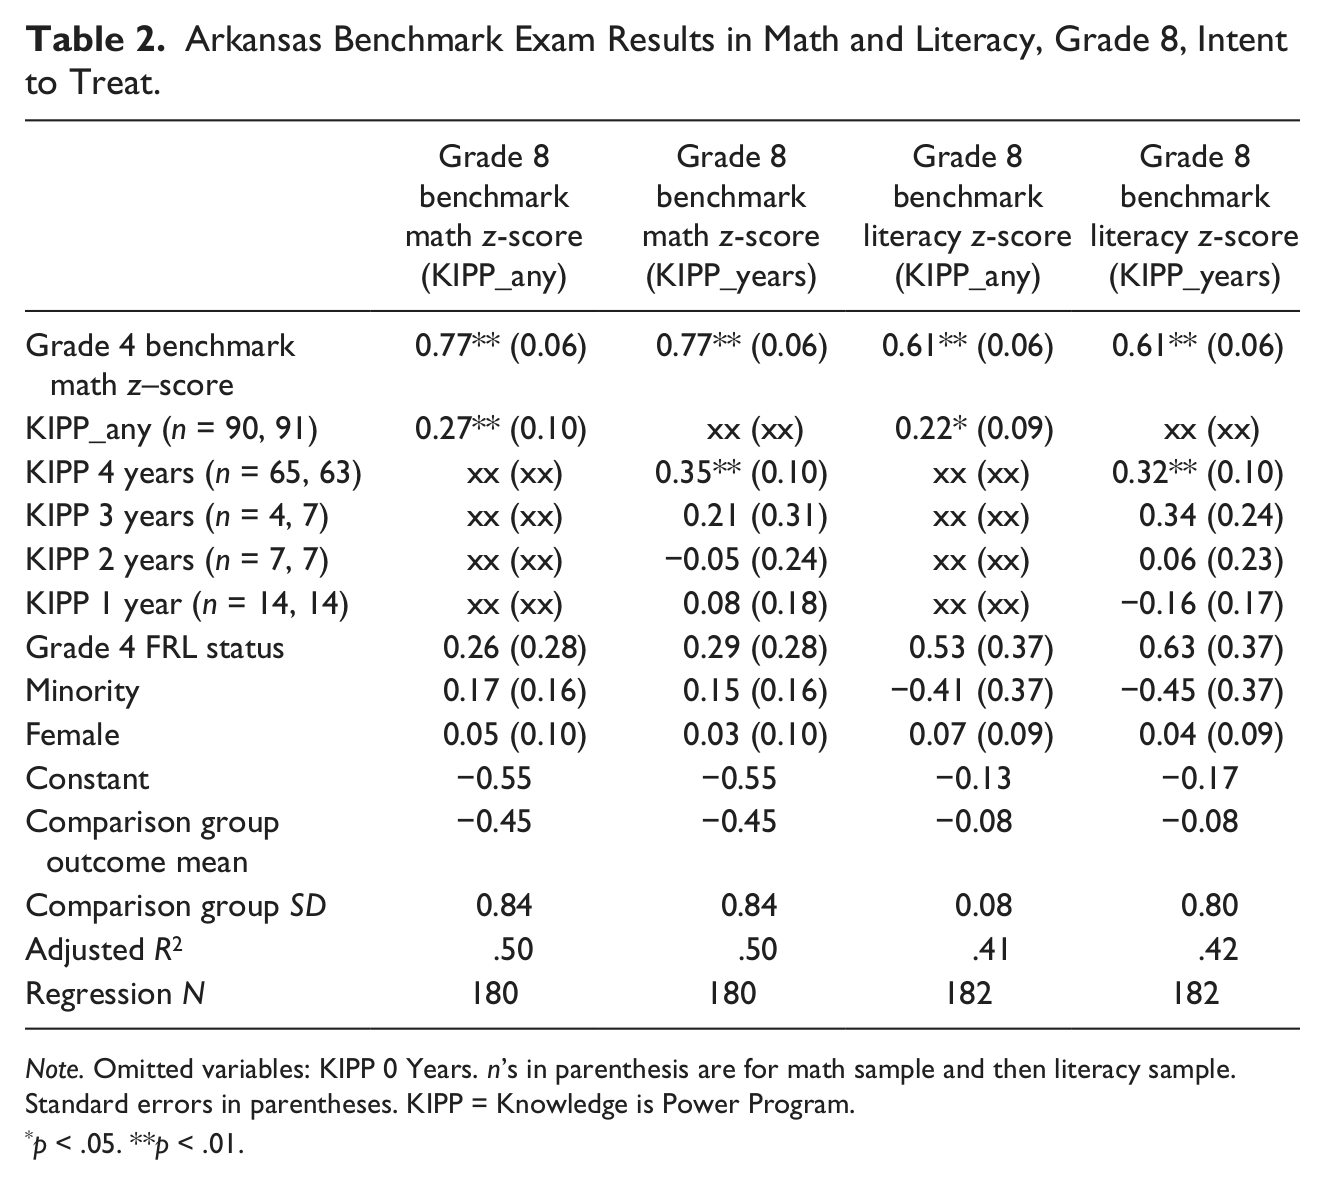
Note. Omitted variables: KIPP 0 Years. n’s in parenthesis are for math sample and then literacy sample. Standard errors in parentheses. KIPP = Knowledge is Power Program.
p < .05. **p < .01.
The results show that, while holding constant a student’s Grade 4 math Benchmark test performance, gender, and FRL status, minority status, and variable indicating enrollment in KIPP for any number of years between Grade 5 and Grade 8, there were significant differences on Grade 8 math Benchmark performance as compared with TPS students. Furthermore, when observed altogether, regardless of the number of years enrolled in KIPP, first-time KIPP entrants at Grade 5 who remained enrolled at KIPP for any period of time through Grade 8 will earn higher scores on the Arkansas Benchmark Exam in Grade 8 literacy than they would have had they never enrolled in KIPP.
We also observed performance among those first-time Grade 5 KIPP entrants who remained in KIPP through their Grade 8 year. The estimated regression coefficients and standard errors for all of the variables included in the math and literacy TOT regression analyses are presented in Table 3. The combination of predictor variables for the math analysis was significantly related to the outcome variable (Grade 8 math score on the Arkansas Benchmark Exam), adjusted R2 = .498, F(5, 124) = 26.63, p < .001, as were those for the literacy exam, adjusted R2 = .336, F(5, 120) = 13.66, p < .001. The results of this analysis show that, while holding constant a student’s Grade 3 and 4 math Benchmark test performance, gender, FRL status, and minority status, there were significant differences on Grade 8 math and literacy Benchmark performance in favor of KIPP students, suggesting that students who began attending KIPP during fifth grade will earn higher scores on the Arkansas Benchmark Exam in math and literacy than they would have had they never enrolled in KIPP.
Arkansas Benchmark Exam Results in Math and Literacy, Grade 8, Treatment on Treated.
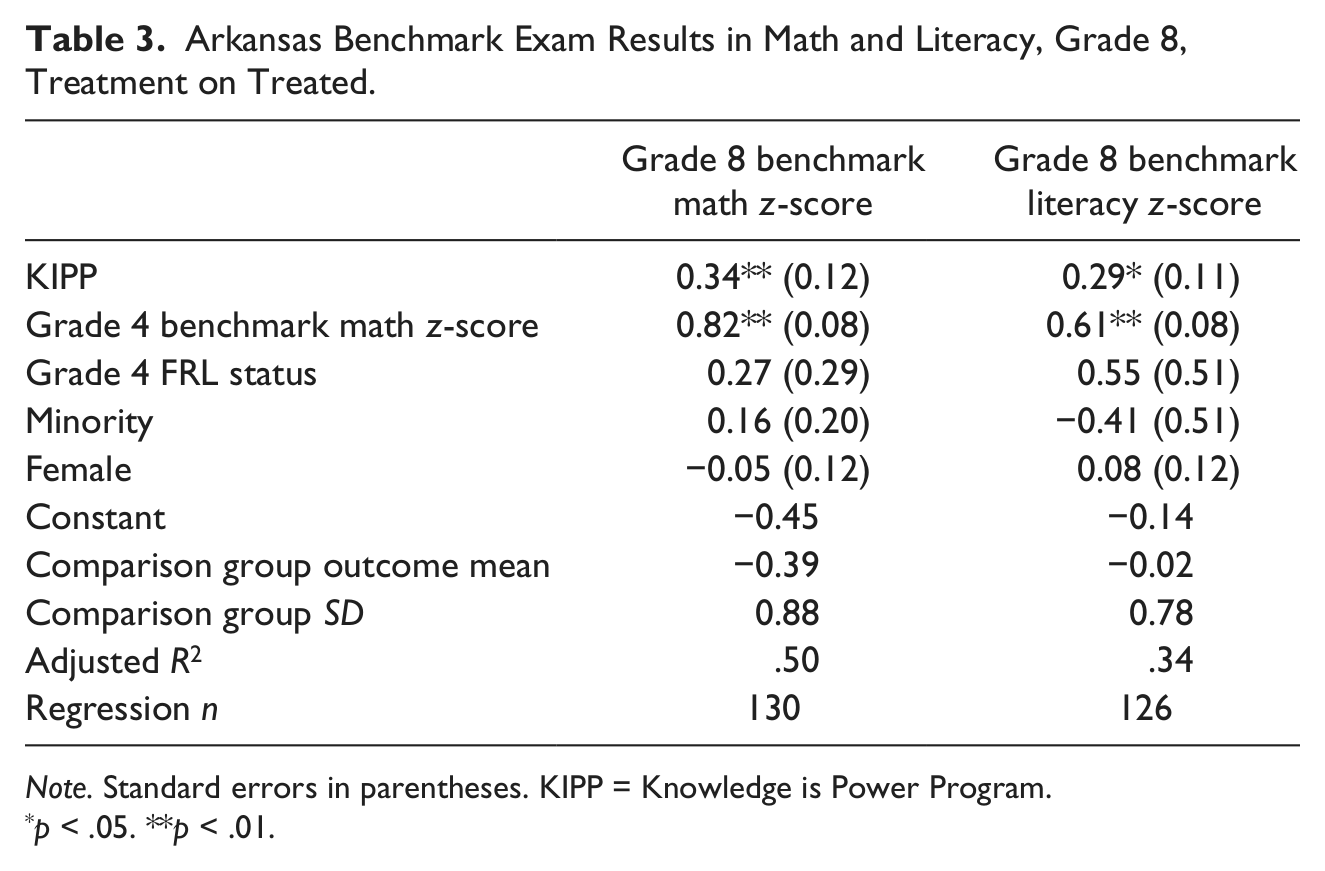
Note. Standard errors in parentheses. KIPP = Knowledge is Power Program.
p < .05. **p < .01.
Summary of Results
In summary, with regard to student attrition and achievement at KIPP DCPS as compared with their TPS feeder district peers,
Aggregate KIPP student attrition rates resemble those from the TPS feeder districts, with the notable exception of the Grade 5 to Grade 6 transition year, in which KIPP transition rates are higher and the differences are statistically significant.
Students who enroll in KIPP during Grade 5 and spend at least 1 year in the charter school from Grade 5 through Grade 8 statistically significantly outperform their TPS peers on the Arkansas Benchmark Exams in math and literacy.
Of first-time Grade 5 KIPP entrants grouped together by the number of years they stay in KIPP, only those students who remain enrolled through Grade 8 show statistically significant positive differences in math and literacy achievement as measured by the Arkansas Benchmark Exam as compared with their matched TPS peers.
A subset of first-time Grade 5 KIPP entrants who remained enrolled in the charter school through Grade 8 statistically significantly outperformed their matched TPS peers on the Arkansas Benchmark Exams in math and literacy.
Recommendations and Conclusions
Like any educational innovation, KIPP quite properly faces scrutiny. Ideally, the degree to which such a model should be expanded or copied should depend in part on relatively objective evaluations of its performance. This study, which offers the first evaluation of a rural KIPP campus, accords with prior research findings that KIPP attendance is associated with improved achievement, likely reducing the Black–White achievement gap in math and literacy. Furthermore, KIPP campus level attrition seems no higher than for nearby TPS. This result is important as it refutes criticisms levied by vocal KIPP critics (Miron et al., 2011) and is consistent with the results of the recent high-quality national study conducted by the Mathematica Policy Research team (Tuttle et al., 2013). This indicates that the gains from KIPP do not reflect selection and rejections of students, so much as improved student performance. Thus, the current Arkansas policy exempting KIPP from the Arkansas cap on charter schools appears to be warranted.
The most beneficial recommendation for further study of KIPP impacts is to continue seeking opportunities to observe performance differences between KIPP school attendees and TPS peers developed through RCT resulting from KIPP lotteries. This “gold standard” represents the strongest evaluation design by producing results that should be generally free of the issue of selection bias. Indeed, had a RCT design been possible to evaluate KIPP student performance, concerns of selection noted earlier in this document would be absent.
Despite some of the limitations of this evaluation, this study provides strong evidence that academic advantages accrued to KIPP students who entered KIPP in Grade 5 and remained through Grade 8 relative to their comparison peers on student achievement in math and literacy. In addition, the results noted in this evaluation may be more impactful as performance differences are presented after multiple years of attending a KIPP school, rather than a single-year, single-cohort study that could be the result of idiosyncratic performance rather than a sustained period of academic growth.
In the end, this evaluation revealed a great deal about how KIPP student achievement at a rural KIPP campus in Arkansas compares with academically and demographically similar peers on academic measures of math and literacy. These results are important as nearly all prior empirical work on KIPP schools has been conducted in urban settings. Despite the fact that many rural students struggle academically or attend struggling schools, we know relatively little about the potential benefits of No Excuses charter schools, such as KIPP, for rural students. Ideally, this study will spur additional research evaluating the impact of attending a KIPP charter school on student academic achievement for the other rural KIPP campus (Gaston, NC). At the very least, this evaluation has added to the growing, yet still small body, of literature on how attendance at a KIPP charter school can affect student achievement.
Footnotes
Declaration of Conflicting Interests
The authors declared no potential conflicts of interest with respect to the research, authorship, and/or publication of this article.
Funding
The authors received no financial support for the research, authorship, and/or publication of this article.
1.
In Arkansas, there are two basic types of public charter schools. A conversion school is a public school converted to a public charter school. Conversion schools can only draw students from within the school district’s boundaries. An open-enrollment school is a public charter school run by a governmental entity, an institution of higher learning, or a tax-exempt non-sectarian organization. Open enrollment schools can draw students from across district boundaries. Beyond the basic two types of charters, the concepts put in place by a public charter school are as broad as the imagination. Knowledge is Power Program Delta College Preparatory School (KIPP DCPS) is an open-enrollment charter school.