






Abstract
Objective: Protease inhibitors (PIs) exhibit considerable interpatient pharmacokinetic variability in plasma trough concentrations. Therapeutic drug monitoring (TDM) is occasionally used to guide chronic dosing to achieve target trough concentrations, but its clinical success assumes minimal intrasubject variability. Therefore, our primary objective was to evaluate intrapatient variability in atazanavir (ATV) plasma trough concentrations in HIV-1-infected patients. Design/Methods: In a single-site, prospective, cohort study, patients on atazanavir with or without ritonavir (ATV/r or ATV) for 2 clinic visits were enrolled. Adherence and time since last dose (TSLD) were verified at each visit. ATV was assayed with high-performance liquid chromatography. Intra- and interpatient variation was evaluated using the median intraindividual percentage coefficient of variation (ICV). Results: The mean 24-hour ATV trough concentrations for the first and second visit for the ATV/r group (n = 10) was 598 (CV 84%) and 525 ng/mL (CV 66%), respectively (P = .511), and 300 (CV 81%) and 434 ng/mL (CV 106%) for the ATV group (n = 4), respectively (P = .369). Median ICV was 43.1% for all patients (range: 0.6%-107.6%), 38.1% (0.6%-107.6%) for the ATV/r group, and 33.1% (2.3%-87.6%) for the ATV group. Conclusions: Potential intrapatient variability in ATV troughs suggests that repeated measurements may be required to ensure that target values are maintained.
Introduction
Atazanavir (ATV) is one of the newer protease inhibitors (PIs) commonly used for the treatment of HIV-1-infected patients due to its once daily administration and relatively favorable side effect profile compared to other PIs. Current treatment guidelines recommend using ATV as one of the preferred PIs in the treatment of antiretroviral-naïve HIV-1-infected adult patients. 1 The pharmacokinetic characteristics of ATV include absorption that is food- and gastric acid-dependent, moderate plasma protein binding (86%) to both alpha-acid glycoprotein (AAG) and albumin. ATV undergoes extensive hepatic metabolism via CYP 450 3A isoenzymes and is also a substrate and competitive inhibitor of uridine glucuronosyltransferase 1A1 (UGT1A1). The latter also influences bilirubin glucuronidation, resulting in hyperbilirubinemia. 2
One approach to optimize PI use for treatment of HIV-1 infection is to use therapeutic drug monitoring (TDM) to guide chronic dosing. When available, TDM is usually reserved for evaluating drug−drug interactions, drug−food interactions, virological failure, toxicity, and nonadherence. PIs exhibit extensive intra- and interpatient pharmacokinetic variability in plasma trough concentrations because they are highly protein-bound, are substrates for p-glycoprotein (efflux transporter), and are metabolized by the CYP3A system. These characteristics may limit the utility of TDM, especially, with respect to single plasma determinants. 3 Nettles et al evaluated the effectiveness of TDM in clinical practice by assessing the intrapatient pharmacokinetic variability of several antiretrovirals including lopinavir/ritonavir, nelfinavir/M8 metabolite, ritonavir, saquinavir, efavirenz, and nevirapine. They concluded that the median intrapatient percentage coefficient of variation (ICV) for all patients receiving PIs (n = 12) was 43.5%, and for those receiving nonnucleoside reverse transcriptase inhibitors ([NNRTIs]; n = 5) was 25%. 3 Another study found the median coefficient of variation of intraindividual variability for lopinavir trough concentrations to be 35%. 4
Inter- and intrapatient variability also exists for the NNRTIs. Low concentrations of efavirenz, in particular, are predictive of primary treatment failure. 5 Interindividual variability in efavirenz plasma concentrations may be explained by variation in the activity of the CYP 2B6 enzyme, the primary metabolic route for efavirenz clearance. 6 One study found increased body weight, efavirenz or lopinavir/ritonavir use were significant predictors of nontarget concentrations. 7 Best et al also concluded that patients who achieved target concentrations of PIs and NNRTIs during the 48 weeks trended toward a better virological response than those with nontarget concentrations.7 The authors suggested that TDM should be performed repeatedly during treatment to control for interindividual variation in antiretroviral plasma concentrations.
Some studies have also shown interpatient variability in ATV plasma trough concentrations. 8 –10 Interpatient variability can be problematic, since plasma concentrations that decrease below inhibitory concentrations may lead to virologic failure while high concentrations to hyperbilirubinemia. Therefore, additional studies have sought to clarify the role of TDM in clinical practice. 11 –13 In another study, lower concentrations of ATV have also correlated significantly with nevirapine use, whereas higher ATV plasma concentrations have correlated significantly with lopinavir/ritonavir and ritonavir use. 14 A significant relationship between ATV genotypic inhibitory quotient ([GIQ]; defined as the ratio of the mean ATV plasma trough concentration and the number of protease resistance mutations) and treatment response has been reported. These studies found that a lower GIQ correlated with higher virological failure and vice versa. They also found that ATV plasma trough concentrations were significantly related to increased total bilirubin concentrations.
To our knowledge, there are limited data describing intrapatient variability of ATV plasma trough concentrations. Therefore, our primary objective was to evaluate intrapatient variability of ATV plasma trough concentrations in HIV-1-infected patients currently receiving ATV (with or without ritonavir).
Methods
This was a prospective, cohort study conducted at the Immunodeficiency Services clinic (IDS) at the Erie County Medical Center, Buffalo, New York, USA, from October 2007 to July 2008. This clinic serves a majority of HIV-1-infected patients in Western New York. Patients were eligible for participation if they attended routine clinic visits, receiving ATV (with or without ritonavir), at least 18 years of age, and had documented HIV-1 infection. Patients were excluded if they had active substance abuse (eg, alcohol, recreational drugs) or severe cognitive impairment.
Enrolled subjects (N = 34) were asked not to take their HIV medications on the day of their clinic visit to ensure that a 24-hour ATV plasma trough concentration was collected. During the clinic visit, a University at Buffalo Therapeutic Drug Monitoring Registry Form was used to obtain demographic and clinical data. 15 Patient adherence to ATV was assessed by patient recall of the dates and times of the last 3 doses. This was designated as time since last dose (TSLD), with TSLD1 representing the date and time of last dose; TSLD2, the date and time of previous dose; and TSLD3, the date and time of prior dose. Adherence to ATV was further assessed by patient recall of the number of missed doses in the last 2 days, 7 days, and 14 days. The patient’s medication regimen was also evaluated at each clinic visit to determine potential drug interactions with ATV. Individual blood samples (10 mL) were obtained from each patient 24 ± 2 hours after the prior ATV dose during 2 routinely scheduled consecutive clinic visits. For blood samples collected outside of the sampling window, standard pharmacokinetic formulae (first-order pharmacokinetics using standard half-lives of 8.6 and 6.5 hours for patients on ATV/RTV-300/100 mg once daily and ATV-400 mg once daily, respectively) were used to calculate the 24-hour trough value. 2 Once the blood samples were collected, they were immediately isolated by centrifugation (3000g for 15 minutes at room temperature). Plasma samples were then aliquoted into cryovials and stored at −20°C until brought to the University at Buffalo Pharmacotherapy Research Center (PRC) Core Analytical Laboratory for high-pressure liquid chromatography (HPLC) analysis.
ATV plasma trough concentrations were quantified using a validated HPLC assay consistent with the Clinical Laboratory Improvement Amendments (CLIA). The lower limit of quantification (LLOQ) for ATV was 100 ng/mL. For samples whose concentrations were less than LLOQ, these were excluded when calculating intrapatient variability between clinic visits. Quality control samples at different ATV concentrations had a coefficient of variation at less than or equal to 5.4% for all concentrations. The inter-assay variation was ≤15% in accordance with US Food and Drug Administration (FDA) guidelines. Accuracy for concentration determination was evaluated in conjunction with the AIDS Clinical Trials Group and International Proficiency Testing Program. 16,17 Pharmacokinetic variance between the 2 samples per patient was analyzed using the median ICV, calculated as the ratio between the standard deviation (SD) and the mean trough concentration × 100. 3 The protocol was approved by the institutional review board at the University at Buffalo (New York, USA) and written consent was obtained from all participants.
Statistical Analysis
A sample size of N = 35 was needed to provide 80% power to be able to detect ≥ 20% intrapatient variability in ATV plasma trough concentrations. A paired student t test was used to evaluate the differences between mean ATV/r and ATV trough concentrations for both clinic visits. Range of median ICV values were used to reflect the degree of variation among patients in each group. P values < .05 were considered statistically significant.
Results
Patients
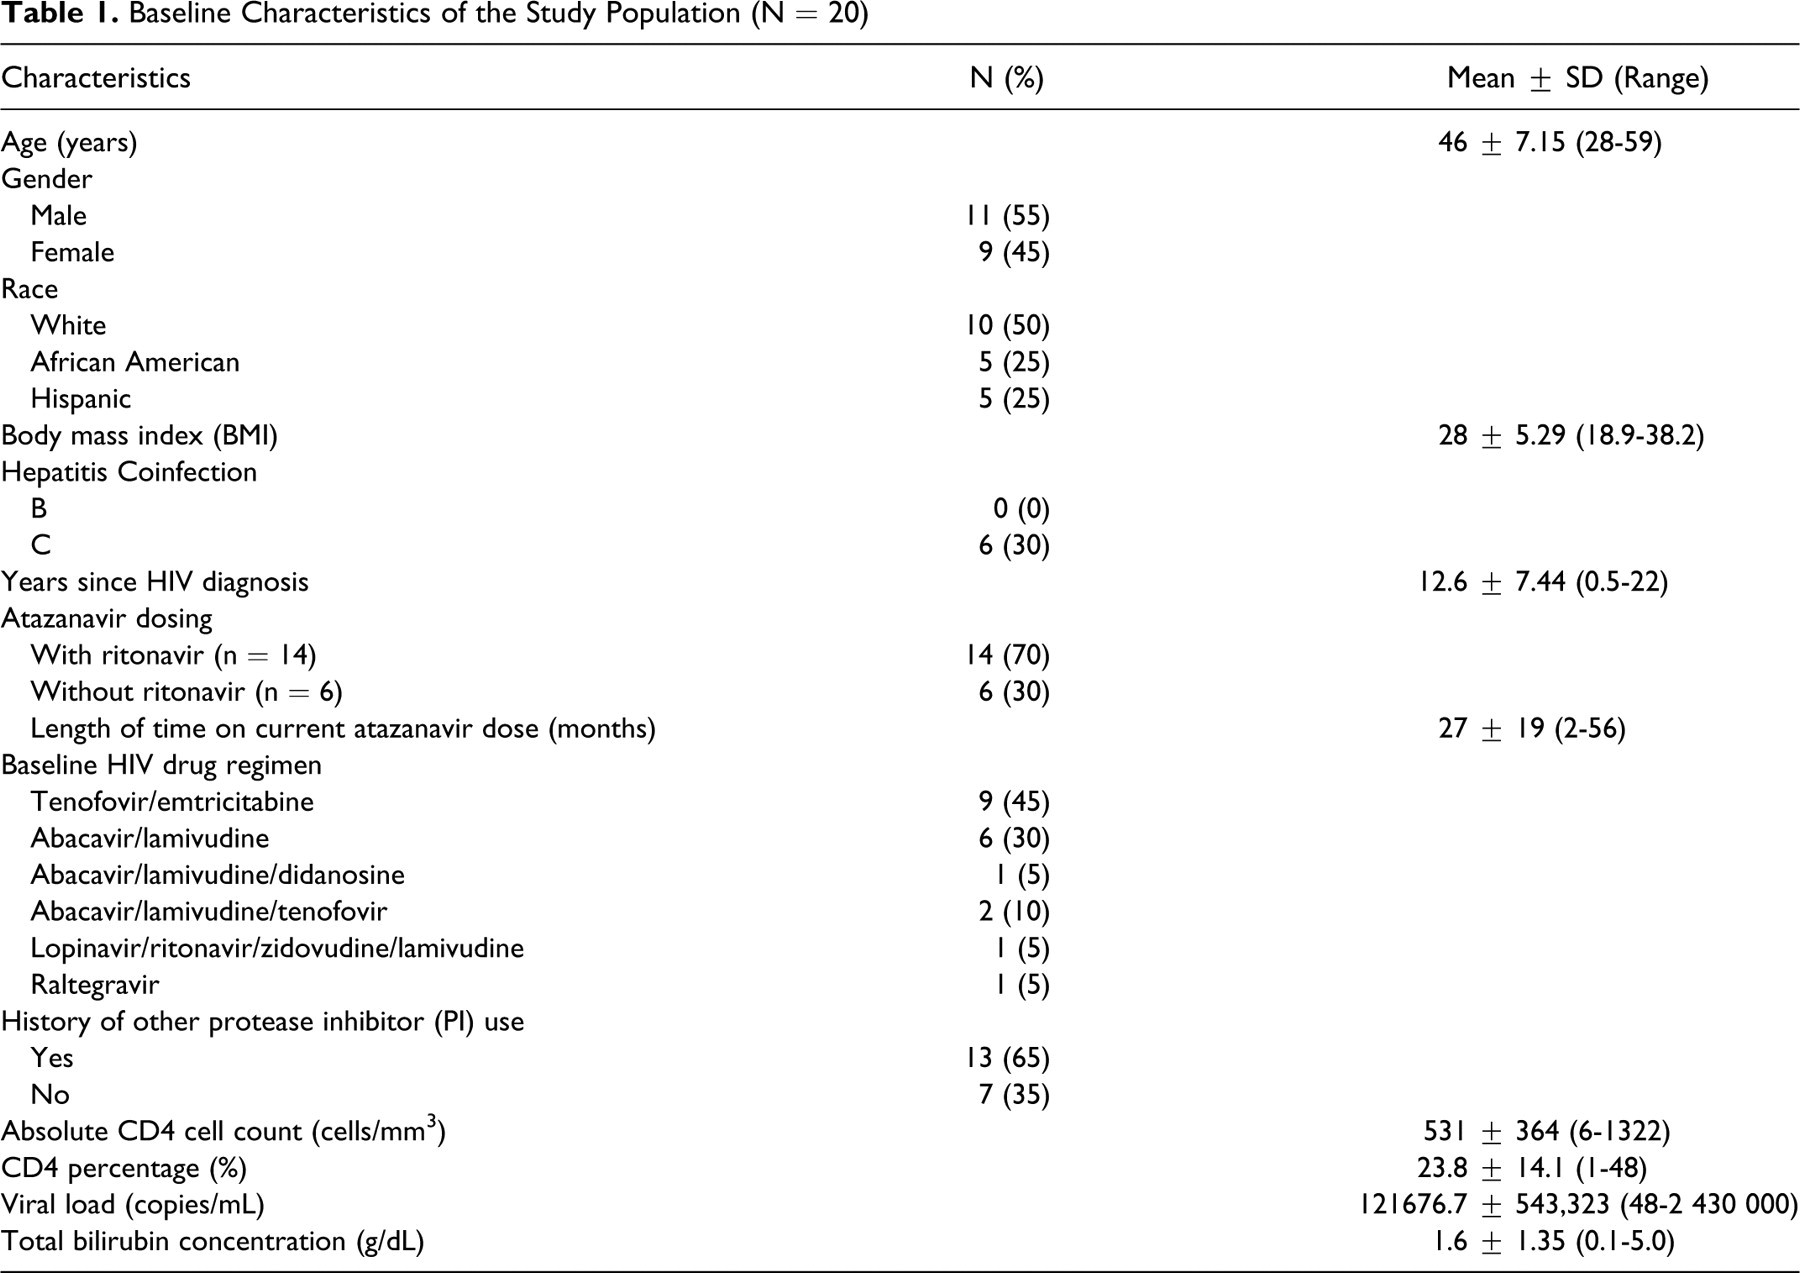
Among the 34 patients enrolled, only 20 patients had both first and second ATV troughs drawn. Baseline demographic and clinic data information for patient population are provided in Table 1 . Of the 20 patients, 6 were excluded because at least 1 of their ATV trough concentrations was lower than LLOQ. Mean ± SD absolute CD4 cell counts and CD4 percentage for 14 patients during first and second clinic visits were 542 ± 369 and 571 ± 390 cells/mm3 (P = .497) and 24.7% ± 14.3% and 26.1 ± 14.9 (P = .083), respectively. Mean ± SD baseline viral load (VL) was also 173 674 ± 649 415 and 1066 ± 3752 copies/mL (P = .335), respectively. During the first clinic visit, 50% (n = 7) had an undetectable VL (defined as <48 copies/mL) and upon the follow-up visit, 71% (n = 10). When these patients were stratified according to ritonavir use, mean ± SD surrogate markers absolute CD4 cell count, CD4 percentage, and VL for first and second clinic visits for the ATV/r group were 558 ± 281 and 576 ± 302 cells/mm3 (P = .762), 26.5 ± 11.7 and 27.7% ± 12.5% (P = .279), 67.4 ± 28.3 and 67.8 ± 40.9 copies/mL (P = .964), respectively. These same surrogate markers for first and second clinic visits for the ATV group were 502 ± 592 and 557 ± 620 cells/mm3 (P = .067), 20.2 ± 21.0 and 22.2% ± 21.7% (P = .066), 607 691 ± 1 214 872 and 3561 ± 7026 copies/mL (P = .391), respectively. Patients in the ATV/r group tended to have higher baseline absolute CD4 cell counts/CD4% as well as lower VLs than the ATV group because they were taking ATV for a longer time period (mean 36.3 vs 16.2 months). Also, 60% (n = 6) and 70% (n = 7) had undetectable VL on first and second clinic visits in the ATV/r group, respectively, whereas in the ATV group, 25% (n = 1) and 75% (n = 3) had an undetectable VL.
Baseline Characteristics of the Study Population (N = 20)
Dosing Characteristics, Drug Interactions, and Adherence
Of the 20 patients who completed the study, 70% (n = 14) were taking ATV/r and 30% (n = 6) ATV alone. Among these patients whose ATV trough concentrations exceeded the LLOQ (n = 14), 71% (n = 10) were taking ATV/r and 29% (n = 4) ATV alone. Highly active antiretroviral therapy (HAART) regimens remained the same for all patients during both clinic visits except for 1 patient (who was on ATV-400 mg during the first visit and subsequently changed to ATV-500 mg during the second visit). Scaled dosing was used to account for this particular variation in ATV dosing by multiplying the computed 24-hour trough on the second visit by 4/5.
Potential drug interactions with ATV included coadministration of proton pump inhibitors (PPIs) for 4 patients during both clinic visits. Mean ATV concentrations were lower for patients on PPIs (3 took omeprazole 20 mg once daily and 1 took pantoprazole 40 mg every other day) than those without PPIs (n = 6) in the ATV/r group (256 vs 766 ng/mL). No other medications that the patients were taking on either of their clinic visits interacted with ATV.
For the ATV/r group (n = 10), mean TSLD1, TSLD2, and TSLD3 for first and second visits were 15.6 hours, 23 hours, 24 hours and 23.3 hours, 23.9 hours, and 23.8 hours, respectively. For the ATV group (n = 4), TSLD1, TSLD2, and TSLD3 for first and second visits were 13.2 hours, 18 hours, 18 hours and 11.9 hours, 24 hours, and 24 hours, respectively. Mean self-reported rates of adherence for both groups from the previous 14 days prior to each of their 2 clinic visits were greater than or equal to 93%.
ATV Trough Concentrations and Median ICV
For the first visit, 21% (n = 3) patients had their ATV plasma trough concentrations drawn within the 22- to 26-hour window period and none during the second clinic visit. Among the ATV/r group, 30% (n = 3) and none had ATV plasma trough concentrations drawn within the 22- to 26-hour window period during the first and second clinic visits, respectively. Furthermore, for the ATV group, none were obtained within the same window for both visits.
Among the 14 patients, 71% (n = 10) and 64% (n = 9) had 24-hour ATV trough concentrations within the target range of 150 to 850 ng/mL 14,18,19 for the first and second visits, respectively. In the ATV/r group, 70% (n = 7) had target trough concentrations during both clinic visits (see Figure 1A ); and in the ATV group, 75% (n = 3) and 50% (n = 2) had target troughs for the first and second visits, respectively (see Figure 1B). For all patients (n = 14), fewer had ATV trough concentrations <150 ng/mL on the second visit than on the first visit (7% vs 14%) and more patients had ATV trough concentrations >850 ng/mL (29% vs 14%). For the ATV/r group, fewer patients had ATV concentrations <150 ng/mL during second visit than first visit (0% vs 10%), and more patients had ATV concentrations >850 ng/mL (30% vs 20%). For the ATV group, 25% of patients had ATV concentrations <150 ng/mL on both clinic visits and more patients had ATV concentrations >850ng/mL (25% vs 0%) on second than first visits, respectively.
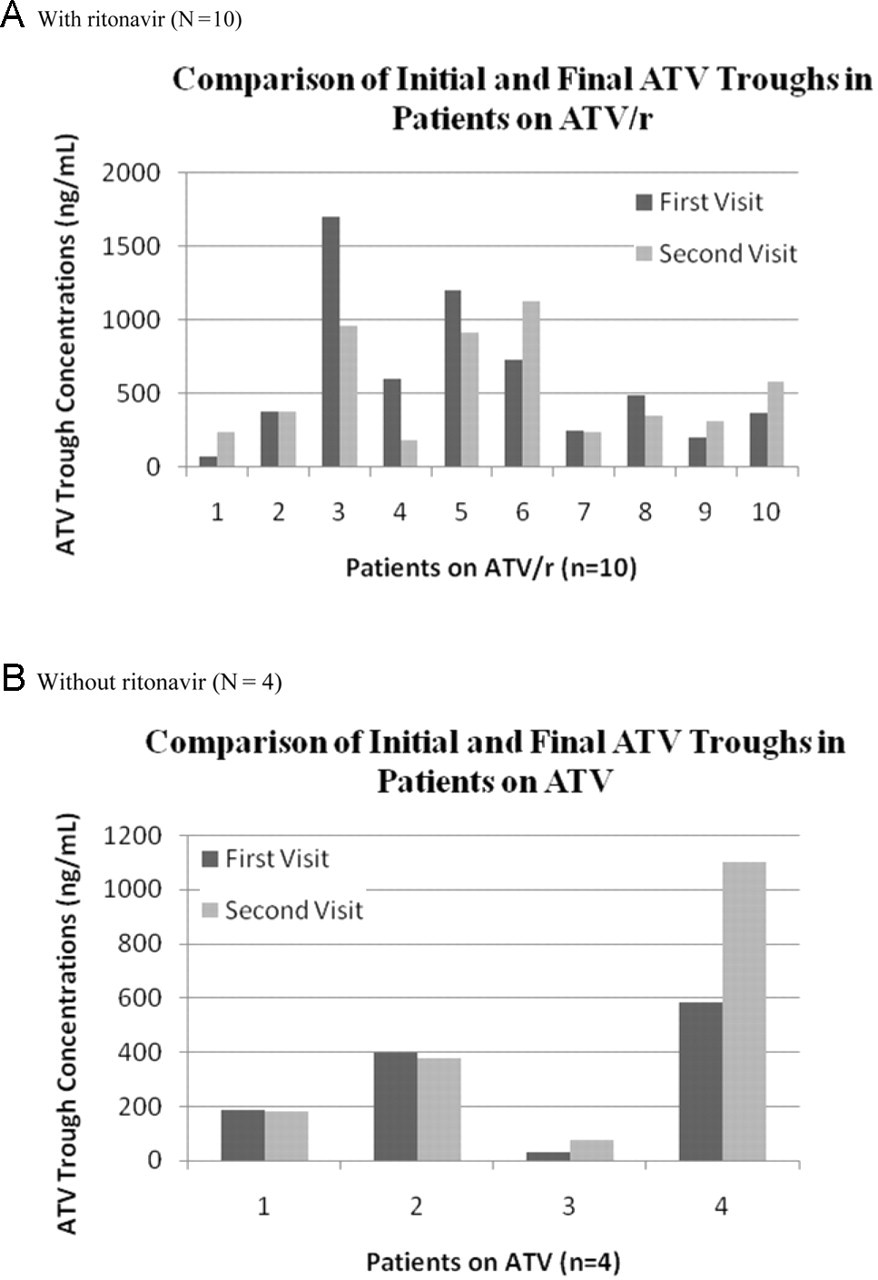
Calculated 24-hour ATV trough plasma concentrations for patients on ritonavir and without ritonavir for both clinic visits. A, With ritonavir (N = 10). B, Without ritonavir (N = 4).
The mean ± SD 24-hour ATV trough concentrations (ng/mL) for the first and second visits for the ATV/r group were 598 ± 502 and 525 ± 348 ng/mL, respectively (P = .511); see Table 2 . The mean ± SD 24-hour ATV plasma trough concentrations (ng/mL) for the first and second visits for the ATV group were 300 ± 242 and 434 ± 461 ng/mL, respectively (P = .369). Median ICV was 43.1% for all patients (0.6%-107.6%, n = 14), 38.1% (0.6%-107.6%, n = 10) for the ATV/r group, and 33.1% (2.3%-87.6%, n = 4) for the ATV group (see Table 2).
Mean Calculated 24-Hour ATV Troughs and Median Intrapatient Coefficient of Variability (ICV) for all Groups

Abbreviations: ATV/r, atazanavir with ritonavir; ATV, atazanavir without ritonavir.
Discussion
In this study, we observed intrapatient variability in ATV trough concentrations for patients receiving ATV with and without ritonavir. These findings are consistent with other studies, which reported median ICV for PIs (saquinavir, nelfinavir, and lopinavir/ritonavir) to be 43.5%. 3 Ritonavir is commonly used to increase PI plasma concentrations resulting from strong CYP 450 3A4 inhibition. Ritonavir is also thought to reduce variation in PI concentrations. However, in our study, we found that the median ICV for the ATV group was less than the ATV/r group (33.1% vs 38.1%).
Mean ATV trough concentrations for the ATV/r group was 598 and 525 ng/mL for first and second visits, respectively, and 300 and 434 ng/mL for the ATV group. These mean ATV trough concentrations were similar to those noted in the Winston et al study with the exception that their ATV trough concentrations (in ATV/r group) were higher than our study (774 vs 561 ng/mL). 14 In comparison, our study population was very diverse: 55% male, 50% caucasian, 25% African American, and 25% Hispanic. We also had a higher percentage of patients on acid-suppressive therapy (30%), which may have contributed to the lower than expected ATV trough concentrations in the ATV/r group (no patients were receiving acid-suppressive therapy in the ATV group).
Other factors that could affect the ATV trough concentrations are administration with food and adherence. We did not record whether each patient took their ATV with food; this coadministration is important for improving bioavailability of ATV. Adherence in our study population was excellent for the most part, since a mean adherence rate greater than or equal to 93% was reported for the 2 weeks prior to blood sample collection for each clinic visit. However, there were significant differences in timing of the last 3 doses of ATV prior to the first visit for the ATV/r group and both visits for ATV group, which could affect the ATV troughs.
Another factor that may correlate with ATV trough concentrations is hepatitis C virus (HCV) coinfection. 20 In this study, Slish et al20 found that the mean ATV concentration was lower in the HCV group than in the non-HCV group (507 vs 780 ng/mL; P = .218). Approximately 30% of our study population had coinfection with hepatitis C, with 40% (n = 4) and none in ATV/r and ATV groups, respectively. We found that mean ATV concentrations were lower for those coinfected with HCV (n = 4) than those without HCV (n = 6) in the ATV/r group (314 vs 727 ng/mL). This may also further explain why our mean ATV/r concentrations were lower than those found in other studies.
Coadministration of other antiretrovirals can also affect ATV trough concentrations. One of our patients was taking lopinavir/ritonavir with ATV; her concentrations were 1199 and 913 ng/mL on respective clinic visits. It has been shown in other studies that lopinavir/ritonavir can significantly increase ATV trough concentrations more so than ATV given with ritonavir alone. 14,21 Several of our patients (55%) were taking tenofovir as a part of their nucleoside-reverse transcriptase inhibitor (NRTI) backbone. Tenofovir coadministration has been found to significantly decrease concentrations of ATV unless it is given with ritonavir. One of our patients was taking tenofovir/emtricitabine with ATV alone; his ATV trough concentrations were 30 and 76.8 ng/mL for respective clinic visits. Although the baseline VL for this patient was 111 copies/mL, it later became undetectable once ritonavir was added to ATV.
Another factor contributing to the variation in ATV trough concentrations within both groups is pharmacogenomics. Most commonly studied single nucleotide polymorphisms (SNPs) in the MDR1 gene (also referred to as efflux transporter or P-glycoprotein [P-gp]) include G2677T and C3435T. Ma et al found that this variant T allele did not correlate with trough plasma concentrations of ATV. 22 These authors suggested that more prospective studies with larger numbers are needed to derive any relevant correlation between SNPs and ATV trough concentrations. It has been noted in a study by Rodriguez-Novoa et al that 2 other SNPs at the CYP 3A4*1B promoter and in exon 7 of CYP3A4*2 should be investigated to determine whether these influence the pharmacokinetics of ATV. 23 In addition, CYP3A5*1 has been significantly associated with both increased saquinavir and indinavir clearance. 24,25
In our study, 65% to 70% of our patients had therapeutic 24-hour ATV trough concentrations within the range of 150 to 850 ng/mL during both clinic visits. Fewer patients had ATV trough concentrations <150ng/mL and more had concentrations >850ng/mL on the second clinic visit than on their first visit. This may be attributed to improved adherence between clinic visits and more appropriate spacing of acid-suppressive therapy from ATV administration. From our study, it does not appear that ATV trough concentrations alone correlate with immunologic and virological response, which has also been previously reported. 14,26 Our study population was predominantly treatment experienced, with at least 50% of the patients having a baseline undetectable VL or 86% (n = 12) having a VL <400 copies/mL, and the mean time between clinic visits was 2 months. Perhaps long-term follow-up and enrolling a treatment-naive population would help to determine whether there is a relationship between ATV trough concentrations and virological response.
Potential factors that could help explain why 6 patients had at least 1 ATV trough concentration less than 100 ng/mL (LLOQ) during their clinic visits are nonadherence, coadministration with food, and drug−drug interactions. Two patients had 24-hour ATV troughs between 340 and 440 ng/mL during their first clinic visit, but both had ATV troughs less than LLOQ during second visit. These patients had an increased VL on their second clinic visits, which suggests nonadherence to ATV. Another 2 patients had 24-hour ATV troughs less than LLOQ during first visits but then much higher ATV troughs during second clinic visits; this could have occurred as a result of reinforced adherence counseling. One other patient had 24-hour ATV trough less than LLOQ during first clinic visit and 228 ng/mL during second visit; this patient was taking both ranitidine and omeprazole with ATV and was told to separate acid-suppressive therapy 12 hours from ATV administration during first visit. Lastly, another patient had both the 24-hour ATV trough concentrations less than LLOQ even with an undetectable VL during both clinic visits.
Some limitations in our study are a small patient population, particularly for the ATV group (n = 4), and uncertainty of coadministration of food intake with ATV. Also, estimation of 24-hour ATV troughs using mean half-lives for ATV/r and ATV may have over- or underestimated clearance in some of our patients, especially, since approximately 10% of our patient samples from both clinic visits were collected within the 22- to 26-hour window period. Another prominent limitation in this study is that only 2 samples were collected for each patient. Intrasubject variability may have been better estimated by collecting several samples for each patient over an extended period of time. In addition, only 14 patients were included in this study, which is substantially less than the predicted number calculated to provide sufficient power to detect at least 20% intrapatient variability in ATV plasma trough concentrations.
We conclude from this study that potential intrapatient variability exists for patients receiving ATV-based antiretroviral therapy, since a wide range of ICV was present in those on either ATV/ritonavir or ATV alone. Dose adjustments based on TDM may provide unpredictable changes in trough concentrations suggesting that repeated measurements may be required to ensure that ATV target values are attained. Furthermore, larger, prospective, randomized-controlled clinical trials are needed to more accurately assess intrapatient variability of ATV trough concentrations in order to elucidate the role of TDM for optimizing ATV treatment in HIV-infected patients.
Footnotes
Acknowledgment
The contributions of the HIV Clinical Pharmacology Research Laboratory staff, Translational Pharmacology Research Core staff, and the Immunodeficiency Services Clinic staff at the Erie County Medical Center are appreciated.
The author(s) declared no conflicts of interest with respect to the authorship and/or publication of this article.
The author(s) disclosed receipt of the following financial support for the research and/or authorship of this article: Dr Crutchley was supported by a grant from Ryan White Funding, HRSA - Grant # 1018487 and a grant from New York State Medication Adherence - Grant # 47912.