
Abstract
Triage of patients with mild traumatic brain injury (mTBI) and possible isolated epidural hematoma (iEDH) remains a clinical challenge. Blood-based biomarkers are being integrated into mTBI management, but their ability to identify patients with iEDH is uncertain. In this prospective, multicenter cohort study from the Collaborative European NeuroTrauma Effectiveness Research in Traumatic Brain Injury study, which recruited between December 19, 2014, and December 17, 2017 (NCT02210221), we included 1,048 mTBI patients (Glasgow Coma Scale ≥ 13) with biomarker sampling and head computed tomography (CT) within 24 h of injury. We assessed six blood-based biomarkers—including glial fibrillary acidic protein (GFAP) and ubiquitin carboxy-terminal hydrolase L1 (UCH-L1)—for their diagnostic performance in identifying patients with mTBI and iEDH. Patients with other traumatic intracranial findings potentially requiring surgery were excluded. Of 1,048 patients (median age 46 years; 64% male), 38 (3.6%) had iEDH and 982 (94%) had negative CT findings. GFAP showed the highest diagnostic accuracy for iEDH (area under the curve 0.77; 95% confidence interval 0.71–0.83) and yielded a negative predictive value of 1.0 at a threshold of 0.19 μg/L. The addition of UCH-L1 did not lead to a significant improvement in diagnostic performance. No significant correlation was found between EDH volume and biomarker levels. In this large multicenter study, GFAP was the only biomarker that could adequately distinguish patients with iEDH from CT-negative cases. These results suggest that GFAP may serve as a tool to rule out iEDH in patients with Glasgow Coma Scale ≥ 13, supporting its use in identifying individuals unlikely to require acute intervention for intracranial injury.
Keywords
Introduction
Epidural hematomas (EDHs) are extra-axial, space-occupying lesions between the dura and skull. Among traumatic brain injuries (TBIs), EDHs are relatively rare, occurring in up to 11% of cases.1–3 Mean age of affected patients is 20–30 years, whereas other extra-axial hemorrhages—subdural hematoma (SDH) and traumatic subarachnoid hemorrhage (TSAH)—are more common in older adults.4–6 Despite being rare, EDH constitutes a potentially life-threatening neurosurgical emergency.4–6 Early diagnosis by head computed tomography (CT) is essential and serves as a cornerstone of the diagnostic process.
Identifying EDH patients remains a clinical challenge. Classically, EDH presents with initial loss of consciousness followed by a “lucid interval”—a transient period of apparent neurological recovery—observed in 14–30% of cases. 7 During this interval, patients may appear fully functional, walk, talk, and have no neurological deficits, increasing the risk of inappropriate discharge without CT scan. Routine CT scanning in all patients with mild TBI (mTBI) is neither cost-effective nor safe. 8 Selective imaging strategies are urgently needed to balance patient safety and optimal CT use while minimizing delays in EDH diagnosis that could delay surgical intervention.
Several brain-enriched blood-based protein biomarkers have been studied to contribute to the decision-making process in determining the need for a head CT after head injury. S100B in the emergency department (ED) is recommended in the Scandinavian Guidelines to rule out CT need in patients with mTBI who are at low risk for intracranial hemorrhage and are seen within 6 h of TBI. 9 In 2018, the Food and Drug Administration (FDA) cleared a glial fibrillary acidic protein (GFAP) and ubiquitin C-terminal hydrolase (UCH-L1) test based on the results of A Prospective Clinical Evaluation of Biomarkersof Traumatic Brain Injury (ALERT-TBI) to rule out traumatic intracranial findings in mTBI. 10 In the French TBI guidelines of 2023, S100B and GFAP–UCH-L1, 11 and in the Spanish TBI guidelines of 2024, GFAP–UCH-L1 were integrated into the diagnosis of mTBI. 12 GFAP/UCH-L1 test has been commercialized on diagnostic platforms (Abbott i-STAT and i-Anility and bioMérieux VIDAS). 13
Subsequently, the new characterization of acute TBI proposed by the National Institute of Neurological Disorders and Stroke (NIH-NINDS) TBI Classification and Nomenclature Initiative recommended GFAP, UCH-L1, and S100B tests to rule out traumatic intracranial CT findings in patients presenting with Glasgow Coma Scale (GCS) of 13–15.14,15 The current body of literature shows that the diagnostic performance of these biomarkers is at least clinically adequate.10,14,16,17
Most existing biomarker studies have examined heterogeneous TBI populations with various intracranial lesions, without specifically addressing isolated epidural hematoma (iEDH). While outcomes are favorable if diagnosed early, delayed recognition can lead to rapid deterioration and death. Because biomarker levels are typically lower in iEDH than in other lesion types, evaluating their performance in this distinct context is essential as blood-based triage tools approach clinical implementation. 18
The main objective of this study is to examine the diagnostic performance of six extensively studied TBI blood-based biomarkers—GFAP, neurofilament light (NfL), neuron-specific enolase (NSE), S100B, total tau (t-tau), and UCH-L1—in identifying EDHs in patients with mTBI (GCS of 13–15). We present novel EDH-specific analyses, including biomarker-specific cut-offs. We also investigated the relationships between biomarker concentrations and EDH volume and assessed the impact of major extracranial injury (MEI, Abbreviated Injury Scale [AIS] score ≥ 3) on biomarkers’ diagnostic accuracy.
Materials and Methods
This research was conducted in accordance with the Strengthening the Reporting of Observational Studies in Epidemiology statement recommendations. 19
Study design and population
This research is part of the Collaborative European NeuroTrauma Effectiveness Research in Traumatic Brain Injury (CENTER-TBI) Core study, a multicenter, prospective, longitudinal, observational cohort study registered with ClinicalTrials.gov (NCT02210221) and the Resource Identification Portal (Research Resource Identifier: SCR_015582). 20 Ethical approval was obtained at each center; all patients or surrogates provided informed consent.
Patients were included if they had GCS score of 13–15, underwent a head CT scan within 24 h post injury, and had available serum biomarker measurements within the same timeframe. Due to EDH being a rare intracranial bleeding type potentially leading to surgical intervention, EDH patients were included from all CENTER-TBI enrollment strata (i.e., ED discharge, admission to the ward, admission to the intensive care unit). The baseline GCS score used for patient inclusion in the current study is a centrally derived variable representing the poststabilization GCS score, measured at discharge from the ED. When missing, this score was imputed centrally with the closest in time available (i.e., GCS score at ED arrival or prehospital). 21
Patients with no EDH and those harboring potentially surgical intracranial injuries other than EDH, such as SDH and/or intraparenchymal hemorrhage (IPH), were excluded to ensure that biomarker performance was assessed specifically in the context of EDH. The control group consisted of patients with negative admission head CTs, meaning no reported traumatic pathological findings. Given previous evidence 22 demonstrating increased biomarker levels in patients with isolated skull fractures compared with patients with negative findings, isolated skull fractures were excluded.
Patient enrollment occurred during December 2014–December 2017, in 65 study centers from 18 countries across Europe and Israel. The protocol for the CENTER-TBI core study has been published previously.20,23
Data collection and standardization
All clinical, imaging, and biomarker data were retrieved from the CENTER-TBI database (Neurobot v3.0). Data collection adhered to standardized protocols, ensuring uniformity across participating centers. Demographic variables, injury characteristics, and baseline neurological status were recorded at admission, with follow-up assessments at hospital discharge and 6 months post injury. Details regarding clinical data collection can be found in previous publications.20,23 Extracranial injuries were recorded using the AIS, with MEI defined as AIS ≥ 3 in any extracranial body region.
Imaging data
All admission head CT scans were centrally reviewed by neuroscientists under the supervision of a board-certified neuroradiologist with over 25 years of experience using the National Institute of Neurological Disorders and Stroke TBI imaging Common Data Elements.24,25 EDH volume was calculated using the ellipsoid formula: width × depth × length × 0.5.
Definitions of EDH subtypes
To facilitate a detailed analysis of biomarker performance in different radiological presentations, we defined two subtypes within our selected cohort of EDH cases without any potentially surgical lesions (SDH and/or intraparenchymal hemorrhage). We distinguished between EDHns and iEDH according to the presence (or absence) of coexisting intracranial injuries that usually would not require neurosurgery, such as TSAH, intraventricular hemorrhage (IVH), or diffuse/traumatic axonal injury (DAI/TAI). We refer to the overall group of included EDH cases as EDHcombined (iEDH and EDHns).
In addition to the two radiological subtypes, we used an additional clinical category: A “clinically significant EDH,” defined as any EDH, associated with neuroworsening, lesion progression on CT, intracranial pressure (ICP)-directed therapy, neurosurgery, intracranial complications (e.g., seizures, meningitis), or incomplete functional recovery, as indicated by a Glasgow Outcome Scale—Extended (GOSE) score below 8 at 3-month follow-up.
Serum biomarker sample processing and assay methodology
Blood samples were obtained through venipuncture upon hospital admission, typically within 24 h post injury, as per the CENTER-TBI core study protocol. Samples were processed by centrifugation at 2,000 × g for 10 min at 4°C, after which serum was aliquoted and stored at −80°C until batch analysis. GFAP, UCH-L1, t-tau, and NfL were measured using Single Molecule Array (SiMoA)-based Human Neurology 4-Plex B Assay (N4PB) (Quanterix, Lexington, MA, USA) conducted at the Department of Psychiatry and Emergency Medicine, University of Florida, Gainesville, USA. The lower limits of detection were 0.00132 μg/L for GFAP, 0.00134 μg/L for UCH-L1, 0.0231 pg/mL for t-tau, and 0.0971 pg/mL for NfL. S100B and NSE were measured using electrochemiluminescence immunoassay (Roche Diagnostics, Mannheim, Germany), with lower detection limits of 0.005 μg/L and 0.05 μg/L, respectively (conducted at University of Pécs Hospital Core clinical laboratory, Pécs, Hungary). Inter- and intra-assay coefficients of variation were below 10% for all assays. Laboratory personnel were blinded to clinical and imaging data. Full details regarding the blood biomarker samples processing and assay methodology can be found in previous publications.16,26
Statistical analysis
Data on clinical and imaging characteristics, therapy, and outcomes were reported as absolute and relative frequencies for categorical variables and as medians and interquartile ranges (IQRs) for continuous variables. Data were reported for the entire study sample and compared between patients with (1) negative head CT vs. EDHcombined and (2) negative head CT vs. iEDH vs. EDHns. Differences between subgroups were tested using χ2 statistics for categorical variables and Mann–Whitney U (Wilcoxon) and Kruskal–Wallis rank sum tests for continuous variables for two- and three-way comparisons, respectively.
Biomarker concentrations were log-transformed to adjust for skewed distributions before statistical modeling. The primary analysis examined group-wise differences in biomarker levels, visualized in boxplots and compared using the abovementioned nonparametric tests. For three-way comparisons of biomarker levels, Kruskal–Wallis rank sum tests were followed by post hoc Dunn’s tests for pairwise multiple comparisons, with Benjamini–Hochberg correction. Receiver operating characteristic curves were constructed to evaluate the diagnostic performance of each biomarker, with area under the curve (AUC) values calculated to quantify discrimination between negative scans and EDHcombined, clinically significant EDH, iEDH, and EDHns, respectively. Cut-off values for each biomarker corresponding to maximum negative predictive value (NPV) were reported. Sensitivity analyses were conducted by excluding patients with MEI to determine the extent to which the presence of extracranial injuries influenced discrimination. Additional analysis explored the impact of combining multiple biomarkers.
The relationships between biomarker concentrations and EDH volume were examined using Spearman’s rank correlation coefficients. A p value of <0.05 was considered statistically significant.
Advanced statistical modeling
To further assess relationships between EDH volume and biomarker concentrations, univariable and multivariable data-driven fractional polynomial regression models were explored to account for potential nonlinear associations. Multivariable models were adjusted for age, sex, time from injury to sampling, time from injury to scan, MEI, and presence of other nonsurgical lesions. Additional exploratory analyses evaluated time-dependent changes in biomarker levels.
Role of the funding source
The funders of the study had no role in study design, data collection, data analysis, data interpretation, or writing of the report.
Results
Of 4,509 patients enrolled in the CENTER-TBI Core study, a total of 1,048 patients with mTBI met the inclusion criteria of this analysis. Of them, 66 (6%) had EDHcombined, while 982 (94%) had negative CT scans (Supplementary Fig. S1). Within the EDHcombined group, 38 patients (58%) were classified as iEDH, and 28 (42%) as EDHns. Most EDHs (73%) were clinically significant.
The median age of the study population was 46 years (IQR 28–63), with 64% being male. iEDH patients were significantly younger (median age 25 years, IQR 19–34) than EDHns patients (median age 47 years, IQR 29–53, p < 0001). The proportion of patients with a GCS score of 13 to 14 was higher in EDHcombined (35%) than in CT-negative patients (13%, p < 0.001). MEIs were present in 36% of EDHcombined patients and 21% of CT-negative patients (p = 0.004). The median EDH volume was 4.3 cm³ (IQR 1.2–13.0), with no significant difference between iEDH and EDHns (Table 1, Supplementary Table S1).
Distribution of Clinical, Imaging, Therapy, and Outcome Characteristics in All Included Patients, and by Findings on the Admission CT Scan: Negative Scan vs. Isolated Epidural Hematoma vs. Epidural Hematoma with Nonsurgical Findings
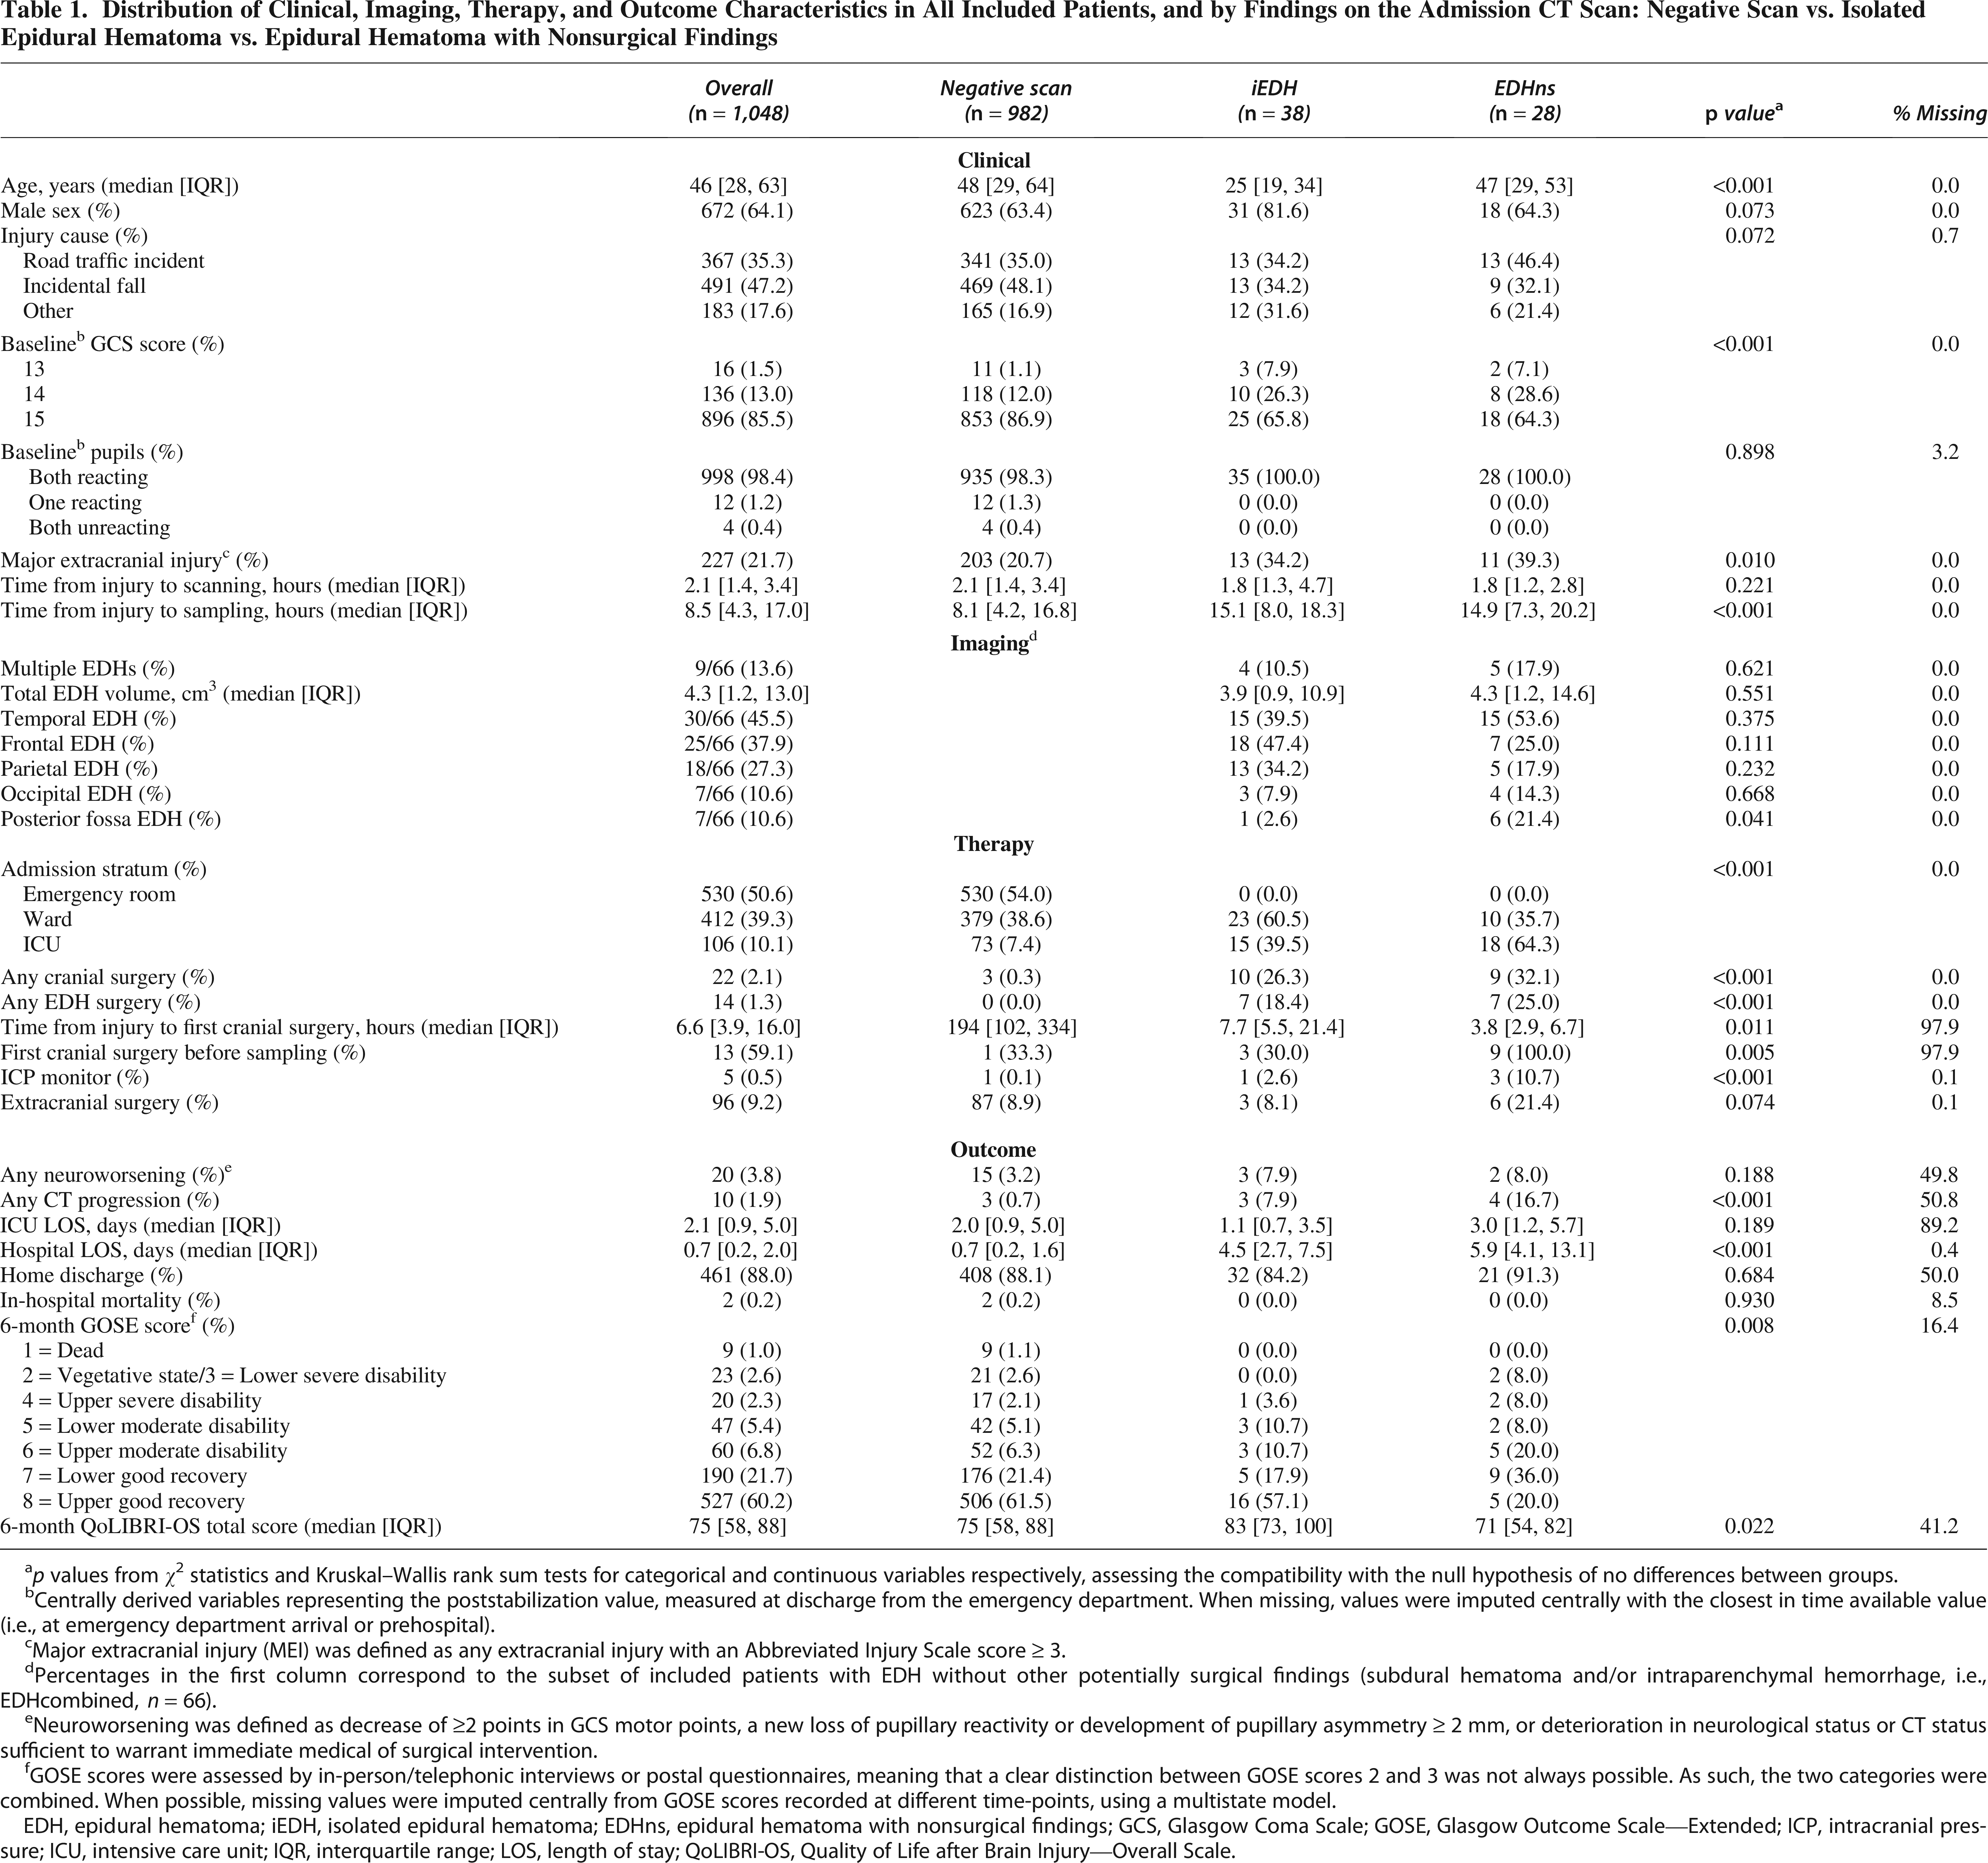
p values from χ2 statistics and Kruskal–Wallis rank sum tests for categorical and continuous variables respectively, assessing the compatibility with the null hypothesis of no differences between groups.
Centrally derived variables representing the poststabilization value, measured at discharge from the emergency department. When missing, values were imputed centrally with the closest in time available value (i.e., at emergency department arrival or prehospital).
Major extracranial injury (MEI) was defined as any extracranial injury with an Abbreviated Injury Scale score ≥ 3.
Percentages in the first column correspond to the subset of included patients with EDH without other potentially surgical findings (subdural hematoma and/or intraparenchymal hemorrhage, i.e., EDHcombined, n = 66).
Neuroworsening was defined as decrease of ≥2 points in GCS motor points, a new loss of pupillary reactivity or development of pupillary asymmetry ≥ 2 mm, or deterioration in neurological status or CT status sufficient to warrant immediate medical of surgical intervention.
GOSE scores were assessed by in-person/telephonic interviews or postal questionnaires, meaning that a clear distinction between GOSE scores 2 and 3 was not always possible. As such, the two categories were combined. When possible, missing values were imputed centrally from GOSE scores recorded at different time-points, using a multistate model.
EDH, epidural hematoma; iEDH, isolated epidural hematoma; EDHns, epidural hematoma with nonsurgical findings; GCS, Glasgow Coma Scale; GOSE, Glasgow Outcome Scale—Extended; ICP, intracranial pressure; ICU, intensive care unit; IQR, interquartile range; LOS, length of stay; QoLIBRI-OS, Quality of Life after Brain Injury—Overall Scale.
All EDH patients presented with a skull fracture, and all EDHns patients had coexisting TSAH (Supplementary Fig. S2). The median time from injury to CT scan was 2 h (IQR 1–3), and to biomarker sampling, 8 h (IQR 4–17), with biomarkers collected later in EDHcombined patients compared with negative scan patients (median 15 h, IQR 8–19 vs. median 8, IQR 4–17). More detailed breakdown of sampling times is presented in Supplementary Figure S3.
Biomarker levels and group comparisons
Biomarker levels were significantly higher in EDHcombined and EDHns patients compared with those with negative head CT (Supplementary Table S2, Fig. 1A, Supplementary Table S3, Supplementary Fig. S4A). In the iEDH group, only GFAP, t-tau, NSE, and UCH-L1 differed significantly from negative head CT cases (Fig. 1A). After excluding 227 patients with MEI, the same pattern persisted, with all biomarkers elevated in EDHcombined and EDHns, while only GFAP, t-tau, NSE, and UCH-L1 remained significantly higher in iEDH (Fig. 1B, Supplementary Fig. S4B). In the 227 patients with MEI, only GFAP was significantly higher in EDHcombined compared with negative scans (p = 0.007) (Supplementary Fig. S4B).
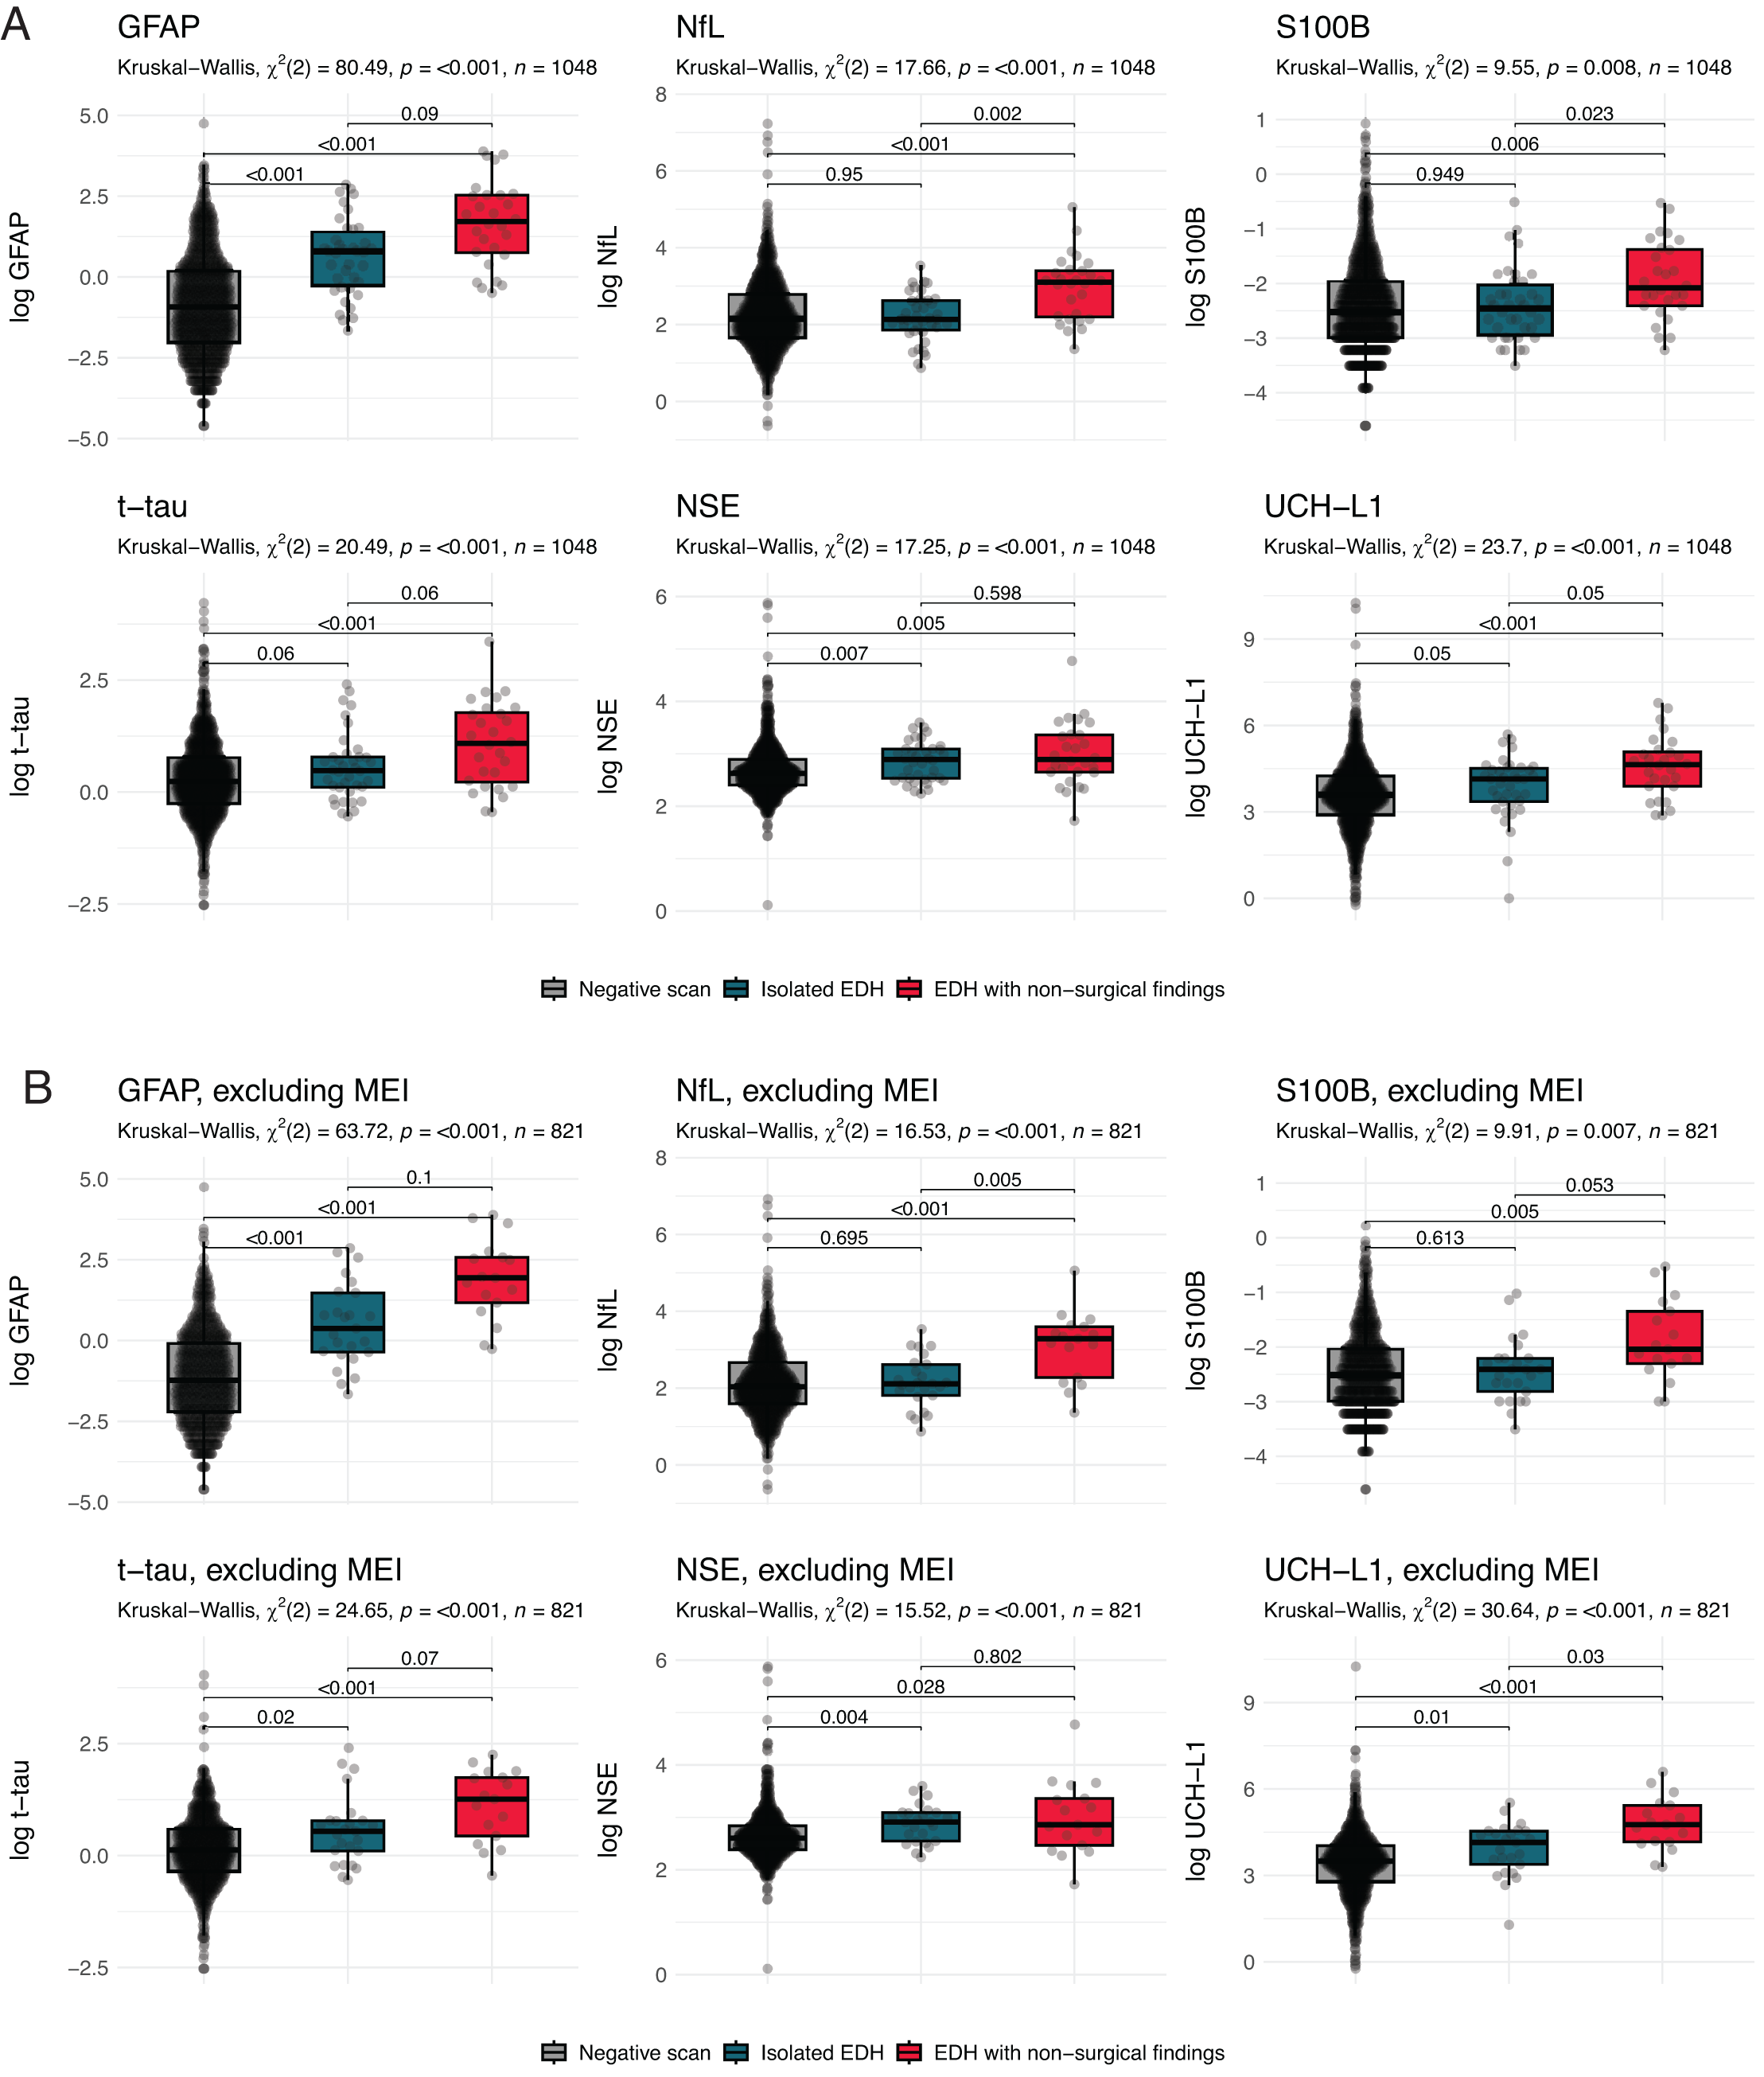
Boxplots of day 1 serum biomarker levels in all included patients with negative scans versus isolated epidural hematoma vs. epidural hematoma with nonsurgical findings
Diagnostic performance of biomarkers
GFAP exhibited the highest AUC for distinguishing EDHcombined (0.82, 95% confidence interval [CI] 0.78–0.87), iEDH (0.77, 95% CI 0.71–0.83), and clinically significant EDH (0.82, 95% CI 0.78–0.87) from negative CT findings (Fig. 2, Table 2). Among all biomarkers, discrimination was highest between negative head CT and EDHns (AUC range 0.67–0.89), likely due to the presence of TSAH, IVH, and DAI/TAI, while the lowest discrimination was between negative head CT and iEDH (AUCs 0.50–0.77). A GFAP cut-off of 0.19 μg/L, yielding the NPV of 1 for detecting EDHcombined or iEDH, classified 325/982 negative head CT patients below this threshold (specificity 33%; Supplementary Fig. S5, Table 2). For S100B, NPV of 1 was reached with a cut-off of 0.03 μg/L, only detecting 17 CT-negative patients below this threshold (specificity 2%).
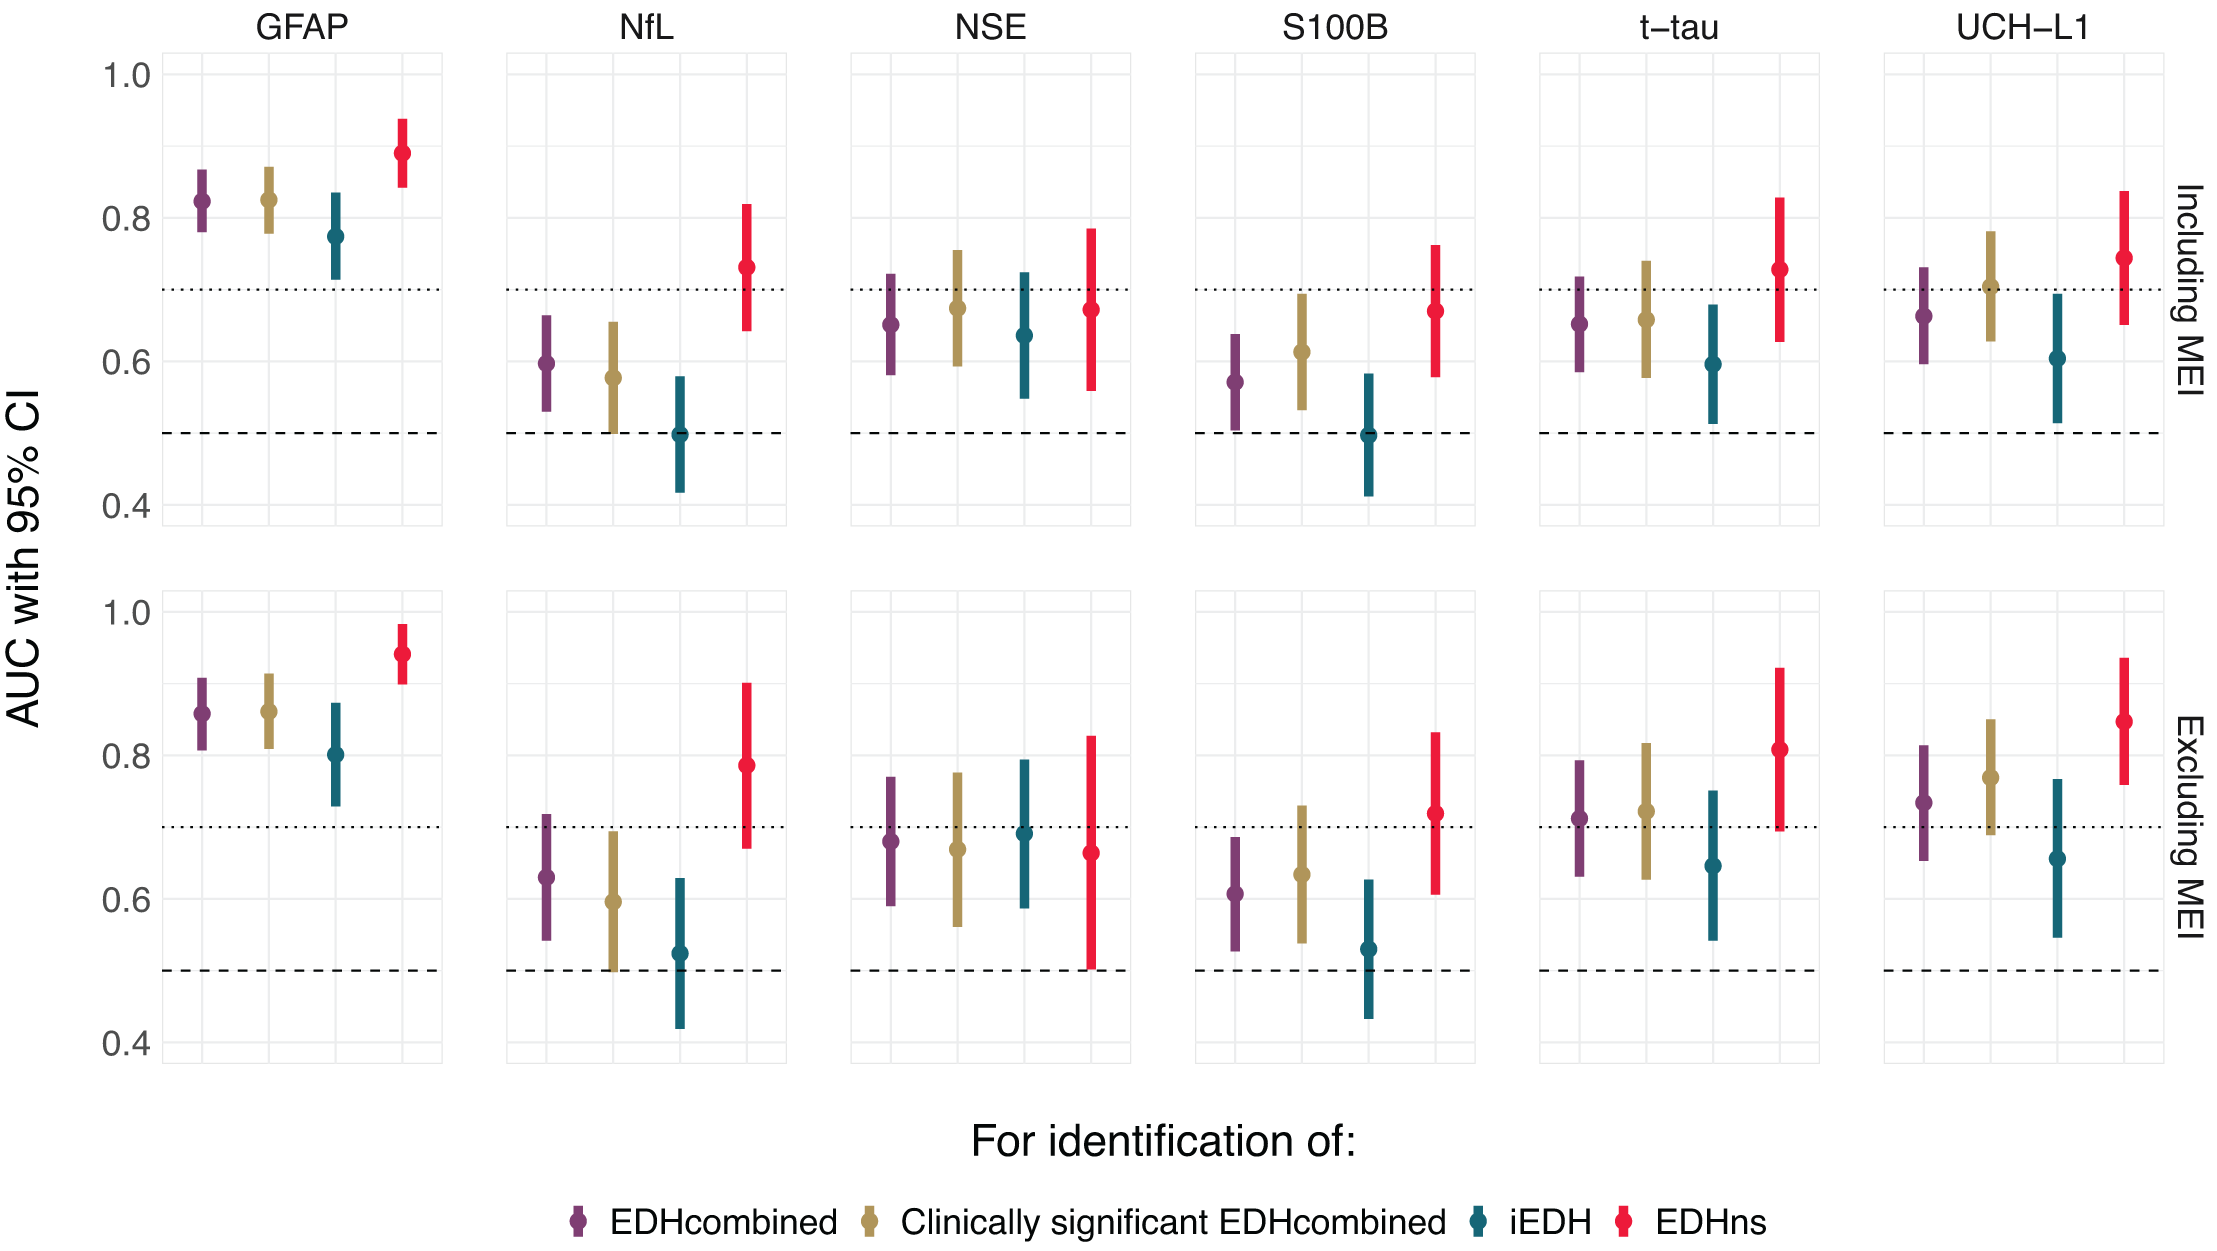
Discrimination of day 1 serum biomarker levels in differentiating between patients with negative scans versus epidural hematoma without other potentially surgical findings (EDHcombined), vs. clinically significant EDHcombined, vs. isolated epidural hematoma, vs. epidural hematoma with nonsurgical findings. AUC, area under the receiver operating characteristic (ROC) curve; CI, confidence interval; EDH, epidural hematoma; iEDH, isolated epidural hematoma; EDHns, epidural hematoma with nonsurgical findings; EDHcombined, epidural hematoma without other potentially surgical findings; GFAP, glial fibrillary acidic protein; MEI, major extracranial injury; NfL, neurofilament light; NSE, neuron-specific enolase; S100B, S100 calcium-binding protein B; T-Tau, total tau protein; UCH-L1, ubiquitin C-terminal hydrolase L1. CIs for AUCs were computed with the DeLong method.
Discrimination of Day 1 Serum Biomarker Levels in Differentiating Between Patients with Negative Scans vs. Epidural Hematoma Without Other Potentially Surgical Findings (EDHcombined), vs. Clinically Significant EDHcombined, vs. Isolated Epidural Hematoma, vs. Epidural Hematoma with Nonsurgical Findings
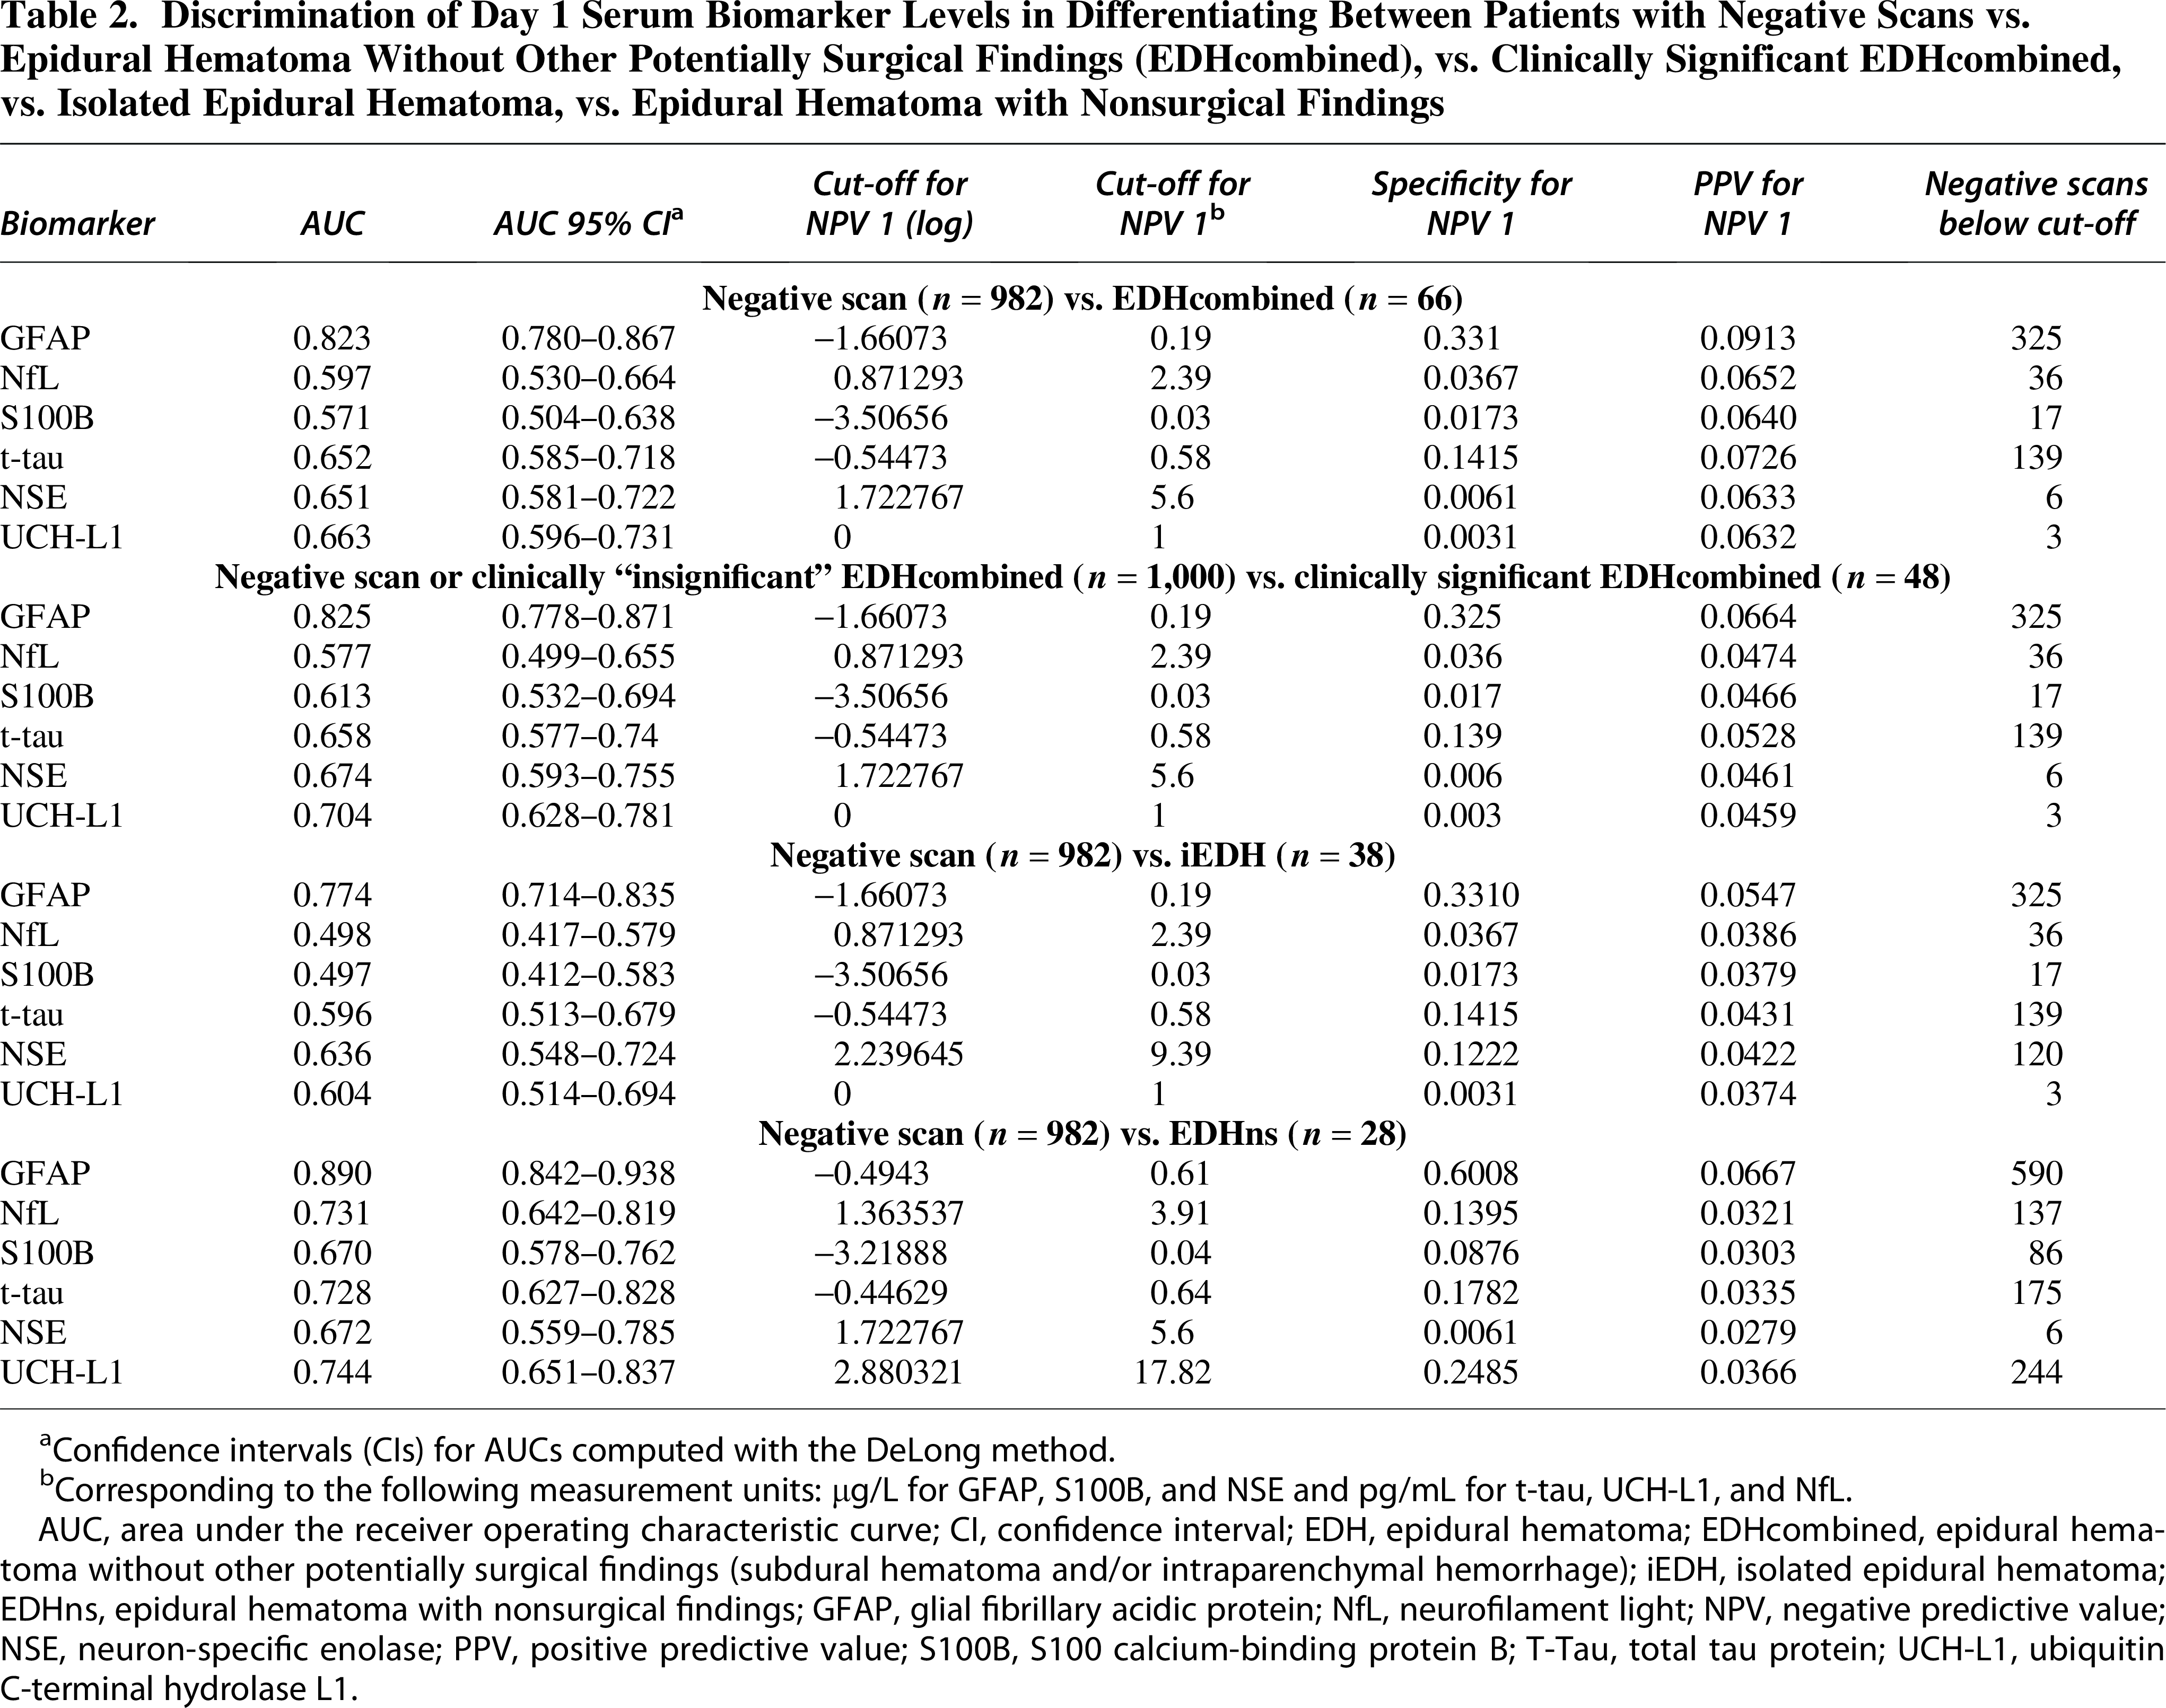
Confidence intervals (CIs) for AUCs computed with the DeLong method.
Corresponding to the following measurement units: µg/L for GFAP, S100B, and NSE and pg/mL for t-tau, UCH-L1, and NfL.
AUC, area under the receiver operating characteristic curve; CI, confidence interval; EDH, epidural hematoma; EDHcombined, epidural hematoma without other potentially surgical findings (subdural hematoma and/or intraparenchymal hemorrhage); iEDH, isolated epidural hematoma; EDHns, epidural hematoma with nonsurgical findings; GFAP, glial fibrillary acidic protein; NfL, neurofilament light; NPV, negative predictive value; NSE, neuron-specific enolase; PPV, positive predictive value; S100B, S100 calcium-binding protein B; T-Tau, total tau protein; UCH-L1, ubiquitin C-terminal hydrolase L1.
The overall diagnostic performance slightly improved for all six biomarkers after exclusion of patients with MEI (Fig. 2, Supplementary Table S4). GFAP retained the highest AUC for identifying EDHcombined (0.86, 95% CI 0.81–0.91), iEDH (0.80, 95% CI 0.73–0.87), and clinically significant EDH (0.86, 95% CI 0.81–0.91), while the strongest discrimination remained between negative CT and EDHns (AUC range 0.66–0.94) and the weakest for iEDH (AUC range 0.52–0.80). Importantly, the GFAP cut-off of 0.19 μg/L remained unchanged despite MEI exclusion (Supplementary Fig. S5, Supplementary Table S4).
Correlation with EDH volume
EDH volumes ranged 0.16–170 cm³ (median 4 cm³, IQR 1–13 mL, Table 1). Weak correlations were observed between EDH volume and biomarker levels (Spearman’s rho 0.05–0.22), with modeled associations being highly dependent on functional forms (Supplementary Fig. S6).
Five outliers were flagged across multiple biomarkers in multivariable analyses, including the largest EDH (170 cm³). Three had high biomarker levels despite small EDH volumes (4, 6, and 14 cm³) and later developed delayed contusions not visible on admission CT, with GFAP and UCH-L1 disproportionately elevated. The fifth case, with a 2 cm³ iEDH, had high S100B and t-tau, likely due to a concomitant cervical and thoracic spine injury (AIS 3).
Biomarker correlations and combined performance
UCH-L1 showed the highest correlations with other biomarkers, including GFAP (ρ = 0.55), S100B (ρ = 0.58), and t-tau (ρ = 0.59, Supplementary Fig. S7). Correlations were strongest in EDHns patients, particularly between GFAP and NfL (ρ = 0.76), GFAP and UCH-L1 (ρ = 0.73), t-tau and S100B (ρ = 0.77), UCH-L1 and S100B (ρ = 0.79), and UCH-L1 and t-tau (ρ = 0.77, Supplementary Fig. S7).
Combining GFAP and UCH-L1 marginally improved discrimination between negative CT and EDHcombined (AUC 0.83, 95% CI 0.79–0.87) compared with GFAP alone (AUC 0.82, 95% CI 0.78–0.87, Supplementary Fig. S8). However, due to UCH-L1’s low cut-off for NPV of 1, the combination triaged only two negative CT patients away from imaging, compared with 325 with GFAP alone (Supplementary Fig. S9).
Discussion
To our knowledge, this is the first study to specifically assess the diagnostic performance of blood-based biomarkers for identifying EDH in patients presenting with a GCS of 13–15, using a well-defined, prospectively enrolled multicenter cohort. Our results show that serum GFAP levels have high diagnostic performance to detect EDHcombined, iEDH, or any clinically significant EDH, irrespective of MEI. By contrast, S100B and NfL demonstrated poor ability to detect iEDH. The combination of GFAP and UCH-L1 discriminated between EDHcombined and CT-negative patients marginally better than GFAP alone. However, due to the low cut-off value of UCH-L1 with the highest NPV, the combination had poor specificity. Overall, these findings underscore the value of GFAP levels for CT triage in patients with mTBI with EDH.
Several factors affect the blood biomarker concentration difference in EDHs and other types of traumatic intracranial lesions. These factors may include the degree of compression of the brain parenchyma and diffusiveness of injury as well as the interaction with the CSF. 27 Compared with other traumatic intracranial lesions, EDH has the least interaction with the brain parenchyma, which is separated from the epidural space by the dura. Direct contact with the CSF, which is often absent in EDH, likely plays a role in the biomarker distribution. Nevertheless, EDHs can cause significant compression of brain tissue, potentially contributing to biomarker release into the circulation. In particular, up to 98% of EDHs (and 100% in our sample) occur with skull fractures, 3 and several biomarkers, including GFAP, S100B, and UCH-L1, are expressed in extracerebral tissues, which may contribute to their elevations.22,28–31
GFAP, an astrocytic protein, increases within 1 h of injury, peaks at 20–24 h, and remains detectable for up to 48 h. Previous studies suggest that GFAP performs better than S100B in triaging patients for CT scans after mTBI.16,32,33 This finding is in line with recent study by Whitehouse et al., 22 where GFAP was the only biomarker to be significantly raised in isolated EDH group. However, the ability of GFAP to identify EDH in patients presenting with a GCS of 13–15, who are the target population for biomarker-enhanced CT triage, has earlier remained nebulous.
In the current study, a GFAP cut-off value of 0.19 μg/L provided the NPV of 1 for ruling out EDH with a specificity of 33%, suggesting that GFAP-based triage may help avoid unnecessary CT scans in the future. This threshold (190 pg/mL), is substantially higher than the recently cited CT rule-out thresholds (22–65 pg/mL) on the Abbott platform. 14 The addition of UCH-L1 did not improve diagnostic accuracy, possibly due to the shorter half-life of UCH-L1 (7–9 h) compared with GFAP (24–48 h). 34
For all biomarkers, discrimination was highest in EDHns and lowest in iEDH, consistent with previous studies in which coexisting injuries are associated with increased biomarker concentrations.22,35,36 This likely reflects the parenchymal interaction, as EDHns includes nonsurgical lesions (e.g., TSAH, DAI) that may release larger quantities of biomarkers into the circulation. GFAP performed best for all EDH types, while S100B and NfL performed poorly in detecting iEDH, indicating that in EDHns patients they detect signal from nonsurgical lesions. In the small subset of included patients with concomitant MEI, only GFAP was significantly elevated in EDH cases compared with negative scans, suggesting that the other biomarkers may be capturing more signal from the extracranial injury than from the EDH itself. Discrimination generally improved for all biomarkers when excluding patients with MEI, indicating that EDH cases and controls are more difficult to differentiate in the presence of MEI. Further analyses of the contribution of extracranial injury to biomarker elevation and the impact on diagnostic performance are needed, accounting for both degree and region of injury.
The 2024 NINDS TBI Classification and Nomenclature Initiative Blood-based Biomarkers Working Group recommended FDA/CE-approved GFAP–UCH-L1 tests with cut-offs 22–65 pg/mL and 327–360 pg/mL, depending on assay types, respectively, to rule out traumatic intracranial findings in mTBI.14,15 In the current study, the GFAP cut-off for the highest NPV to identify EDHcombined or iEDH was 0.19 μg/L (190 pg/mL), even when excluding patients with MEI. This GFAP cut-off is well above prior recommendations, suggesting that GFAP may be a reliable clinical tool regardless of the intracranial injury type. Future research should evaluate whether GFAP-based triage algorithms can safely exclude clinically important intracranial injuries—including iEDH—in patients with mTBI, supporting their use in avoiding unnecessary imaging without compromising diagnostic safety.
Apart from GFAP and UCH-L1, only S100B has a defined cut-off value for clinical use. The Scandinavian Guidelines recommend using ≥0.10 μg/L to rule out intracranial traumatic findings in mild-low-risk patients. 9 According to our current study, however, this is too high a cut-off value. The NPV 1 value of S100B was at a cut-off of 0.03 μg/L, detecting only 2% of CT-negative patients below this threshold.
Contrary to expectations, EDH volume did not demonstrate clear dose–response patterns with biomarker levels in our data-driven analyses, which might have captured data idiosyncrasies in our small sample. Nevertheless, post hoc analysis of model outliers revealed increased biomarker concentrations for small EDHs with delayed contusions and extensive spinal injury, which likely elevated biomarkers independently.37,38
The strengths of our study include a large, well-characterized multicenter cohort and a comprehensive biomarker panel. To extend previous research, our study adds EDH-specific diagnostic performance with differentiated EDH endpoints, cut-offs for each biomarker, and sensitivity analyses in patients without MEI. However, limitations include the lack of ethnic diversity, potential variability between centers, and the inability to completely exclude the influence of postoperative sampling. In some cases, biomarker sampling occurred after EDH evacuation or extracranial surgery, which may have influenced biomarker levels. Although EDHs exert less parenchymal damage than other lesions, an increase due to the surgical procedure cannot be excluded. This limitation should be taken into account when interpreting our results. In addition, since most patients had blood drawn after the head CT, the ability of GFAP to guide imaging decisions in real time remains uncertain. Low numbers of EDH cases with biomarkers sampled within 6 h of injury precluded subgroup analyses to study the influence of sampling time on discrimination, which is likely influenced by different biomarker half-lives. Moreover, CENTER-TBI did not include patients who were not imaged despite presenting to the ED, exclusively enrolling patients with a clinical indication for CT scanning. A final limitation is that we used results from the Quanterix Neurology 4-Plex B platform, which is for research use only, and this may have resulted in cut-off values for GFAP, NfL, t-tau, and UCH-L1 that are not directly transferrable to a commercial assay. However, GFAP measurements are closely aligned between the Quanterix 4-Plex and Abbott Alinity TBI plasma test. 39
Conclusion
GFAP effectively identified patients with mTBI with EDHcombined, iEDH, and clinically significant EDHcombined, supporting its use in acute care to guide CT triage. The GFAP cut-off value of 0.19 μg/L had the highest NPV, also in the absence of MEI. This supports the role of GFAP in identifying rare EDHs, considering current recommendations. GFAP may aid in the early EDH detection but requires further validation across populations and platforms.
Transparency, Rigor, and Reproducibility Summary
The CENTER-TBI Core study was registered with ClinicalTrials.gov (NCT02210221). The current study was based on a prespecified and Management Committee-approved analysis plan (Proposal ID: RP092, available at https://www.center-tbi.eu/data/approved-proposals) using the CENTER-TBI dataset. Of 4,509 participants enrolled in the CENTER-TBI Core study, 1,048 adults with mild TBI (GCS score 13–15) who underwent head CT and had serum biomarker measurements within 24 h of injury were included. A total of 66 patients with EDH without other potentially surgical lesions (EDHcombined) were identified. Subgroups of iEDH and EDH with nonsurgical findings (EDHns) were defined based on co-occurring CT abnormalities. In addition to the radiological categories, we used an additional clinical category: A “clinically significant EDH” was defined as any above EDH type associated with neuroworsening, lesion progression on CT, ICP-directed therapy, neurosurgery, intracranial complications, or incomplete functional recovery, as indicated by a GOSE score below 8 at follow-up.
Serum levels of GFAP, UCH-L1, t-tau, NfL, S100B, and NSE were analyzed. GFAP, UCH-L1, t-tau, and NfL were measured using the Quanterix Simoa SR-X platform at the University of Florida (Gainesville, FL, USA). S100B and NSE were measured using a Roche Cobas 8000 modular analyzer at the University of Pécs (Pécs, Hungary). All laboratory technicians were blinded to clinical data. Imaging findings were interpreted centrally by trained assessors blinded to clinical information except age, sex, and care path stratum.
Outcomes were assessed locally using standardized protocols; 3-month and 6-month GOSE was centrally imputed when absent. Outcome instruments and validated translations used in the CENTER-TBI study are publicly available at https://www.center-tbi.eu/project/validated-translations-outcome-instruments. The timing of CT and blood sampling and presence of extracranial injuries were accounted for in the data-driven analyses of EDH volume and biomarker concentrations.
Handling of missing data and analytical approaches, including multivariable regression and receiver operating characteristic analyses, are detailed in the methods. Analyses focused on diagnostic performance and biomarker distributions by CT findings. Model coefficients and cut-off values are reported.
The deidentified CENTER-TBI dataset is available to qualified researchers upon submission of a methodologically sound proposal and approval by the CENTER-TBI Management Committee (application via https://www.center-tbi.eu/data). A data use agreement in line with GDPR and relevant regulations is required. Upon acceptance, this article will be published under a Creative Commons Open Access license and will be freely available via https://www.liebertpub.com/loi/neu.
Footnotes
Authors’ Contributions
Conceptualization: J.P.P., O.T., K.M., D.P.; Methodology: J.P.P., D.P.; Formal analysis: D.P.; Writing—original draft: K.M., D.P., J.P.P., I.H.; Investigation: D.P., K.M., J.P.P.; Writing—review and editing: K.M., D.P., I.H., M.M., T.v.E., T.M.L., S.M., R.S.K.T., O.T., T.V.V., R.V., J.K.Y., A.I.R.M., K.K.W.W., D.K.M., V.F.J.N., A.B., J.P.P.; Supervision: J.P.P.
Data Sharing Statement
Individual participant data will be available immediately after publication, conditional to an approved study proposal, with no end date. Data will be available to researchers who provide a methodologically sound study proposal that is approved by the management committee. Proposals can be submitted online at ![]() . A data access agreement is required, and all access must comply with regulatory restrictions imposed on CENTER-TBI.
. A data access agreement is required, and all access must comply with regulatory restrictions imposed on CENTER-TBI.
Author Disclosure Statement
T.M.L. has received speaker’s fees from Orion Corporation, Novartis Finland, and the Finnish Medical Society Duodecim. K.K.W.W. is a shareholder of Gryphon Bio, Inc., a CNS diagnostic company. D.K.M. has no direct conflicts of interest with the submitted work but reports the following relationships outside the current work: Consultancy and/or research grant support from NeuroTrauma Sciences, Lantmannen AB, GlaxoSmithKline Ltd., Integra Neurosciences, PressuraNeuro Ltd. V.F.J.N. holds investigator lead grants with Roche Pharmaceuticals and Abbott and has received in-kind support from Upfront Diagnostics for studies unrelated to this analysis. J.P.P. has received speaker’s fees from Sanofi S.A., the Finnish Medical Association, Wellbeing services county of North Karelia, and Finnish Association of Otorhinolaryngology—Head and Neck Surgery and travel expenses reimbursement and expert fee from the National Institute of Neurological Disorders and Stroke.
Funding Information
The research leading to these results was supported by the European Union’s Seventh Framework Programme (FP7/2007–2013) under grant agreement 602150 (CENTER-TBI). I.H. is supported by the Finnish Medical Foundation, the State Research Funding (VTR) of Finland, the Päivikki and Sakari Sohlberg Foundation, the Paulo Foundation, and the Orion Foundation. J.P.P. is supported by the Research Council of Finland and Sigrid Jusélius Foundation, and State Research Funding (VTR) of Finland. T.M.L. has accepted research grants from the Finnish Brain Foundation sr, the Emil Aaltonen Foundation sr, the Maire Taponen Foundation, the Science Fund of the City of Tampere, the Finnish Medical Society Duodecim, and the Research Council of Finland. D.K.M. is supported by the National Institute for Health and Care Research (NIHR, UK) through the Cambridge NIHR Biomedical Research Centre, and by the TBI-REPORTER Project, which is supported by a multifunder consortium consisting of: UK Research and Innovation, National institute for Health and Care Research; UK Department of Health and Social Care; UK Ministry of Defence; and Alzheimer’s Research UK. V.F.J.N. is supported by a National Institute for Health Research (NIHR) Rosetrees Trust Advanced Fellowship, NIHR302544, funded in partnership by the NIHR and Rosetrees Trust. The funders had no role in study design, data collection and analysis, decision to publish, or preparation of the article. The views expressed are those of the author(s) and not necessarily those of the above
Supplemental Material
References
Supplementary Material
Please find the following supplemental material available below.
For Open Access articles published under a Creative Commons License, all supplemental material carries the same license as the article it is associated with.
For non-Open Access articles published, all supplemental material carries a non-exclusive license, and permission requests for re-use of supplemental material or any part of supplemental material shall be sent directly to the copyright owner as specified in the copyright notice associated with the article.