
Abstract
Introduction
Declines in mobility can be an indication of changes in physical or mental health, yet are often unrecognized or underreported by older adults and their families. If detected early, underlying causes for these changes potentially could be addressed, preventing serious adverse outcomes such as disability, hospitalization, or death. Performance-based measures of mobility, such as gait speed, are predictive of hospitalization among older adults (Cesari et al., 2005) but can be cumbersome to administer. In such circumstances, self-reported measures can provide a practical alternative for assessing mobility.
Older adults often frame mobility in terms of participation in social activities (Baker, Bodner, & Allman, 2003). Life-space mobility quantifies this concept of community mobility by measuring the distance, frequency, and independence obtained as an older adult moves through his or her environment (Figure 1). In contrast to physical performance measures that do not capture mobility across the full continuum of function, life-space mobility measures movement through specific life-space levels ranging from within one’s bedroom to beyond one’s town and reflects social participation to the degree that mobility is associated with such activities (Sawyer & Allman, 2010). Life-space is correlated with physical performance and activities of daily living/instrumental activities of daily living (ADLs/IADLs) but is also influenced by factors such as demographics (including urban / rural residence), difficulty with transportation, cognition, and mood (Peel et al., 2005). Previous work has shown that decline in life-space predicts later health-related outcomes, including cognitive decline (Crowe et al., 2008), decline in ADLs (Bentley et al., 2013), and nursing home admission (Sheppard, Sawyer, Ritchie, Allman, & Brown, 2013). Decline in life-space is also associated with increased health care utilization (emergency department [ED] visits and hospitalizations) among individuals with heart failure after adjusting for sociodemographic factors and comorbidity (Lo et al., 2015), but it is unclear whether this extends to other populations.
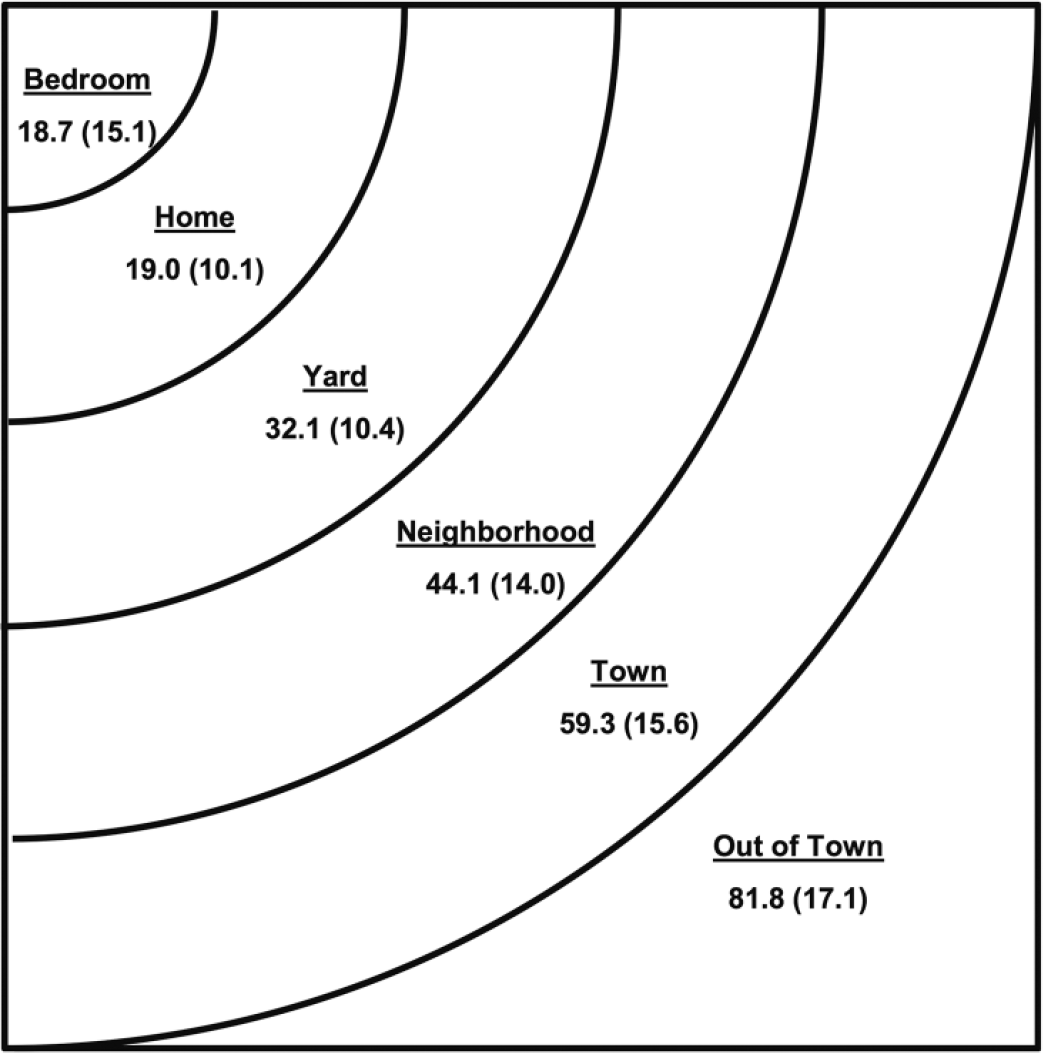
Life-space levels, which range from within one’s bedroom to beyond one’s town.
The University of Alabama at Birmingham (UAB) Study of Aging Life-Space Assessment (LSA; Figure 2) is a self-reported measure of mobility in the community. By measuring community mobility, the LSA provides a broader assessment of mobility than performance-based measures. It would also be more directly related to aspects of mobility that influence the course of chronic illness, such as the ability to visit the doctor or go to the pharmacy to fill prescriptions. The purpose of this study was to examine the association of life-space with rates of health care utilization among a community-dwelling sample of older adults. We have focused on ED visits and hospitalizations as the primary measure of health care utilization as these are highly salient to patients and their families and are highly relevant to health systems and providers as the costliest forms of health care.
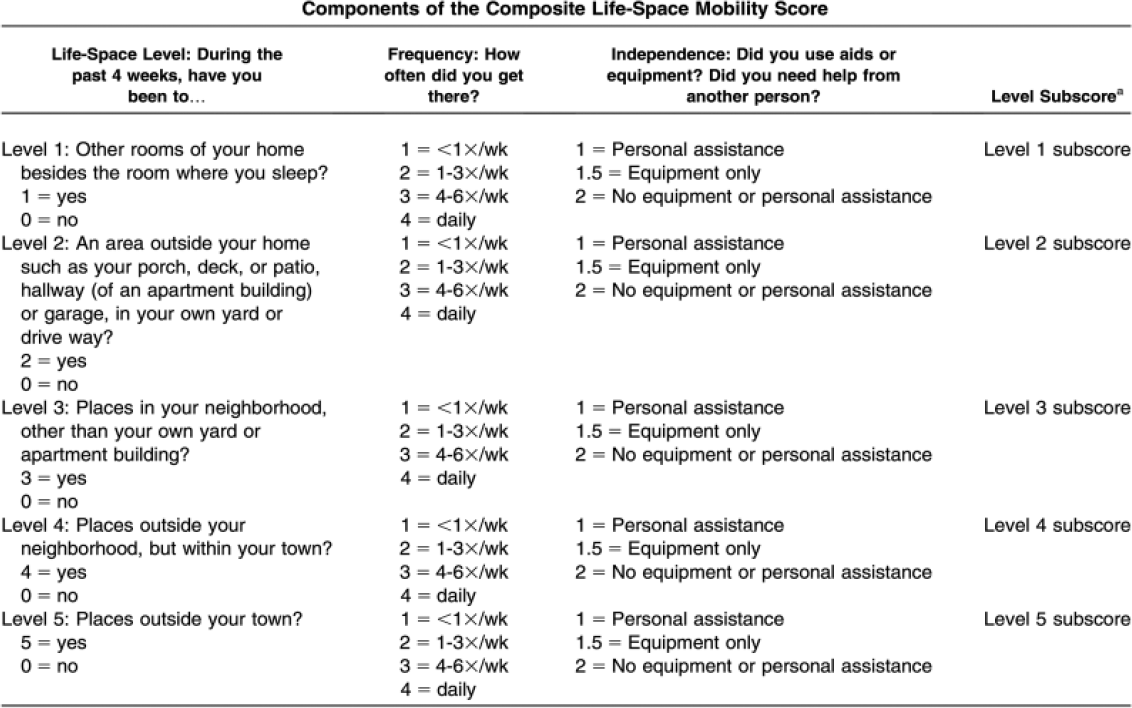
The Life-Space Assessment.
Method
Study Design
This is a secondary data analysis from the UAB Study of Aging II, a 3-year prospective cohort study of 419 community-dwelling older adults from 17 counties across the state of Alabama designed to understand subject-specific factors predisposing older adults to mobility decline.
Subjects
All subjects were drawn from the UAB Study of Aging II, who were recruited from two prior studies: (a) the UAB Study of Aging I (Allman, Sawyer, & Roseman, 2006), a stratified random sample of community-dwelling Medicare beneficiaries residing in central Alabama, designed to be 50% African American, 50% male, and 50% rural and (b) the State of Alabama Long Term Needs Assessment Survey (Charting the Course; Sawyer Baker & Allman, 2004), a sample of community-dwelling adults aged 55 years and older were recruited from publicly available data banks and screened to represent the state population by age, race, sex, and geographic region. From the original sample of 1,000 participants in the UAB Study of Aging I, 487 died, 148 were lost to contact, 64 did not meet inclusion/exclusion criteria, and 44 refused participation, yielding 257 participants who entered the Study of Aging II. From the original sample of 688 participants in Charting the Course, 207 died, 198 were lost to contact, 45 did not meet inclusion/exclusion criteria, and 76 refused participation, yielding 162 participants who entered the Study of Aging II. After obtaining informed consent for these 419 participants, in-home baseline interviews were conducted by trained interviewers between June 2010 and August 2011. Monthly follow-up telephone interviews were then conducted through August 2015. Inclusion criteria for the Study of Aging II were (a) age, 75 or older at baseline interview; (b) living independently in the community at baseline; and (c) able to set study appointments and answer questions by themselves. Individuals with mild cognitive impairment or mild dementia were not specifically excluded. Additional inclusion criteria for the present analysis were (a) at least one follow-up visit for assessing ED visits and hospitalizations. The study protocol was approved by the UAB Institutional Review board. All participants provided written informed consent for the study.
Measures
ED and hospital utilization
The number of ED visits and hospitalizations over the previous month was determined by self-report at each monthly follow-up interview. A single health care utilization outcome was created by combining ED visits and hospitalizations, which was then dichotomized as present or absent. This approach avoids difficulties in separating ED visits that do and do not lead to hospitalizations, particularly since most participants did not have more than one ED visit or hospitalization in a given month.
Life-space
The UAB Study of Aging LSA (Baker et al., 2003; Peel et al., 2005) is a validated measure of life-space mobility based on distance through which a person reports moving during the 4 weeks preceding the assessment. The composite measure of life-space mobility incorporates life-space level, frequency with which it is attained, and degree of independence, based on the reported use of assistive equipment or help from another person during the past 4 weeks. Life-space mobility subscores are obtained for each life-space level (1-5) by multiplying the life-space level by frequency and independence. Level subscores then are summed across levels to obtain the composite score (Figure 2). LSA composite scores range from 0 to 120 with higher scores representing greater mobility. We examined the effect of 10-point declines in life-space composite scores on outcomes based on the previously reported adjusted change in life-space (10.3 points) associated with nonsurgical hospitalizations (Brown et al., 2009). An example of a 10-point decline would be an older person who previously reported no assistance to go into the neighborhood daily and to town one to three times a week (e.g., 64 points) but who now requires a cane to go into town less than once a week (e.g., 54 points). The LSA has been shown to be reliable and sensitive to changes over time (Brown et al., 2009), and although persons may differ on how they define specific life-space levels such as “neighborhood,” these definitions are consistent over time for the individual (Bentley et al., 2013). Life-space was assessed at baseline and at each monthly follow-up interview over 3 years. Thus, participants who were alive and had no missing assessments could contribute up to 37 life-space scores to this analysis.
Sociodemographic factors
Age, gender, and race were self-reported at baseline interview. Locale was defined as urban or rural based on the population of the county of residence (Alabama Rural Health Association, 1998).
Comorbidity
A comorbidity score was calculated based on the Charlson Comorbidity Index (Charlson, Pompei, Ales, & Mackenzie, 1987), without consideration of severity, from data collected at baseline. Comorbidities were considered verified if the participant reported the condition and took medication for the condition, if the condition was reported on a questionnaire returned from the participant’s physician, or if the condition was noted on a hospital discharge summary.
Number of medications
At the baseline in-home visit, participants were asked to show the interviewer all prescriptions and over-the-counter medications that they currently used and a count of medications was determined.
Cognition
Cognition was assessed at the baseline interview using the Mini-Mental State Examination (MMSE; Folstein, Folstein, & Mchugh, 1975), which includes items related to orientation, registration, recall, attention, and visuospatial construction. Scores range from 0 to 30, with higher scores representing better cognition.
Depression
Depressive symptoms were assessed using the short form of the Geriatric Depression Scale (GDS; Yesavage & Sheikh, 1986) at the baseline interview. Scores range from 0 to 15; a score of 6 or higher suggests possible depression (Aikman & Oehlert, 2001).
Transportation difficulty
Transportation difficulty was defined as a positive response to the question “Over the past four weeks, have you had any difficulty getting transportation to where you want to go?” or “Do you limit your activities because you don’t have transportation?” in the baseline interview.
Statistical Analysis
Characteristics of participants with and without an ED visit/hospitalization were compared using chi-square tests for categorical variables and t tests for continuous variables. Generalized estimating equations (GEEs; Liang & Zeger, 1986) with a logistic link function were used to determine significant associations of life-space at the beginning of each monthly interval with health care utilization from the beginning to the end of the 1-month interval. Odds ratios (ORs) and corresponding 95% confidence intervals (CIs) were estimated for both unadjusted and adjusted models. Covariates included age at the time of interview, race, gender, urban/rural residence, Charlson comorbidity score, and having a doctor visit in the prior month. All analyses were conducted using SAS version 9.4.
Results
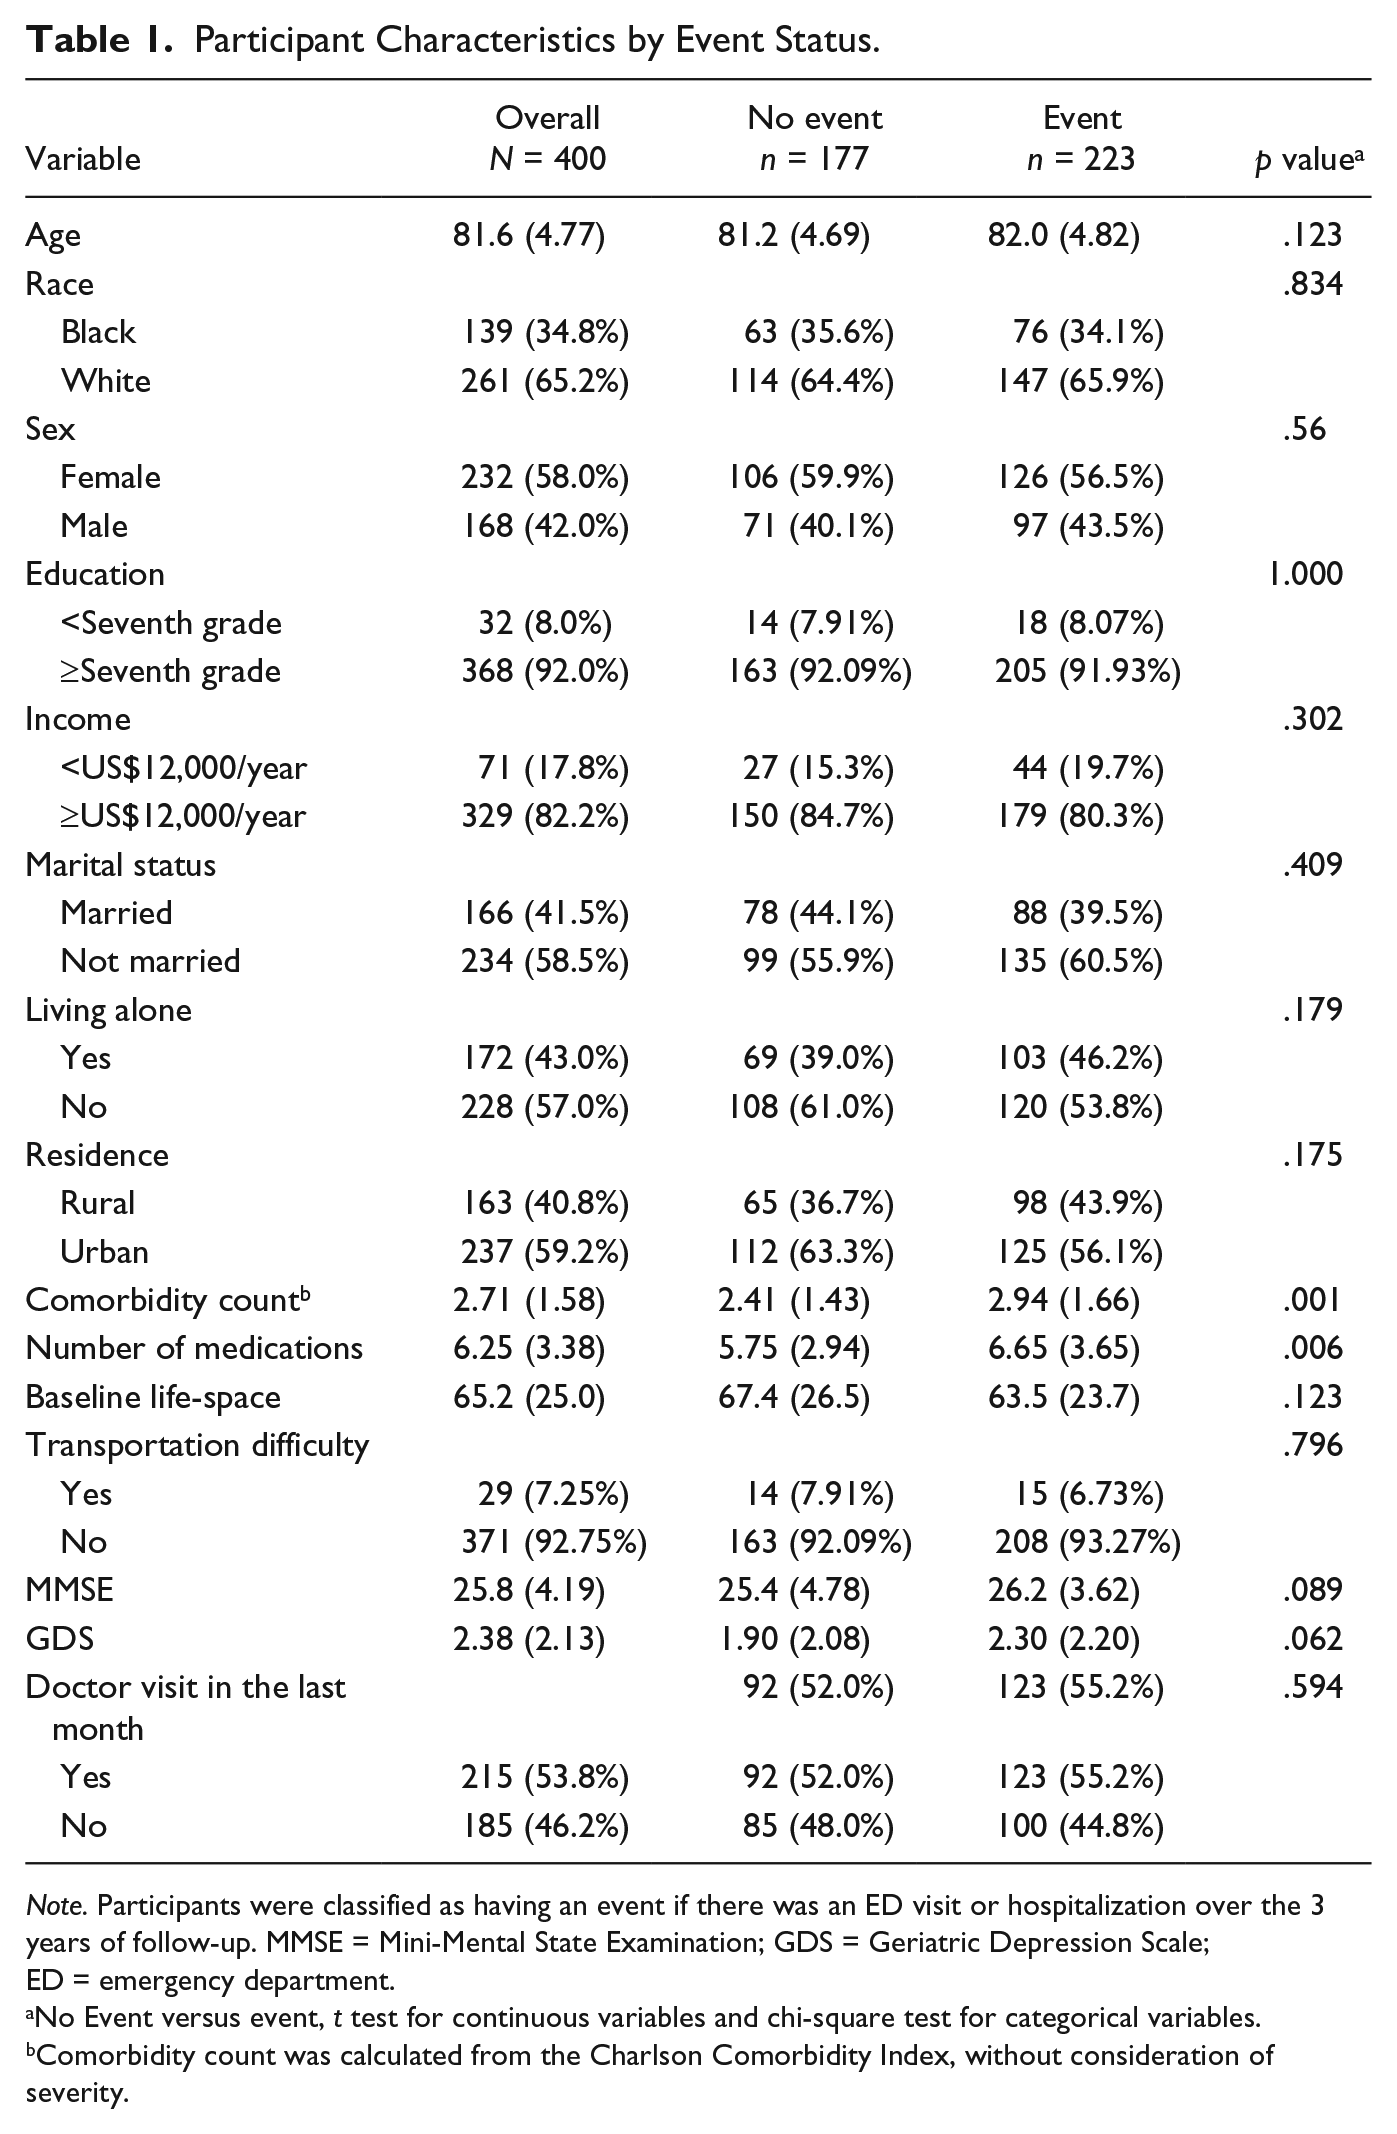
In-home baseline assessments were completed on 419 eligible older adults. Nineteen participants did not provide follow-up telephone assessments (seven withdrew from the study before telephone follow-up could be completed, three had been placed in a nursing home, and nine could not be reached). The remaining 400 participants are the focus of this analysis.
Sample characteristics are shown in Table 1. The average age of participants was 81.6 years (SD = 4.77), 58% were female, 34.8% were African American, 41.5% were married, and 43.0% were living alone. Only 8% had less than seventh grade education and 17.8% had an income of less than US$12,000 per year. The health status of participants reflected that of community-dwelling older adults, with a mean of 2.71 chronic health conditions (SD = 1.58) on the Charlson Comorbidity Index and a mean of 6.25 medications taken regularly (SD = 3.38). The mean MMSE score of 25.8 (SD = 4.19) is in the range for cognitively normal and the mean GDS of 2.38 (SD = 2.13) is in the range for no significant depressive symptoms. The mean baseline LSA score was 65.2 but with a wide range of scores (SD = 25.0). Approximately, 53.8% of participants had seen a doctor in the month prior to the baseline interview.
Participant Characteristics by Event Status.
Note. Participants were classified as having an event if there was an ED visit or hospitalization over the 3 years of follow-up. MMSE = Mini-Mental State Examination; GDS = Geriatric Depression Scale; ED = emergency department.
No Event versus event, t test for continuous variables and chi-square test for categorical variables.
Comorbidity count was calculated from the Charlson Comorbidity Index, without consideration of severity.
There were 223 individuals (55.8% of the sample) who had an ED visit or hospitalization over the 3-year follow-up and 177 who did not, which is similar to the rate in the national Medicare population (Krumholz, Nuti, Downing, Normand, & Wang, 2015). Participants who experienced an event were similar to those without an event on demographic measures, including age, race, gender, education, marital status, and rural residence. Participants with an event had both higher Charlson comorbidity score (2.94 vs. 2.41) and number of medications (6.65 vs. 5.75) than those without an event (both p < .01).
Life-space change could be calculated in 9,331 observations for which LSA scores were available at the beginning and the end of the 1-month period. Of these, 44.1% of the life-space changes were greater than or equal to 10 points. In unadjusted analyses, a 10-point decrease in life-space was associated with a 14% increased odds of an ED visit and/or hospitalization over the next month (OR = 1.142, 95% CI = 1.081, 1.207; Table 2). The risk was essentially unchanged after adjusting for demographics (OR = 1.170, 95% CI = 1.100, 1.245), transportation difficulty (OR = 1.162, 95% CI = 1.090, 1.239), and comorbidity and having a doctor visit in the last month (OR = 1.143, 95% CI = 1.072, 1.218). Rural residence (OR = 1.433, 95% CI = 1.105, 1.858) and comorbidity (OR = 1.182, 95% CI = 1.089, 1.282) were the only other significant predictors of health care utilization over the next month in the adjusted model.
GEE Models for Health Care Utilization.
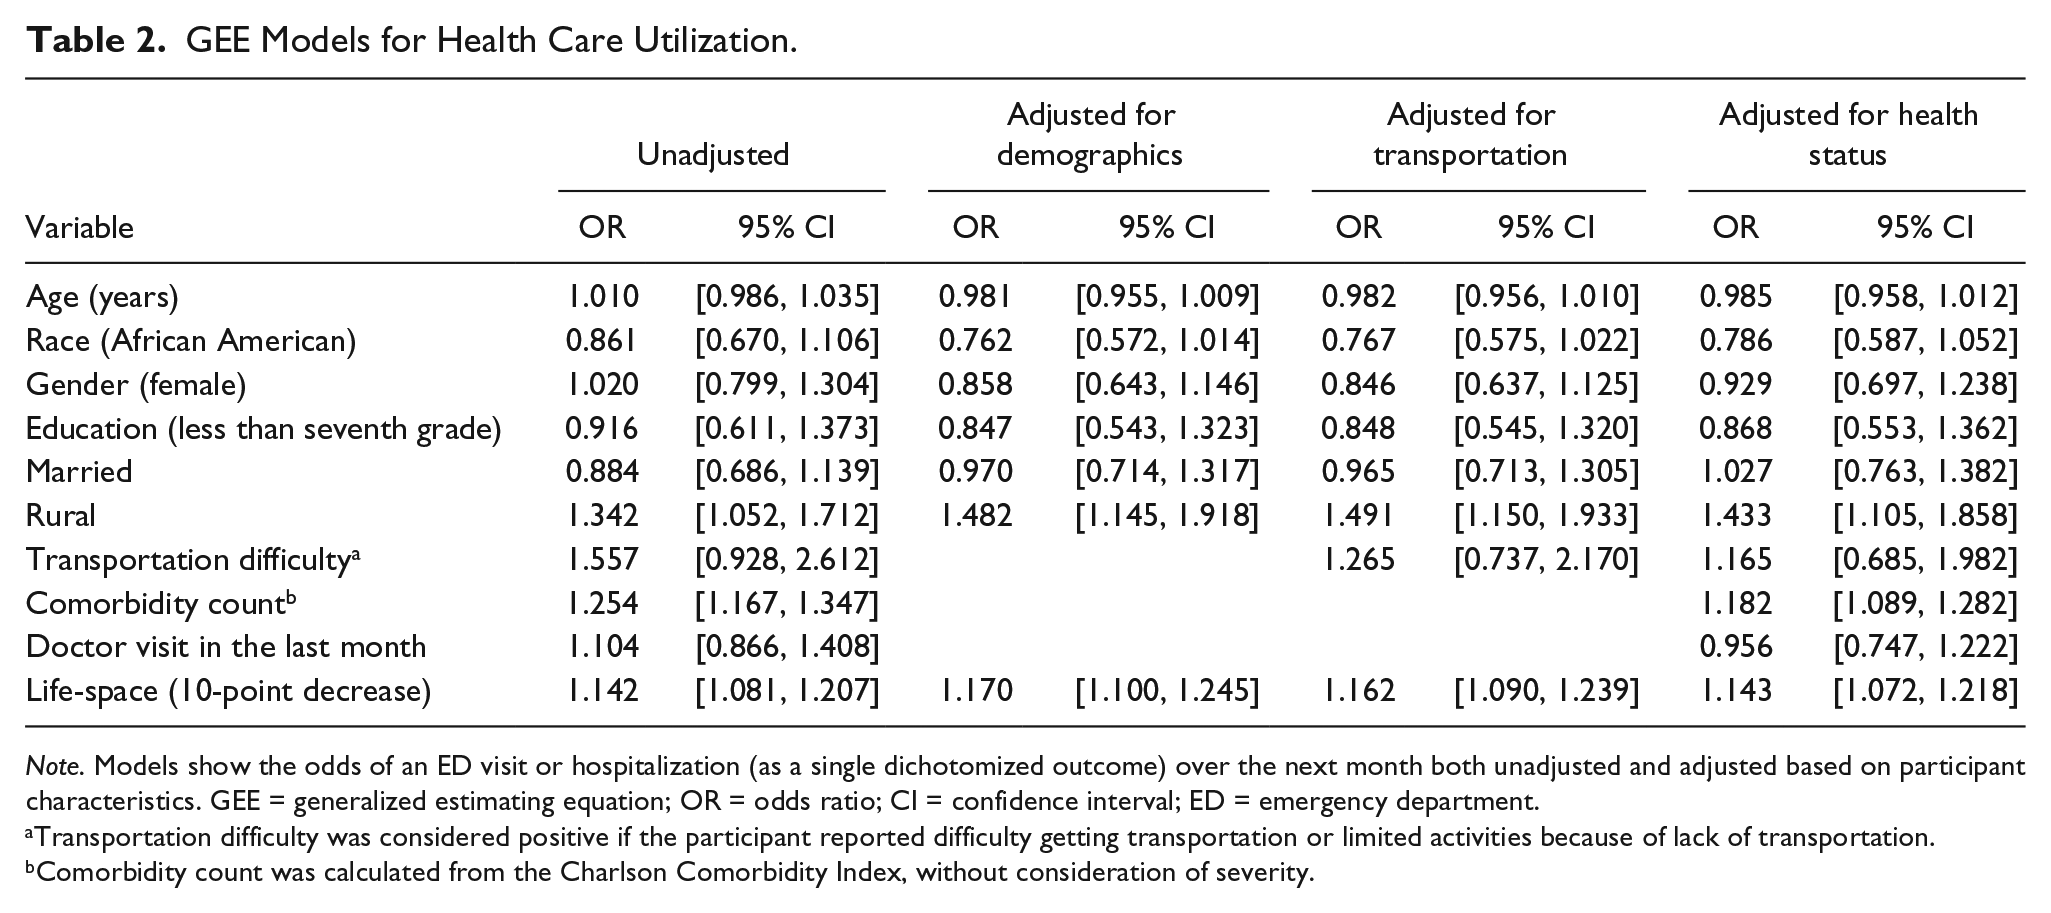
Note. Models show the odds of an ED visit or hospitalization (as a single dichotomized outcome) over the next month both unadjusted and adjusted based on participant characteristics. GEE = generalized estimating equation; OR = odds ratio; CI = confidence interval; ED = emergency department.
Transportation difficulty was considered positive if the participant reported difficulty getting transportation or limited activities because of lack of transportation.
Comorbidity count was calculated from the Charlson Comorbidity Index, without consideration of severity.
Discussion
In this study, we demonstrated that in community-dwelling older adults over age 75, a decrease in life-space predicted increased health care utilization over the next month. This association remained significant after adjustment for demographics and transportation difficulty. Furthermore, this increase in utilization did not appear to be due to insufficient outpatient care, as more than half of participants reported visiting their primary care doctor within the previous month. Outpatient visits in the prior month also did not have a significant effect on the risk of ED visits or hospitalizations. The association between life-space and health care utilization remained significant after adjusting for baseline comorbidity, indicating that life-space captures factors related to health care utilization beyond disease burden.
These results clarify that our previously observed association between life-space and health care utilization among individuals with heart failure (Lo et al., 2015) is not restricted to that population but applies to older adults generally. It also shows that life-space can predict increases in health care utilization over intervals as short as 1 month. This raises the intriguing possibility that monitoring of life-space can alert providers to patients who could benefit from additional outpatient follow-up to reduce potentially avoidable ED visits and hospitalizations. Furthermore, the increasing use of personal monitoring devices suggests that assessment of life-space mobility by electronic means could be used to identify patients needing additional services. However, as our analysis could not distinguish between avoidable and unavoidable hospitalizations, further research on this topic is needed.
Life-space is a practical alternative to performance-based measures of mobility, which can be difficult to incorporate into clinical or public health practice due to insufficient time, inadequate space, and need for special equipment (Cesari, 2011). Life-space is easily assessed either in person or by telephone. Life-space is also influenced by psychosocial factors that are relevant to health care utilization, including income, transportation, cognition, and depression (Peel et al., 2005). However, our analysis did not have concurrent measurement of life-space and physical performance measures for direct comparison, and future studies to address this are warranted.
Our study has several strengths, including a large sample size followed at frequent intervals with little loss to follow-up. Despite these considerable strengths, there are weaknesses that must be acknowledged. First, LSA scores were collected at monthly intervals, so there may be other unmeasured factors during that interval accounting for increased health care utilization. Second, health care utilization was collected from participant self-reports rather than verified records. However, self-report of hospitalizations is generally seen as accurate, particularly over short time periods (Lubeck & Hubert, 2005). Third, participants were only from Alabama and may not generalize to other regions, although this sample is believed to be representative of the population in much of the Southeastern United States, where 50% of older African Americans live. Fourth, participants were limited to Caucasians and African Americans, so results may not be applicable to other racial and ethnic groups.
In summary, life-space is a useful measure of mobility in the community and predicts short-term increases in health care utilization by older adults. Assessment of life-space in this population can provide a broad overview of health and physical function in primary care practices and in epidemiological studies.
Footnotes
Declaration of Conflicting Interests
The authors declared no potential conflicts of interest with respect to the research, authorship, and/or publication of this article.
Funding
The authors disclosed receipt of the following financial support for the research, authorship, and/or publication of this article: This study was supported in part by a grant from the National Institute on Aging (R01 AG015062) to CJB. The funding sources had no role in the design and conduct of the study; collection, management, analysis, and interpretation of the data; preparation, review, or approval of the manuscript; and decision to submit the manuscript for publication.