
Abstract
People are quick to perceive meaningful patterns in the co-occurrence of events. We report two studies exploring the effects of streaks in symptom checklists on perceived personal disease risk. In the context of these studies, a streak is a sequence of consecutive items on a list that share the characteristic of being either general or specific. We identify a psychological mechanism underlying the effect of streaks in a list of symptoms and show that the effect of streaks on perceived risk varies with the length of the symptom list. Our findings reveal a tendency to infer meaning from streaks in medical and health decision making. Participants perceived a higher personal risk of having an illness when presented with a checklist in which common symptoms were grouped together than when presented with a checklist in which these same symptoms were separated by rare symptoms. This research demonstrates that something as arbitrary as the order in which symptoms are presented in a checklist can affect perceived risk of disease.
The ability to distinguish meaningful patterns from meaningless coincidences is a vital part of human cognition (Feldman, 2004; Griffiths & Tenenbaum, 2007). However, the mind is often too quick to infer meaning from coincidences (Gilovich, 1993; Nickerson, 2004; Olivola & Oppenheimer, 2009). People expect random processes to result in fewer repetitions of the same event than they actually do—the gambler’s fallacy (Falk & Konold, 1997; Nickerson, 2002; Oskarsson, Van Boven, McClelland, & Hastie, 2009). Underestimating the occurrence of streaks (i.e., when a characteristic is repeated in consecutive events) of random or arbitrary events is so prevalent that it shapes the way people generate lists of outcomes for random events (Tune, 1964; Wagenaar, 1972), categorize repeated events (Ayton & Fischer, 2004), and reason about repeated events, both prospectively (Morrison & Ordeshook, 1975) and retrospectively (Matthews, 2010; Olivola & Oppenheimer, 2008; Oppenheimer & Monin, 2009).
Studies suggest that reasoning about event co-occurrences can affect medical judgment. Some findings show that physicians underestimate the likelihood of separate medical conditions co-occurring in the same patient (Redelmeier, Tan, & Booth, 1998). Other findings suggest that the tendency to overweigh coincidental co-occurrences leads to medical false alarms, such as the perception of illusory cancer epidemics (Gawande, 1999), and to erroneous causal associations, such as those between weather conditions and the intensity of arthritis pain (Redelmeier & Tversky, 1996) or between the measles-mumps-rubella vaccination and autism (Olivola & Oppenheimer, 2009).
The Internet is a widely used source of health information for the public. In 2009, 61% of American adults looked online to find health information (Pew Internet & American Life Project, 2009; Rutten, Moser, Beckjord, Hesse, & Croyle, 2007). Research is needed to understand how the presentation of information on Web pages about health influences laypeople’s assessments of their medical symptoms.
We began the research reported here by surveying the formats used to present disease symptoms online. First, we identified the top five health-information Web sites produced by a Google search for “cancer”: cancer.org (the American Cancer Society, ACS), cancer.gov (the National Cancer Institute, NCI), WebMD, MedicineNet.com, and the New York Times Health Guide. We then conducted pilot studies to identify the formats used by these sites to present information on the individual Web pages for the 12 forms of cancer that were most deadly in 2008 (American Cancer Society, 2009). We found that these Web sites presented a mix of general symptoms (i.e., symptoms that are common and mild, frequently experienced, and considered minor) and specific symptoms (i.e., symptoms that are rare and severe, seldom experienced, and considered major), and that both types of symptoms were listed in streaks. 1
Given the human tendency to ascribe meaning to streaks, reading about multiple general symptoms consecutively (as commonly happens) may heighten people’s perception of their risk of disease. Furthermore, people judge self-experienced coincidences to be more surprising and therefore more meaningful than the same coincidences experienced by other people (Falk, 1989). This bias could be a mechanism behind a possible effect of streaks on perceived personal risk when people are evaluating their own symptoms.
Overview of the Studies
In two studies, we examined whether the order in which symptoms are presented on a checklist influences assessments of disease risk. In Study 1, we investigated whether participants perceived their cancer risk to be higher when they completed a symptom checklist that presented streaks of general symptoms and streaks of specific symptoms than when they completed a checklist that presented general and specific symptoms in alternation. The results of Study 1 allowed us to identify a mechanism underlying the effect of the order of symptom presentation on perceived risk. Study 2 examined whether this effect varied with the length of the symptom list.
Study 1: Order of Symptom Presentation
In Study 1, we tested whether the order in which general and specific symptoms are presented on a checklist affects participants’ subsequent assessment of their cancer risk. We predicted that individuals would perceive their level of risk to be higher when they were given symptom lists in which general symptoms appeared in a streak than when they were given a list with alternating general and specific symptoms. We believed that this effect would occur as a result of the experience of checking off several general symptoms in a row.
Designing this study required consideration of what constitutes a streak. Studies have found that people perceive a streak after an event repeats three or four times (Carlson & Shu, 2007; Gold, 1997). One functional MRI study even found a significant hemodynamic neural response following just one repetition (two occurrences) of an outcome (Huettel, Mack, & McCarthy, 2002). Thus, the number of repetitions required to form a streak is low but does vary. Context must be considered when predicting the number of repetitions needed to qualify as a streak: Given the high stakes of the medical context we used in our studies, we expected that this threshold would be low, as participants would err on the side of caution when judging the significance of their symptoms. We therefore chose to present a streak of three items for this study.
This study also explored whether presenting checklist symptoms in streaks affects respondents’ perception of which symptoms they have. We reasoned that a streak of general symptoms on a list would increase the likelihood of checking off a streak of symptoms (because they were actually experienced), which in turn might lower the threshold for checking off subsequent symptoms. Consequently, we predicted that the number of checked symptoms would be higher when general and specific symptoms were presented in streaks than when they were presented in alternation.
Method
One hundred nineteen students (48% female and 52% male) from a university in the northeastern United States were presented with screening information about a fictional kind of thyroid cancer (“isthmal”). We chose a fictional thyroid cancer because (a) participants could not have prior knowledge about and experience with the disease, (b) thyroid cancers can develop in people of any age or gender, and (c) thyroid disorders are associated with a mix of general and specific symptoms.
Both NCI’s and ACS’s Web pages presented six symptoms for thyroid cancer. We therefore followed suit, creating six-symptom checklists in three presentation orders. The general-to-specific checklist listed three general symptoms and then three specific symptoms. The specific-to-general checklist listed three specific symptoms and then three general symptoms. Symptoms in the alternating checklist alternated between general and specific (again, three symptoms of each type). All three checklists presented the same six symptoms. The general symptoms were fluctuations in weight, shortness of breath, and feelings of being easily fatigued. The specific symptoms were pain in the throat or neck, difficulty breathing, and lump in the throat or neck. 2
Participants were instructed to check off the symptoms they had experienced in the past 6 weeks and then to estimate how likely they were to have isthmal thyroid cancer compared with the average American. Responses were given on a 6-point Likert scale that ranged from 1 (much less likely) to 6 (much more likely). For each participant, we calculated the average check-streak length by summing the number of checks in all streaks (i.e., two or more consecutive checks) and then dividing by the number of check streaks that occurred. For example, if “X” represents a check and “0” denotes no check, then the sequence X00XX0 would have an average check-streak length of 2 (i.e., 2/1), whereas the sequence XX0XXX would have an average check-streak length of 2.5 (i.e., (2 + 3)/2).
Results
As predicted, we found a significant effect of the order of symptom presentation on perceived disease risk, F(2, 114) = 4.74, p = .011, η p 2 = .08 (Fig. 1a). Whereas perceived risk did not differ between participants in the two streak conditions (p = .605), participants in the alternating condition reported lower levels of personal risk than did participants in either the general-to-specific condition (p = .047) or the specific-to-general condition (p = .009).
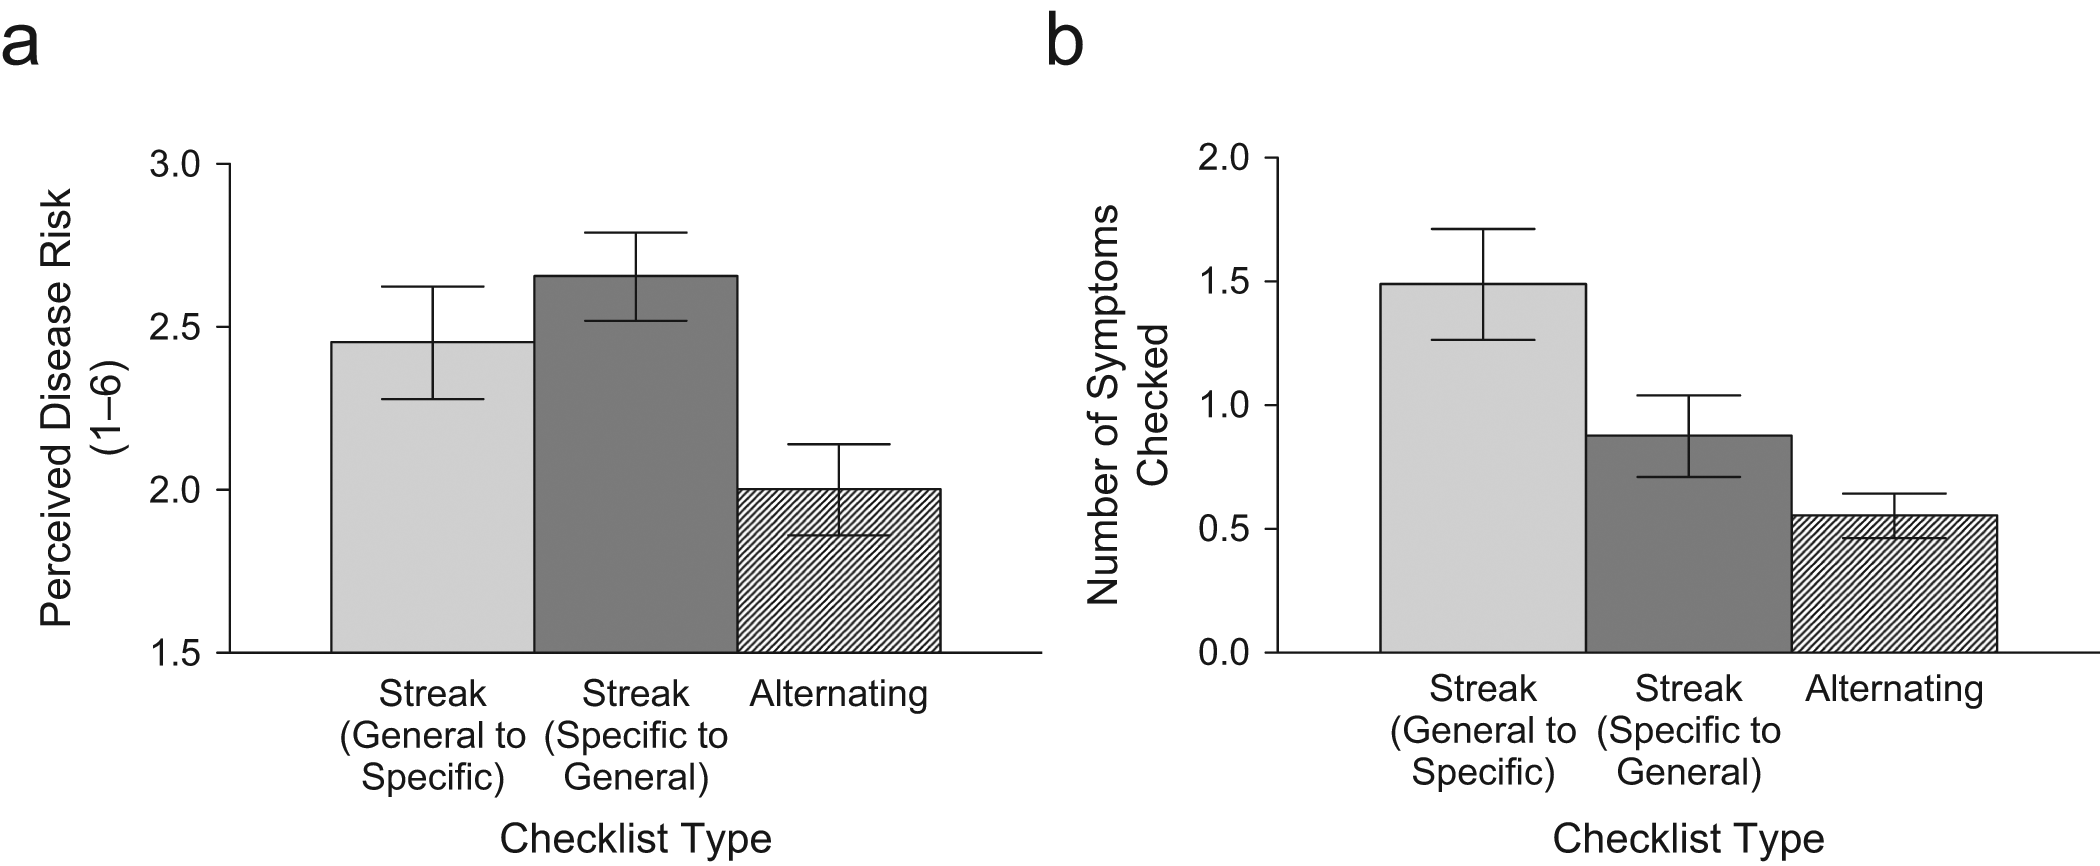
Results from Study 1: mean perceived personal risk of having isthmal thyroid cancer (a) and mean number of symptoms checked (b) as a function of the order in which symptoms were presented on the checklist. Participants rated their perceived disease risk on a 6-point scale, with higher values representing higher risk. Error bars represent standard errors of the mean.
We then conducted a series of regression analyses to examine the mediating role of check-streak length. First, we found that order of symptom presentation was associated with average check-streak length, such that the two streak conditions produced longer check streaks than did the alternating condition (β = 0.31, R2 = .10, p = .001). Order of symptom presentation was again associated with perceived risk (i.e., exposure to streaks rather than alternating symptoms predicted higher perceived risk; β = 0.18, R2 = .03, p < .05). We also found that check-streak length was associated with perceived risk, such that longer average check streaks predicted higher risk ratings (β = 0.35, R2 = .12, p < .001). Finally, when we regressed perceived risk on average check-streak length and order of symptom presentation, we found that average check-streak length was a significant predictor of perceived risk (β = 0.33, p < .001), but order of symptom presentation was not (β = −0.08, p > .05; overall model R2 = .13, p < .001).
Thus, order of symptom presentation did not remain a significant predictor of perceived risk when average check-streak length was accounted for, a finding that suggests that the relationship between the order of symptom presentation and perceived personal risk is mediated by check-streak length (Sobel test: z = −2.63, p = .008). These findings illustrate that individuals given symptom checklists with streaks of common symptoms check off longer streaks of symptoms than do individuals given checklists without such streaks, and this exposure to streaks increases respondents’ perception of their own likelihood of having the disease in question.
We also found that the order of symptom presentation influenced the total number of symptoms checked, F(2, 116) = 7.66, p = .001, η p 2 = .12 (Fig. 1b). Participants in the alternating condition checked fewer symptoms (M = 0.55, SD = 0.55) than did participants in either the general-to-specific condition (M = 1.49, SD = 1.43; p = .001) or the specific-to-general condition (M = 0.88, SD = 1.04; although this latter difference was in the hypothesized direction, it did not reach significance, p = .390). Additionally, the total number of symptoms checked differed between participants in the two streak conditions, p < .05. These findings suggest that people lower their threshold for deciding whether they have experienced a given symptom when they are presented with a symptom list that begins with a streak of commonly experienced symptoms (i.e., general-to-specific condition). In contrast, people who are given a checklist that begins with a streak of severe, rare symptoms are less likely to check the symptoms at the beginning of the list, and their threshold for reporting a symptom may not decrease as much.
Study 2: Length of Symptom List
The number of symptoms listed varies across medical Web pages. Our review showed that half of the 24 cancer Web pages on the NCI and ACS sites presented 4 to 9 symptoms, whereas the remaining half presented 10 to 19 symptoms. This variation depended partly on the type of cancer. Streaks are more surprising when they occur within shorter sequences (Olivola & Oppenheimer, 2008; Oppenheimer & Monin, 2009); therefore, the order of symptom presentation may have a more powerful influence in the case of shorter symptom lists.
Intuitively, once a symptom is checked, it becomes relevant to one’s personal risk assessment, whereas symptoms left unchecked become seemingly irrelevant. However, as research concerning dilution effects suggests, using only the categories of “relevant” and “irrelevant” might be an incomplete framework for understanding mental sorting (Hackenbrack, 1992; Highhouse, 1997; Kemmelmeier, 2004). Checked symptoms should indicate a greater disease risk, whereas symptoms left unchecked should indicate a lower disease risk, rather than being considered irrelevant. If given symptom lists with a comparable mix of general and specific symptoms, individuals would on average leave more items unchecked on longer symptom lists than on shorter symptom lists. Therefore, we predicted that individuals given shorter symptom lists would perceive higher levels of risk than would those given longer lists because they would have fewer unchecked symptoms. Additionally, in this study, we used a real form of cancer (meningioma) instead of a fictitious one so that we could generalize the findings of Study 1 to a different context.
Method
One hundred two students (48% female and 52% male) from a university in the northeastern United States received information about meningioma before being randomly assigned to one of six conditions in a 2 (length of symptom list: short or long) × 3 (order of symptom presentation: general to specific, specific to general, or alternating) between-subjects design. The symptom lists in the short-list condition included 6 symptoms, and the symptom lists in the long-list condition included 12 symptoms. We conducted a pilot study to determine the 6 symptoms rated the most common and mild and the 6 rated the most rare and severe from among those listed for meningioma on the NCI and ACS Web pages. These 12 symptoms formed the symptom lists in the long-list condition. We selected half of these symptoms for the short-list condition while ensuring that the long and short lists were comparable overall in severity and commonness of symptoms. Participants were given the checklist corresponding to their assigned condition and asked to complete it. They then indicated their perceived risk of having meningioma, using the same 6-point scale as in Study 1.
Results
We found a significant interaction between presentation order and symptom-list length, F(2, 95) = 4.17, p = .018, η p 2 = .08 (Fig. 2). To probe this interaction, we performed a separate one-way analysis of variance for each length condition. Presentation order had a significant effect on perceived risk among participants who received a 6-item list, F(2, 52) = 5.27, p = .008, η p 2 = .17. A post hoc comparison using the Tukey honestly significant difference test indicated that participants in the short-list condition perceived their personal risk as significantly lower in the alternating condition than in either the general-to-specific (p = .04) or the specific-to-general (p = .008) condition. Risk ratings did not differ between participants in the general-to-specific and specific-to-general conditions (p = .720). These findings replicate those of Study 1.
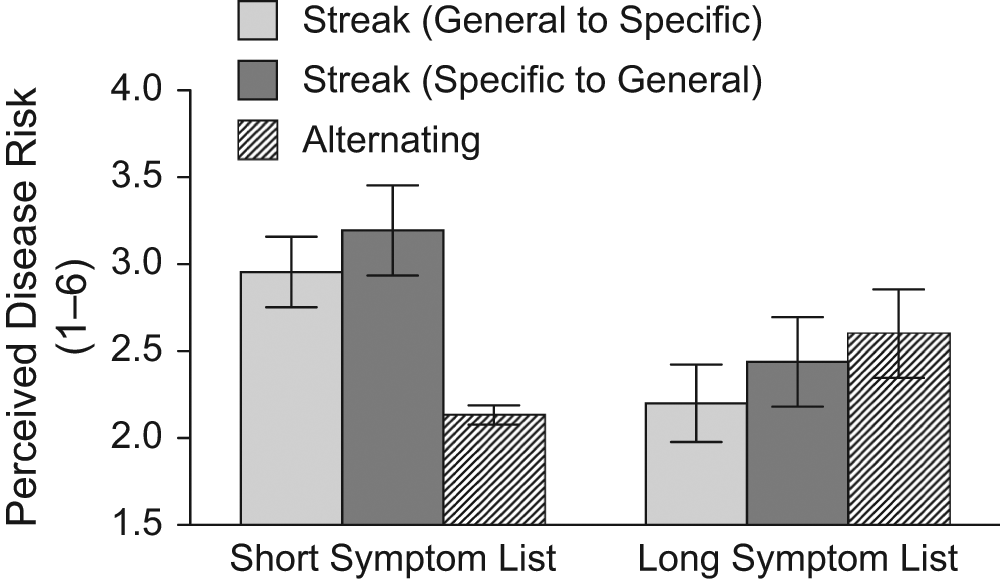
Results from Study 2: mean perceived personal risk of having meningioma as a function of the order of symptom presentation and the number of symptoms listed. Participants rated their perceived disease risk on a 6-point scale, with higher values representing higher risk. Error bars represent standard errors of the mean.
In contrast, participants who were given a 12-symptom list showed no effect of presentation order on perceived risk, F(2, 43) = 0.65. That is, in the long-list condition, risk assessment did not differ significantly across the three symptom presentation orders.
General Discussion
Our findings revealed something akin to a gambler’s fallacy in medical judgment. Participants perceived a higher risk of illness when they completed a checklist in which general symptoms were presented consecutively than when those same symptoms were separated by rare symptoms. Additionally, we observed a dilution effect: The effect of presentation order on perceived risk was not significant for longer symptom checklists. Together, our findings illustrate that faulty randomness cognition (i.e., hot-hand beliefs and the gambler’s fallacy) can result in something as arbitrary as symptom presentation order influencing the perceived risk of disease.
This research provides a better understanding of the potential effect of publicly available cancer information on risk assessments. People increasingly rely on online checklists for early evaluations of personal disease risk and potential symptoms. Our studies illuminate one reason why subjective risk estimates are highly variable. Also, by identifying two components of presentation design that affect risk assessment, these results provide a basis for making changes to future designs of symptom presentation media.
The implications of our findings extend beyond cancer symptoms to other contexts, such as the presentation of health-related information during periods of increased disease risk (e.g., flu season). For example, in 2009, the U.S. government declared the N1H1 influenza outbreak a public-health emergency and released valuable information about when to seek medical attention. In such situations, the government may have multiple goals in releasing information: (a) to increase the timely utilization of medical services in order to prevent serious illness or death and reduce further infection and (b) to conserve medical resources by reducing panic-driven, unnecessary use of medical care. According to our findings, if the goal is to encourage people to seek medical attention, symptoms should be presented in a short list with general symptoms grouped together. If the opposite goal is sought, however, then alternating general and specific symptoms is desirable.
Footnotes
The authors declared that they had no conflicts of interest with respect to their authorship or the publication of this article.