
Abstract
How does the mind grow? Despite centuries of philosophical and psychological inquiry, little is known about how ordinary people intuitively conceptualize mental development. Across six countries (Australia, Japan, Mexico, South Africa, the United Kingdom, and the United States), adult participants reported their intuitions about mental development by indicating when they think various mental capacities first emerge. Across tasks and cultures, intuitions about mental development were consistently organized along two dimensions: an earlier-developing perceptual and experiential dimension (e.g., seeing, fear, hunger, pain) and a later-developing reflective and evaluative dimension (e.g., reasoning, beliefs, self-restraint, pride). Competing models were ruled out, showing that this structure is unique to lay beliefs about mental development. These dimensions also aligned with participants’ intuitions about the origins of mental capacities within a nature–nurture framework. Together, the findings reveal a consistent cross-cultural pattern for reasoning about mental development and illuminate the intuitive architecture of mind perception.
Keywords
Introduction
Across cultures and historical periods, scholars have asked how reasoning, emotion, social understanding, and bodily awareness emerge (Confucius, 1980; Cooper & Hutchinson, 1997). Developmental research offers detailed accounts of how these capacities grow in children (Piaget & Cook, 1952; Spelke & Kinzler, 2007), yet surprisingly little is known about how laypeople intuitively conceptualize mental development. Such folk theories influence how parents guide children (Sigel et al., 2014), how educators structure learning (Martinot et al., 2025), how societies set expectations for human potential (Bian et al., 2017; Bronfenbrenner, 1979; Rogoff, 2003), and how we reason about human nature more broadly (De Cruz & De Smedt, 2007; Dweck & Yeager, 2019).
Cultural research demonstrates that developmental expectations are themselves culturally patterned. Communities differ in the capacities they value and the ages at which they expect children to acquire them—for instance, emphasizing early independence in some contexts and relational attunement or community participation in others (Keller, 2007; Raeff, 2010; Rogoff, 2003). These ethnotheories and culturally shaped practices provide a theoretical foundation for understanding why intuitions about mental development may show both cross-cultural regularities and local variation.
Against this backdrop, key questions remain: Do people believe that mental capacities follow a systematic developmental timeline? Do they see some capacities as developmentally linked? And are these intuitions culturally consistent or variable? Prior research has examined intuitions about the presence of mental capacities in different entities (e.g., roach, robot, human adult). For example, Weisman et al. (2017) asked participants to rate a wide range of mental capacities for various entities (e.g., “How capable is an adult/fish of feeling safe?”) and identified a distinct tripartite body–heart–mind model (e.g., body: hunger and pain; heart: pride and guilt; mind: seeing and communication). This pattern has been documented across multiple cultures, suggesting a richer taxonomy of mental life than the traditional experience-agency framework (Gray et al., 2007; Weisman et al., 2017, 2021). However, because these approaches focused on cross-entity comparisons, little is known about how people conceptualize mental development in humans. This gap is striking because folk theories of development—like other intuitive theories in cognitive science (e.g., folk biology, folk physics)—structure everyday explanations and expectations.
To address this gap, we conducted a cross-cultural, data-driven study across six countries to map the latent structure of intuitive beliefs about mental development. By letting structure emerge inductively from participants’ responses, we avoided imposing theory-driven classifications and captured a more ecologically valid account of how people organize mental development.
We began by asking participants a simple yet fundamental question: At what age can an individual first exhibit a given mental capacity? Responses revealed a robust two-dimensional structure in lay beliefs, distinguishing “perceptual and experiential” capacities (e.g., seeing, fear, hunger, pain) from “reflective and evaluative” capacities (e.g., reasoning, holding beliefs, self-restraint, pride; Study 1). This structure was subsequently replicated across multiple cultural contexts (Study 2). Next, by varying task framing, we demonstrated that the two-dimensional structure is specific to reasoning about mental development in humans, whereas cross-entity judgments yield a three-dimensional body–heart–mind model (Study 3). Finally, we showed that the structure reflects intuitive reasoning about whether capacities are innate or acquired through experience (Study 4). By uncovering a simple and systematic organization in folk beliefs, these findings bridge everyday intuition and developmental science, offering new insight into how humans explain mental development.
Research Transparency Statement
General disclosures
Study 1 disclosures
Study 2 disclosures
Study 3 disclosures
Study 4 disclosures
Study 1
Study 1 comprised three substudies (JP1, JP2, and JP3), each conducted (in Japanese) with independent samples of Japanese adults using different task formats. These substudies investigated whether, and in what ways, people perceive the development of mental capacities as structured, and whether this underlying structure remains consistent across different task formats.
Method
Participants
This research was conducted in accordance with the principles of the Declaration of Helsinki and was reviewed and approved by the Ethics Committee of the Department of Psychological and Cognitive Sciences, Nagoya University (Approval No. 240105-C-03-1). All the online tasks in the research were entitled “Survey on the Onset of Human Abilities.” Participants were recruited between February 2, 2024, and July 21, 2025. Repeat participation (within each study and across studies) was prevented. Informed consent was obtained from all participants. Before beginning the survey, participants were presented with an informed-consent statement explaining that participation was voluntary and that they could withdraw at any time. Consent was indicated by clicking an “agree” button before starting the survey.
Participants of Study 1 were recruited via CrowdWorks (https://crowdworks.jp/), a major Japanese Internet survey company. The sample size was determined before data collection. Power analyses were conducted using G*Power, version 3.144. Guided by Weisman et al.’s (2017) body–heart–mind model of mental life, we performed the power analysis to determine the sample size required to detect an interaction between sex (girl, boy) and factor (body, heart, mind; assuming a tripartite structure). A mixed-design analysis of variance (ANOVA) was specified with a small effect size ( f = 0.1), α = .05, and power (1− β) = .90 (Weisman et al., 2017). The power analysis indicated that a sample size greater than 214 was required.
Anticipating exclusions due to incomplete or inattentive responding, we prespecified a recruitment target of 300 participants per substudy. Recruitment was closed once this target was reached, resulting in minor variations in final sample sizes across studies. Because some registered workers could submit invalid IDs without completing the survey and because the number of failed attention checks could not be known in advance, the final number of valid responses could only be determined after recruitment ended. Cases in which an invalid ID was submitted without accessing or completing the survey were not treated as exclusions, because no usable data were obtained. Accordingly, we report only the sample size included in the analyses together with the number of participants excluded on the basis of the predefined exclusion criteria. No other survey responses were examined during this process, and sample sizes were not adjusted on the basis of any analyses of study variables.
Given that the current data may reflect a different underlying structure—such as a two-dimensional model rather than a tripartite one—we also report the results of sensitivity analyses for all analyses that deviated from the original ANOVA, to identify the smallest detectable effect sizes. Although our power analysis focused on the ANOVA (Factor × Sex), the achieved sample sizes also meet common exploratory-factor-analysis (EFA) standards. A participants-to-items ratio of at least 5:1 is generally sufficient (Weisman et al., 2021), and sample sizes around 200 are considered fair (Comrey & Lee, 1992). With an expected three-factor solution, the variables-to-factors ratio exceeds 13, supporting the adequacy of our sample size (Mundfrom et al., 2005).
Exclusion criteria were determined prior to analysis. Participants were excluded if they failed an attention-check task requiring them to correctly indicate the age of a newborn baby (i.e., select the youngest model in JP1 and JP2, and enter an age < 1 year old in Study JP3; Fig. 1). In JP3, participants were also excluded if they failed a question designed to check whether they remembered the model’s sex.
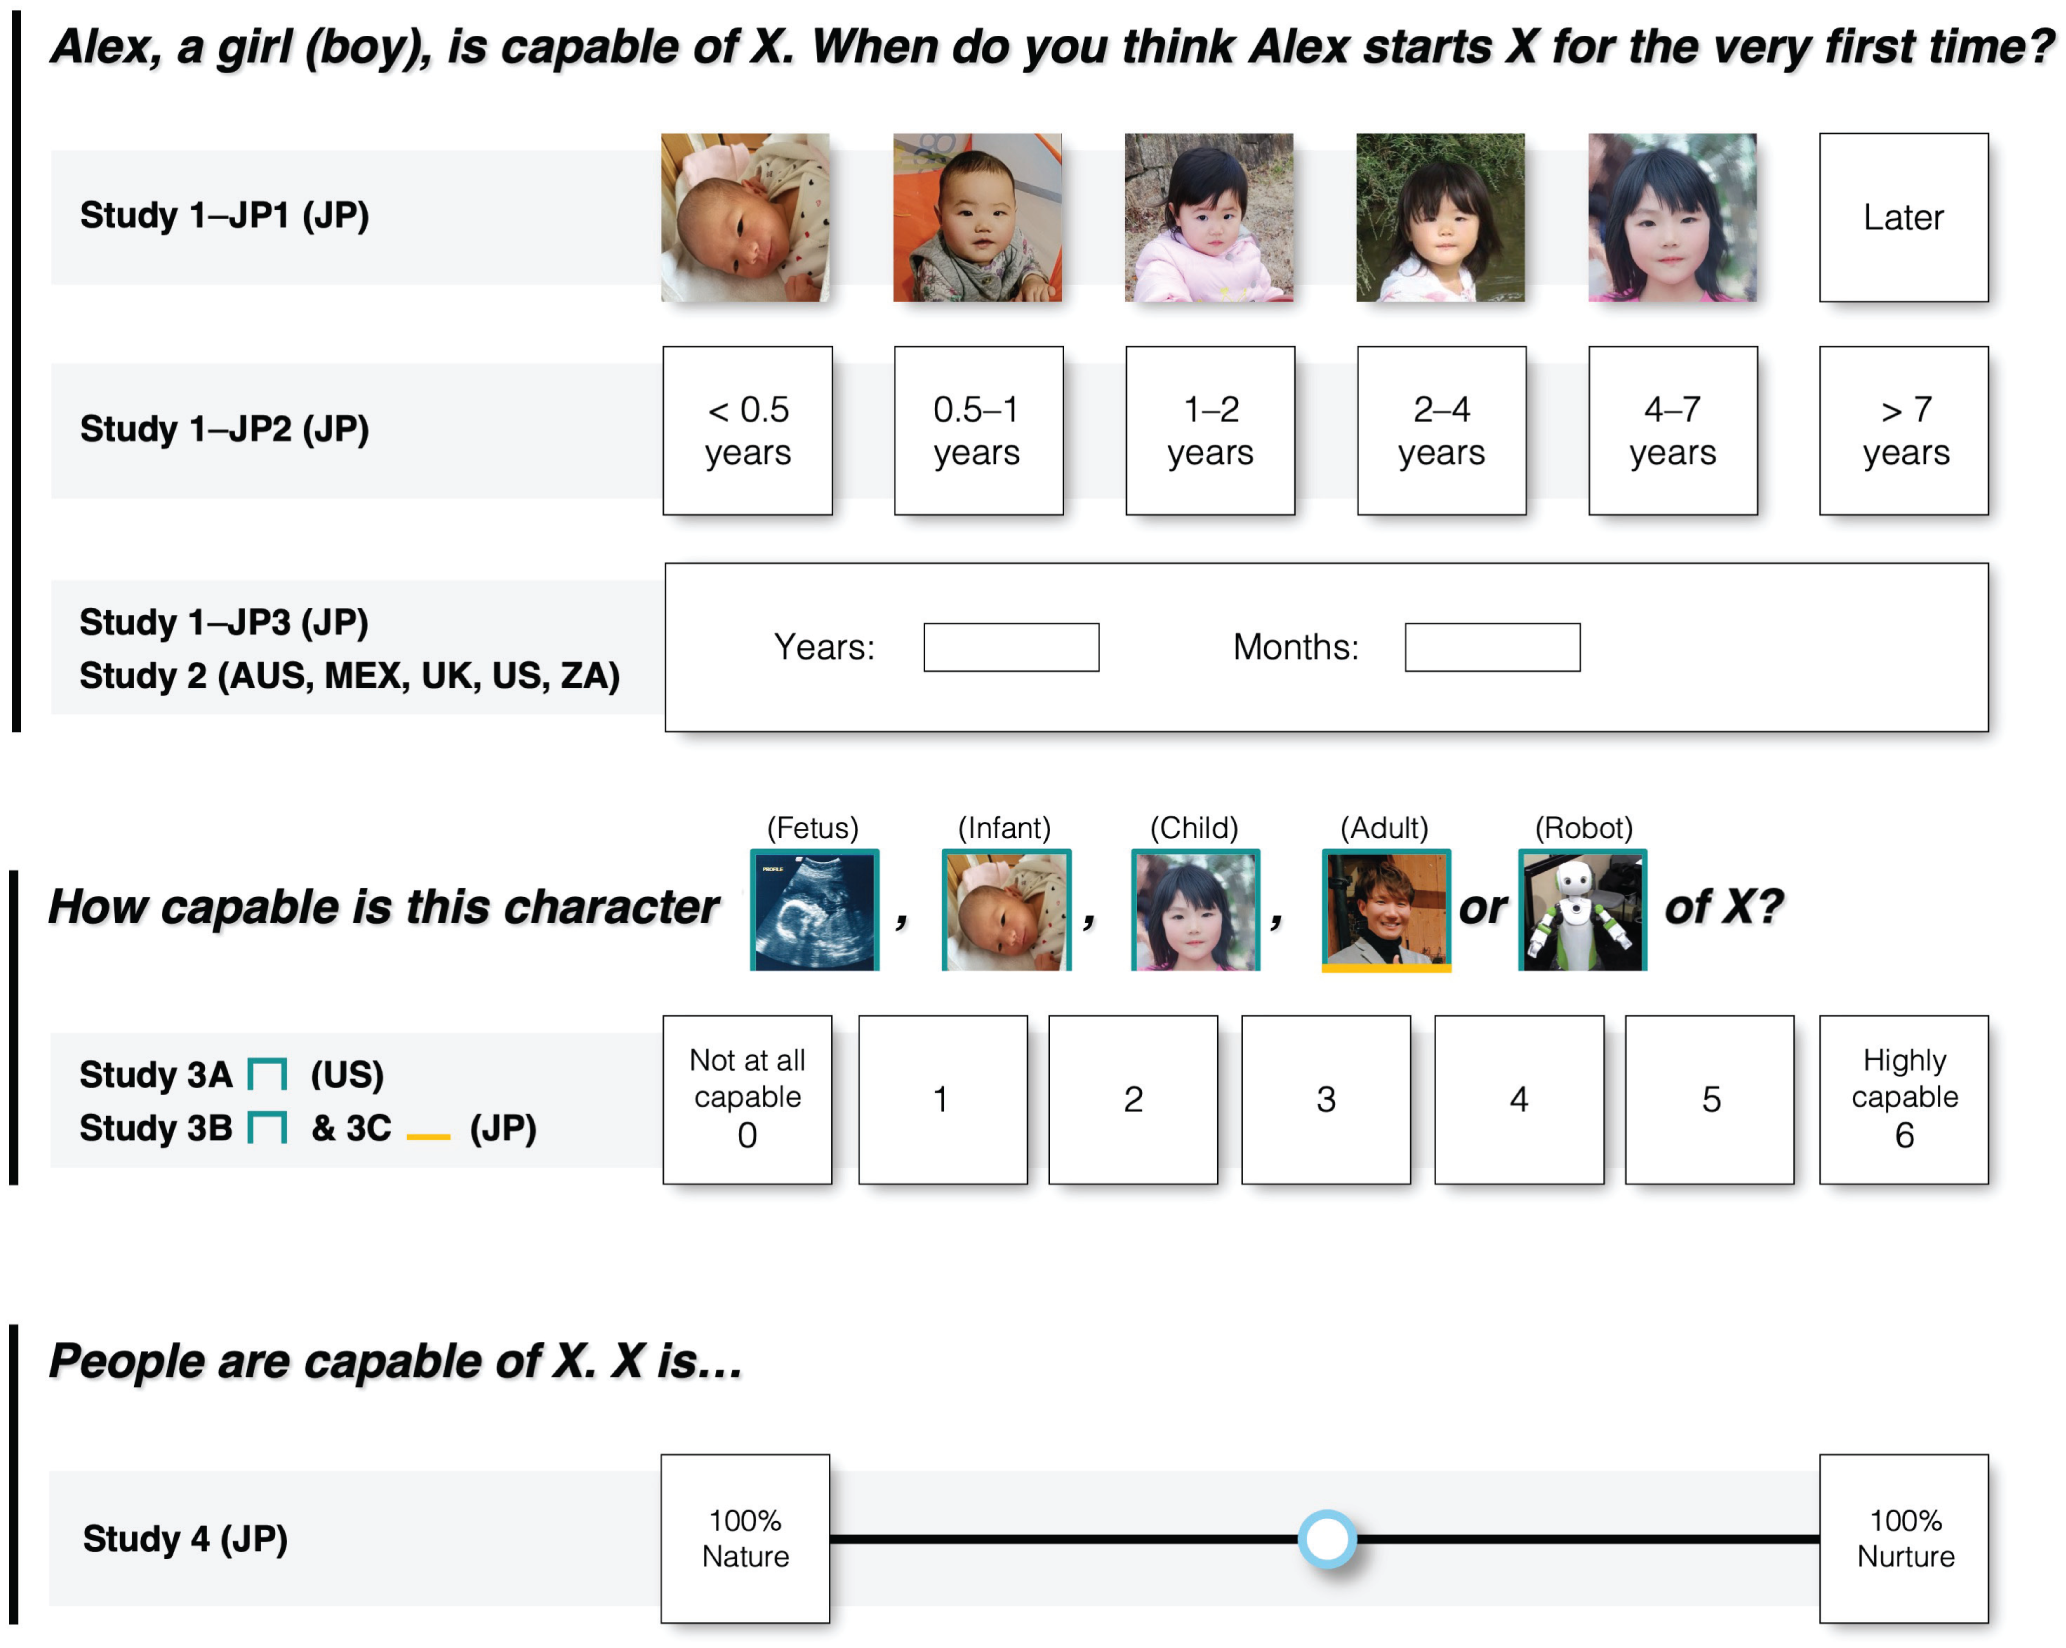
Overview of the tasks used across studies. Country names in parentheses denote participants’ regions. The photographs shown in this figure for Study 1 and the photograph shown for the child target in Study 3 are illustrative examples and were not the actual photographs used in those studies. For Study 3, “US” refers to a reanalysis of Weisman et al.’s (2017) data, and the photos of the fetus and the robot used with Japanese participants were identical to those in that study. JP = Japan; AUS = Australia; MEX = Mexico; UK = United Kingdom (including England, Northern Ireland, Scotland, and Wales); US = United States of America; ZA = South Africa.
JP1 included 289 participants (Mage = 42.27 years, SD = 9.64; 142 females, 143 males, and 4 participants who chose not to report their sex), after excluding 10 participants. Participants were compensated an amount equivalent to $0.41 (USD) in their local currency (Japanese yen for participants in Japan). JP2 included 258 participants (Mage = 40.87 years, SD = 9.74; 128 females, 128 males, and 2 participants who chose not to report their sex), after excluding 18 participants. Compensation was $0.82 per participant. JP3 included 244 participants (Mage = 42.25 years, SD = 9.88; 119 females and 125 males), after excluding 37 participants (11 for failing the infant age-estimation task and 26 for incorrect sex confirmations). Participants received $0.62 each. Participant demographics for each study—including parenting experience, highest education, and annual household income—are reported in Tables S2, S3, and S4 in the Supplemental Material available online.
Procedure
We assessed mental capacities using all 40 items developed by Weisman et al. (2017), which encompass a diverse range of affective, cognitive, perceptual, physiological, and social capacities (see Fig. 2 for the full list). These items were selected because they were derived from a conceptual analysis of ontological categories with balanced valence, complexity, and phrasing and have been shown to capture both a cross-culturally validated framework and cultural variations in mind perception (Weisman et al., 2017, 2021). Notably, independent work by Malle (2019), using a different set of mental-capacity items, identified a closely aligned three-dimensional structure, suggesting that the Weisman et al. measure reliably captures the core structure of mind perception.
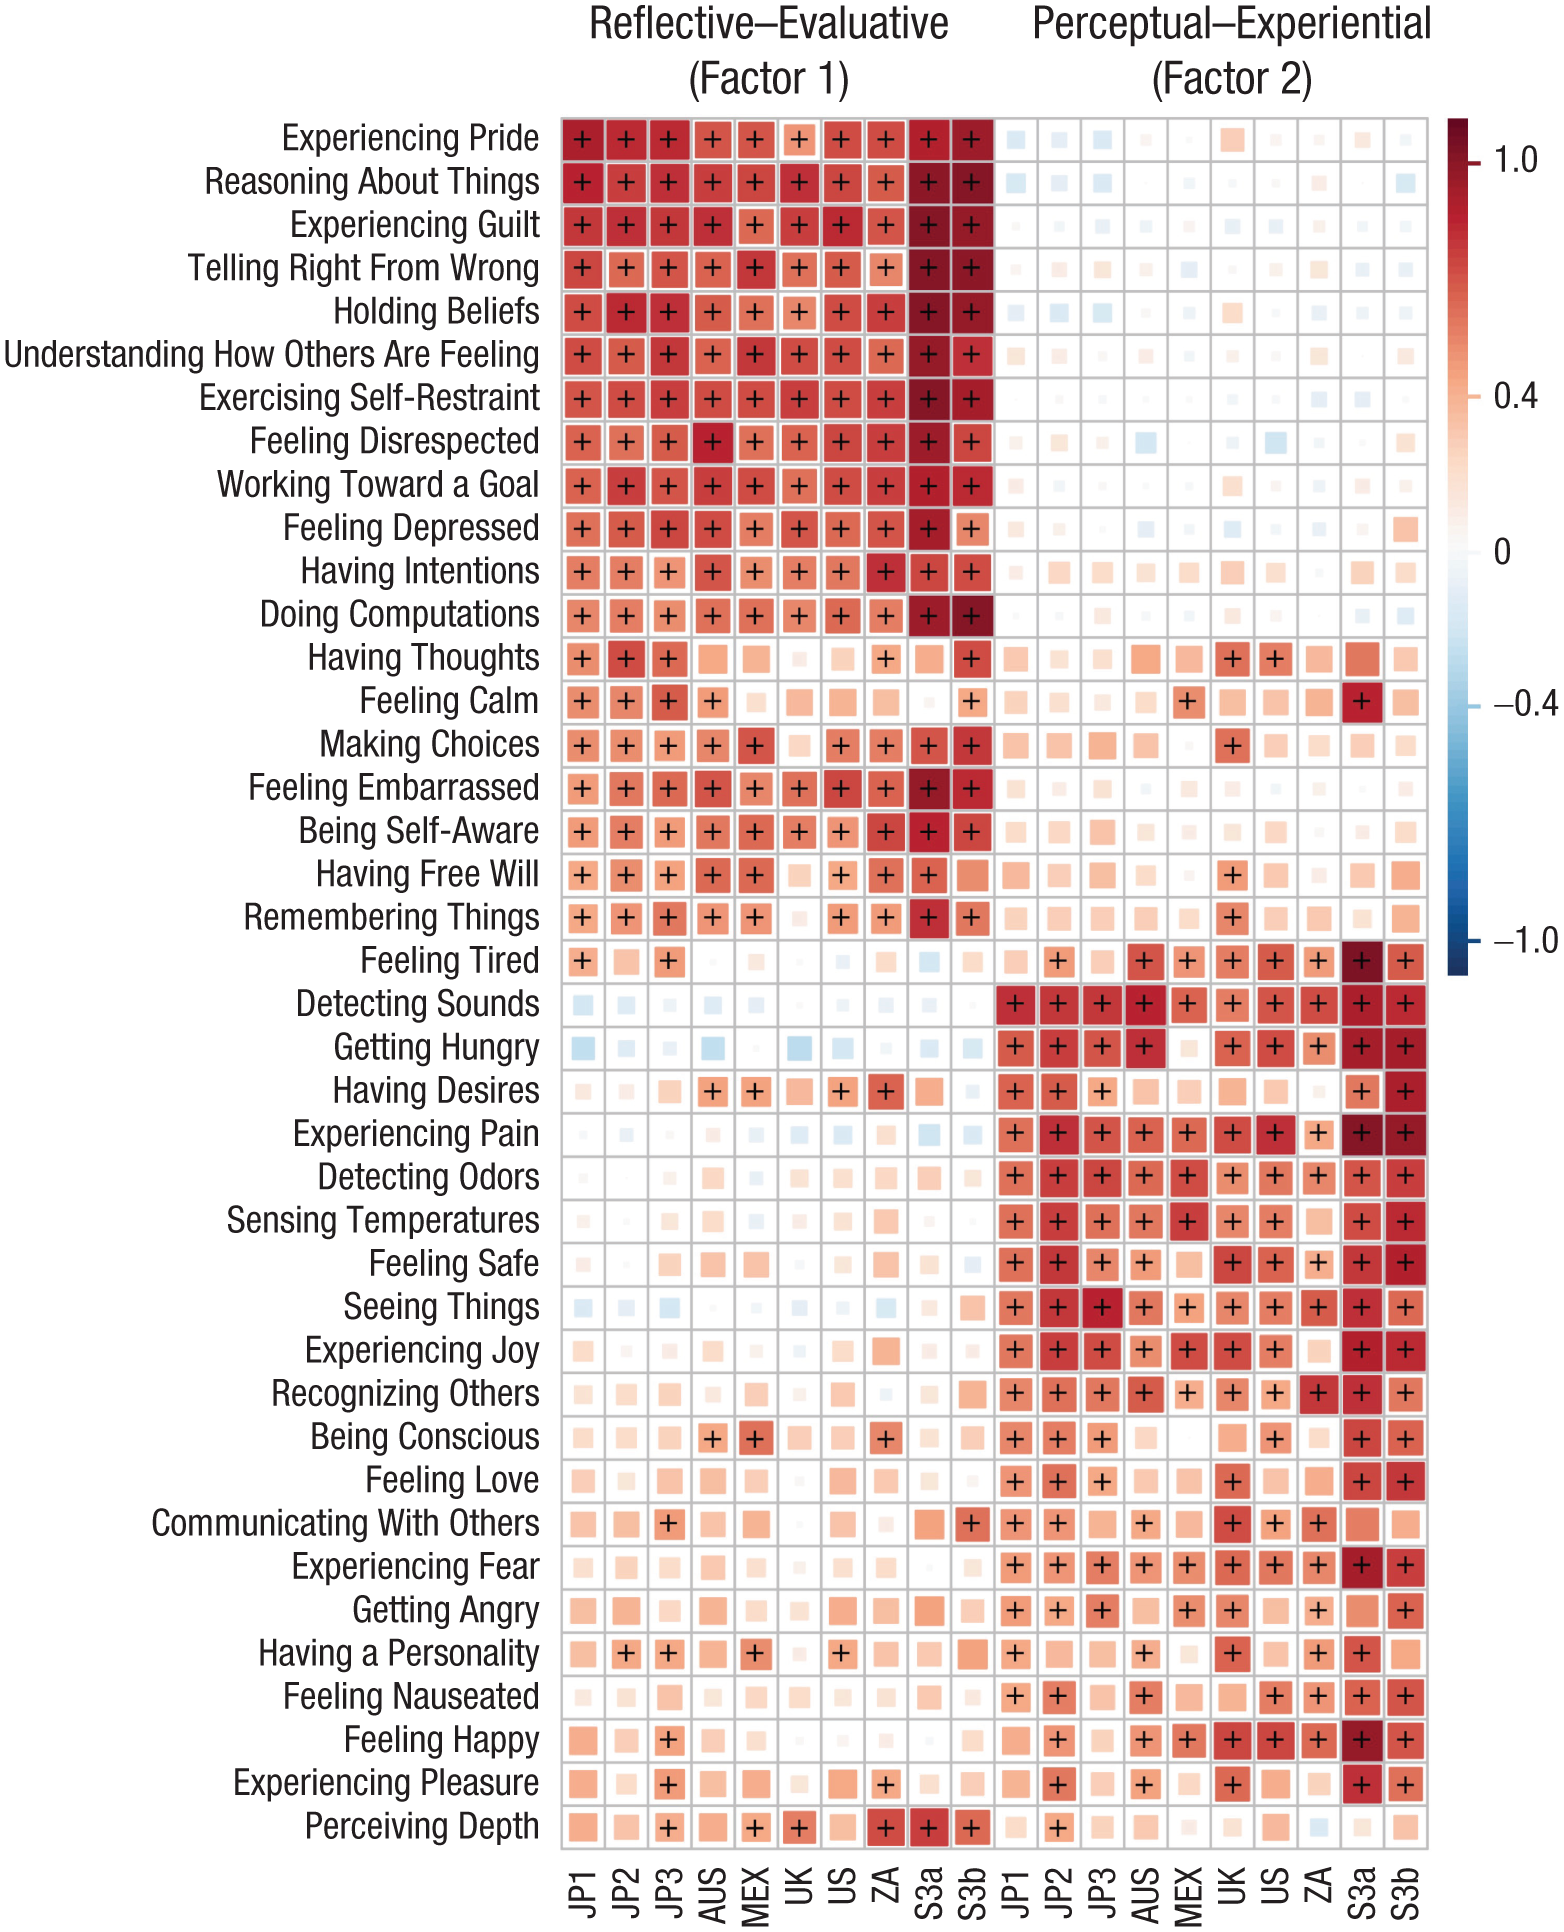
Exploratory-factor-analysis (EFA) loadings for 40 mental capacities mapped onto a developmental timeline. Darker shades on the color bar represent greater absolute loading values, with red indicating positive loadings and blue indicating negative loadings. Plus signs (+) mark items with loadings meeting a heuristic threshold (≥ 0.40 or ≤ −0.40) on a single factor. JP1, JP2, and JP3 represent the three substudies with Japanese samples in Study 1; S3a and S3b represent Studies 3a and 3b. AUS = Australia; MEX = Mexico; UK = United Kingdom (including England, Northern Ireland, Scotland, and Wales); US = United States of America; ZA = South Africa.
This item set also allows for the evaluation of alternative theoretical models, such as the experience–agency dimensions proposed by Gray et al. (2007; see also McMurtrie, 2023, for further support of this model using more appropriate statistical methodologies). The relevant capacities for these constructs are included among the 40 items, so using this set does not constrain our ability to test competing frameworks of mind perception.
From a developmental perspective, these items are particularly suitable. Weisman et al. (2017) showed that perceptions of these capacities vary systematically depending on the developmental stage of the target (e.g., fetus, infant, child, adult), and that the emergence of capacities is perceived to unfold progressively across development. This aligns with core principles of developmental theory, such as the Piagetian stages of cognitive development (Piaget & Cook, 1952) and the gradual emergence of social-cognitive skills (Wellman, 2014), in which early-developing physiological and basic affective capacities provide a foundation for later reflective and social capacities. Taken together, this 40-item set is well suited for our study, capturing a comprehensive view of the intuition of mental development.
Across all the studies, the mental capacities were presented in a randomized order that was independently generated for each participant. The translation of the mental-capacity items from English to Japanese was performed by a bilingual author and subsequently back-translated by another bilingual author. The authors compared the original and back-translated versions and reached agreement on the final Japanese wording, to ensure conceptual and terminological consistency.
Surveys were built and conducted using the Qualtrics online platform. Participants were introduced to a character with a gender-neutral name: Hikaru in Japanese. The character was described as either a girl or a boy, and participants were randomly assigned to one of the sexes. In these studies, participants were asked to estimate when they thought each of the mental capacities first appeared (Fig. 1). In JP1, age estimation was made by choosing images depicting Hikaru as a newborn (< 0.5 years), older infant (0.5–1 years), toddler (1–2 years), preschool child (2–4 years), school-age child (4–7 years), or “later” (Meng et al., 2022; J. Wang & Feigenson, 2019). This method is well suited for estimating the age of early development, because the photos can easily evoke participants’ mental images of the target populations (Meng et al., 2022; J. Wang & Feigenson, 2019). We used four sets of photos (two girls and two boys), each depicting the continuous development of a real Japanese child. Participants were randomly assigned to one of the photo sets.
To further ensure that the presence of images or age categories did not drive our findings, JP2 used text-based age range selections (e.g., < 0.5 years), and JP3 used free responses from participants (typing in years and months).
Statistical analysis
Because this research employed a data-driven approach, we used parallel analysis to determine the number of factors to retain for participants’ age estimations (Weisman et al., 2021). Parallel analysis is a simulation-based method for factor retention that compares observed eigenvalues with those from resampled and randomly generated data sets of the same size as the empirical data. Subsequently, we conducted EFAs using a minimum residual solution, adjusting the diagonal elements of the correlation matrix to minimize the squared residuals when the factor model is based on the eigenvalue decomposition of the reduced matrix. The results reported here are from solutions after applying an oblique (oblimin) transformation (Weisman et al., 2021). The EFAs were conducted using JASP version 0.18.345 (JASP Team, 2025). Additionally, to assess the similarity of factor structures across paradigms, we combined the data from the substudies and calculated Tucker’s congruence coefficient (rc)—a metric of structural similarity derived from the cosine of the angle between matrices of factor scores (Lorenzo-Seva & Ten Berge, 2006). Higher values indicate stronger similarity. According to Lorenzo-Seva and Ten Berge (2006), values in the range of .85 to .94 indicate fair similarity, whereas values above .95 suggest that the two factors or components being compared can be considered equivalent.
Moreover, to examine whether age of emergence estimates varied as a function of dimension, target sex (girl vs. boy), or task (JP1 vs. JP2 vs. JP3), we conducted a mixed-design ANOVA. Dimension, based on culturally derived EFA structures, was treated as a within-subjects variable, whereas target sex and task served as between-subjects variables.
Results
For each sample, the EFA consistently revealed a two-factor structure (Fig. 2; see Table S5 for detailed results of the EFAs for each substudy and Table S6 for the factor correlations). The first factor was associated with reflective, deliberative, and self-referential capacities, and with capacities that often involve social evaluation, such as reasoning, pride, and moral judgment, which are typically linked to learning, culture, and social coordination (Gauvain et al., 2011; Nisbett et al., 2001; Peplak et al., 2023). We named this factor the reflective–evaluative dimension. Across studies, Factor 1 accounted for 25 to 29% of the total variance in the rotated solution. The second factor was associated with perceptual, sensory, and basic affective capacities, such as hunger, fear, and pain, which are typically tied to basic needs, instincts, and survival (Burnett et al., 2016; Maslow, 1943). We named this factor the perceptual–experiential dimension. Across studies, Factor 2 accounted for 19 to 25% of the total variance. Despite not directly imposing any predefined structure, Studies 1 revealed a consistent pattern in people’s intuitive mental ontogeny. As shown in Figure 3, the results revealed a pronounced cross-task consistency: A clear distinction between the dimensions emerged at every task (rcs ≥ 0.97; Lorenzo-Seva & Ten Berge, 2006).
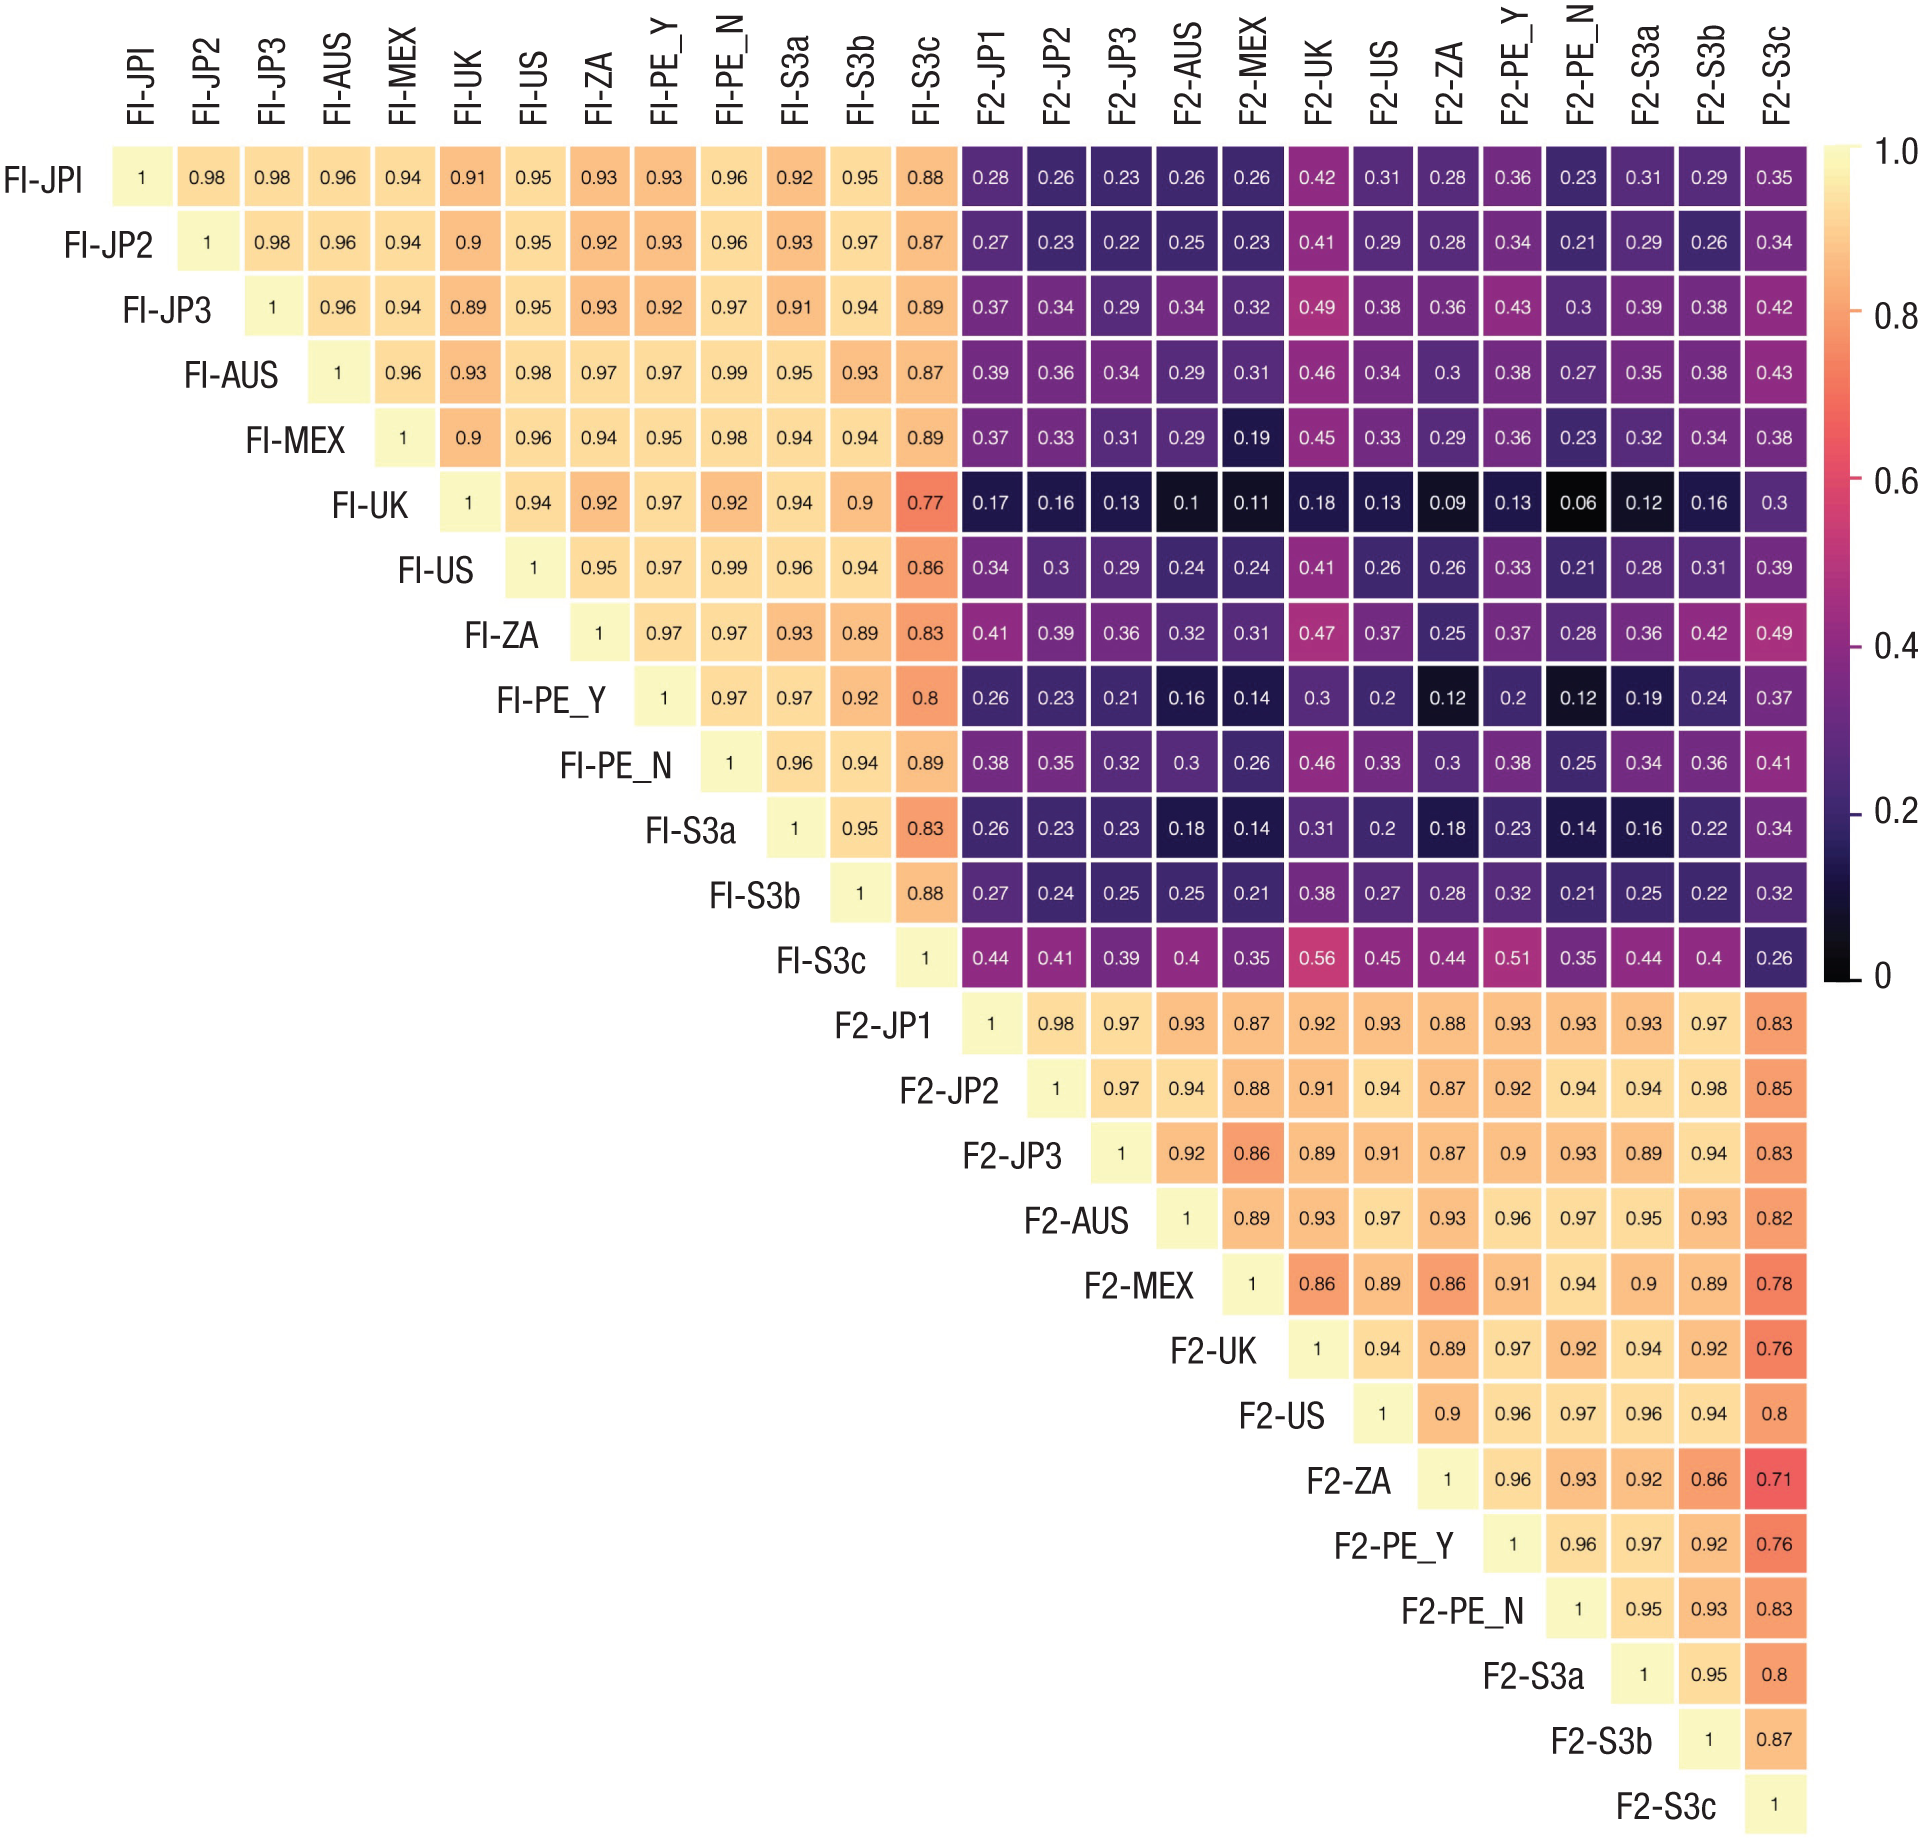
Cosine similarities (Tucker’s congruence coefficients; rc) between all pairs of factors across two-dimensional exploratory-factor-analysis (EFA) solutions; rc reflects the degree of interfactor alignment across studies. Higher values indicate stronger similarity. A value in the range of 0.85 to 0.94 indicates fair similarity, whereas a value above 0.95 implies that the two factors or components being compared can be considered equivalent (Lorenzo-Seva & Ten Berge, 2006). These results quantitatively demonstrate the robustness of a consistent two-factor structure across all samples. F1 = Factor 1 (reflective–evaluative dimension); F2 = Factor 2 (perceptual–experiential dimension); JP1, JP2, and JP3 = substudies with Japanese samples (Study 1); AUS = Australia; MEX = Mexico; UK = United Kingdom (including England, Northern Ireland, Scotland, and Wales); US = United States of America; ZA = South Africa; PE_Y and PE_N = Parenting Experience_Yes and Parenting Experience_No; S3a, S3b, and S3c = Studies 3a, 3b, and 3c.
The mixed-design ANOVA revealed significant main effects of dimension, F(1, 785) = 7321.77, p < .001, η p 2 = .903, and task, F(2, 785) = 55.13, p < .001, η p 2 = .123, as well as a significant Dimension × Task interaction, F(2, 785) = 90.06, p < .001, η p 2 = .187; see Table S7 in the Supplemental Material. Specifically, the age estimates for the reflective–evaluative dimension were consistently higher than those for the perceptual–experiential dimension across all tasks (ps < .001; see Table S8 and Fig. 4). Moreover, age estimates were generally highest for the text-based age-range selection task, followed by the photo-based task (JP1), and lowest for the free-response task (JP3), with slight variations across dimensions (see Table S9). In contrast, no significant effects related to target sex were detected (ps ≥ .089, η p 2s ≤ .006; Table S7). A sensitivity analysis conducted in G*Power (Faul et al., 2007) indicated that, given α = .05, power = .9, and the current sample size, the mixed-design ANOVA would be capable of reliably detecting a very small effect size ( f = 0.072; Table S7). ANOVA results for each substudy and the corresponding sensitivity analyses are reported in Tables S10 through S15.
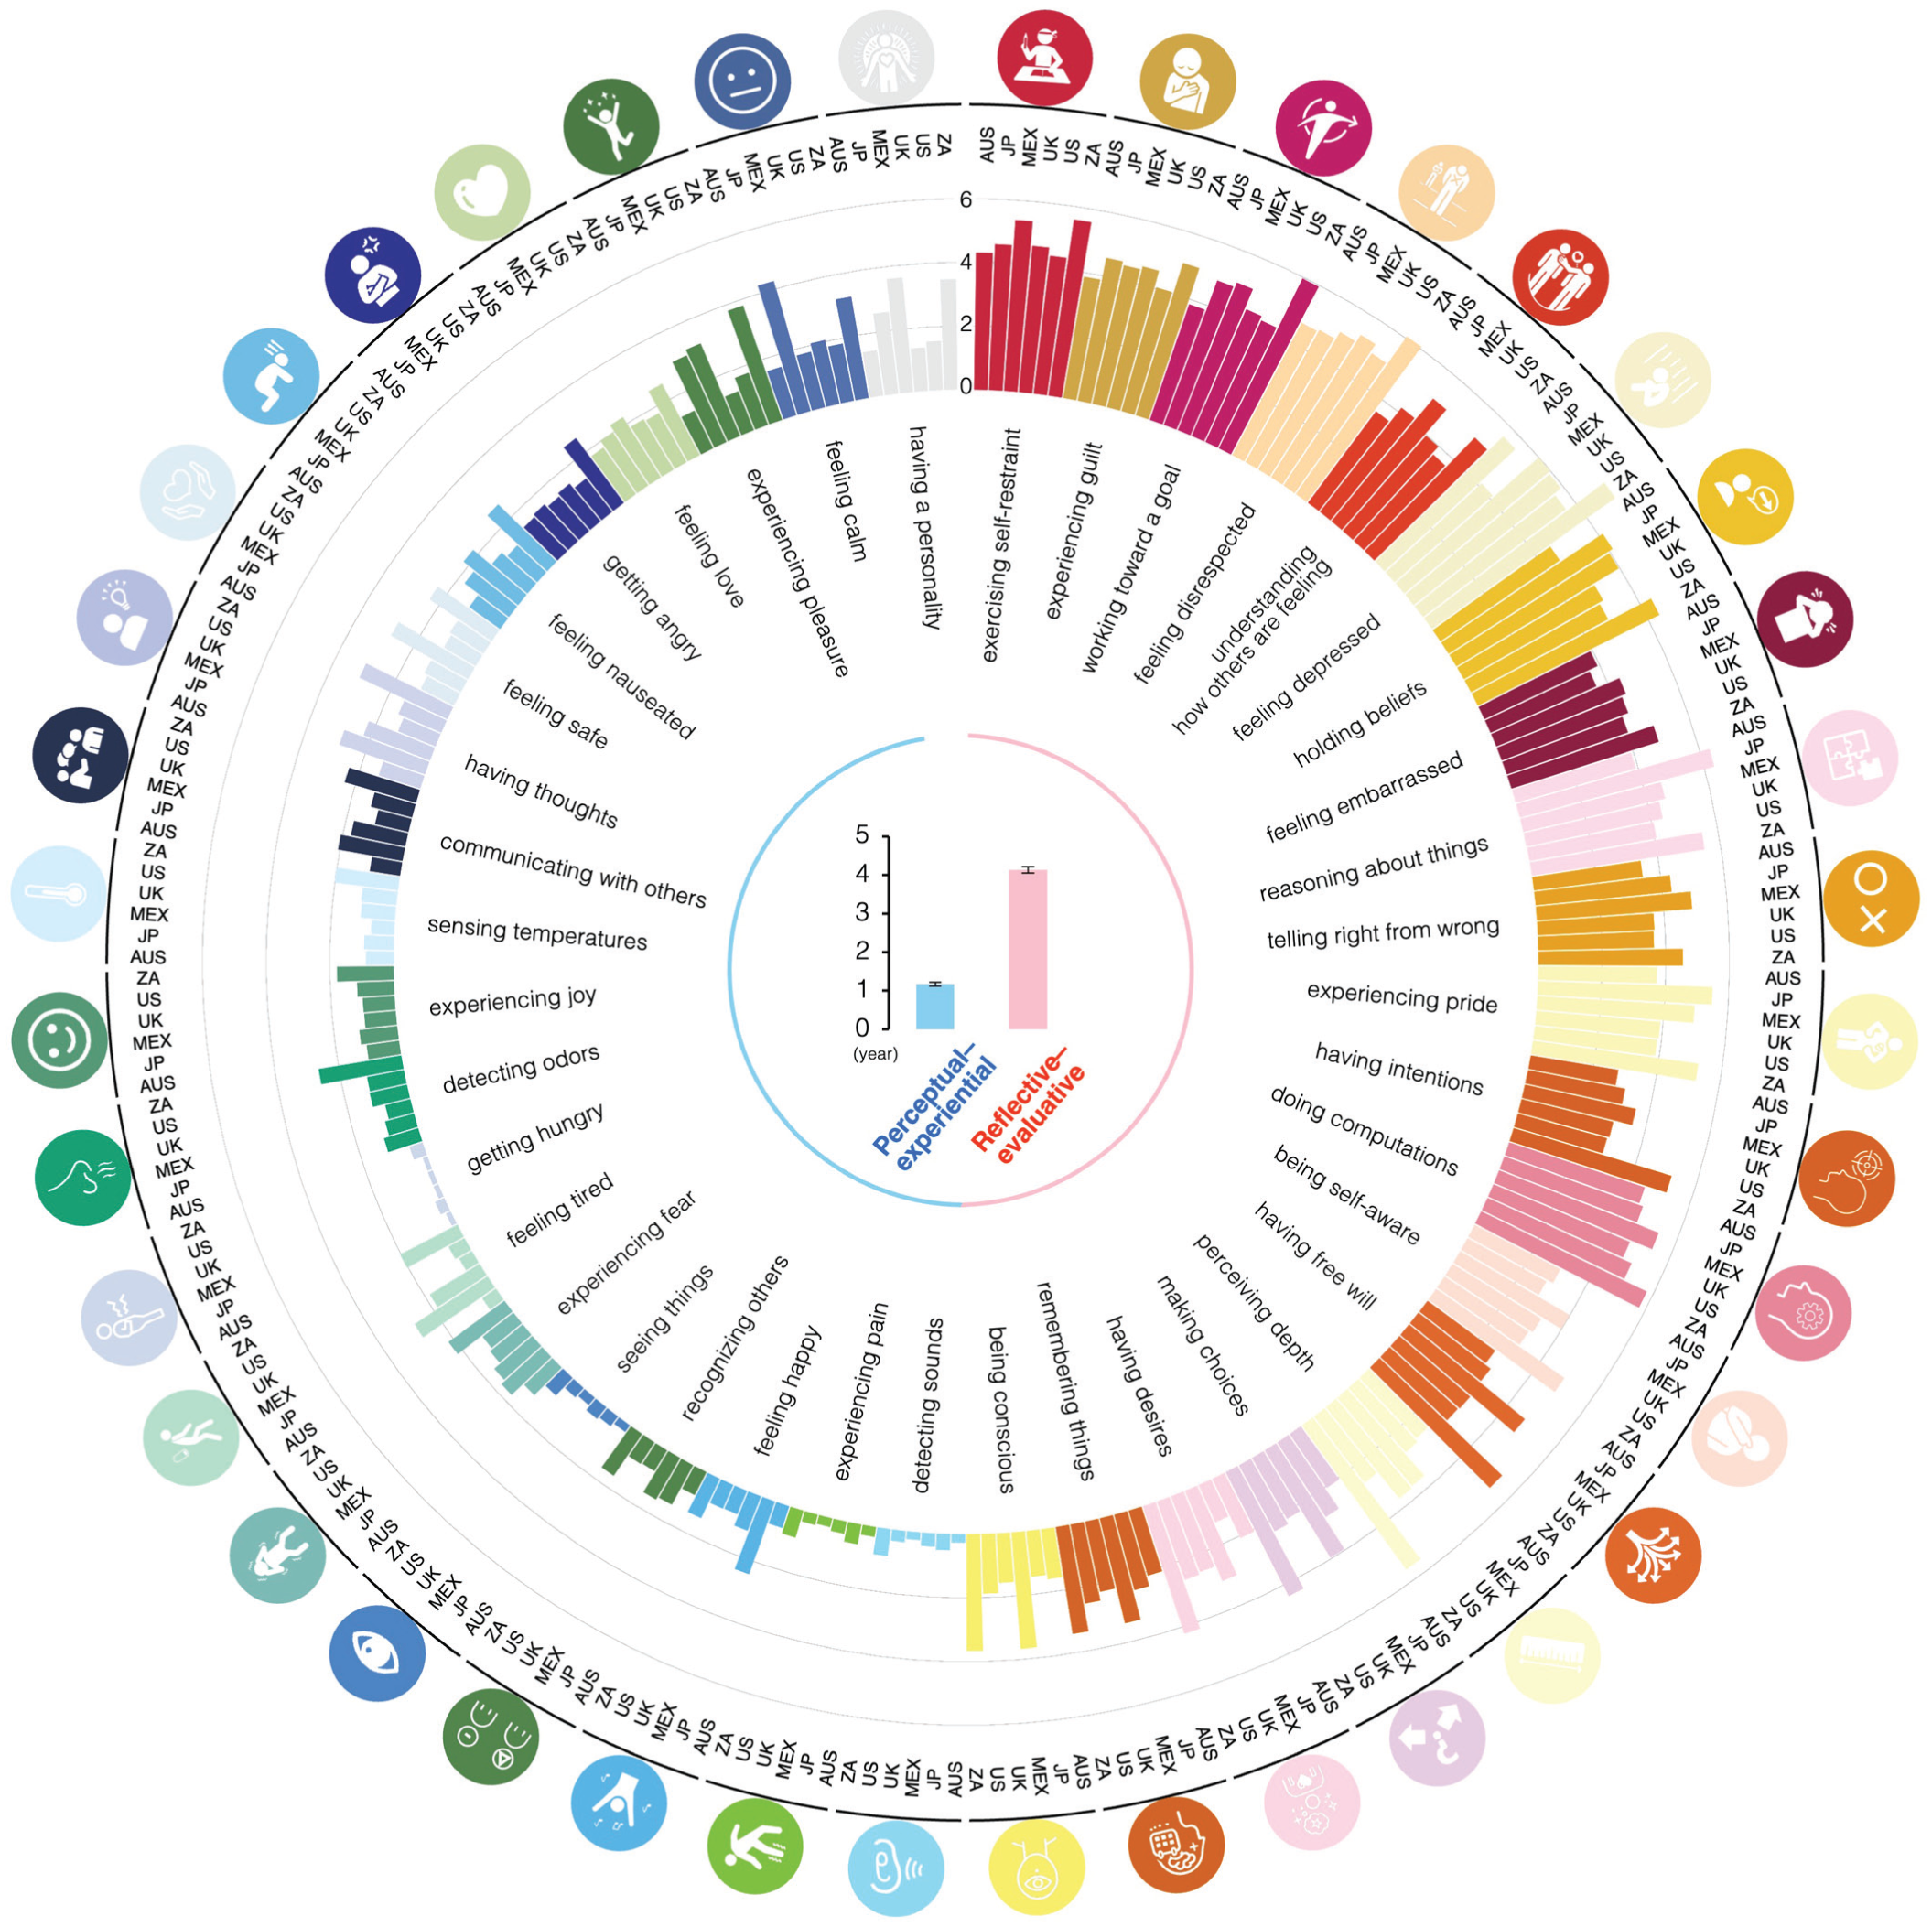
Mean age participants estimated for the developmental emergence of each mental capacity across cultures. The order of the mental capacities is based on an exploratory factor analysis (EFA) of the overall age-estimate data from all cultures (i.e., JP3 from Study 1 and all subsamples from Study 2; Table S5). The left half (in cool colors) represents the perceptual–experiential dimension, and the right half (in warm colors) represents the reflective–evaluative dimension. The item “having a personality” was not included in either dimension. Pictograms outside the histogram represent images of each mental capacity. The bar graph in the center shows the mean age estimates for the two dimensions, with error bars depicting 95% confidence intervals. AUS = Australia; JP = Japan; MEX = Mexico; UK = United Kingdom (samples include citizens from England, Northern Ireland, Scotland, and Wales); US = United States of America; ZA = South Africa.
Further exploratory analyses examined whether age estimations differed between participants with and without parenting experience. A mixed-design ANOVA on the merged data from substudies JP1, JP2, and JP3 revealed significant main effects of dimension, F(1, 766) = 5651.23, p < .001, η p 2 = .881, and parenting experience, F(1, 766) = 32.17, p < .001, η p 2 = .040, as well as a significant Dimension × Parenting Experience interaction, F(1, 766) = 15.09, p < .001, η p 2 = .019 (see Table S16). Simple main effects revealed that participants with parenting experience provided earlier age estimations for both dimensions (ps < .001; Table S17). Bonferroni-corrected post hoc tests further indicated that, although both effects remained significant, the effect of parenting experience was larger for the reflective–evaluative dimension (Mdifference = 0.51, p < .001, d = 0.495) than for the perceptual–experiential dimension (Mdifference = 0.28, p = .001, d = 0.276; see Table S18).
Study 2
Previous research suggests that mind perception involves both culturally consistent and culturally specific elements (Weisman et al., 2021). Study 2 aimed to assess whether the observed structure of intuitive mental ontogeny is unique to Japanese culture or reflects a broader, cross-cultural feature of human cognition. To this end, we recruited participants from five diverse global regions and employed the free-response paradigm from JP3 of Study 1. This task avoids culturally loaded cues, such as human images or age categories, making it well suited for cross-cultural comparison.
Method
Participants
We recruited participants from Australia (AUS; Oceania; English), Mexico (MEX; North America; Spanish), the United Kingdom (UK; Europe; English), the United States (US; North America; English), and South Africa (ZA; Africa; English). These countries were chosen to represent major world regions and to capture variation in language, socialization goals, and cultural models of development—factors known to influence parental ethnotheories and expectations about children’s abilities (Harkness et al., 2000; Keller, 2007; Rogoff, 2003). This diversity provides a broad set of contrasts for identifying both shared and culture-specific intuitions about mental development.
Participants were recruited via Prolific (https://www.prolific.com/). Sample sizes and exclusion criteria mirrored those used in JP3 of Study 1, except that we prespecified a recruitment target of 350 participants per culture to increase the likelihood that the minimum required sample size would be met after applying the exclusion criteria.
Substudy AUS included 274 participants (Mage = 38.04 years, SD = 12.90; 162 females and 112 males), with an additional 74 participants excluded, 30 for inaccurate infant age estimations and 44 for incorrect sex confirmations. Participants were compensated $1.26. Substudy MEX included 288 participants (Mage = 29.94 years, SD = 7.04; 157 females, 128 males, 1 intersex, and 2 participants who chose not to report their sex), with 61 additional exclusions (16 for infant age estimations and 45 for sex confirmations). Participants were compensated $1.26. Substudy UK included 274 participants (Mage = 42.62 years, SD = 14.17; 183 females, 90 males, and 1 participant who chose not to report sex), with 69 additional participants excluded (22 for infant age estimations and 47 for sex confirmations). Participants were compensated $1.26. Substudy US included 252 participants (Mage = 39.57 years, SD = 12.91; 167 females, 83 males, and 2 intersex participants), with 71 exclusions, 27 for infant age estimations and 44 for sex confirmations. Participants were compensated $1.50. Substudy ZA included 263 participants (Mage = 29.48 years, SD = 8.64; 176 females, 86 males, and 1 participant who chose not to report sex), with 77 participants excluded, 50 for infant age estimations and 27 for sex confirmations. Participants were compensated $1.64. Participant demographics for each study—including parenting experience, highest education, and annual household income—are reported in Tables S19–S21.
Procedure
The procedure, including the attention-check task, was identical to that of JP3 in Study 1. For the age-estimation tasks, participants provided a free-recall response indicating the age at which they believed each mental capability emerges. Surveys were administered in region-specific languages, and the character name “Alex” was used consistently throughout (Fig. 1).
Because the JP3 survey was originally created in Japanese (the descriptions of the mental capacities were taken from Weisman et al., 2017; all other parts of the questions were created by the authors), a multi-step translation procedure was implemented for cross-cultural investigation. The original Japanese version was translated into English by bilingual authors and back-translated, and a reference English version was established through discussion and consensus, with the English capacity descriptions from Weisman et al. (2017) used as is. This version was used for surveys in Australia, the United Kingdom, the United States, and South Africa. For Mexico, the reference English version was translated into Spanish by a bilingual research assistant and back-translated into English by a different bilingual reviewer; any discrepancies were resolved by the authors. Finally, all translated surveys were reviewed to ensure conceptual and terminological consistency.
Statistical analysis
The statistical analyses were conducted separately for each region and followed the same procedures as those used in Study 1 (JASP Team, 2025). Additionally, to assess the similarity of factor structures across paradigms and cultures, we combined the data from Studies 1 and 2 and calculated the congruence coefficient (Lorenzo-Seva & Ten Berge, 2006).
Moreover, to examine whether age of emergence estimates varied as a function of dimension (reflective–evaluative vs. perceptual–experiential), target sex (girl vs. boy), or culture, we conducted a mixed-design ANOVA. Dimension, based on culturally derived EFA structures, was treated as a within-subjects variable, whereas target sex and culture served as between-subjects variables. This analysis included data from JP3 in Study 1 and all cultural groups in Study 2, which employed comparable paradigms.
Results
Despite differences in participants’ cultural backgrounds, EFAs consistently revealed the reflective–evaluative versus perceptual–experiential structure across regions, with Factor 1 and Factor 2 accounting for 19% to 28% and 14% to 24% of the total variance, respectively (Fig. 2; see Table S5 for detailed results of the EFAs for each region and Table S6 for the factor correlations). As shown in Figure 3, the results revealed fair cross-task and cross-cultural consistency: A clear distinction between the reflective–evaluative and perceptual–experiential dimensions emerged at every site (rcs ≥ 0.86; Lorenzo-Seva & Ten Berge, 2006).
We visualized the configuration of 40 mental capacities across six cultural groups by plotting each item’s factor scores on a two-dimensional factor plane (Fig. 5). Each panel represents a distinct culture, with dots labeled by the corresponding mental capacity. The colors are assigned randomly for each item solely to facilitate identification and do not indicate any grouping or categorization. This visualization allows for a direct comparison of the placement of specific capacities and highlights potential cross-cultural variations in the factor structure.
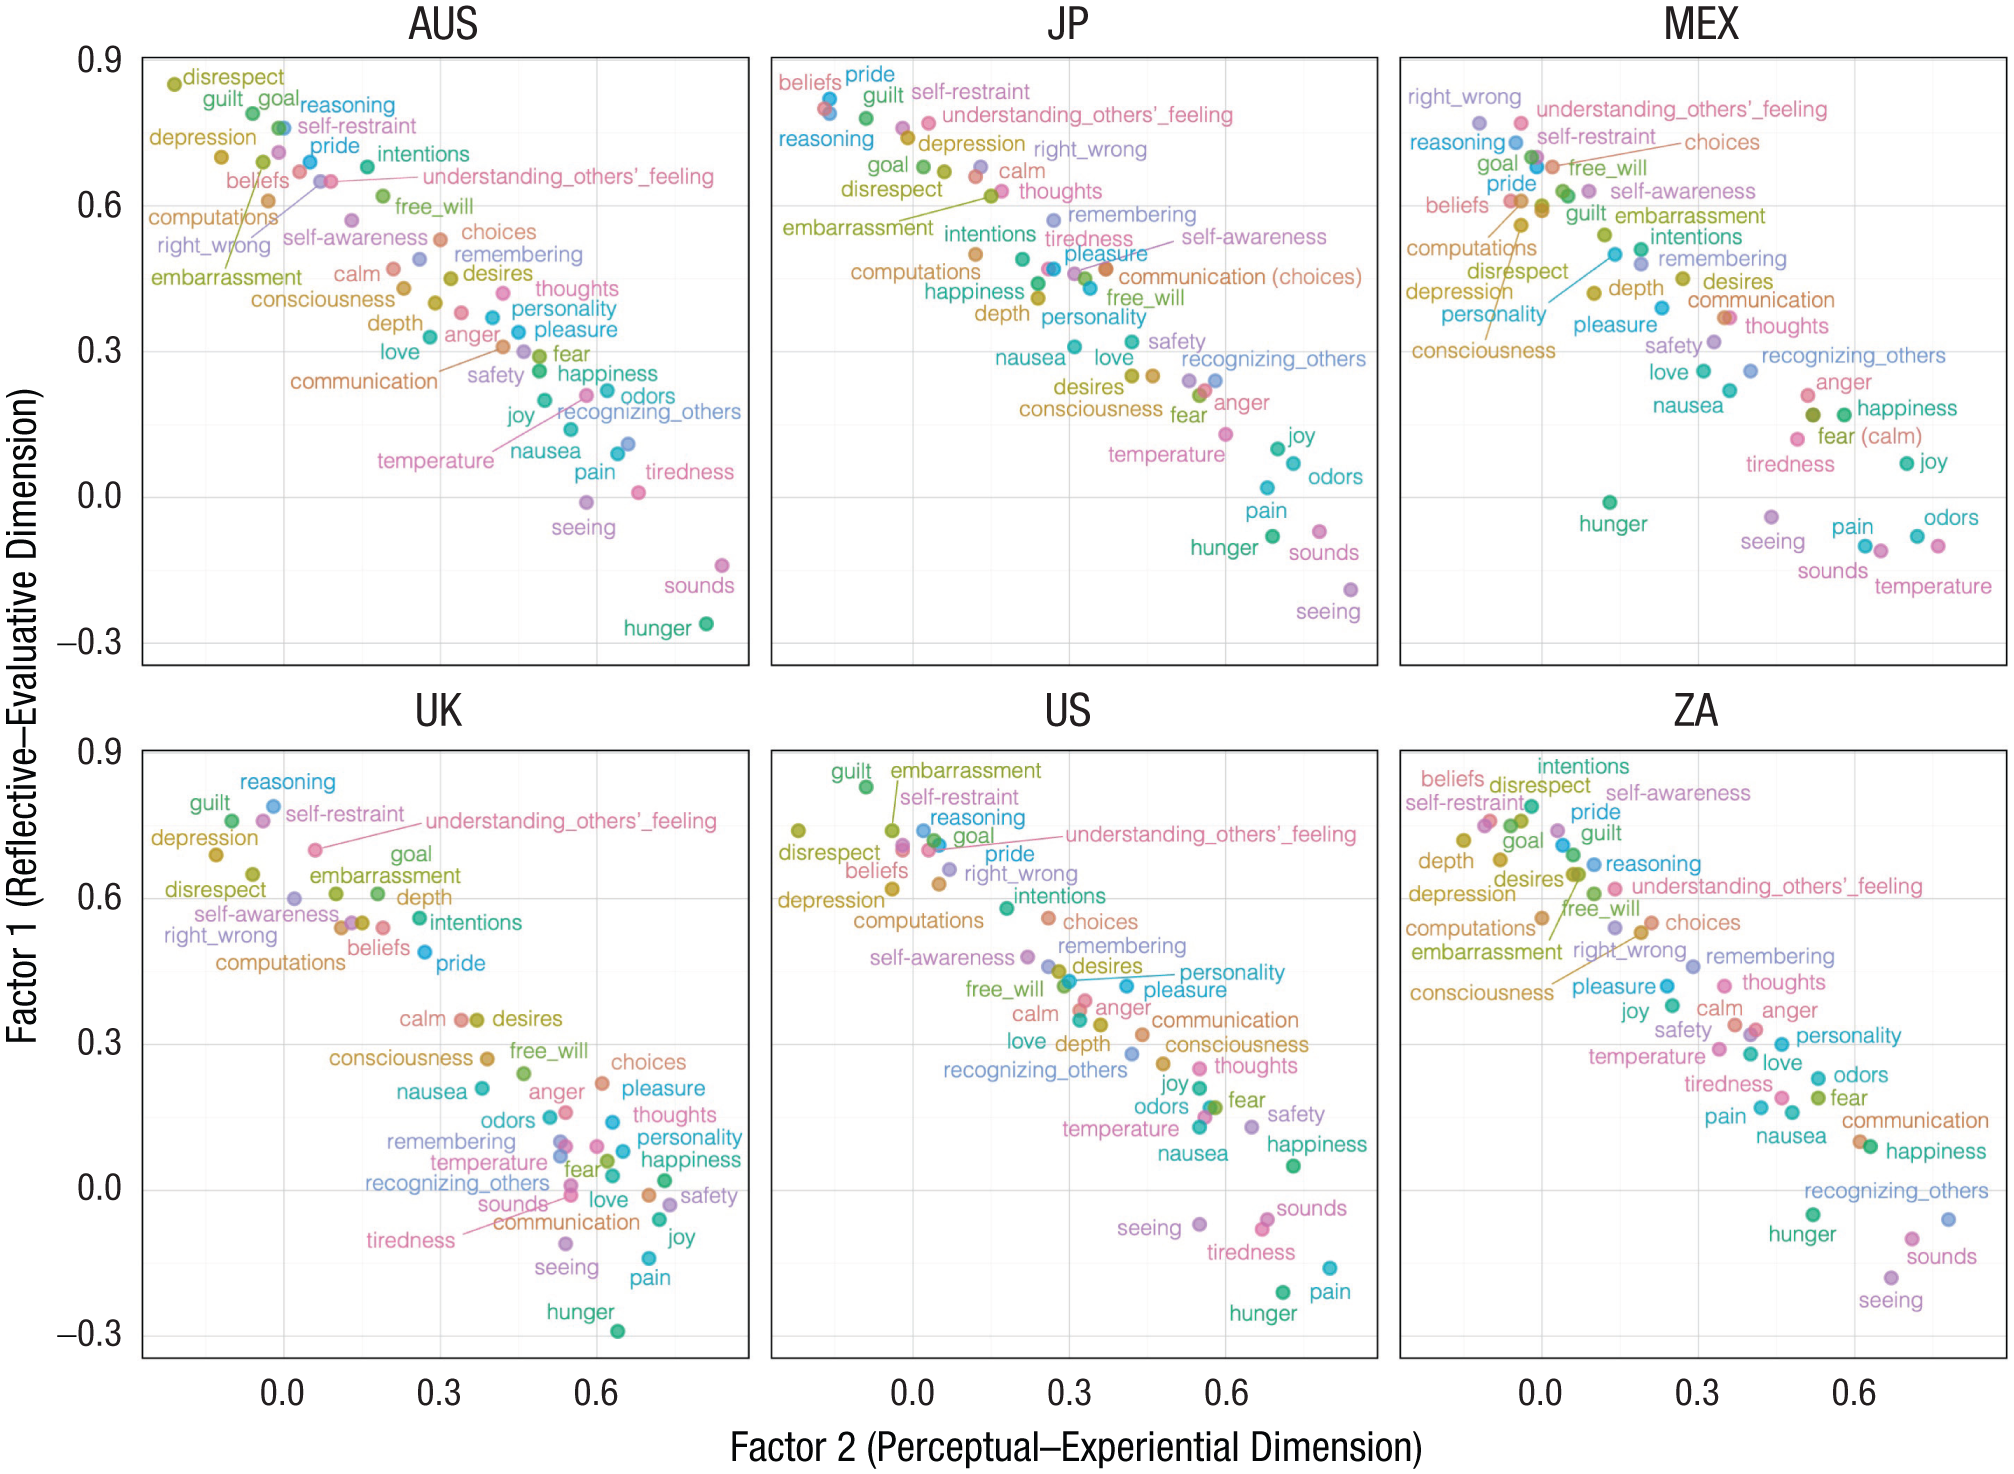
Item positions on the factor plane across six cultural groups. Each point represents a mental capacity, with the position determined by its factor loadings on Factor 1 (y-axis) and Factor 2 (x-axis). Colors are assigned randomly to each item solely to facilitate identification and do not indicate grouping. The graphs are separated by culture to illustrate cross-cultural similarities and differences in the configuration of mental capacities.
The mixed-design ANOVA revealed significant main effects of dimension, F(1, 1583) = 10930.20, p < .001, η p 2 = .873, and culture, F(5, 1583) = 37.41, p < .001, η p 2 = .106, as well as a significant Dimension × Culture interaction, F(5, 1583) = 24.07, p < .001, η p 2 = .071 (see Figs. 4 and 6 and Table S22). Specifically, the age estimates for the reflective–evaluative dimension were consistently higher than for the perceptual–experiential dimension (ps < .001; Table S23). Furthermore, the reflective–evaluative dimension exhibited greater levels of cultural variation than the perceptual–experiential dimension (Table S24), in line with the interpretation that these capacities are linked to cultural influences (e.g., exercising self-restraint; Fox & Calkins, 2003). Item-level cultural variation in age estimations is visualized in Figure S1. On the other hand, this model revealed no target sex-related effects (ps ≥ .303, η p 2s ≤ .004; Table S22). A sensitivity analysis conducted in G*Power (Faul et al., 2007) indicated that, given α = .05, power = .9, and the current sample size, the mixed-design ANOVA would be capable of reliably detecting a very small effect size ( f = 0.058; Table S22). ANOVA results for each substudy and the corresponding sensitivity analyses are reported in Tables S25 through S34.
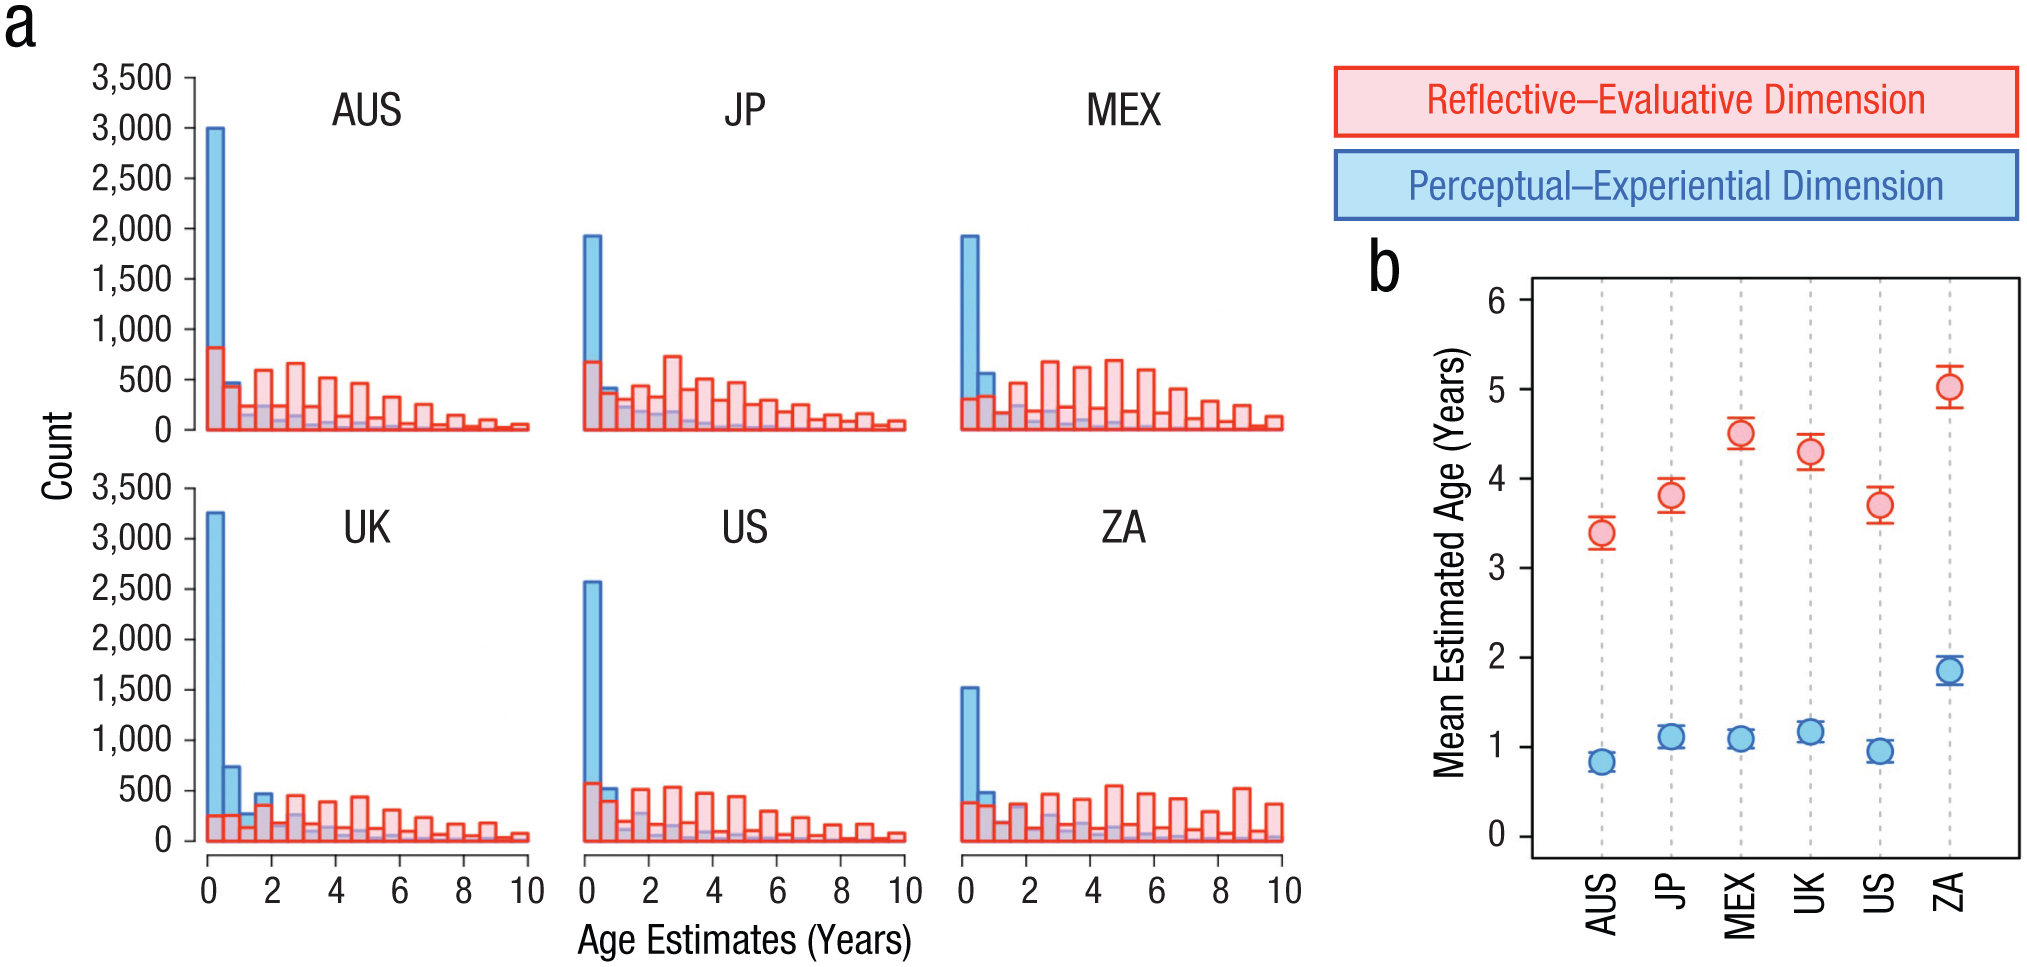
Cultural similarities and differences in age estimation for the reflective–evaluative and perceptual–experiential dimensions. In (a) are shown distributions of estimated ages (in years) at which participants judged each mental capacity to emerge, separately for reflective–evaluative (red) and perceptual–experiential (blue) dimensions. In (b) are shown mean estimated ages of emergence by dimension and cultural group. Error bars represent 95% confidence intervals. AUS = Australia; JP = Japan (JP3 from Study 1); MEX = Mexico; UK = United Kingdom (including participants from England, Northern Ireland, Scotland, and Wales); US = United States of America; ZA = South Africa.
As in Study 1, we examined whether age estimations in Study 2 differed between participants with and without parenting experience. A mixed-design ANOVA on the age estimations revealed significant main effects of dimension, F(1, 1337) = 8003.14, p < .001, η p 2 = .857, and parenting experience, F(1, 1337) = 8.09, p = .005, η p 2 = .006, as well as a significant Dimension × Parenting Experience interaction, F(1, 1337) = 5.92, p = .015, η p 2 = .004 (see Table S35). Although simple main effects initially suggested that parenting experience led to earlier age estimations for both dimensions (ps < .05; Table S36), Bonferroni-corrected post hoc tests revealed a significant effect only for the reflective–evaluative dimension (Mdifference = 0.30, p = .002, d = 0.205), but not for the perceptual–experiential dimension (Mdifference = 0.13, p = .673, d = 0.091; Table S37).
Merging cross-cultural responses on the same task (i.e., JP3 and Study 2), we further examined whether the reflective–evaluative versus perceptual–experiential structure could be replicated among participants with parenting experience (N = 957, Mage = 38.84 years, SD = 12.98; 636 females and 318 males, 1 intersex, and 2 participants who chose not to report their sex) and without parenting experience (N = 618, Mage = 33.83 years, SD = 10.84; 320 females and 294 males, 2 intersex, and 2 participants who chose not to report their sex). The EFA showed that, for both data sets, clear reflective–evaluative versus perceptual–experiential structures emerged (rcs ≥ 0.9, indicating fair similarity to the previous samples; see Fig. 3; see Tables S38 and S39 for detailed results of the EFAs; Lorenzo-Seva & Ten Berge, 2006).
Study 3
Study 3 was designed to determine the conditions under which mind perception is organized along reflective–evaluative versus perceptual–experiential dimensions. We hypothesized that the reflective–evaluative versus perceptual–experiential structure would emerge even in task paradigms that previously yielded a tripartite model of mind perception (e.g., Weisman et al., 2017) when those tasks were framed in terms of human development (Studies 3a–3b). We further predicted that this structure is uniquely linked to lay beliefs about mental ontogeny.
Specifically, we first expected the factor structure to depend on task framing: When framed around human development, a two-factor structure (reflective–evaluative vs. perceptual–experiential) should appear, whereas cross-entity comparisons (e.g., human vs. nonhuman) should yield a three-factor body–heart–mind model (Studies 3a and 3b). Second, we expected that this two-factor structure would not be revealed when judgments were made in the absence of a developmental framing (e.g., judgments about a single adult character), even within the domain of humans (Study 3c). Examining this condition is important for demonstrating that the reflective–evaluative versus perceptual–experiential structure is specifically linked to reasoning about human development, rather than to more general mind perception of human beings.
Method
Participants
The data for Study 3a were extracted from Weisman et al.’s (2017) Study 4 (i.e., bodyheartmind_study4.csv, available at https://osf.io/m3gwu/). Permission to reuse and share these data was obtained from the data owner. In the original data set, 77% of participants were White or European American. Following data exclusion based on Weisman et al.’s (2017) criteria, we analyzed data from 102 participants who made judgments about a fetus (n = 20), infant (n = 19), child (n = 20), adult (n = 21), and robot (n = 22).
For Studies 3b and 3c, recruitment procedures followed those described in Study 1. The research aims, hypotheses, design plan, sampling plan, variables, and analysis plan of Study 3b were preregistered at https://doi.org/10.17605/OSF.IO/2E6V3. This study included 387 Japanese adults (Mage = 41.36 years, SD = 9.39; 197 females, 189 males, and 1 intersex participant); 21 additional participants were excluded for providing implausible age estimates for newborns. The final sample comprised participants assigned to one of five conditions: fetus (n = 83), infant (n = 87), child (n = 83), adult (n = 64), and robot (n = 70). Study 3c (with research aims, hypotheses, design plan, sampling plan, variables, and analysis plan preregistered at https://doi.org/10.17605/OSF.IO/D3VRZ) included 361 Japanese adults (Mage = 43.17 years, SD = 10.23; 166 females, 193 males, and 2 participants who chose not to report their sex), with 29 excluded on the same basis. In both studies, participants received monetary compensation of $0.42. Participant demographics for Studies 3b and 3c—including parenting experience, highest education, and annual household income—are reported in Tables S40–S42.
Procedure
The hypotheses testing was conducted by adopting Weisman et al. (2017)’s methodology. Study 3a reanalyzed the data set from Weisman et al. (2017; a predominantly American sample) to test whether the structure of mind perception varied as a function of response framing (Fig. 1). Studies 3b and 3c were preregistered extensions conducted in a different cultural context using Japanese samples. Study 3b replicated the findings of Study 3a with a larger sample; Study 3c then tested whether the two-dimensional developmental structure would emerge when participants judged a single adult character from Study 3b, instead of comparing multiple developmental stages.
In Study 3a, we reanalyzed the data from Weisman et al.’s Study 4 to test the hypothesis that mental capacities are conceptualized (a) on the basis of the reflective–evaluative versus perceptual–experiential structure in the context of human development and (b) on the basis of the body–heart–mind structure in the context of similarities and differences across species and entities (Weisman et al., 2017). In Weisman et al.’s Study 4, participants were randomly assigned one target character, represented by a photograph and brief description. They were instructed to rely on their opinion or best guess without external research. On an evaluation page, participants rated the target’s capability across the 40 mental capacities using a scale ranging from 0 (not at all capable) to 6 (highly capable). The characters included a beetle, robot, stapler, car, computer, microbe, fish, blue jay, frog, mouse, goat, dog, bear, dolphin, elephant, chimpanzee, fetus, a person in a persistent vegetative state, infant, child, and adult. Weisman et al. conducted an EFA on the data (merging participants’ responses for all the entities) and revealed the body-heart-mind structure.
To test our hypothesis, we first analyzed the data including only the responses related to human development—specifically, those for the fetus, infant, child and adult. We predicted that the EFA would reveal a two-factor structure consistent with our reflective–evaluative versus perceptual–experiential structure. Next, we included data related to an entity distinct from human beings (the robot), which helped us identify the underlying structure—that is, how participants perceive similarities and differences across entities. We predicted that in this case, the EFA would reveal a three-factor structure consistent with the body–heart–mind framework.
Statistical analysis
In Study 3a we employed two EFAs, following the same procedures as in Studies 1 and 2 (JASP Team, 2025). The first EFA included data from the fetus, infant, child, and adult conditions (n = 80), whereas the second included data from the fetus, infant, child, and robot conditions (n = 81). In the latter case, the adult condition was replaced by the robot condition (the robot was not simply added), thereby maintaining comparable sample sizes across analyses and ensuring comparability of results. Study 3b applied the same statistical procedures as Study 3a. Study 3c applied a single EFA to judgments of the adult character.
Results
The results of Study 3a were consistent with our hypotheses: when the data included only targets representing stages of human development, a reflective–evaluative versus perceptual–experiential structure emerged (see Table 1 and Fig. 2; see Tables S43 and S44 in the Supplemental Material for the factor correlations). In contrast, when the data included evaluations of a nonhuman entity (i.e., the robot condition), the body–heart–mind structure was revealed. These findings were replicated in Study 3b (see Fig. 7 and Fig. 2; see Table S39; and see Tables S45–S47 for detailed results of the EFAs).
Factor Loadings from the Exploratory Factor Analyses (EFA) of Study 3a (After oblimin Rotation)
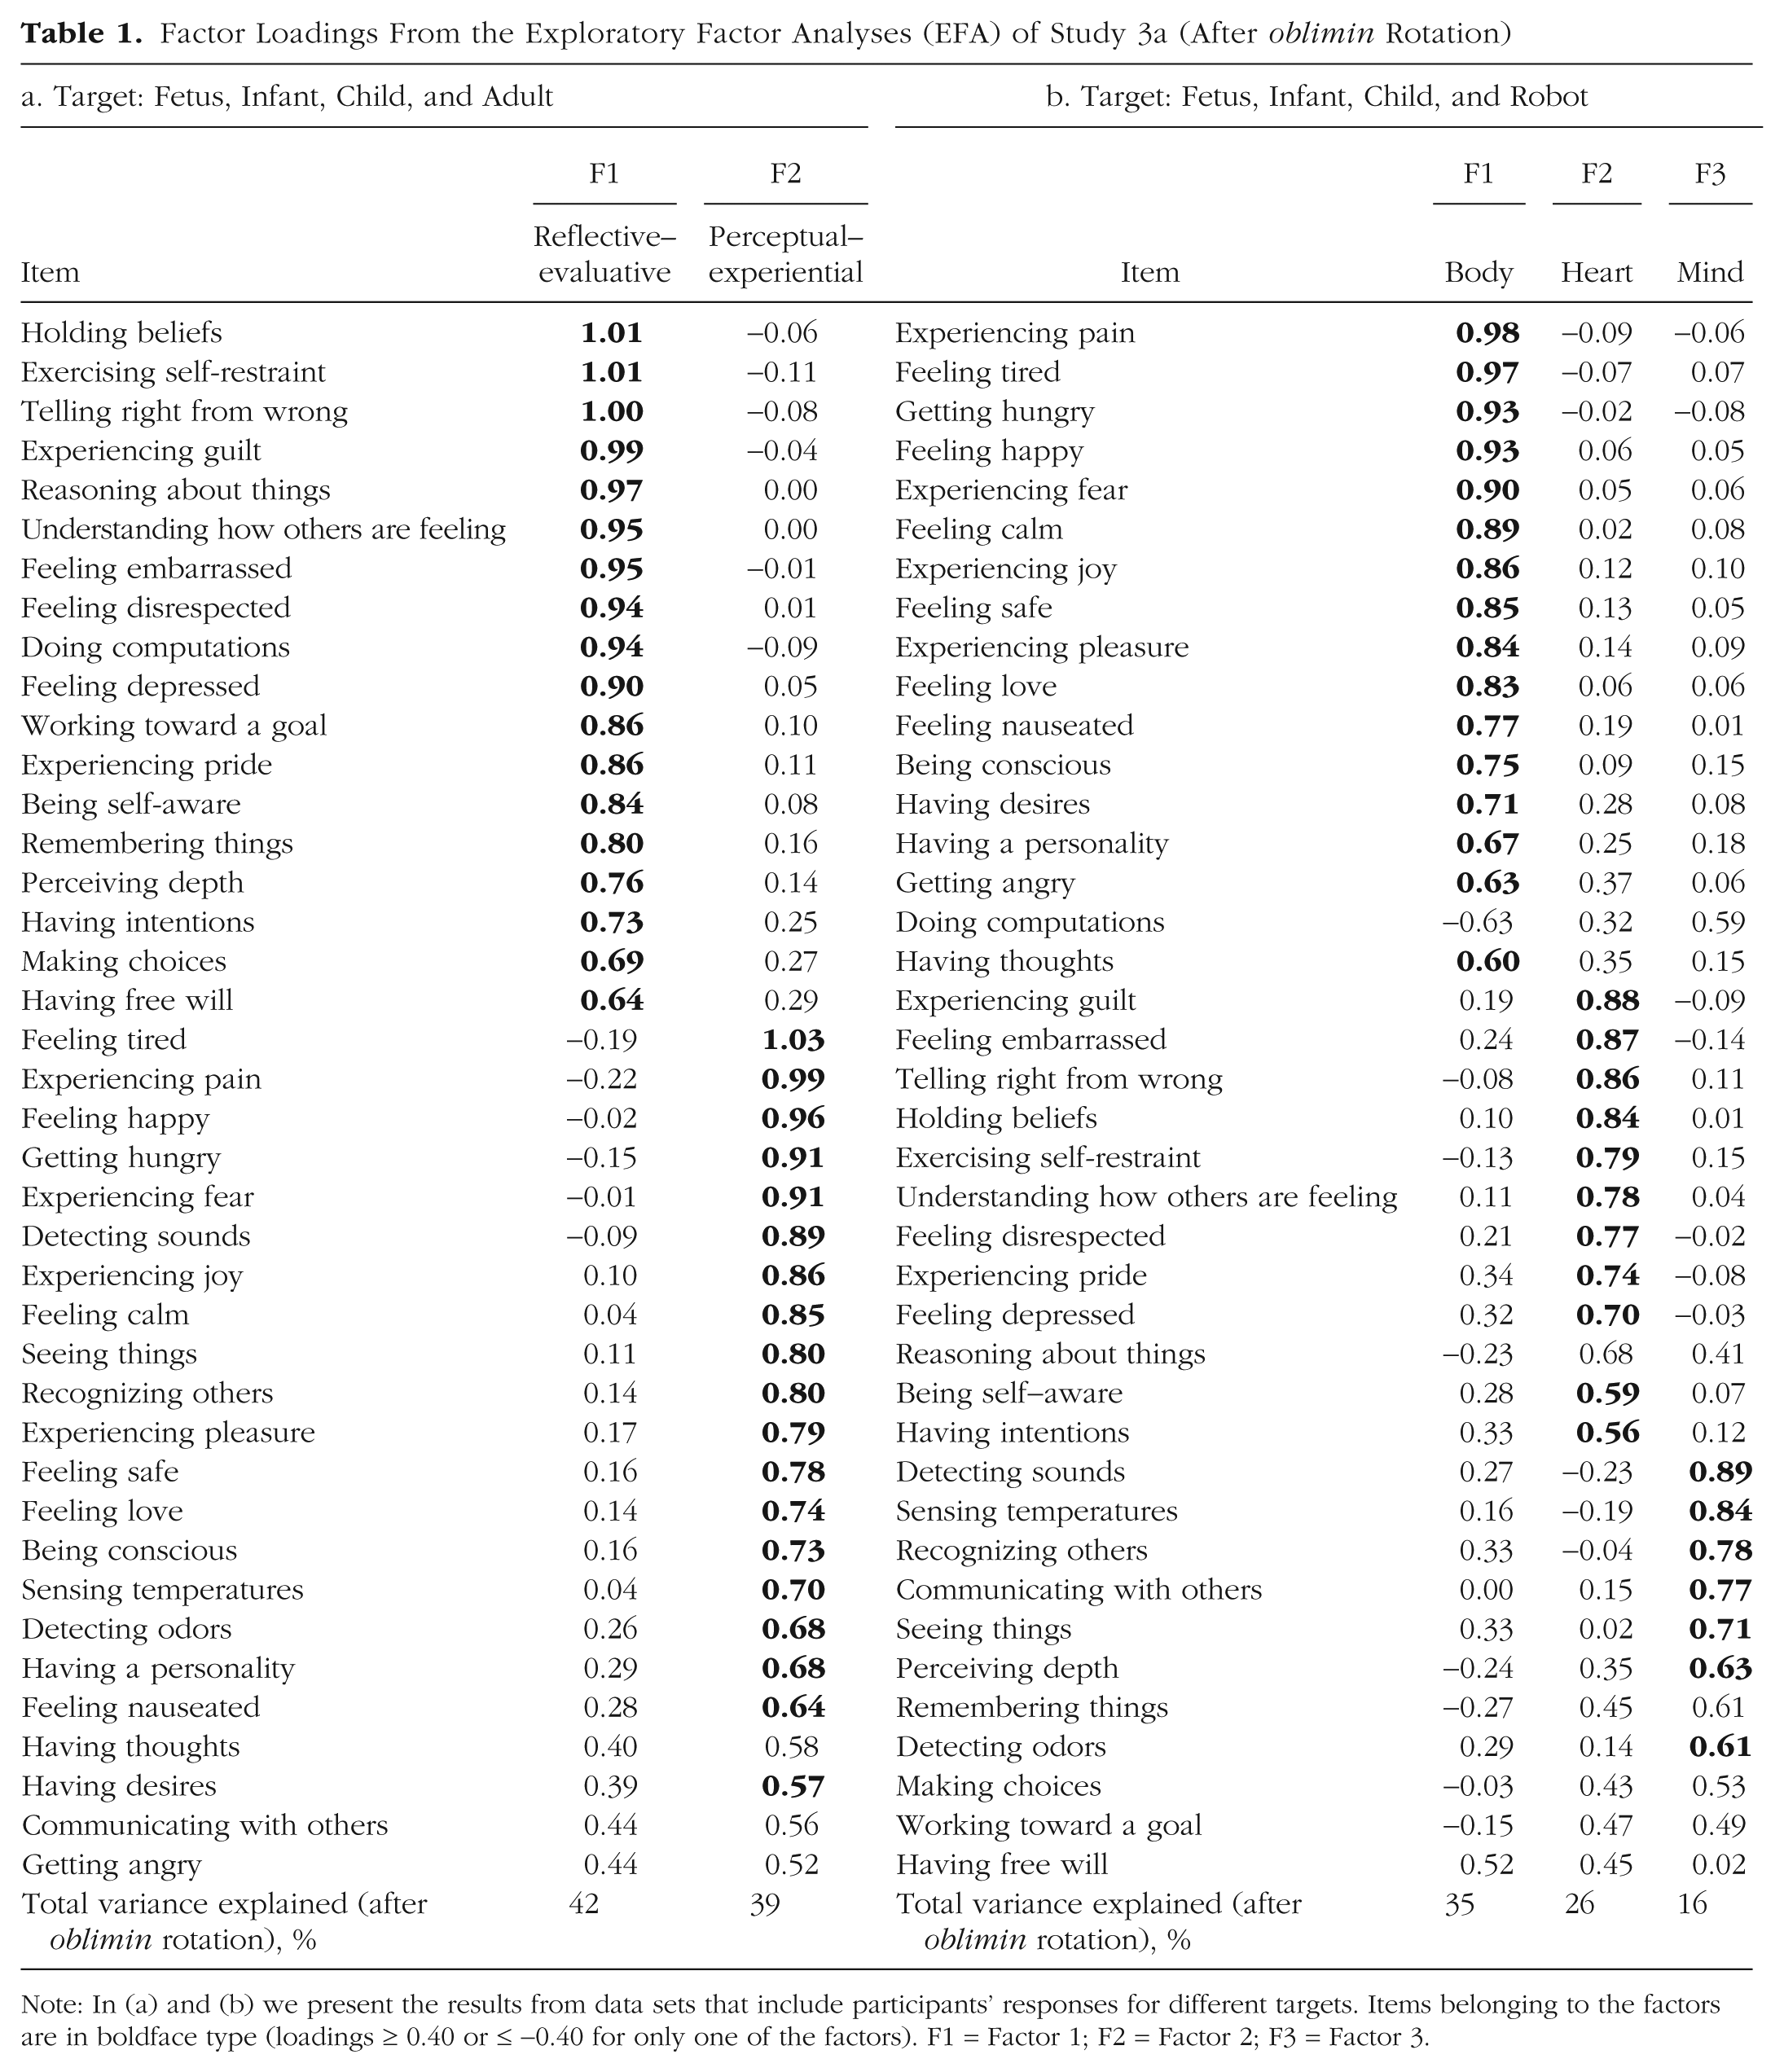
Note: In (a) and (b) we present the results from data sets that include participants’ responses for different targets. Items belonging to the factors are in boldface type (loadings ≥ 0.40 or ≤ −0.40 for only one of the factors). F1 = Factor 1; F2 = Factor 2; F3 = Factor 3.
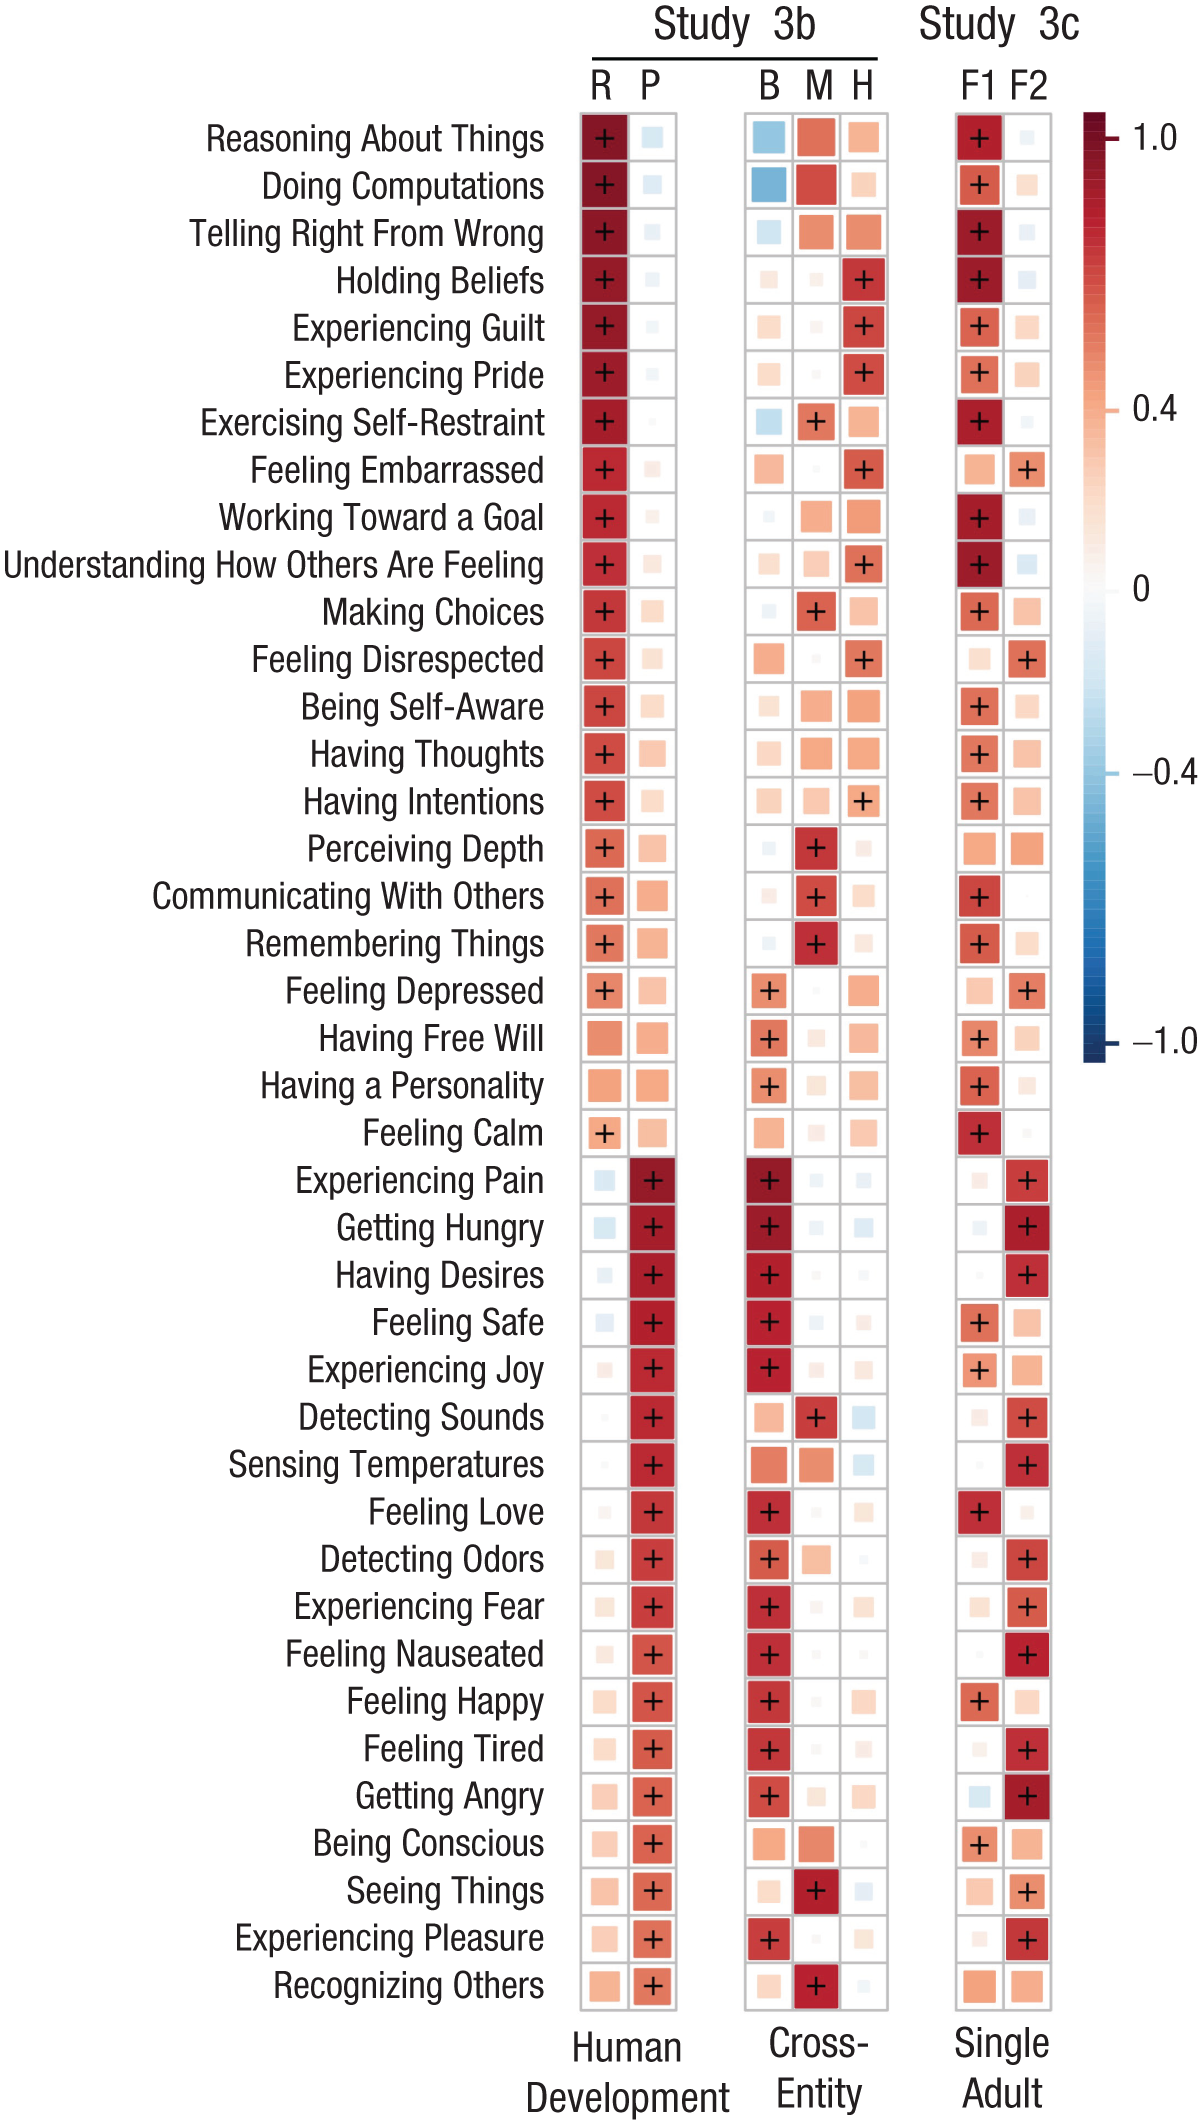
Exploratory-factor-analysis (EFA) loadings for 40 mental capacities in Studies 3b and 3c. Darker shades on the color bar indicate greater absolute loading values, with red denoting positive loadings and blue denoting negative loadings. Plus signs (+) indicate items with loadings meeting a heuristic threshold (≥ 0.40 or ≤ −0.40) on a single factor. In Study 3b, a reflective–evaluative (R) versus perceptual–experiential (P) structure emerged when evaluations included fetus, infant, child, and adult. In contrast, when evaluations included a nonhuman entity (fetus, infant, child, and robot), a body-mind-heart (BMH) structure was revealed. Study 3c focused on evaluations of an adult, yielding a two-dimensional structure that diverged from the reflective–evaluative versus perceptual–experiential pattern. F1 = Factor 1; F2 = Factor 2.
Although the task in Studies 3a and 3b differed from those in Studies 1 and 2, the reflective–evaluative versus perceptual–experiential structure observed in the context of human development remained highly consistent across studies (rcs ≥ 0.86, indicating fair similarity; Lorenzo-Seva & Ten Berge, 2006; see Fig. 3). Furthermore, in the context of entity comparisons, the body–heart–mind structure was consistently observed across cultures and between the current study and the original research by Weisman et al. (2017, Study 4; rcs ≥ 0.85, indicating fair similarity; Lorenzo-Seva & Ten Berge, 2006; see Fig. 8).
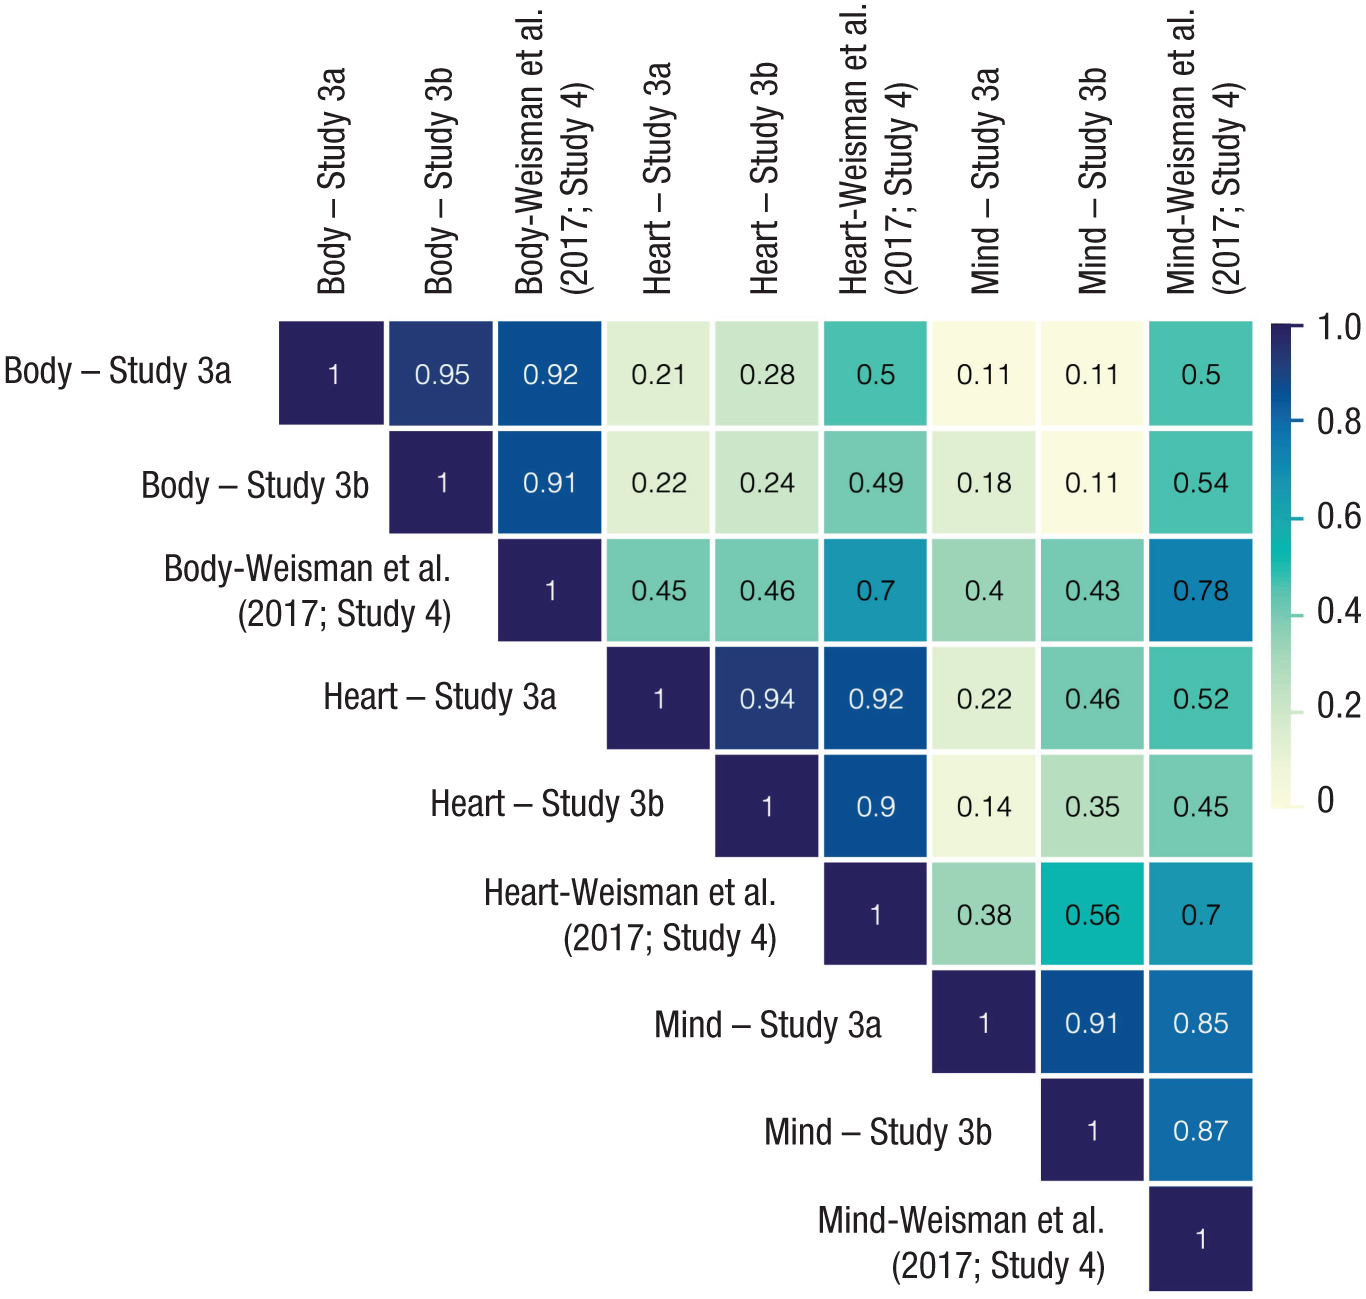
Cosine similarities (Tucker’s congruence coefficients; rc) between all pairs of factors across three-dimensional exploratory-factor-analysis solutions. Body, heart, and mind indicate the three dimensions. The rc values reflect the degree of interfactor alignment across studies, with higher values indicating stronger similarity. A value in the range of 0.85 to 0.94 indicates fair similarity, whereas a value above 0.95 implies that the two factors or components being compared can be considered equivalent (Lorenzo-Seva & Ten Berge, 2006). These results quantitatively demonstrate the robustness of a consistent three-factor structure across all samples.
In addition, the EFAs conducted across multiple independent data sets (i.e., different tasks and cultures in Studies 1 and 2) and across data sets with widely varying sample sizes (from n = 80 in Study 3a to n = 1,595 in the merged six-culture data set) consistently converged on the same two-factor structure. Although such replication does not directly quantify statistical power, the stability of the factor solution across data sets provides additional evidence that the sample sizes were sufficient for reliable factor extraction (L. L. Wang et al., 2013).
Study 3c revealed a two-dimensional structure that diverged both qualitatively and quantitatively from the reflective–evaluative versus perceptual–experiential pattern. Qualitatively, although the first factor of Study 3c included several items associated with the reflective–evaluative dimension, it also contained items that did not belong to this dimension in any other task or culture across Studies 1, 2, and 3, such as feeling safe, joy, and love (Fig. 7; see Tables S48 and S49 for detailed results of the EFA). Similarly, the second factor of Study 3c, although incorporating some items linked to the perceptual–experiential dimension, also included items that were not part of that dimension in any other task or culture across Studies 1, 2, and 3, such as feeling embarrassed, disrespected, and depressed.
Quantitatively, we applied Tucker’s congruence coefficients to assess whether the two-factor solution in Study 3c resembled the reflective–evaluative versus perceptual–experiential structure observed in the other samples (Fig. 3). These analyses indicated that the overall factor structure of Study 3c showed poor similarity, with rc < .85 being frequently observed for the relationships between the Study 3c factors and the perceptual–experiential dimension being identified in the other samples (Fig. 3; Lorenzo-Seva & Ten Berge, 2006). Together, these findings support the view that the reflective–evaluative versus perceptual–experiential structure is specific to judgments about human developmental trajectories, rather than to conceptions of human beings more generally.
Study 4
Although Studies 1 through 3 demonstrated that mental development is intuitively conceptualized along a reflective–evaluative versus perceptual–experiential structure, it remains unclear how these dimensions are interpreted in terms of developmental origins. Specifically, the developmental origins of the human mind have long been debated through the lens of the “nature–nurture” question across historical periods and cultural traditions (Confucius, 1980; Cooper & Hutchinson, 1997; Locke, 1847). Because the reflective–evaluative dimension involves more learned capacities and the perceptual–experiential dimension more instinctive ones, we hypothesized that a nature-nurture interpretation of mental capacities would align well with these dimensions. In Study 4, Japanese participants rated each capacity from 100% nature to 100% nurture, and we tested whether these ratings predicted its placement along these two dimensions.
Method
Participants
The sample size and participant-recruitment procedures were identical to those of Study 1. The final sample comprised 269 Japanese adults (Mage = 41.87 years, SD = 9.50; 118 females, 147 males, 1 intersex, and 3 participants who chose not to report their sex), with 27 participants excluded for incorrect age estimations for newborns. Participants were compensated $0.42. Participant demographics—including parenting experience, highest education, and annual household income—are reported in Tables S50–S52.
Procedure
The procedure was identical to that of Study 1, except for the following manipulation. Participants rated the extent to which they believed each capacity was attributable to nature or nurture using a continuous slider ranging from 100% nature to 100% nurture (Fig. 1). Nature and nurture were operationalized using the Japanese terms umare (literally, “by birth”) and sodachi (literally, “by upbringing”)—nontechnical, everyday expressions that distinguish traits considered innate from those shaped through experience, and which are commonly used by Japanese speakers to refer to nature-nurture distinctions.
The task for excluding inattentive participants followed the same procedure as in JP2 of Study 1: Participants first completed an attention check and a familiarization task by indicating the age they believed the character to be as a newborn baby, using text-based age-range selections (e.g., < 0.5 years).
Statistical analysis
We first investigated whether nature–nurture attributions for the mental capacities were associated with participants’ age estimations of those capacities. Specifically, we determined the rank order of nature–nurture attributions for the mental capacities (e.g., 1st = most attributed to nature) and calculated Spearman’s rank correlation coefficients between this order and the order in which participants believed each mental capacity emerged in development (e.g., 1st = earliest), on the basis of their estimations in Study 1 (JP1, JP2, and JP3). Second, we examined whether nature–nurture attributions were associated with the reflective–evaluative versus perceptual–experiential structure. Specifically, we conducted logistic regressions with dimension membership as the response variable (modeled with a binomial distribution): 1 = reflective–evaluative dimension, 0 = perceptual–experiential dimension. The percentage of nurture attribution was included as the predictor variable. Three models were conducted, using data from Study 4 as the predictor variable in all models and varying the EFA results of JP1, JP2, and JP3 as the response variables across models.
Results
We examined the relationship between the perceived developmental trajectory of mental capacities (as inferred from age-estimation order) and their perceived ontological origins (as inferred from nature–nurture attribution rank). Figure 9 illustrates this relationship, plotting the average nature-attribution rank from Study 4 against the average age-estimation order from our three Japanese studies (JP1–3) for all 40 mental capacities.
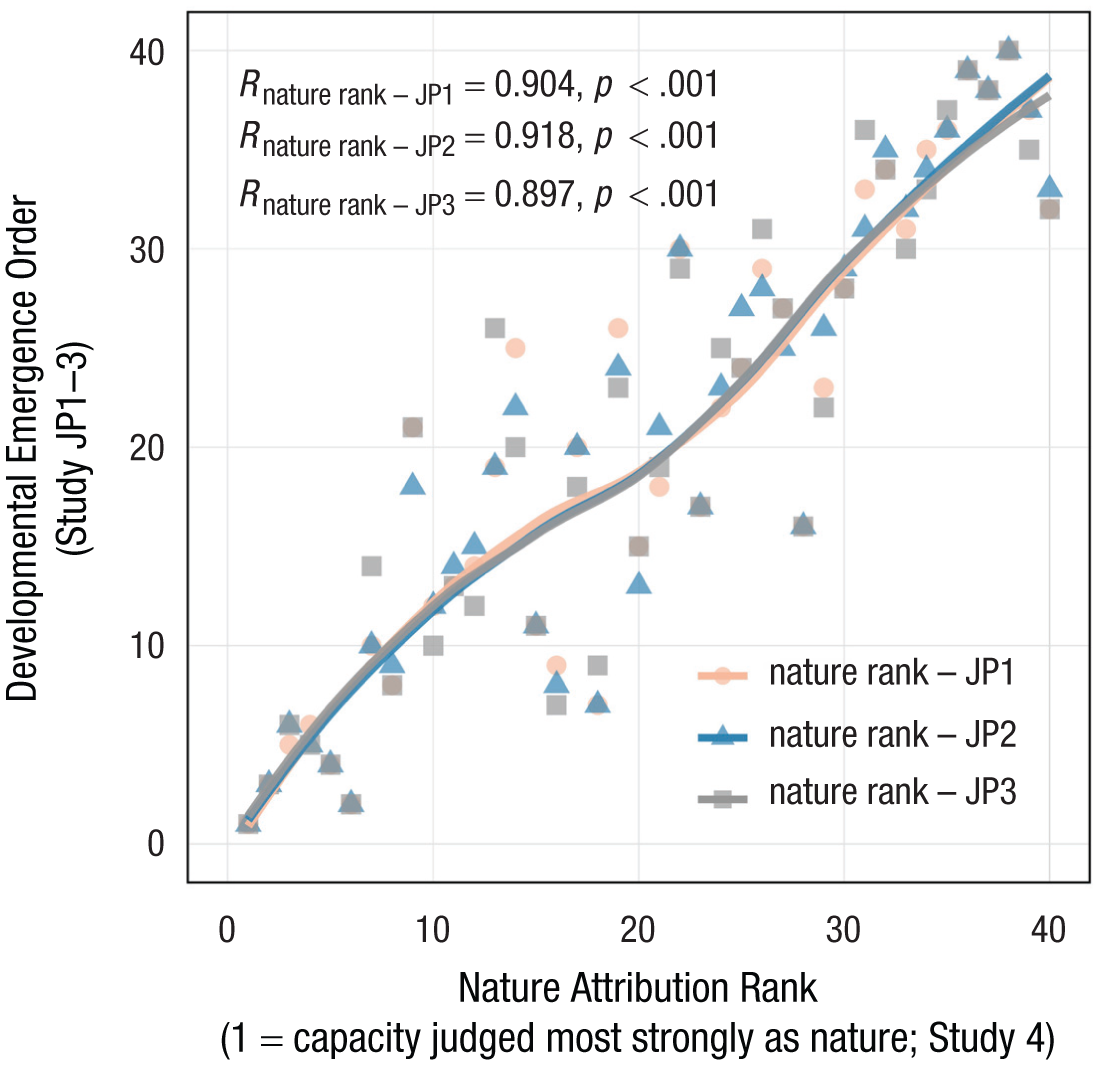
Relationship between nature-attribution rank (Study 4; 1 = capacity judged most strongly as nature) and age-estimation order (Studies JP1, JP2, and JP3) for 40 mental capacities. Scatterplots display the average ranking for each mental capacity based on participant responses. JP1, JP2, and JP3 were substudies of Study 1. Regression lines (smoothed with locally estimated scatterplot smoothing) illustrate trends for each study pair. Spearman’s rank correlation coefficients (ρ; labeled as R for readability) and associated p values are shown on each panel to indicate the strength and significance of the monotonic associations.
The analysis reveals strong, positive, and statistically significant monotonic correlations across all study pairs (Spearman’s ρs > .89, ps < .001, Fisher’s zs ≥ 1.456). The high correlation values indicate that the more a capacity is judged to be innate (i.e., nature), the earlier it is believed to emerge in human development. Conversely, capacities perceived as more acquired through experience (nurture) are consistently estimated to emerge later in life.
Logistic regressions consistently showed that the estimated probability of classification into the reflective–evaluative dimension was predicted by the extent to which participants believed the developmental origin of a capacity is due to nurture—for modelStudy 4-JP1: β = 0.132, SE = 0.042, odds ratio, or OR = 1.141, 95% confidence interval (CI) = [1.051, 1.239], p = .002, Nagelkerke’s R² = 0.707; for modelStudy 4-JP2: β = 0.181, SE = 0.060, OR = 1.198, 95% CI = [1.065, 1.348], p = .003, R² = .783); for modelStudy 4-JP3: β = 0.175, SE = 0.063, OR = 1.191, 95% CI = [1.054, 1.347], p = .005, R² = .741. This suggests that people associate the perceptual–experiential and reflective–evaluative dimensions with the nature–nurture distinction, respectively (Fig. S2).
Discussion
Although scientific research, philosophical inquiry, and theoretical work have advanced our understanding of how minds develop, far less is known about how people intuitively perceive mental growth. Across a series of studies, we found that lay beliefs about the development of mental capacities consistently cluster along two dimensions: perceptual and experiential capacities versus reflective and evaluative capacities. This two-dimensional structure was consistently observed across multiple cultural contexts, conceptually distinct from existing models of mind perception, and systematically linked to reasoning about nature versus nurture.
These findings illuminate the cognitive architecture of folk theories of mind and offer new insights into how humans conceptualize mental development. They extend prior research by showing that mind perception varies with the response context. The reflective–evaluative versus perceptual–experiential structure differed meaningfully from existing models, such as Gray et al.’s (2007) experience-agency framework and Weisman et al.’s (2017) body–heart–mind model. For example, in Gray et al.’s model, pride and embarrassment fall under “experience” and self-control and morality under “agency”; in contrast, all of these capacities loaded on the reflective–evaluative dimension in our study. Similarly, capacities in our two dimensions were distributed across the three factors of the body–heart–mind model. Notably, we showed that prior models emerged from comparisons across different types of agents, whereas the reflective–evaluative versus perceptual–experiential structure captures variation across developmental stages within human life. These findings also highlight how humans conceptualize their own minds: Although similarities exist across species, humans are treated as distinct from nonhumans in folk psychology (Doris, 2015).
Although the two-factor structure was consistent across cultures, some items showed subtle variation, likely because of linguistic and cultural interpretations. For example, “having thoughts” loads on reflective–evaluative in Japan (kangae wo motsu) but on perceptual–experiential in U.S. and U.K. samples, whereas “having desires” (yokkyu- wo motsu) reflects basic needs in Japanese but personal aspirations in English. Similar patterns occur for capacities like “being calm.” These results suggest that folk developmental theories are influenced by both perceived cognitive complexity and culturally mediated meanings (Gelman, 2003; Tsai, 2007). Future cross-linguistic norming is needed to test these interpretations.
The findings reveal that lay theories of mental development are closely tied to reasoning about innateness and learning. The reflective–evaluative versus perceptual–experiential distinction reflects intuitive assumptions about which capacities emerge naturally and which require experience. This alignment with the nature–nurture distinction helps explain enduring debates in psychology, from historical discussions of nativism and empiricism to contemporary educational and policy practices (Pinker, 2004). Like other cognitive heuristics (Gigerenzer, 2008), this intuitive framework guides how people interpret developmental phenomena and informs expectations about children’s growth and potential.
This intuitive mapping appears to be driven by a deeper explanatory mechanism. Adults tend to adopt an essentialist template when reasoning about human development: Capacities rooted in bodily sensation, perception, and basic affect are viewed as biologically grounded and therefore innately specified, whereas capacities involving reflection, social evaluation, or moral understanding are seen as dependent on cultural input and learning (Gelman, 2003). Observability further shapes these judgments: Early-emerging social capacities—such as face recognition or protocommunication—are developmentally real but perceptually opaque, leading adults to underestimate their onset and attribute them to experience rather than biology (Gopnik & Wellman, 1994; J. Wang & Feigenson, 2019). Prior research using agent-comparison tasks (e.g., humans vs. robots) did not reveal this two-dimensional organization—the separation between perceptual–experiential and reflective–evaluative capacities—because such tasks suppress origin-based reasoning (Gray et al., 2007; Weisman et al., 2017); in contrast, evaluating different stages of human life naturally activates assumptions about biological essences and social learning. Thus, the observed nature-nurture alignment may reflect an intuitive mechanism, whereby adults use perceived origin (innate vs. learned) as a causal anchor to shape expectations about mental development.
The two dimensions we identified—perceptual–experiential and reflective–evaluative—show clear conceptual parallels to classic distinctions in psychology. Perceptual–experiential capacities resemble System 1 processes (rapid, automatic, early developing), whereas reflective–evaluative capacities align more closely with System 2 processes (deliberative, inferential, later developing; Kahneman, 2011). Although our data do not directly test dual-process theory, the folk model and its estimated developmental order appear to echo this distinction. However, the folk model also diverges systematically from scientific accounts. Participants placed capacities such as communicating or recognizing others later than empirical evidence suggests. In reality, infants can discriminate others within the first months of life, and protocommunication emerges within the first year (Kelly et al., 2007; Tomasello, 2009). These discrepancies indicate that adults rely less on actual developmental timelines and more on a conceptual organization in which socially meaningful or normatively valued capacities are assumed to require greater cognitive maturity. Notably, parenting experience did not alter the underlying factor structure, suggesting that this conceptual organization is broadly shared. Still, participants with parenting experience estimated earlier developmental onsets across capacities. Thus, the folk theory reflects a stable cognitive template for thinking about mental development, modulated—but not transformed—by personal experience.
Our approach follows the dominant psychological tradition of explaining behavior through internal mental states, but this mentalistic lens may not be universal. Cross-cultural and historical evidence suggests that concepts of mind vary across cultures (Heelas & Lock, 1981; Schieffelin, 1990) and that actions are sometimes understood more in terms of social norms than through inferences about individual minds (e.g., Fingarette, 1972; Robbins & Rumsey, 2008). This highlights a key limitation of our study: All participants were drawn from industrialized, literate populations, thereby constraining the generalizability of our findings. Future research should incorporate culturally grounded models of agency, social norms, and hierarchy to assess the broader applicability of the developmental intuitions identified here.
Our findings rely on explicit self-reports of age estimations and nature–nurture attributions, which may not fully capture implicit theories of mind or behavioral expectations. Future studies could investigate whether these explicit intuitions align with actual developmental behaviors—for example, by observing parental scaffolding, children’s spontaneous actions, or using implicit cognitive tasks to probe lay expectations. Another potential limitation of the present study is that, although the 40-item set broadly covers mental capacities, it may not fully capture all aspects of development. For example, communication—a key sociocognitive skill—is represented by only a single item, which may underrepresent certain developmental trajectories. Future research could include additional items to more comprehensively examine these capacities.
Overall, by uncovering a simple, robust structure in how people reason about mental development, the current work bridges folk psychology and developmental science (Piaget & Cook, 1952; Spelke & Kinzler, 2007). People do not see mental development as a random sequence of capacities; they perceive it as an organized trajectory, anchored in perceptual and experiential capacities and extending into reflective and evaluative understanding. Charting these intuitive theories illuminates the organized interplay of cognition and culture that guides the growth of the human mind.
Supplemental Material
sj-pdf-1-pss-10.1177_09567976261453926 – Supplemental material for How Does the Mind Grow? Cross-Cultural Intuitive Theories of Mental Development
Supplemental material, sj-pdf-1-pss-10.1177_09567976261453926 for How Does the Mind Grow? Cross-Cultural Intuitive Theories of Mental Development by Xianwei Meng, Ryuji Oguni, Kuniyuki Nishina, Taro Murakami, Yuka Mizuno and Jinjing (Jenny) Wang in Psychological Science
Footnotes
Transparency
Action Editor: Louis J. Moses
Editor: Simine Vazire
Author Contributions
References
Supplementary Material
Please find the following supplemental material available below.
For Open Access articles published under a Creative Commons License, all supplemental material carries the same license as the article it is associated with.
For non-Open Access articles published, all supplemental material carries a non-exclusive license, and permission requests for re-use of supplemental material or any part of supplemental material shall be sent directly to the copyright owner as specified in the copyright notice associated with the article.