
Abstract
Background
Carsickness is a potential barrier to the acceptance of automated driving as it turns drivers into passengers, thus making them more susceptible to motion sickness. However, most of our current knowledge of how vehicle motion causes motion sickness comes from seasickness studies, using vertical motion only. Some more recent studies have investigated the relationship between horizontal accelerations and motion sickness, but with inconsistent methodology and sometimes conflicting results.
Objective
To quantify the effects of acceleration frequency and magnitude for periodic accelerations along the longitudinal, lateral, and vertical axes in a large sample of participants, using consistent methodology throughout.
Methods
In three separate experiments, in total 107 participants were exposed to sinusoidal accelerations along either the longitudinal, lateral or vertical axis with different combinations of motion frequency and peak acceleration. Motion frequency was varied between 0.03 and 3.2 Hz, with peak acceleration ranging from 0.5 to 4.0 m/s2. Motion sickness was measured during motion exposure using the Motion Illness Symptoms Classification (MISC) scale, while the Simulator Sickness Questionnaire (SSQ) and a visual analogue Discomfort scale were administered after each motion exposure.
Results
Motion sickness severity due to motion exposure was similar for the three motion axes. All three outcome measures showed a clear motion frequency dependency, with motion sickness in general most severe for frequencies around 0.2 Hz. However, significant motion sickness symptoms were observed for the entire frequency range tested. The frequency dependency was less clear for lateral motion than for longitudinal and vertical motion. Higher accelerations led to more severe motion sickness, with the rate of increase decreasing when accelerations became higher.
Conclusions
Our results show that motion sickness due to periodic linear accelerations occurs along all three cardinal axes and that it depends on motion frequency. This frequency dependency was less clear for lateral motion than for longitudinal and vertical motion. Our results have important implications for both predictive models of motion sickness as well as for applications in automated vehicles.
Introduction
Motion sickness is a syndrome of adverse symptoms caused by exposure to either physical motion, visual motion, or a combination of the two.1–4 Symptoms can be quite diverse, such as increased stomach awareness, pallor, sweating, drowsiness, dizziness, flushing, salivation, burping, flatulence, headache, nausea, retching, and ultimately emesis (vomiting). 5 In extreme cases, these symptoms may persist for a prolonged period of time.3,6 Motion sickness occurs in all major forms of passive transportation, be it in airplanes (airsickness), ships (seasickness) or cars (carsickness).4,7 Especially the latter form has recently received increased attention due to developments in automated driving. Since carsickness occurs much more frequently in passengers than in drivers (who currently make up the large majority of car occupants),8,9 turning drivers into passengers by automating the driving task is expected to vastly increase the incidence of motion sickness in automated vehicles, which may pose an obstacle to their acceptance.10,11
Historically, much of the research on motion sickness has focused on seasickness. 12 In fact, the word ‘nausea’ stems from the Greek word for ship. This focus was largely motivated by adverse effects of seasickness experienced by soldiers aboard ships in amphibious operations, such as during World War II. A series of studies both in the laboratory13–23 and at sea24,25 pointed to vertical acceleration (heave) as the dominant factor in the causation of seasickness aboard large ships. Based on these results, the motion sickness specific parts of the British Standard 6841 26 and the ISO 2631-1 standard 27 were formulated. Both standards offer a similar mathematical model to predict which proportion of people can be expected to suffer from seasickness (operationalized as emesis or vomiting) given a certain vertical acceleration profile for durations up to several hours. We will refer to this model as the ISO 2631-1 model. An important element of this model is a frequency weighting function that describes how motion sickness depends on the frequency of acceleration. Peak sensitivity was found to lie around 0.17 Hz, with sensitivity dropping off for both lower and higher frequencies. 23 In addition, motion sickness incidence was found to increase monotonically with higher acceleration magnitudes. 23
Despite its origin in seasickness, the ISO 2631-1 model has also been used to predict carsickness (e.g., 28–35). Since vertical vehicle accelerations during driving are typically of small magnitude and high frequency 29 (except when driving over speed bumps, see 36), carsickness is thought to be mainly due to horizontal accelerations, that is, along the longitudinal axis from accelerating and braking, and along the lateral axis during cornering or lane changes. 37 Thus, applying the ISO 2631-1 model to carsickness by including both horizontal and vertical accelerations assumes that horizontal accelerations have a similar effect on motion sickness as vertical accelerations do in terms of magnitude and frequency of acceleration. This, however, is far from clear. Moreover, the ISO model only considers emesis. In passenger cars, emesis can often be avoided by driving more cautiously or by stopping the vehicle and allowing passengers to recover. Thus, it is important to be able to predict pre-emesis symptoms of motion sickness and understand how they are affected by motion axis, frequency and acceleration magnitude.
Golding and colleagues investigated whether the effect of accelerations along the nasal-occipital axis, or the head’s x-axis (in this paper, we will follow the coordinate system conventions as described in ISO 2631-1, 27 with the positive x-axis pointing forward in the longitudinal direction, the positive y-axis leftward in the lateral direction, and the positive z-axis upward in the vertical direction) on motion sickness differs from that caused by accelerations along the rostral-caudal axis (the head’s z-axis).38,39 They did this with both seated and supine participants to test to which extent motion sickness effects depend on the orientation of the person with respect to gravity. The authors concluded that motion sickness was determined by two relatively independent effects. 39 Motion along the head’s x-axis was found to be more nauseogenic than that along the head’s z-axis, independent of the head’s orientation relative to earth. In addition, participants were more susceptible to motion sickness when seated upright than when lying down supine. Their conclusions matched the findings in an earlier study, performed in a moving vehicle, which found that participants reported more severe motion sickness when exposed to longitudinal vehicle accelerations while seated compared to lying down. 40 However, Golding and colleagues performed their studies with a rather limited range of motion frequencies (0.3 and 0.35 Hz) and acceleration amplitudes (2.5 and 3.6 m/s2), so it was unclear whether these results generalize to other frequencies and amplitudes.
In another set of studies, the effects of longitudinal and lateral motion on motion sickness were compared (all with participants sitting upright, meaning that the direction of head-relative motion matched that of earth-relative motion when the head was stable). Griffin and Mills 41 compared the two motion directions for a range of motion frequencies (0.2–0.8 Hz) and constant peak velocity as well as for a range of acceleration magnitudes (0.28–1.11 m/s2 rms) (rms = root-mean-square) with constant frequency. 42 Their results showed no systematic differences between longitudinal and lateral motion in terms of motion sickness. Motion sickness ratings were highest at 0.2 Hz and 1.11 m/s2 rms. Donohew and Griffin 43 tested motion sickness at frequencies between 0.0315 and 0.2 Hz, but only for lateral motion. They reported that motion sickness increased with frequency up to 0.2 Hz, which, combined with the results from Griffin and Mills, 41 suggested a similar frequency dependency as for vertical motion. This was indeed the conclusion drawn by Golding et al., 44 who measured motion sickness for longitudinal motion at 0.1, 0.2 and 0.4 Hz. However, since Donohew and Griffin kept peak velocity constant, in their study peak acceleration was confounded with motion frequency. These authors therefore concluded that, at least for lateral motion, motion sickness sensitivity is independent of frequency up to 0.2 Hz, after which it decreases for higher frequencies at least up to 0.8 Hz. In a more recent study on the effect of motion frequency, Irmak and colleagues 45 exposed participants to longitudinal accelerations with a sinusoidal profile and 2 m/s2 peak acceleration. Participants were exposed for up to 30 min to motion with a frequency of 0.15, 0.2, 0.3, 0.4, or 0.5 Hz. No significant differences between motion sickness with different frequencies were found. However, the authors did report that participants varied strongly in their frequency responses.
Mills and Griffin 46 also compared motion sickness caused by longitudinal and lateral motion (while sitting upright), with different amounts of back support. With a low backrest, allowing for upper body motion, motion sickness ratings were higher for longitudinal than lateral motion (both with 0.7 m/s2 rms at 0.25 Hz). With a high backrest, no significant difference between the two directions was found. Participants were found to be almost three times as likely to suffer from motion sickness with a low backrest compared to the high backrest, regardless of motion direction. In a recent driving simulator study, finally, Wijlens and colleagues, 47 compared motion sickness for the same simulated ride with higher physical accelerations in either the longitudinal or in the lateral direction. Overall, they found no significant difference in motion sickness for the two conditions, but they did observe an increasing difference during the last 10 min of the 30 min test session, with motion sickness ratings increasing more in the condition with stronger longitudinal acceleration.
Taken together, these results suggest that it is as yet unclear whether motion sickness develops similarly for exposure to longitudinal, lateral and vertical motion. Moreover, it has also not been clearly established whether one frequency sensitivity function holds for frequency effects in the different directions, or that this function depends on motion direction. In the current study, we investigate motion sickness caused by periodic acceleration along the three cardinal axes for a range of motion frequencies and amplitudes. Motion sickness was measured systematically across a large range of symptom severities in three experiments, each investigating one motion direction (longitudinal, lateral, or vertical). Using a consistent methodology in all three experiments allowed us to make direct comparisons between the different motion directions. This paper will focus on the effects of motion frequency and peak acceleration and compares the effects for the three different directions.
Methods
Participants
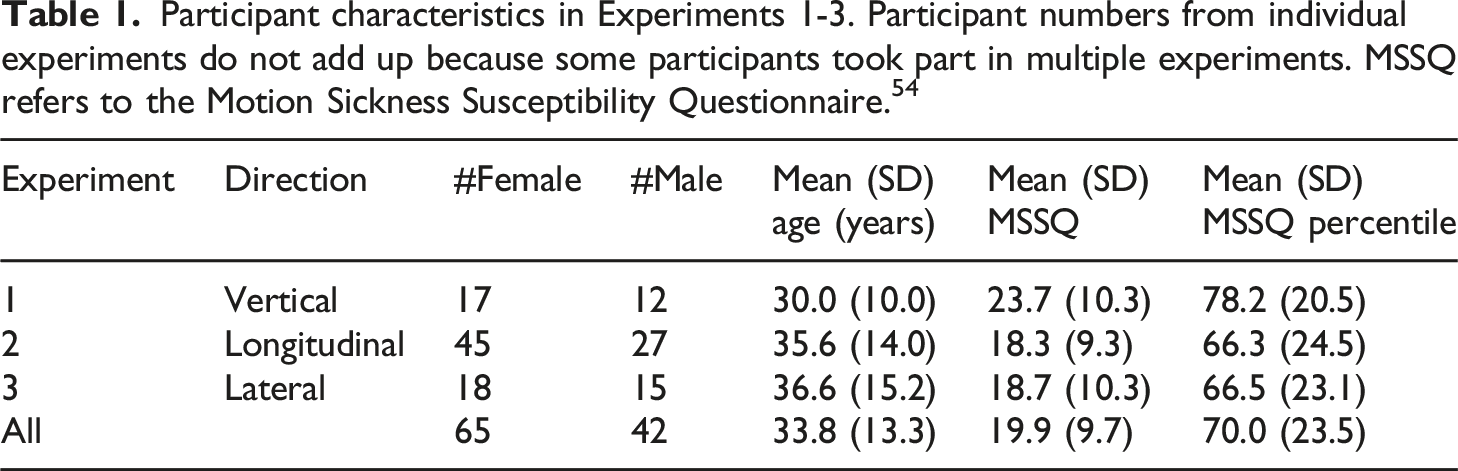
Participant characteristics in Experiments 1-3. Participant numbers from individual experiments do not add up because some participants took part in multiple experiments. MSSQ refers to the Motion Sickness Susceptibility Questionnaire. 54
Motion stimuli and apparatus
Participants were exposed to continuous periodic motion with several different sinusoidal profiles. In Experiment 1, participants were exposed to periodic vertical motion. The motion stimulus was generated by the Desdemona motion simulator, which consists of a fully enclosed cabin that can rotate simultaneously around all three cardinal axes (roll, pitch, and yaw), as well as move vertically (Figure 1(a)). In addition, the cabin can be moved along a horizontal axis, which in turn can rotate around a central yaw axis, thus providing 6 degrees of freedom in total.
49
In this experiment, only the vertical axis was used, which allowed for a maximum displacement of 2 m, a maximum velocity of 2.0 m/s and a maximum acceleration of 4.9 m/s2. Participants were seated in a safety seat with headrest and secured by a 5-point safety belt. While the seat included a head rest, head motion was not restricted, similar to the situation in a car. (a) Desdemona 6DoF motion simulator. (b) TNO Limosine linear motion simulator. Insert: Rally seat with 5-point safety belt.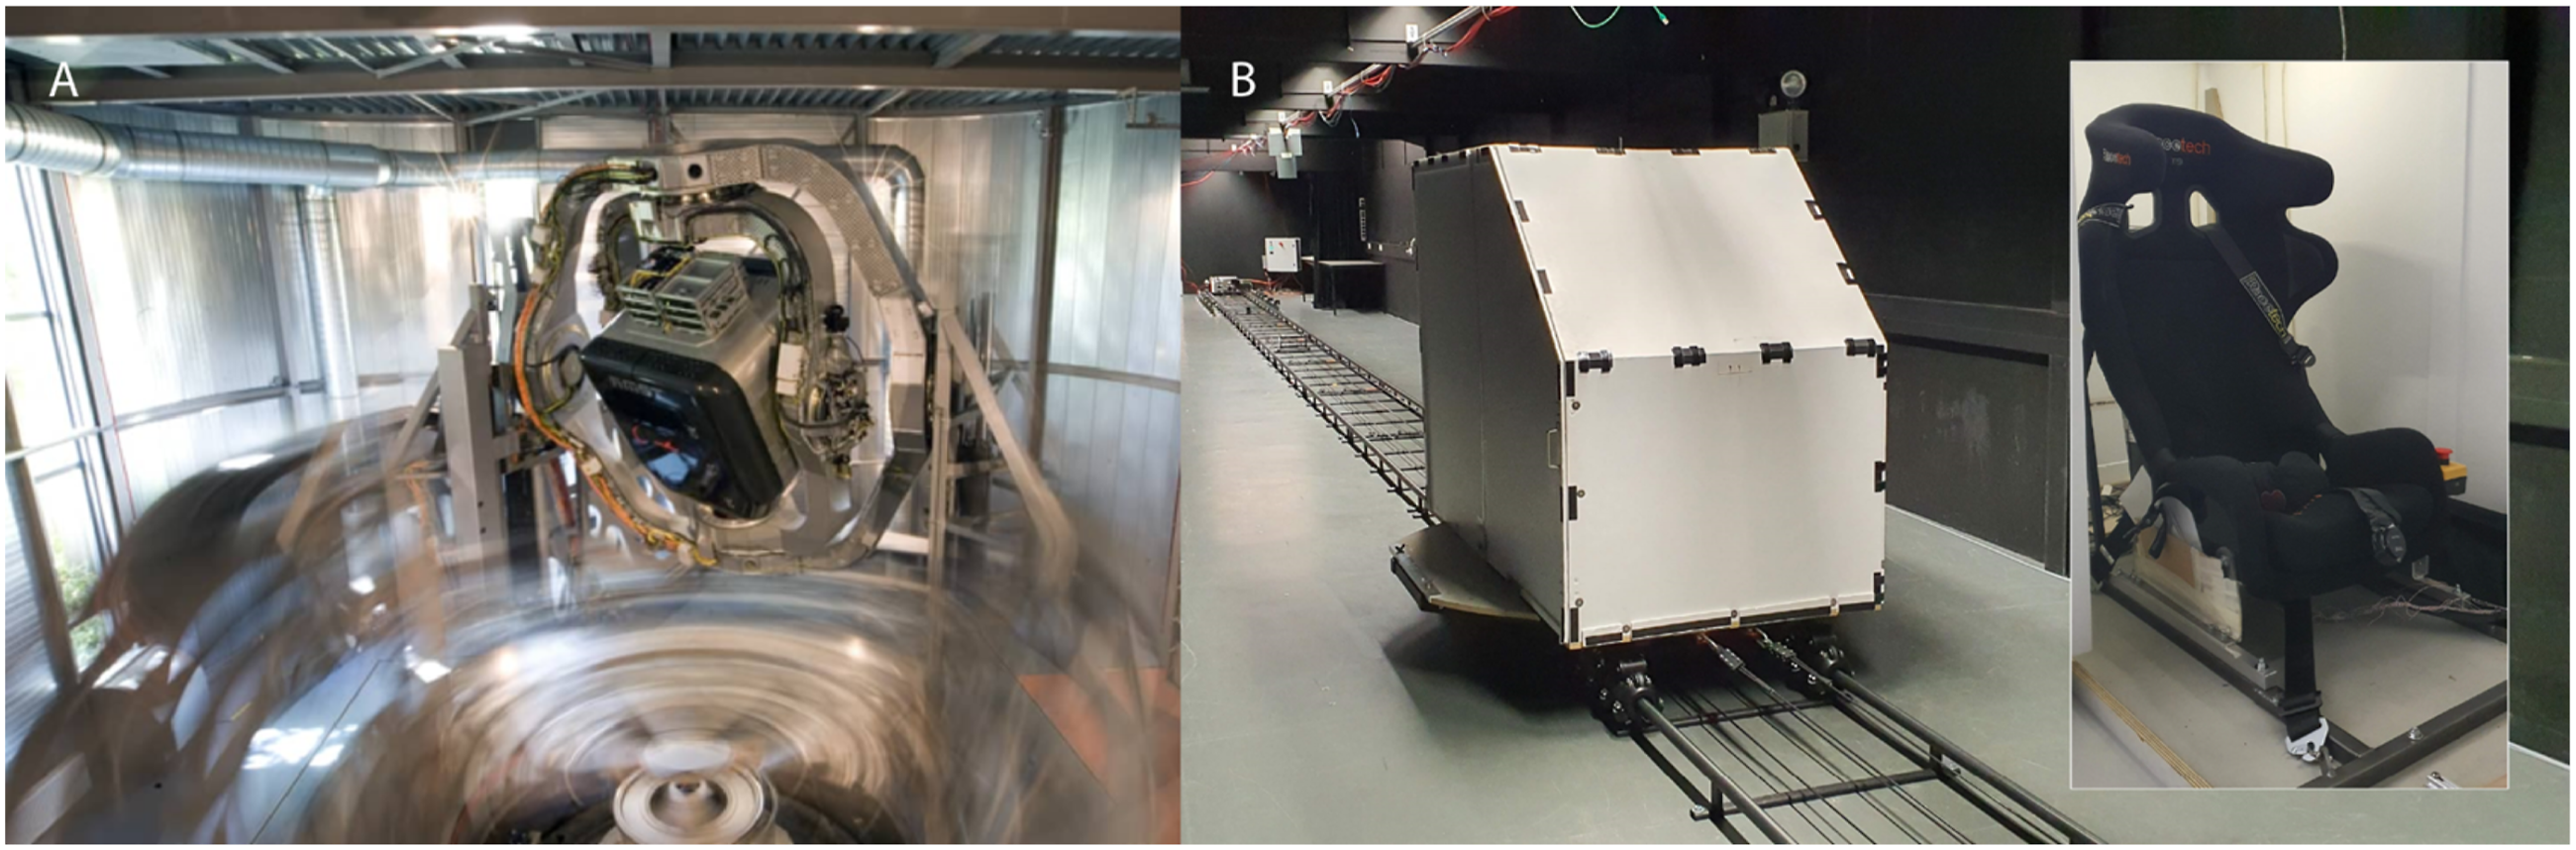
In Experiments 2 and 3, motion profiles were generated using the TNO Limosine motion simulator, which consists of a fully enclosed cabin on a dolly running along a 40 m long linear track (Figure 1(b)). This simulator is capable of generating speeds up to 14 m/s with a maximum acceleration of 5 m/s2. In Experiment 2, the cabin was oriented along the track (as in Figure 1(b)), with the participant facing in the direction of motion, resulting in longitudinal motion along the x-axis. In Experiment 3, the cabin was rotated by 90° on the dolly, generating lateral motion along the participant’s y-axis. Similar to Experiment 1, participants were seated in a rally seat, secured with a 5-point safety belt.
In both simulators, real time video and audio (through headphones with microphone) connection with the test leader was available for monitoring and communication purposes. The cabin inside was lit by white LEDs and inside temperature was kept approximately constant by the use of ventilators. Participants could see inside the cabin, but not outside. This was similar to the conditions under which the data on which the ISO 2631-1 model is based. They were instructed to stay seated upright in a relaxed manner, with their eyes open and head upright, facing forwards. This was monitored by the test leader during test sessions. White noise (or pink noise in the case of the Desdemona simulator) was played over the headphones to mask any simulator sounds.
Motion profile characteristics and results summary for Experiments 1-3. ‘Aborted’ refers to test sessions that were aborted before 20 min because of MISC >6. ‘No symptoms’ refers to sessions in which participants reported MISC = 0 throughout the entire session.
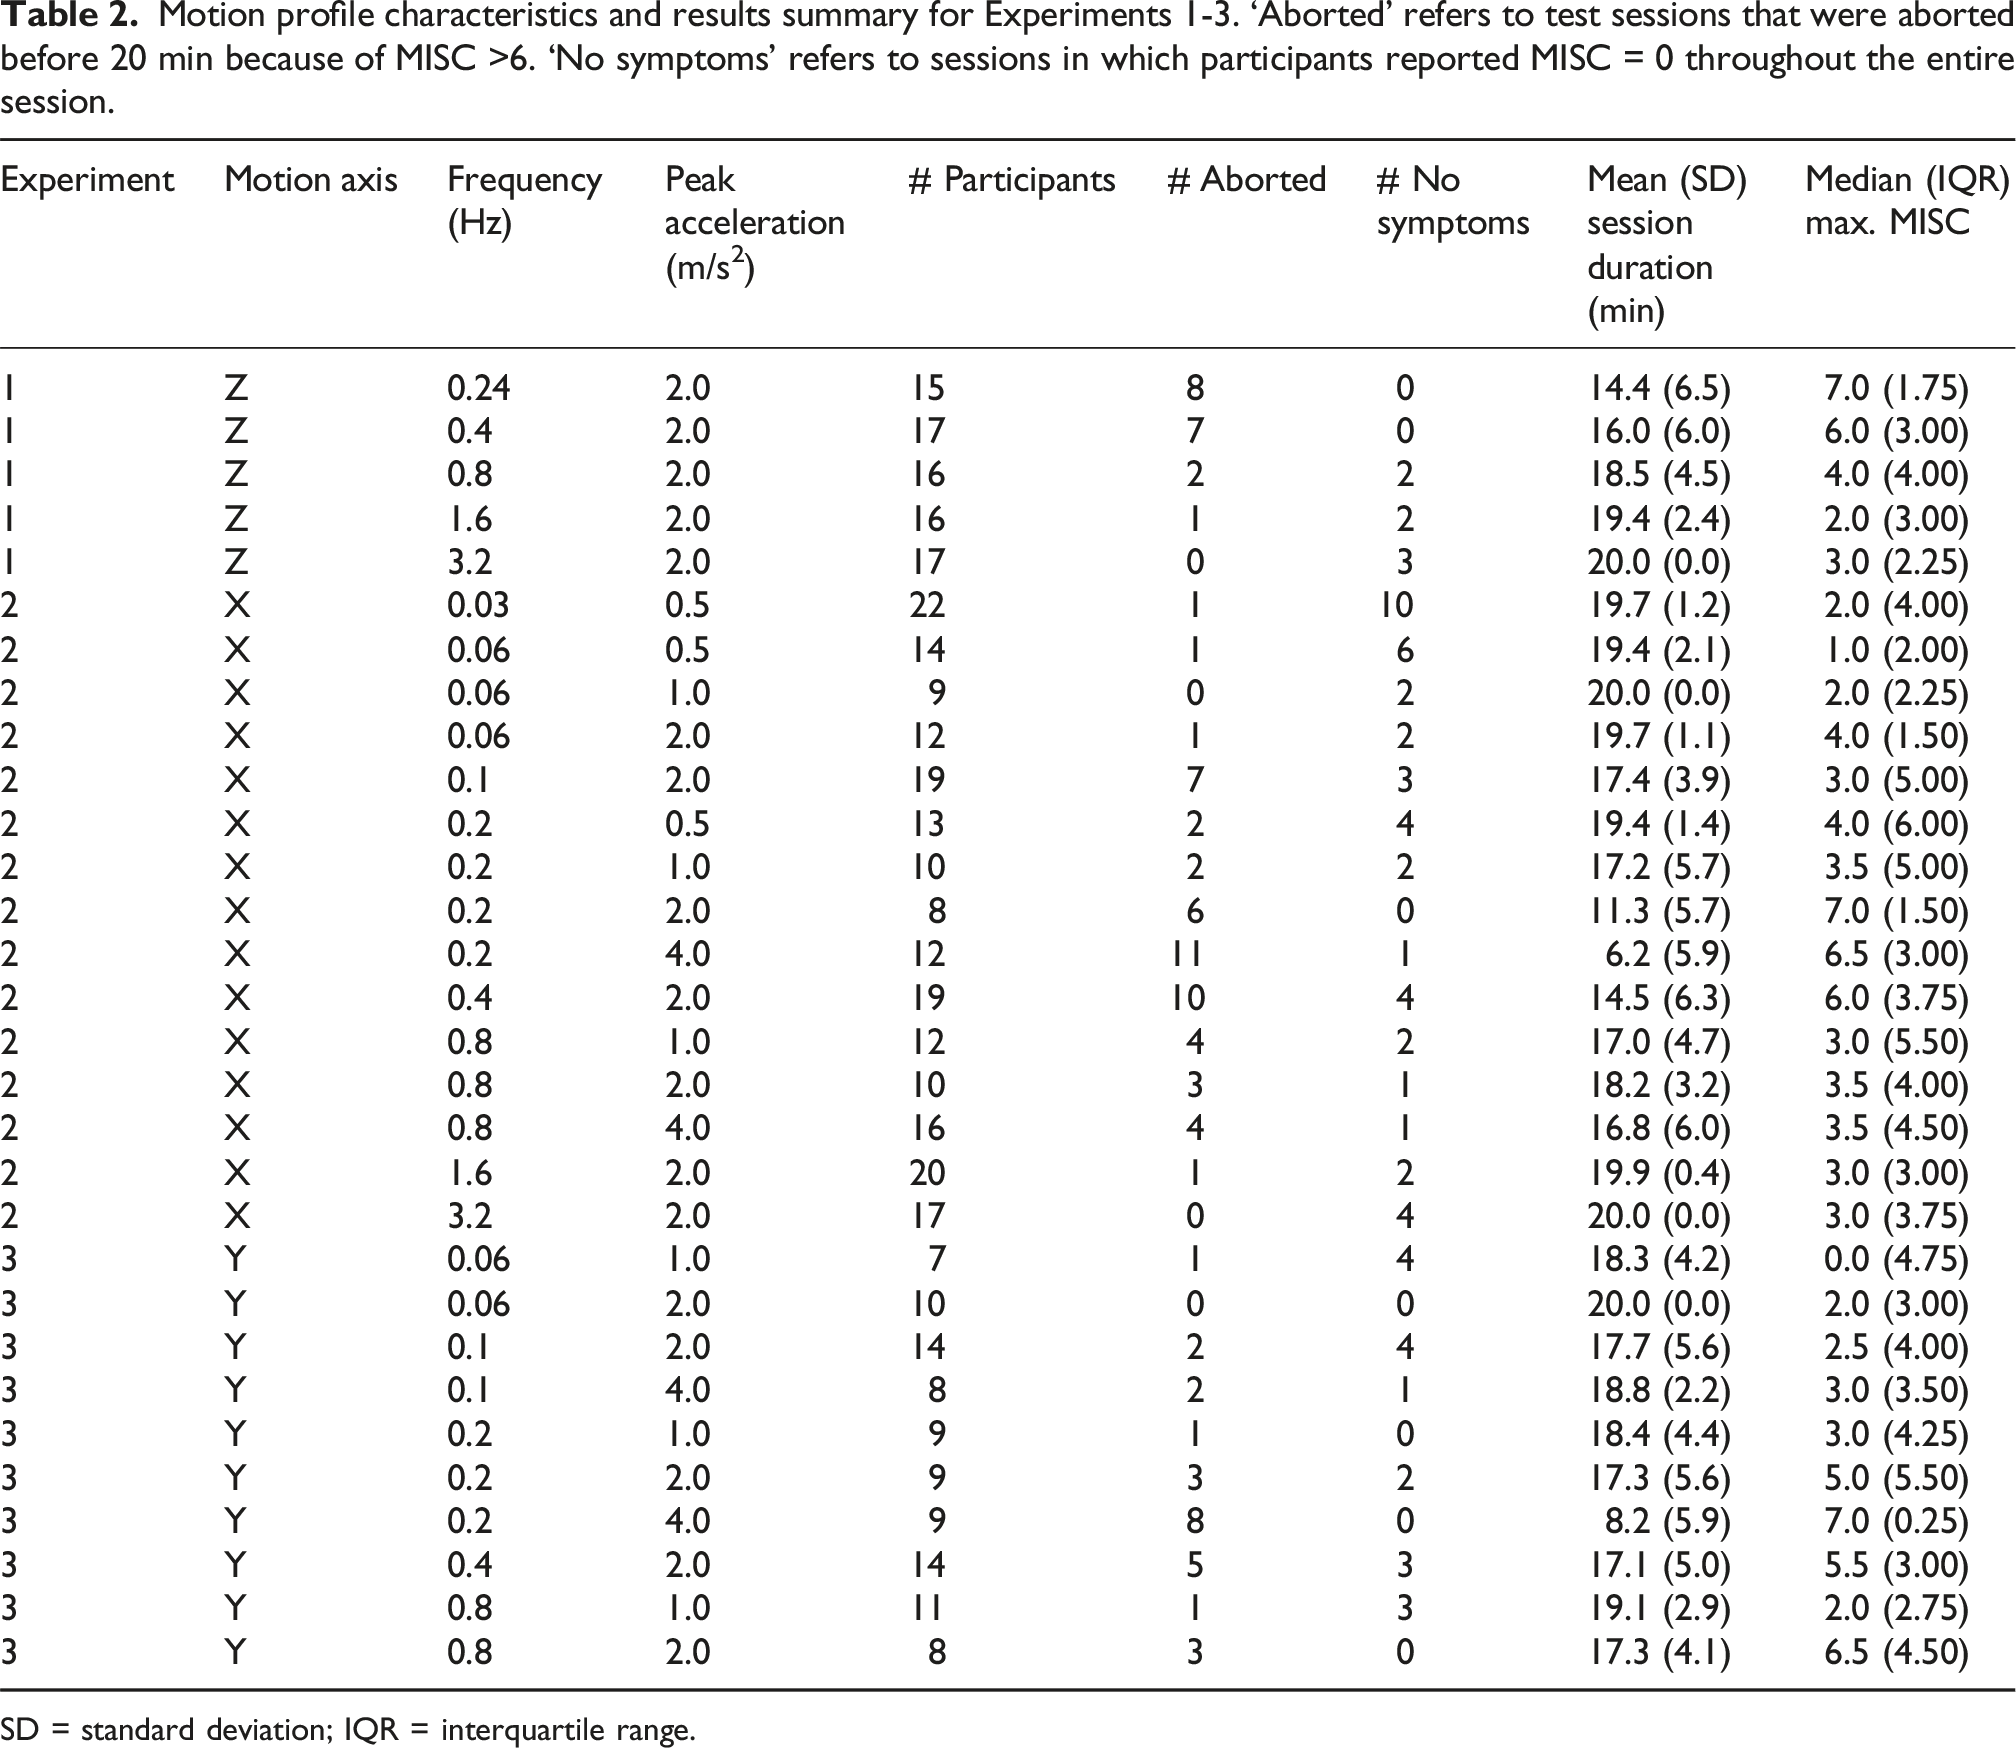
SD = standard deviation; IQR = interquartile range.
Design and procedure
In Experiment 1, each participant was randomly assigned to be exposed to three different motion frequencies. In Experiments 2 and 3, each participant was randomly assigned to three different combinations of motion frequency and peak acceleration according to a D-optimal design of experiments. 50 For a frequency of 0.2 Hz, all peak accelerations were tested. Similarly, for one peak acceleration (2 m/s2), all frequencies were tested. In addition, different combinations of frequencies and peak acceleration were tested to allow for testing potential interaction effects. Each exposure took place in a separate test session, with sessions separated by at least 24 h. At the start of the first session, participants signed the informed consent and completed the Motion Sickness Susceptibility Questionnaire [MSSQ; 22]. They were instructed how to report any symptoms of motion sickness they might experience using the Motion Illness Symptoms Classification scale [MISC, 15]. Specifically, they were instructed to rate their motion sickness at a MISC value of 6 or higher if they experienced nausea, irrespective of the possible presence of other motion sickness symptoms. During the test session in the simulator, they were prompted by the experiment leader to rate their motion sickness every 2 min verbally using the MISC scale. The MISC scale was continuously visible in front of the participant in the simulator cabin. MISC ratings were recorded in a spreadsheet by the test leader. Between ratings, participants performed an auditory 1-back working memory task 51 that lasted 90 s, to control attention. They memorized the total number of repeated vowels and reported these after giving the MISC rating (these data were not analyzed). The motion exposure ended after 20 min, or when a MISC rating higher than 6 (indicating more than mild nausea) was reached, whichever came first. After each exposure, participants filled out a debriefing questionnaire, which consisted of the Simulator Sickness Questionnaire [SSQ, 42] and a general discomfort score (1-100) on a visual analogue scale (VAS). Participants were monitored until their MISC rating returned to a value of 2 or lower (which was usually within 5 to 10 min), after which they were free to go. The first test session within each experiment took about 60 min, while the other sessions had a duration of approximately 45 min.
Analysis
Several considerations had to be taken into account when choosing an appropriate statistical model for data analysis. Experiments 2 and 3 followed an incomplete, unbalanced factorial design, with each participant contributing multiple MISC observations for multiple combinations of motion frequency and peak acceleration. In Experiment 1, each participant contributed observations to a subset of all frequencies tested. The MISC scale can be considered to provide an ordinal measure of motion sickness symptoms, with ratings typically increasing monotonically when motion sickness becomes more severe.
52
Therefore, MISC data were analyzed using a multi-level ordinal model, also known as a cumulative link mixed-effects model, and implemented in R (version 4.0.2) using the package ordinal (version 2019.12-10).
53
Instead of predicting the average MISC score (as in normal linear regression), this model predicts the proportion P of observations with a MISC score above a certain criterion value c (with c in our case ranging from 0 to 6), at a specific timepoint in a given condition defined by frequency, direction and acceleration. This approach also matches that of the ISO 2631-1 model, which predicts the proportion of people expected to reach emesis (equal to P(MISC = 10). A probit link function (i.e., a cumulative normal distribution) was used as the probability function in this model (similar to 23). The basic model equation is given by
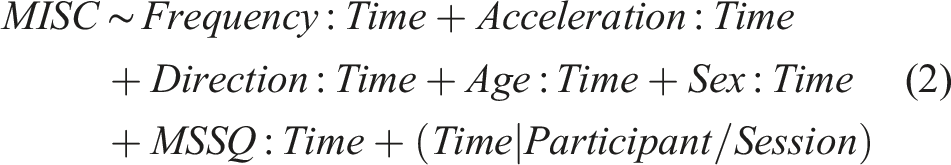
All factors were included only in interaction with time (as indicated by the colon operator), because any effects of these factors could only become apparent over time. Time itself was included as the square root of time since session start in seconds. This follows the ISO 2631-1 model, which also describes motion sickness incidence as a function of the square root of time. Preliminary analyses suggested that this did indeed provide a better fit to the MISC data than including time as a linear factor. The continuous predictors age (range 18-60) and MSSQ percentile (range 0-100) were linearly scaled to the interval [−1, 1], to allow for better comparison of their relative effects. Higher order interactions (beyond the interaction with time) could not be tested because this required a higher number of degrees of freedom than allowed by the dataset. Acceleration of 2 m/s2 was used as reference value for peak acceleration, the longitudinal (X) direction for motion direction and female for sex. Because the 0.24 Hz frequency was only used in Experiment 3 (where it was the lowest frequency that could be tested), this was equated to 0.20 Hz in this analysis. Otherwise, frequency and direction would be confounded, which would lead to unreliable parameter estimates. As there are no standard metrics for the goodness-of-fit of ordinal mixed-effects models with probit link function, the proportion of explained variance R2 was computed using the Nakagawa formulation as implemented in the R package performance (version 0.16.0), using the r2_nakagawa() function. 55 In addition, the intraclass coefficient (ICC) was computed, using the icc() function from the same package. Note that these are both computed on the latent variable, not on the outcome variable of the ordinal model. Therefore, we also determined the accuracy (percentage of correct predictions), sensitivity (true positive rate) and specificity (true negative rate) of the model for MISC levels c ∈[0, 6].
Due to the incomplete factorial design, the interaction of frequency and motion direction could not be tested within this analysis. Therefore, two separate analyses were conducted in order to investigate whether the effect of frequency was similar for the three motion directions. The first analysis compared the effect of motion frequency between longitudinal and lateral motion, while the second analysis compared longitudinal and vertical motion. The three directions could not be analyzed in one analysis, because the frequency ranges for the lateral and vertical motion differed too much. Both analyses used a similar ordinal model as in equation (2), but for a subset of the data with only the frequencies that were common to both respective directions and only for an acceleration amplitude of 2 m/s2 (which was the only amplitude for which all frequencies were tested). The model equation in R was given by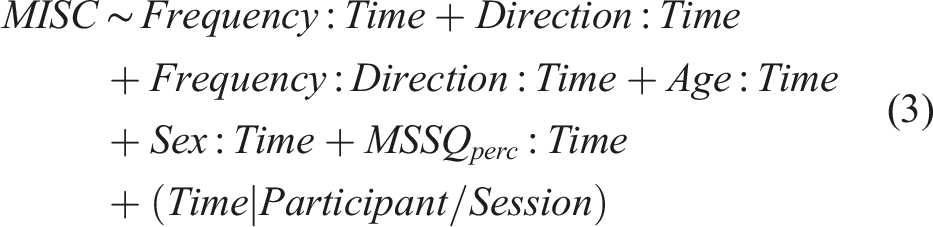
The model was fitted to both combinations of directions once with and once without the interaction between frequency and direction and the two models were compared using a likelihood ratio test.
Similarly, the effect of acceleration amplitude was compared for longitudinal and lateral motion using the following model.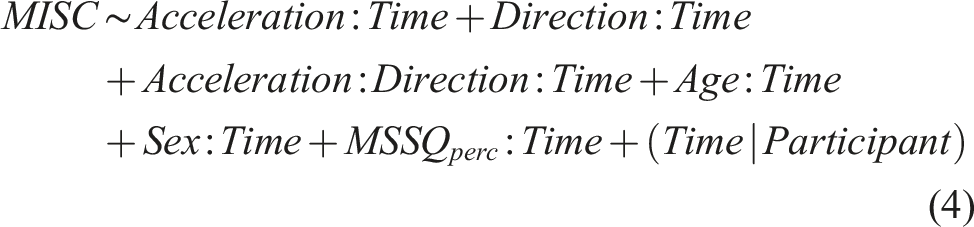
Here, the data subset included the three amplitudes common to both directions (1, 2, and 4 m/s2) at 0.2 Hz. Again, the effect of adding the interaction term of direction and acceleration amplitude was evaluated using a likelihood ratio test. Since vertical motion was only tested with one amplitude, this was left out of the analysis.
Additional analyses were performed on the measurements collected at the end of each test session. Spearman rank correlations were computed between the maximum MISC score reached by a participant in a given session and the three dimensions of the SSQ (Nausea, Oculomotor, and Disorientation) as well as with the total SSQ score and with the VAS discomfort score. This analysis was done in MATLAB (version R2018a), using the Statistics and Machine Learning Toolbox. SSQ subscale scores and Total scores were computed following Kennedy et al. 56 Differences between SSQ scores as a function of motion frequency, direction and amplitude were analyzed using a linear mixed-effects model as implemented in R (version 4.3.1), using the nlme package (version 3.1-162), with frequency, direction and amplitude as additive categorical fixed factors, sex, MSSQ percentile and age of the participants as covariates, and participant as random factor. Model fitting was performed using the Restricted Maximum Likelihood method. A similar model was fitted using the discomfort scores as dependent variable. R2 values for both models were determined using the MuMin package (version 1.47.5).
As with the ordinal analysis of the MISC data, the interaction effect of motion frequency and direction on SSQ and discomfort could not be included in these models due to the incomplete factorial design. Therefore, again, separate analyses were conducted comparing a model with the frequency × direction interaction included to a model without it for subsets of the data with either longitudinal and lateral, respectively longitudinal and vertical motion (again only with an acceleration amplitude of 2 m/s2). These models were fitted using the Maximum Likelihood method. Differences between the models with and without interaction term were tested using likelihood ratio tests. In addition, the interaction of acceleration amplitude and motion direction was tested in a similar way for longitudinal and lateral motion, using the SSQ and discomfort data for the 0.2 Hz frequency. Here too, likelihood ratio tests were used to evaluate the contribution of the interaction effect to model fit. In all inferential tests, a significance level α = 0.05 was used.
Results
MISC ratings
Although the majority of participants developed motion sickness symptoms with all combinations of frequency, direction and acceleration amplitude, the extent to which MISC ratings increased within a test session clearly depended on these experimental factors. In Experiments 2 and 3, in which peak acceleration was varied, participants generally showed a faster increase in MISC ratings for higher accelerations (see Supplemental Materials for all MISC data). In addition, MISC ratings increased most quickly for frequencies between 0.1 and 0.8 Hz irrespective of motion direction. Both lower and higher frequencies led to slower MISC increases. This was also clearly reflected in the number of participants that had to abort a session because their MISC rating increased to over 6, as well as in the maximum MISC ratings reached by participants and the number of participants who did not suffer from motion sickness (Table 2).
Figure 2 shows the observed proportions of MISC ratings above criterion values c from 0 to 6 as a function of motion frequency, acceleration amplitude and motion direction. It is important to note that each graph shows the data aggregated across the other factors. Thus, P(MISC > 0) at 0.2 Hz in Figure 2(a) represents the proportion of participants that scored MISC > 0 at 0.2 Hz across all acceleration amplitudes, directions and timepoints tested (in this case P(MISC > 0) was just over 60%). As the experimental design was both unbalanced and incomplete, the graphs in the figure show the effects including biases due to the design, which were corrected for in the analysis. The figure clearly shows that MISC ratings were highest for 0.2 and 0.4 Hz (Figure 2(a)). P(MISC > c) increased approximately linearly with the logarithm of acceleration amplitude (Figure 2(b)). No clear differences in P(MISC > c) can be seen between the three motion directions (Figure 2(c)). Observed (dots) and predicted (lines) P(MISC > c) in Experiments 1, 2, and 3 for c = 0 to 6 as a function of (a) motion frequency (on a log scale), (b) peak acceleration (on a log scale), and (c) motion direction (X = longitudinal; Y = lateral; Z = vertical).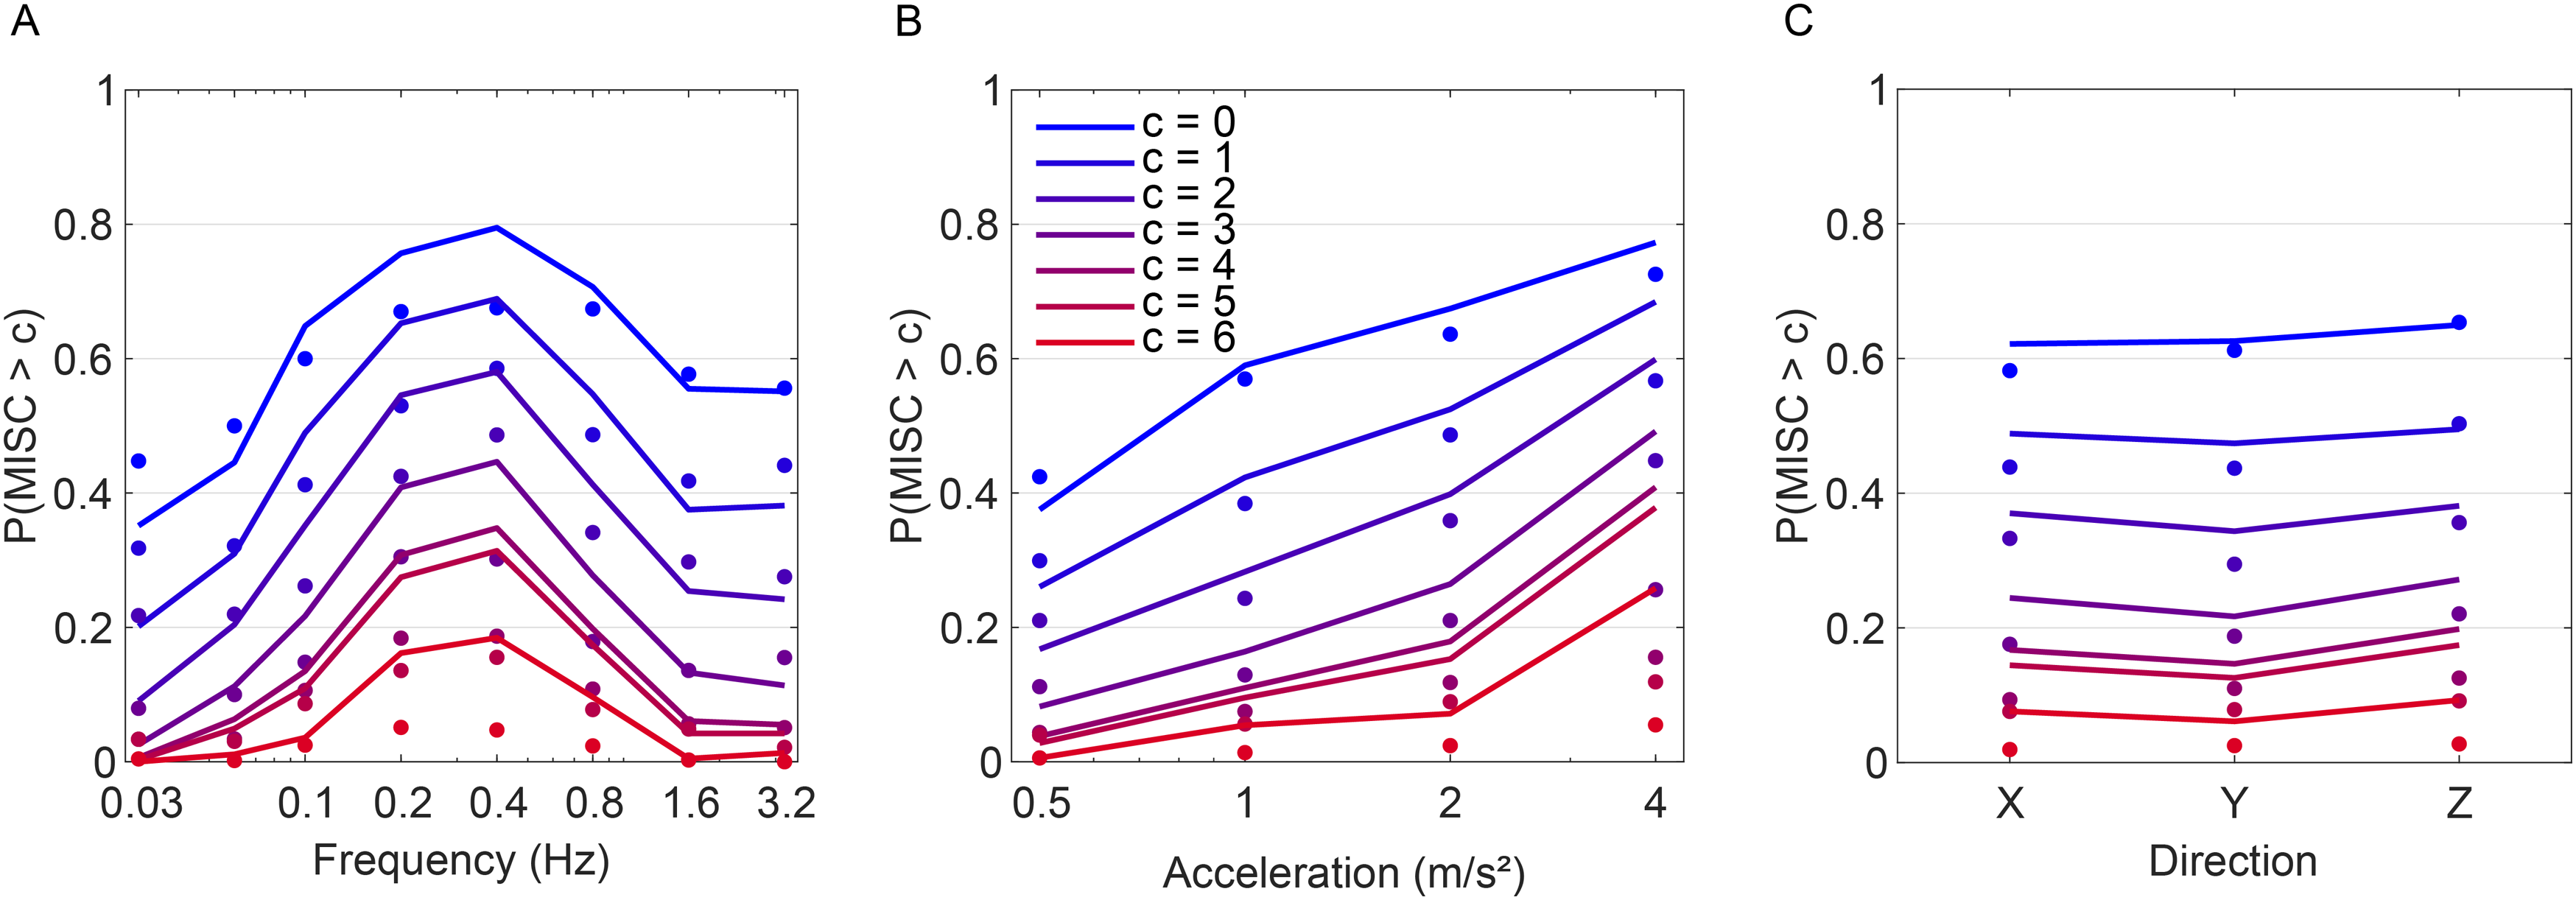
Results of the cumulative link mixed-effects model for the combined MISC results of Experiments 1, 2, and 3 (see equation (3)). Acceleration of 2 m/s2, the longitudinal (X) direction, and the female sex served as reference categories (p < 0.10, *p < 0.05, **p < 0.01, ***p < 0.001).
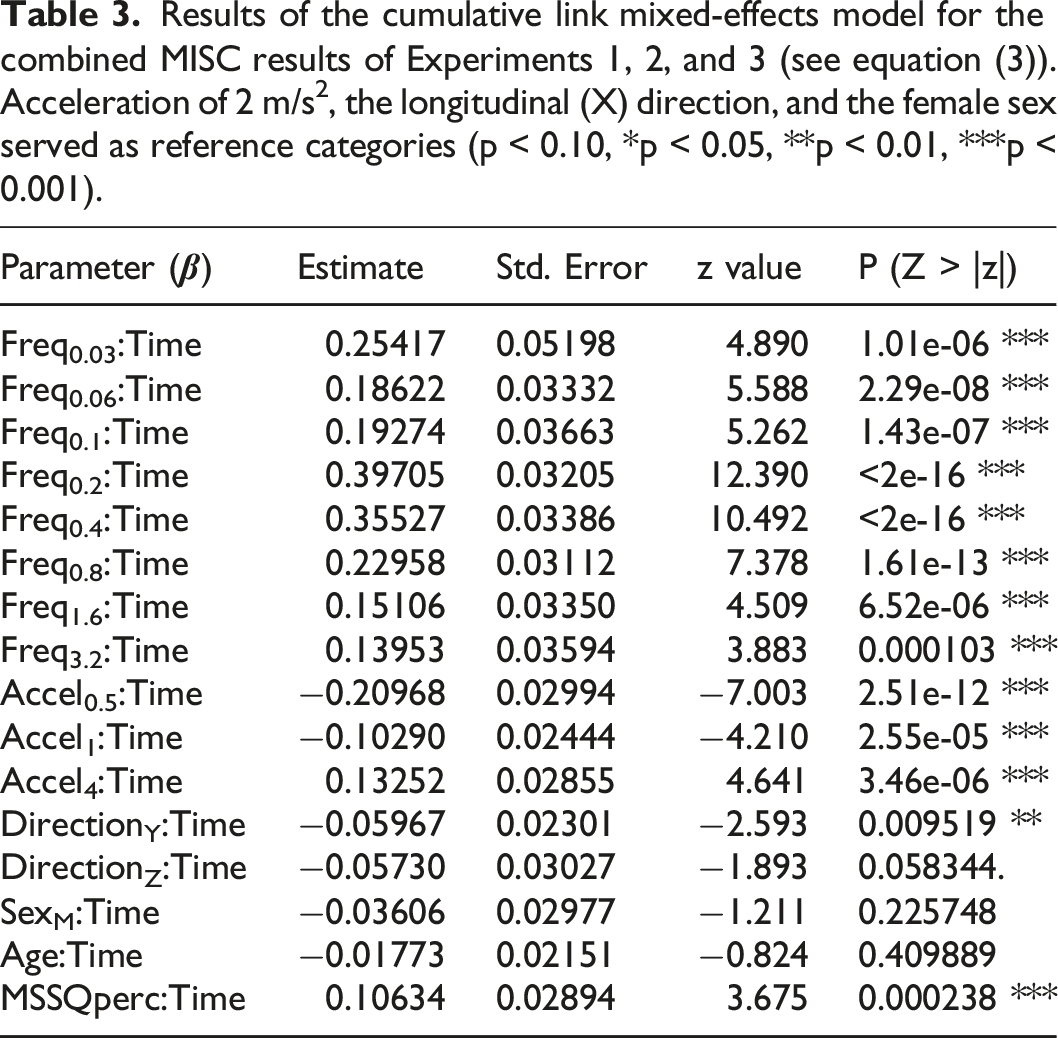
Using Nakagawa R2, the marginal R2 = 0.536, expressing the proportion of variance in the latent variable explained by the fixed factors and the conditional R2 = 0.957, including both fixed and random effects. This suggested that, while the fixed factors in the model explained a considerable part of the variance, differences between participants also were considerable. This was also reflected by the ICC = 0.908 compared to the ICCadj = 0.422. Comparison of the predicted P(MISC > c) compared to the observed values showed that accuracy and specificity were generally quite high, whereas sensitivity decreased with MISC level (see Supplemental Materials, Table S1). This was probably due to the fact that the number of observations with MISC > c decreased for higher values of c. Hence, the statistical model is dominated by lower MISC values and is less accurate in its predictions for the probability of higher values.
The similarity of the effect of motion frequency for the different motion directions was tested by comparing it separately for longitudinal and lateral motion, respectively for longitudinal and vertical motion. The cumulative link mixed-effects model described by equation (3) was fitted to the MISC data for the frequencies common to both directions (all with an acceleration amplitude of 2 m/s2) and the models fit with and without the interaction between direction and frequency were compared. For longitudinal and lateral motion, the likelihood ratio test showed a significant difference between the model with and without the interaction term (χ
2
(4) = 12.442, p = 0.014), suggesting that the effect of motion frequency differed for these two directions. Inspecting the individual interaction terms showed that for lateral motion there was hardly any difference between the estimated effects at 0.2, 0.4, and 0.8 Hz, resulting in the absence of a clear peak at 0.2 Hz (see Figure 3(a)). For longitudinal and vertical motion, the likelihood ratio test was not significant (χ
2
(4) = 1.786, p = 0.775), suggesting a similar frequency sensitivity for these two motion directions for the frequency range that was tested in both directions (Figure 3(b)). Note that because these were two separate analyses with different datasets, the effect estimates for longitudinal motion differ slightly between Figure 3(a) and (b). Frequency effect estimates for longitudinal and lateral motion (a), and longitudinal and vertical motion (b), based on the MISC data in Experiments 2 and 3, respectively 1 and 2 (the vertical axis represents the regression coefficients of the cumulative link mixed effects model; shaded areas represent ± 1SE).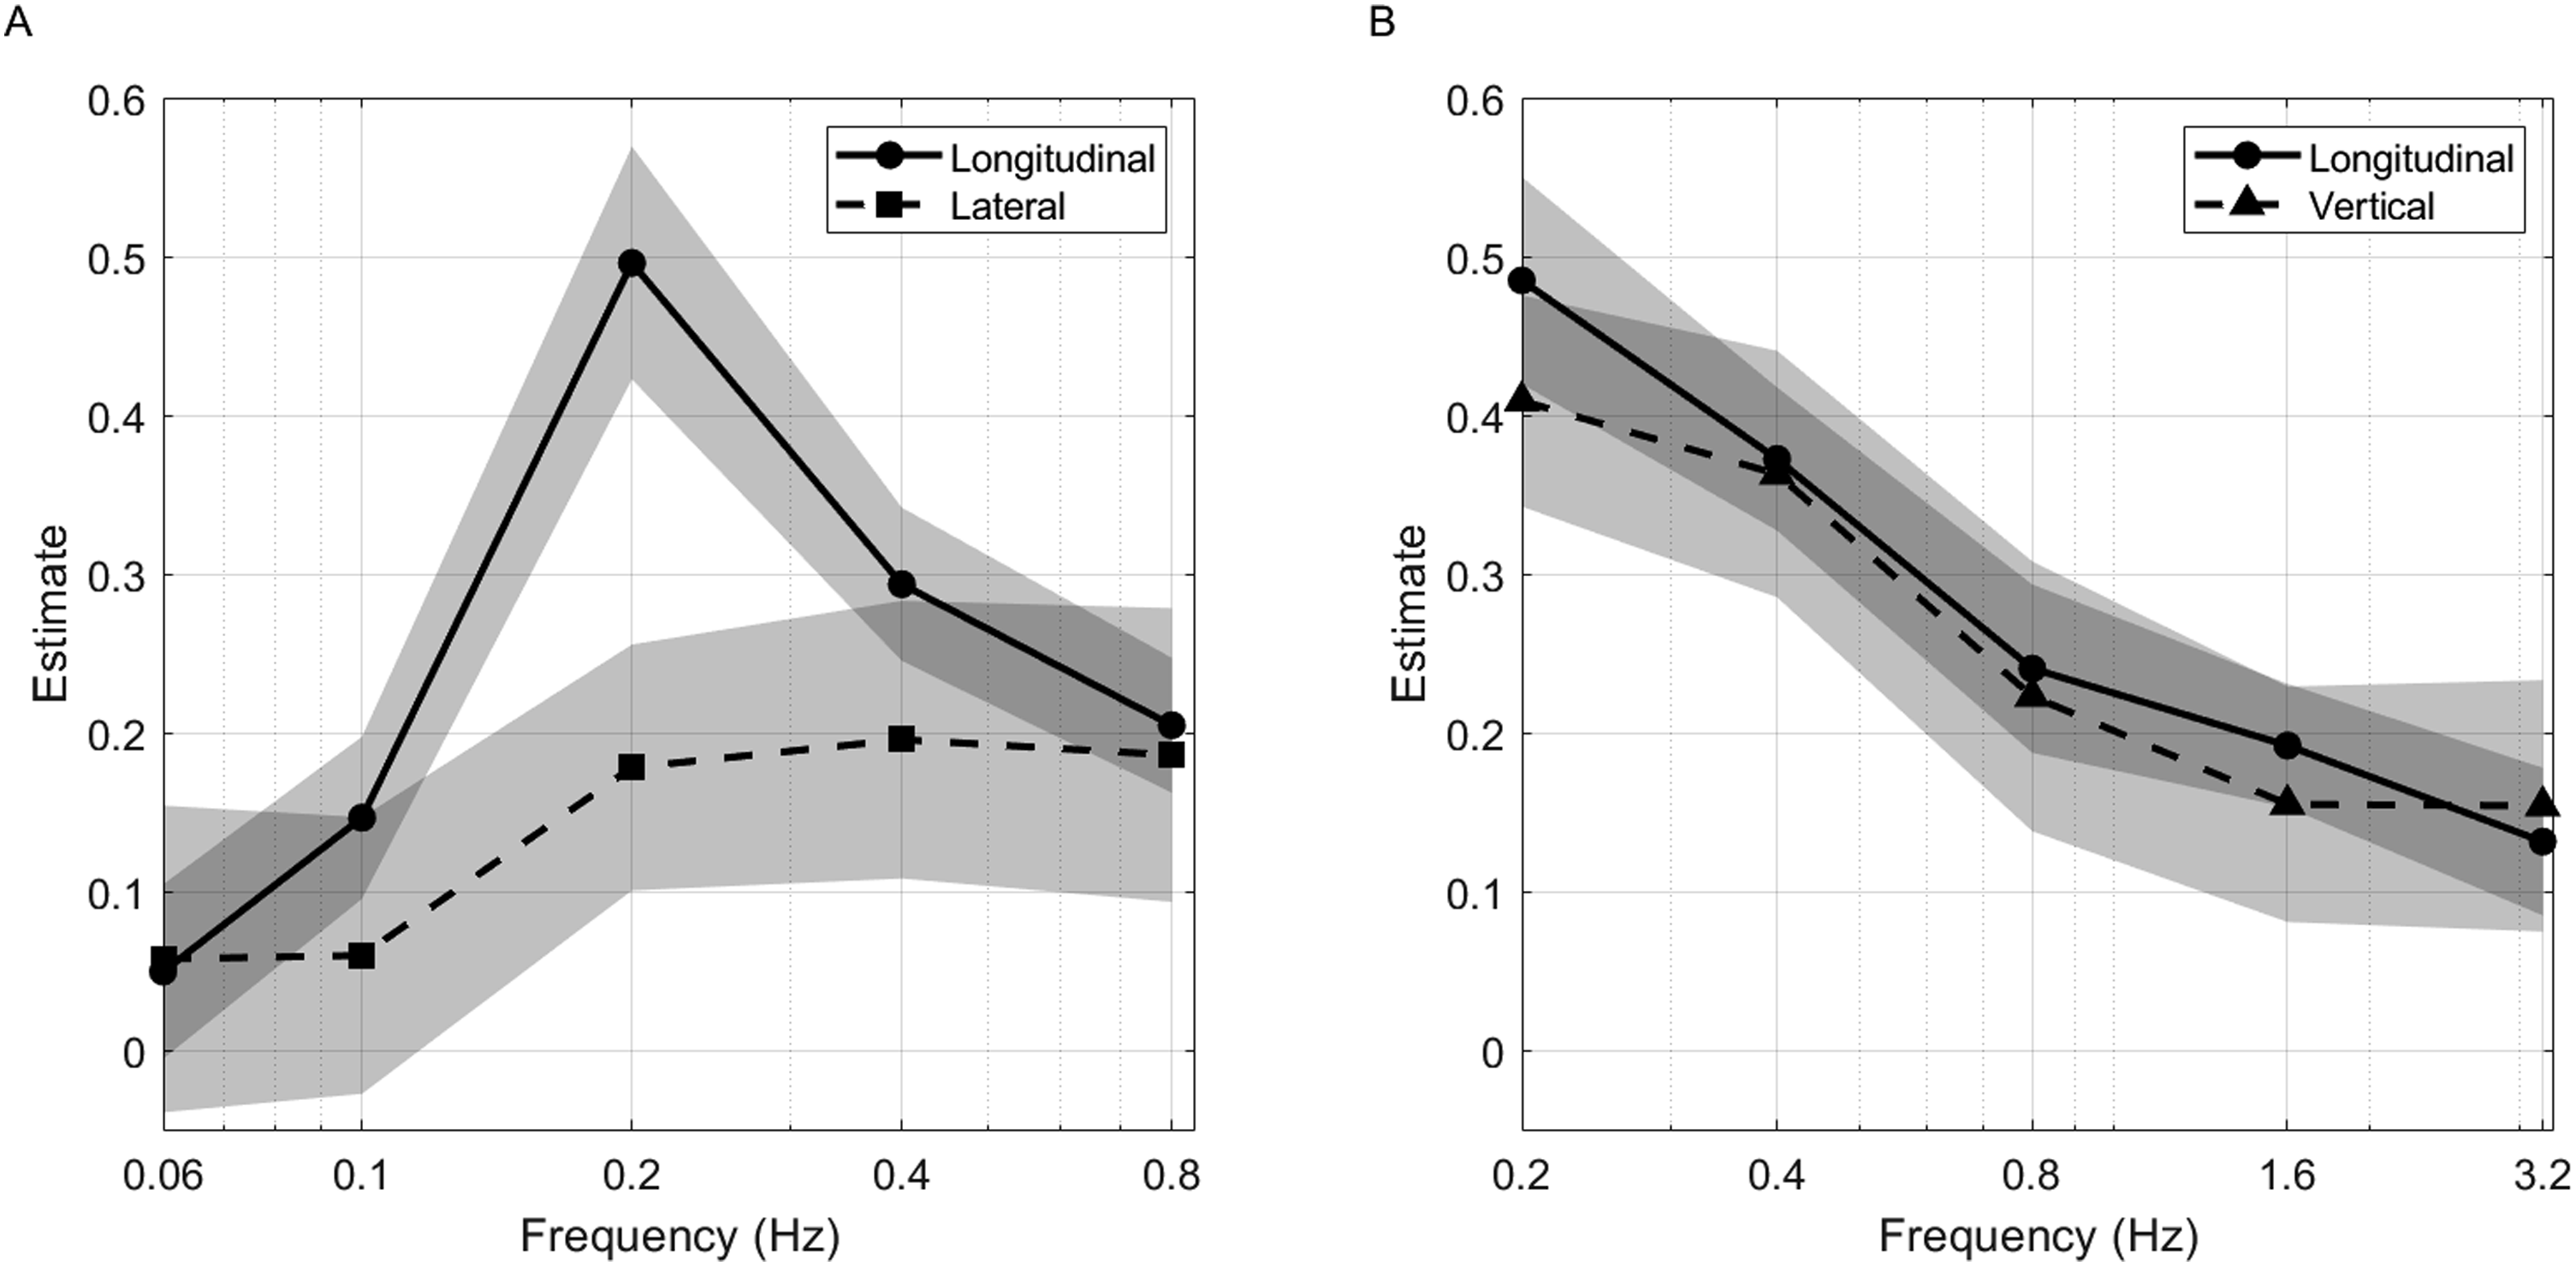
The effect of acceleration amplitude (1, 2 or 4 m/s2) was compared for longitudinal and lateral motion at a frequency of 0.2 Hz. A likelihood ratio test between the model of equation (4) with and without an interaction between direction and acceleration amplitude did not show a significant effect (χ 2 (2) = 0.513, p = 0.774), suggesting no reason to assume that the effect of amplitude differed between these two motion directions.
Since Experiments 2 (longitudinal) and 3 (lateral) were conducted close in time to each other and a substantial proportion of participants took part in both experiments, the results from the latter experiment may have been influenced by the former, for instance due to habituation57–59 or other order effects. Therefore, the analysis was repeated for a subset of the data (n = 82), in which the data from participants who took part in multiple experiments were left out (see Supplemental Materials, Table S2). This analysis resulted in the same pattern of significant results, except for the difference between longitudinal and lateral motion, which was now no longer significant. The marginal Nakagawa R2 = 0.613 and the conditional R2 = 0.945, suggesting a similar goodness-of-fit as the model that included data from all participants (ICC = 0.858 and ICCadj = 0.322).
SSQ scores and discomfort
Linear mixed-effects model results with SSQ-N and Discomfort as dependent variables for Experiments 1-3. Frequency 0.2 Hz, 2 m/s2 peak acceleration, X direction, and the female sex served as reference categories.
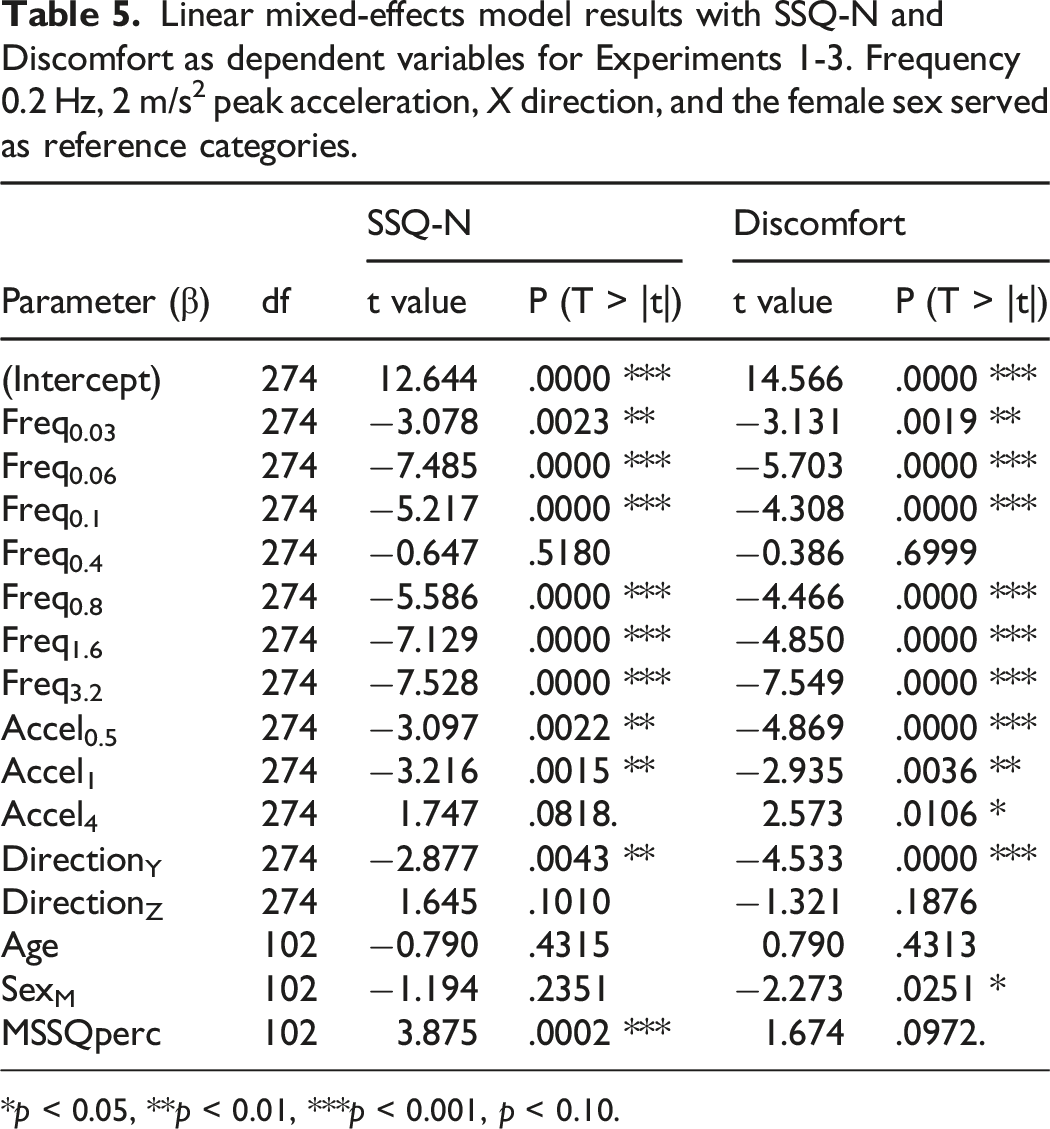
*p < 0.05, **p < 0.01, ***p < 0.001, p < 0.10.
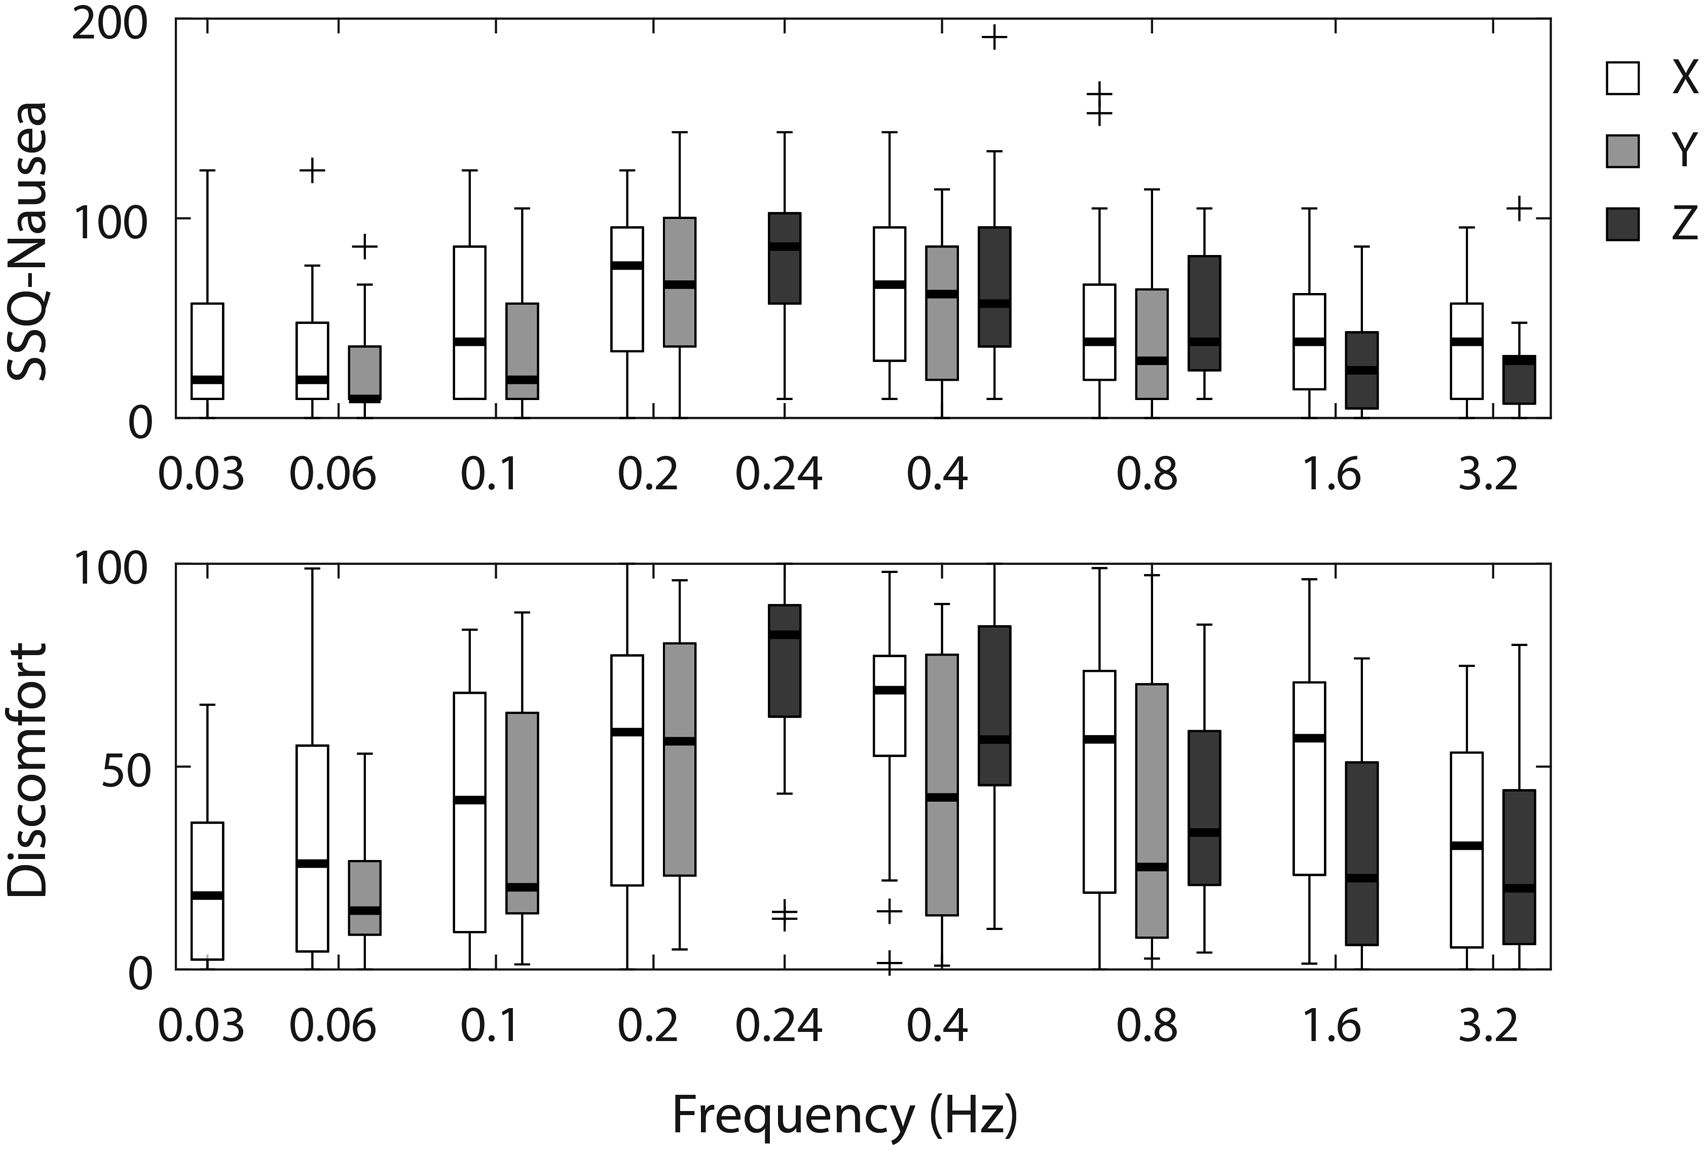
SSQ-Nausea (top) and discomfort (bottom) scores as a function of motion frequency in Experiments 1-3 (X, Y, Z).
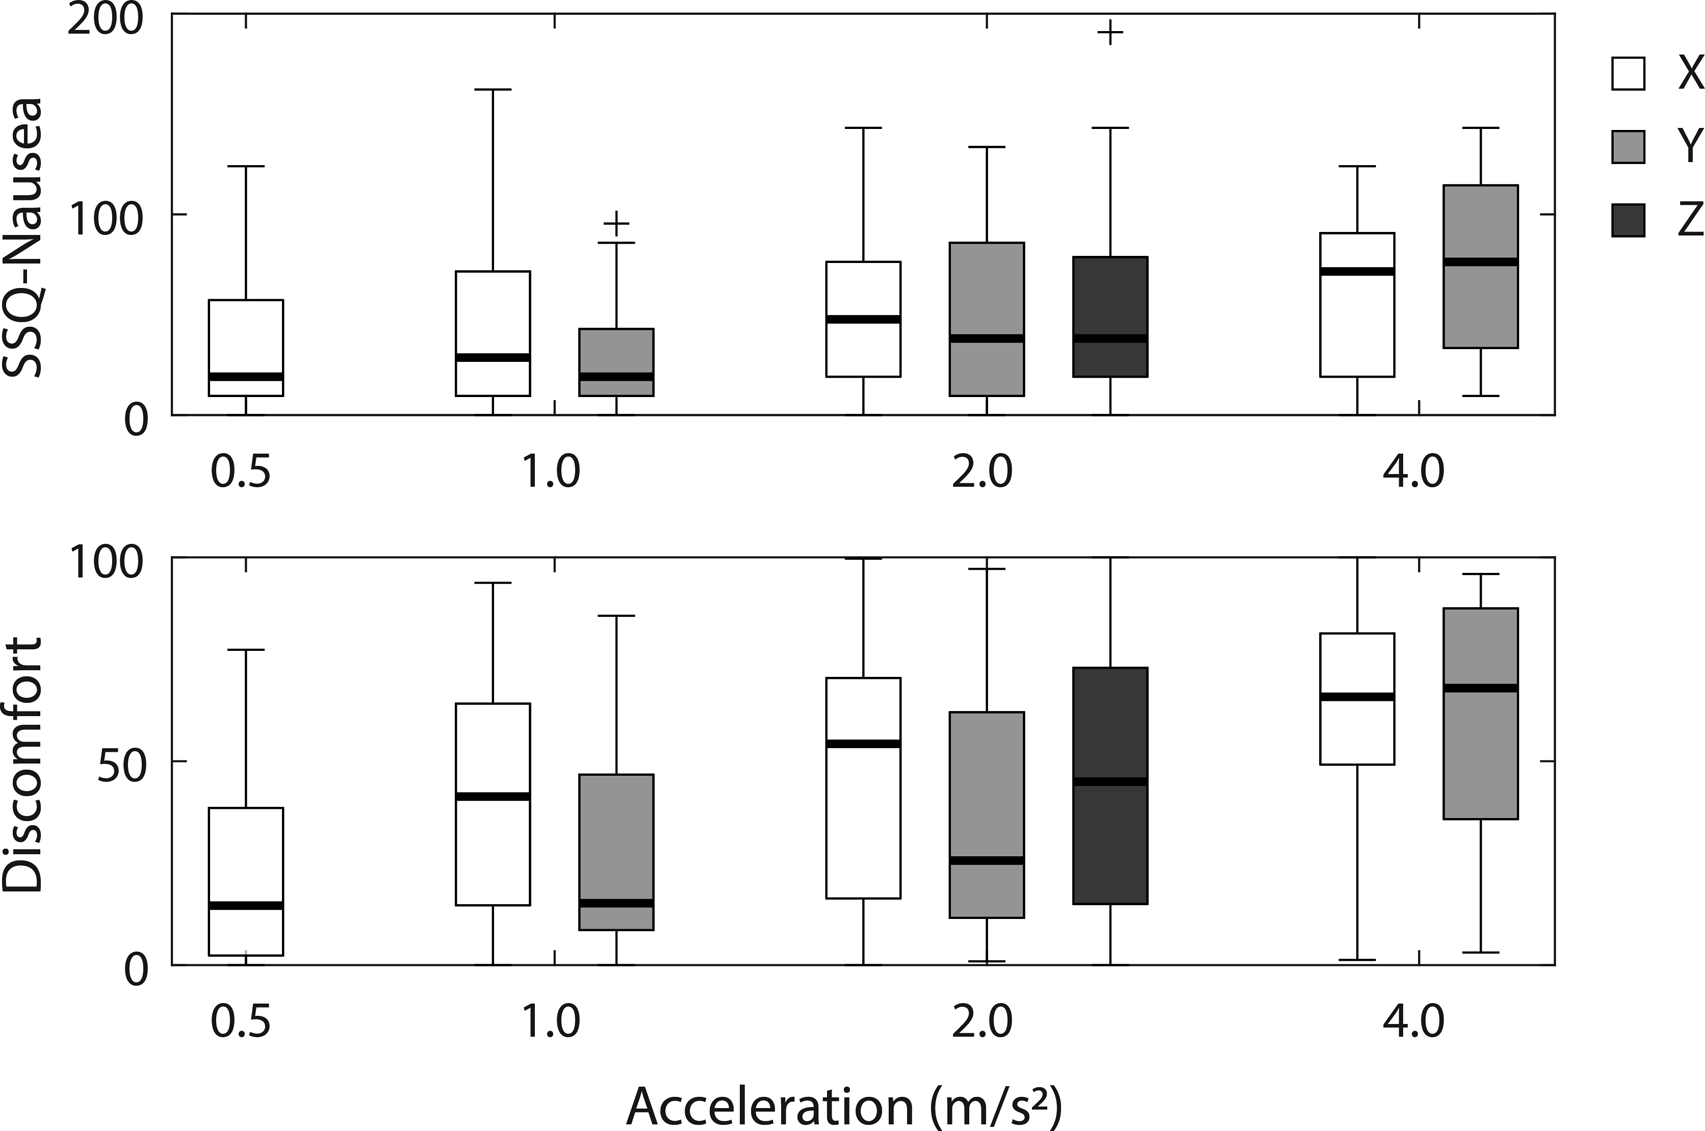
SSQ-Nausea (top) and discomfort (bottom) scores as a function of acceleration amplitude in Experiment 1-3 (X, Y, Z).
Spearman rank correlations between SSQ, Discomfort, and maximum MISC ratings in Experiments 1-3.
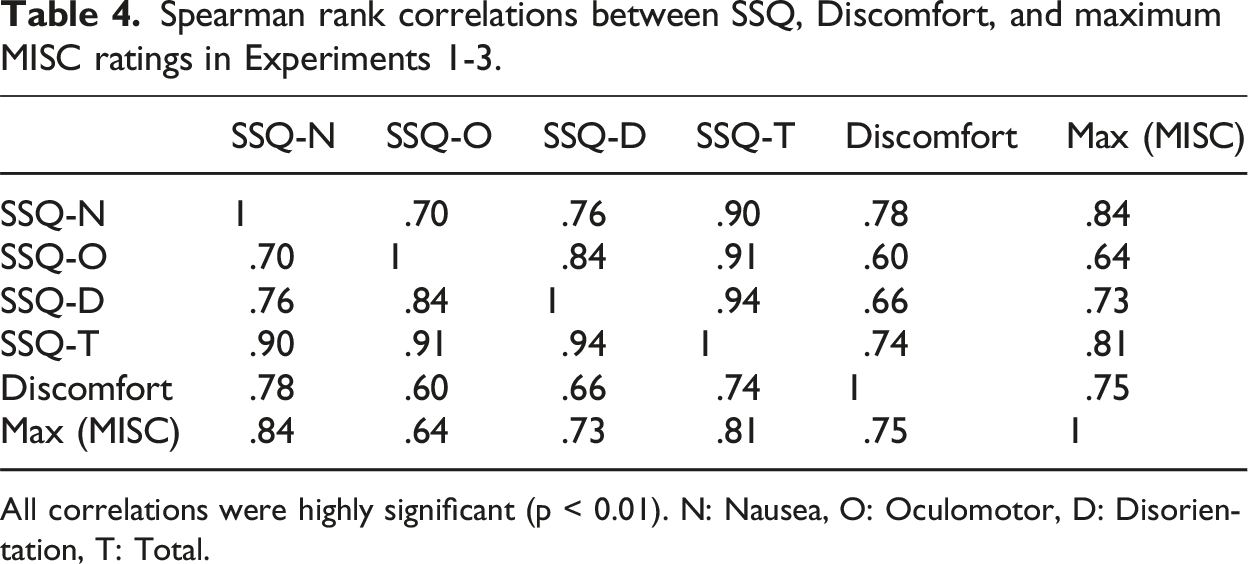
All correlations were highly significant (p < 0.01). N: Nausea, O: Oculomotor, D: Disorientation, T: Total.
A possible interaction effect of motion frequency and motion direction was investigated by comparing linear mixed-effects models with and without this interaction term for two subsets of the data, comparing the effect of frequency respectively for longitudinal and lateral motion and for longitudinal and vertical motion. With SSQ-Nausea as outcome variable, adding the frequency × direction interaction did not improve model fit significantly, neither for longitudinal compared to lateral motion (χ 2 (4) = 7.327, p = 0.120), nor for longitudinal and vertical motion (χ 2 (4) = 3.446, p = 0.486). Thus, the data did not provide evidence that the effect of motion frequency on SSQ-Nausea differed between the three motion directions. However, for Discomfort the interaction effect did significantly improve model fit for the comparison between longitudinal and lateral motion (χ 2 (4) = 11.769, p = 0.019), while it was again not significant for longitudinal versus vertical motion (χ 2 (4) = 7.544, p = 0.109). Therefore, similar to the MISC data, the Discomfort data suggested that the effect of motion frequency might be different for longitudinal and lateral motion. The interaction of motion direction and acceleration amplitude was analyzed in a similar way for longitudinal and lateral motion. For neither SSQ-Nausea nor Discomfort did adding the direction × amplitude interaction improve model fit (χ 2 (2) = 2.306, p = 0.3157 for SSQ-N and χ 2 (2) = 0.639, p = 0.726 for Discomfort, respectively).
Similar to the analysis of the MISC data, the analysis of SSQ-Nausea and Discomfort was also repeated for the subset of participants (n = 82) who took part in only one experiment (see Supplemental Materials, Table S3). This analysis resulted in the same pattern of significant results as in table 5, except for the difference between longitudinal and lateral motion, which was now no longer significant.
Discussion
In three experiments, we investigated motion sickness induced by periodic linear accelerations along three different motion axes (longitudinal, lateral, and vertical) in 107 participants using consistent methodology. Three different outcome variables (MISC, SSQ and discomfort rating) were used to analyze the effects of motion direction, frequency and peak acceleration on subjectively rated motion sickness.
Motion direction
All three outcome variables indicated that motion sickness was more severe for exposure to longitudinal motion compared to lateral motion. The results for vertical motion were not significantly different from those for longitudinal motion, with the MISC ratings and discomfort scores on average somewhat lower for vertical motion and the SSQ Nausea scores higher for vertical motion. One possible reason for the observed difference in motion sickness between longitudinal and lateral motion might be that two thirds of the participants in Experiment 3 (lateral motion) had participated only weeks earlier in Experiment 2 (longitudinal motion). As the same apparatus was used in both experiments, habituation effects57–59 cannot be excluded or indeed might be likely, thus leading to lower motion sickness ratings for these participants in Experiment 3. This was confirmed by re-analysis of a subset of the data (n = 82), in which the data from participants who took part in multiple experiments were left out. For all three outcome variables, the difference in motion sickness ratings between longitudinal and lateral motion disappeared almost completely, while the effects of frequency, peak acceleration, and the difference between longitudinal and vertical motion remained similar. Testing with vertical motion in Experiment 1 occurred about 6 months earlier and in a different simulator. Moreover, only five participants took part in both Experiment 1 and 2, so habituation effects from vertical motion exposure on longitudinal motion seem unlikely. Thus, taking possible habituation into account, our results seem to concur with those reported in earlier studies with similar motion sickness for longitudinal and lateral motion,41,42,46 though we cannot exclude the possibility that the difference between these two conditions was non-significant in the re-analysis due to reduced statistical power. While we failed to replicate the difference between longitudinal and vertical motion reported earlier,38,39 our MISC results did show a trend towards less severe motion sickness with vertical motion compared to longitudinal motion (though the SSQ Nausea results deviated from this trend).
Motion frequency
Our results showed that motion sickness induced by linear accelerations depends on motion frequency. Overall, motion around 0.2 Hz caused motion sickness to increase most strongly, at least qualitatively confirming the frequency sensitivity as described in ISO 2631-1 for vertical motion. 27 This also corresponds with the results of Golding and colleagues for longitudinal motion.44,60,61 In contrast to what would be expected based on the frequency weighting curve as defined in ISO 2631-1, accelerations at frequencies above 1 Hz still produced significant motion sickness symptoms in our participants. This may reflect a difference in frequency sensitivity at different levels of motion sickness severity. Where the ISO 2631-1 weighting function was derived from emesis as the outcome variable, our results are based on pre-emesis symptoms. As far as frequency effects for different motion direction are concerned, we found the effect of frequency in our data to be similar for longitudinal and vertical motion. However, we did find some evidence that the effects of frequency on motion sickness differed between longitudinal and lateral motion, based on both the MISC data and the discomfort ratings. Whereas the frequency effect showed a distinct peak at 0.2 Hz for longitudinal motion, this peak was largely absent for lateral motion. Although this pattern remained qualitatively when analyzing the subset of data for participants who had participated in only one experiment, adding the interaction term did not lead to a significantly better model fit (χ 2 (4) = 7.418, p = 0.115), suggesting no significant difference in frequency effects for longitudinal and lateral motion for this subset.
The frequency effects in our data clearly contradict the hypothesis of Donohew and Griffin 43. These authors suggested that, at least for lateral motion, the acceleration weighting as a function of motion frequency is constant for frequencies from 0.0315 Hz up to 0.2 Hz and decreases between 0.2 and 0.8 Hz. In fact, our results show exactly the opposite pattern, with motion sickness increasing with frequency up to 0.2 Hz, only to stay more or less constant for frequencies between 0.2 and 0.8 Hz (see Figure 3(a)). One reason for this discrepancy might be the fact that Donohew and Griffin based their frequency weighting only on the probability of mild nausea, while our analysis took the full range of motion sickness symptoms measured with the MISC scale into account. However, determining the frequency weighting in a similar way as Donohew and Griffin did, does not solve the incompatibility of our results with their hypothesis. Figure 6 shows the proportion of participants who reached a maximum MISC value above criterion value c for a given combination of motion direction and frequency divided by the rms acceleration for a peak acceleration of 2 m/s2 (the only acceleration for which all frequencies were tested in our experiments). For mild and moderate nausea complaints (MISC >5 and MISC >6, respectively), a clear frequency dependency can be seen, while this dependency is far less obvious for lower MISC values. This analysis again shows a difference between the frequency effect for longitudinal motion (Figure 6(a)), with a clear peak at 0.2 Hz, and lateral motion (Figure 6(b)), without such a peak. However, in contrast to the hypothesis of Donohew and Griffin
43
that motion sickness is independent of frequency up to 0.2 Hz for lateral motion, our results suggest that motion sickness sensitivity increases with frequency up to 0.2 Hz, after which the effect of frequency becomes less pronounced when looking at nausea (MISC >5). One difference between our experiments and those of Donohew and Griffin is that they kept peak velocity constant for different frequencies, thus confounding changes in motion frequency with peak acceleration. In our experiments, frequency and peak acceleration were varied independently. In addition, peak accelerations were relatively low in their study, ranging from 0.20 to 1.26 m/s2. This may explain why Donohew and Griffin did not observe significant motion sickness for the lowest and highest frequencies in the range they tested and why did not find a clear change in motion sickness sensitivity for frequencies below 0.2 Hz. In addition, they assumed a linear effect of acceleration, which is in conflict with our findings and those in the literature (see below). Proportion of participants reaching a maximum MISC value over criterion c (from 0 to 6), divided by the root mean square acceleration (peak acceleration 2 m/s2). (a) Longitudinal motion. (b) Lateral motion. (c) Vertical motion. Note the different frequency ranges on the horizontal axes.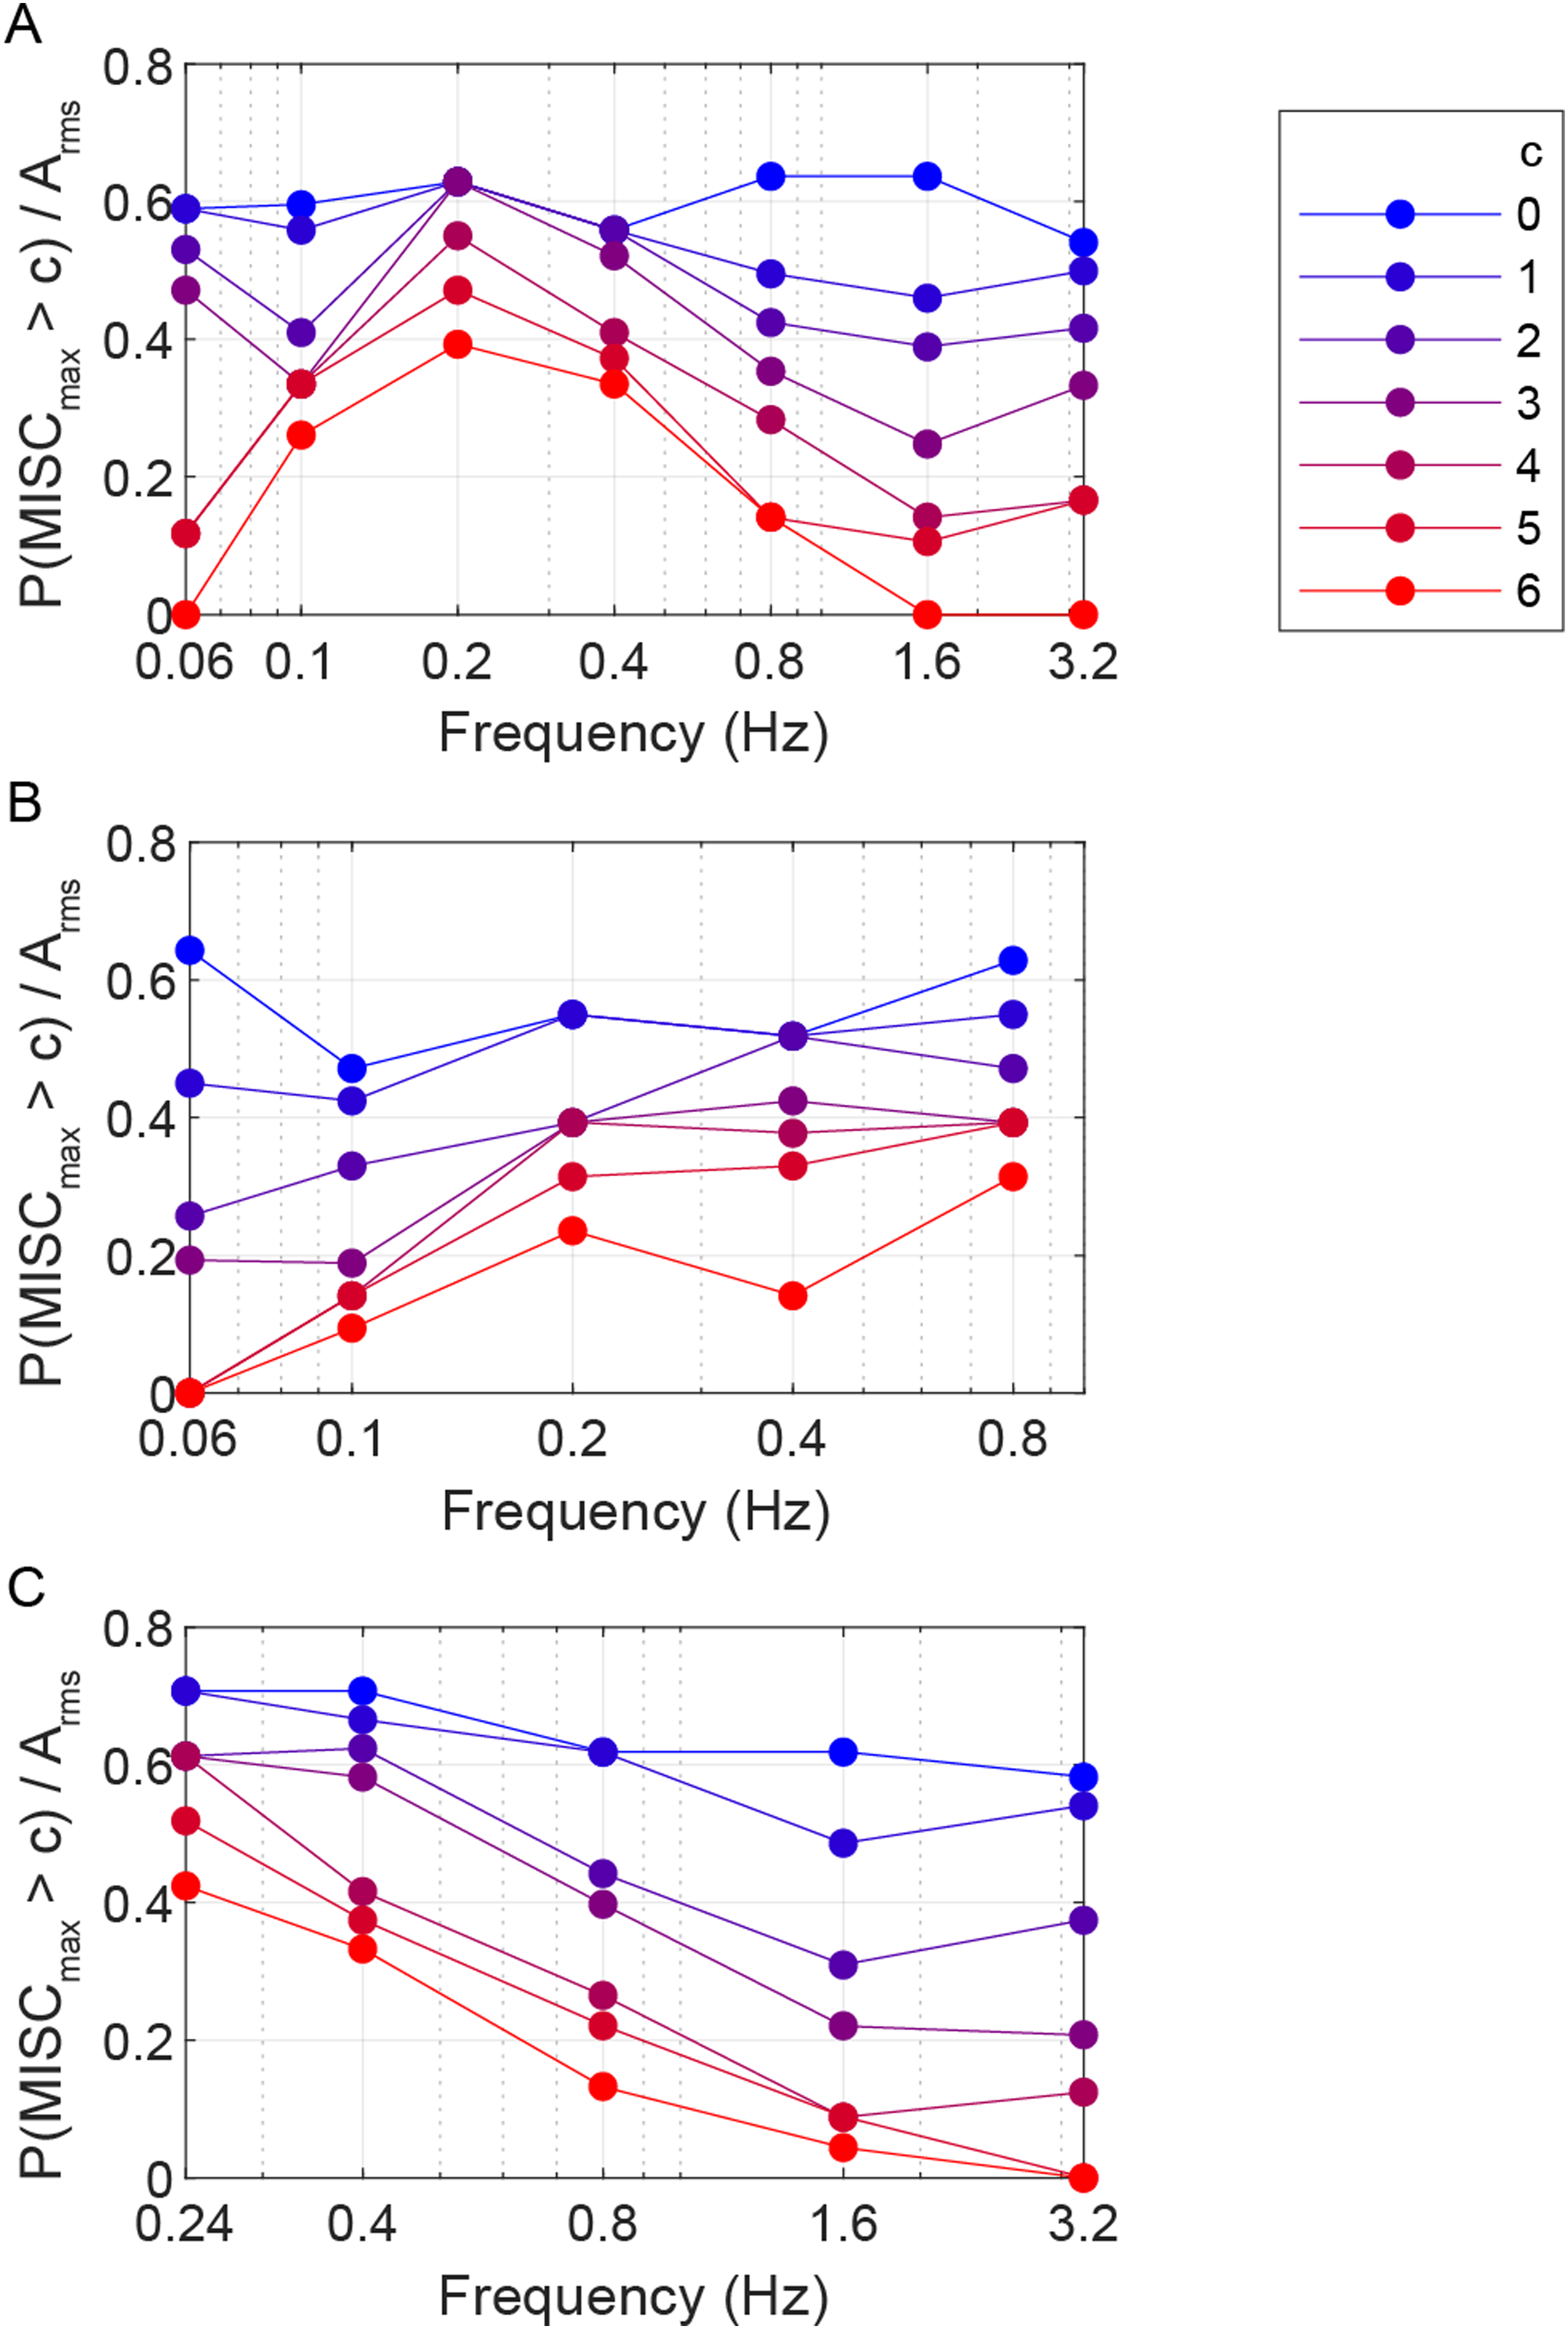
The question remains why motion frequency would have a different effect on motion sickness induced by lateral motion compared to longitudinal or vertical motion. One possible explanation is that acceleration along these axes leads to differences in head movements, which in turn lead to differences in motion sickness. The head has a greater range of motion in the sagittal plane than in the frontal plane. 62 In our experiments, head motion was somewhat restricted by the presence of a head rest and participants were instructed to keep their head still and level. Nevertheless, it cannot be excluded that different combinations of motion direction and frequency led to differences in head motion. Previous studies have shown that participants may exhibit different torso and head motion depending on whether they undergo simulator motion passively or actively try to counteract the effects on their body. 63 Moreover, active head motion against simulator motion has been shown to reduce motion sickness 64 and may be an important reason for interindividual differences in motion sickness as experienced by vehicle passengers. 8 Since head movements were not recorded in the current study, more studies are needed to investigate the impact of head motion on motion sickness with motion in different directions and at different frequencies.
Our analysis of the frequency effects is based on the assumption that motion frequency affects motion sickness for different persons in a similar way. In an earlier study, Irmak and colleagues investigated the differences in frequency sensitivity between different participants when exposed to longitudinal motion. 45 Their results indicated a large variability in the relationship between motion sickness and motion frequency between persons. While motion sickness on average was most severe at 0.2 Hz, individual peak sensitivity frequencies differed between participants, with some failing to exhibit any peak frequency at all. However, it is unclear whether this variability indeed reflected variation in individual frequency sensitivity, or that it was the result of the high variability in motion sickness scores, which may have limited the reliability of the estimated frequency effects. Moreover, Irmak et al. varied frequency only within the range 0.15 to 0.50 Hz. Our results show that frequency effects in this range are relatively small, with much bigger differences for either lower or higher frequencies beyond this range. As each of our participants was exposed to at most three different combinations of motion frequency and amplitude within one experiment, it is not possible to estimate individual frequency sensitivity reliably from our data.
Peak acceleration
Motion sickness increased monotonically with motion amplitude irrespective of frequency for both longitudinal and lateral motion within the range tested (0.5 – 4.0 m/s2). The MISC results suggested a log-linear relationship with peak acceleration (see Figure 2(b)). Thus, higher accelerations led to more severe motion sickness, but decreasingly so as the amplitude increased. This is similar to the non-linear monotonically increasing relationship reported by McCauley and O’Hanlon in their seminal work on motion sickness due to vertical accelerations. 22 In contrast, ISO 2631-1 assumes a linear relationship between acceleration amplitude and the resulting motion sickness incidence. 27 Consequently, the ISO 2631-1 model may overestimate sickness caused by higher accelerations, especially because the Motion Sickness Dose Value as defined by the ISO model grows in proportion to the square root of time for constant motion exposure. This implies that according to the ISO 2631-1 model, motion sickness can accumulate indefinitely as long as exposure to provocative motion continues. Future research should investigate saturation of motion sickness at higher acceleration amplitudes and habituation to continued motion exposure.
Converging outcome measures
While MISC scores of motion sickness were collected once every 2 minutes throughout the motion exposures, the SSQ and Discomfort scales were only administered once after each motion exposure. Nevertheless, the different outcome measures provided converging evidence for the effects of motion direction, frequency and amplitude, despite using different statistical models in the analysis due to the different measurement scale properties. They showed similar effects of motion direction, magnitude and frequency. In addition, the results from the MISC scale and the SSQ-Nausea subscale showed similar correlations with several participant characteristics (significant correlation with MSSQ, not with age or sex), whereas the Discomfort ratings correlated with sex, but not with age or MSSQ scores. Thus, collecting a simple Discomfort rating on a visual analogue scale might have been sufficient to arrive at the same conclusions as with the repeated MISC measurements. However, the MISC data provide much richer information concerning the temporal development of motion sickness. While the current analysis mainly takes the slope of the MISC scores over time into consideration, additional analysis might also be conducted to investigate which type of underlying model might best describe the accumulation of motion sickness during motion exposure. Several variations of models based on the sensory conflict theory have already been proposed (e.g., 65–69) and could be tested or further refined with the current data set. In particular, it should be investigated whether they can predict the effects of motion direction, frequency and magnitude shown in our results. Furthermore, for practical applications to predict motion sickness in vehicles, it is important to test to which extent these results also apply to the situation where an external view is available.
Conclusions
Our results show that motion sickness induced by periodic linear accelerations occurs along all three cardinal axes within the same frequency range. Specifically, we found that when considering pre-emesis symptoms of motion sickness, accelerations above 1 Hz can still cause significant motion sickness symptoms. While differences in the degree of motion sickness between the three axes were small, we did find indications that the frequency sensitivity may differ between axes, particularly between longitudinal motion, which showed a clear peak around 0.2 Hz, and lateral motion, where this peak was largely absent. In addition, the frequency effect may depend on the symptom severity, with more severe motion sickness symptoms exhibiting a stronger frequency dependency. This has important implications both for models of motion sickness, such as the ISO 2631-1 model, as well as for applications in motion control of in particular automated road vehicles, ships and aircraft. Our results may be used to reduce motion in the sensitive frequency range, thus improving passenger comfort in automated vehicles and beyond. 70
Supplemental material
Supplemental material - Motion sickness induced by periodic accelerations: Effects of motion axis, frequency, and acceleration magnitude
Supplemental material for Motion sickness induced by periodic accelerations: Effects of motion axis, frequency, and acceleration magnitude by Jan L. Souman, Jelte E. Bos, Cyriel Diels, Suzanne A.E. Nooij in Journal of Vestibular Research.
Footnotes
Acknowledgments
The authors would like to thank the following persons for their contributions: Marika Hoedemaeker for managing the research project, Almar Snippe and Eric Schoen for advice on statistics, Martin van Schaik, Gerhard van den Noord, Irene Kulling, Ivo Stuldreher, Douwe Mol, and Merel Beijer for their support in data collection, Wouda Visser-Ooms and Willeke Roodenburg-Ninaber for taking care of participant acquisition, Ingmar Stel, Rob van de Pijpekamp, Frank Engels, Rein Visser, Mark Wentink, and Jaco Mourik for technical support, and Jan-Willem Sangers and Jorn Gijsbers for funding acquisition.
Author contributions
JS: Formal analysis, Writing – Original Draft, Writing – Review and Editing, and Visualization; JB: Conceptualization and Methodology, Investigation, Formal analysis, Writing – Review and Editing, and Funding acquisition; CD: Writing – Review and Editing, and Funding acquisition; SN: Conceptualization and Methodology, Investigation, Formal analysis, and Writing – Review and Editing.
Funding
The authors disclosed receipt of the following financial support for the research, authorship, and/or publication of this article: The research described in this paper was funded by Ford Motor Company, Hyundai Motor Company, Jaguar Landrover Ltd, ThyssenKrupp Bilstein GmbH, and ZF Friedrichshafen AG as part of the Joint Industry Project ‘Comfort in Automated Vehicles’.
Declaration of conflicting interests
The authors declared no potential conflicts of interest with respect to the research, authorship, and/or publication of this article.
Supplemental material
Supplemental material for this article is available online.
References
Supplementary Material
Please find the following supplemental material available below.
For Open Access articles published under a Creative Commons License, all supplemental material carries the same license as the article it is associated with.
For non-Open Access articles published, all supplemental material carries a non-exclusive license, and permission requests for re-use of supplemental material or any part of supplemental material shall be sent directly to the copyright owner as specified in the copyright notice associated with the article.