
Abstract
The gearbox system faults are the main causes of the failure of the rotating components, therefore dynamic gearbox features are necessary. The article attempts to clarify the gearbox’s dynamic characteristics as the consequence of the preliminary pitting circumstance. Three operating variables such as shaft loading, shaft speed and defect size were selected to observe the parametric effect and the experiment was conducted according to Taguchi L9 orthogonal arrays (OA). A dedicated experimental test rig has been developed for experiments with different speeds and loading conditions to implement and simulate industrial-based applications. The accelerometer was used to record the vibration signals while simulating faults. The response parameters used to monitor the gearbox conditions comprise time-domain indices notably kurtosis and root mean square. Investigating the impact of defects on vibrations is made easier by the interplay of defect size, load, and speed. To determine the relationship between the inputs and outputs of a physical system, statistical analytic approaches have been employed. Analysis of variance has been shown to be a dependable technique for assessing the key elements connected to the gearbox’s vibration. It was revealed from the Analysis of variance table that dynamic characteristics in terms of response performance were significantly influenced by defect size. To mitigate the dynamic features and prolong the life of rotational systems, it is recommended that these optimal input parameter conditions might be applied to gearbox fault diagnosis.
Highlights
• Examines the dynamic properties of a gearbox under preliminary pitting conditions. • An experimental test rig with variable shaft speed, load, and defect size is used in accordance with the Taguchi L9 orthogonal array. • Uses a piezoelectric accelerometer to collect vibration data and evaluate time-domain indices such as Kurtosis and Root mean square. • Performs Analysis of Variance to identify the most significant factor impacting gearbox vibrations. • The magnitude of the defect has the greatest impact on gearbox vibration, aiding in problem diagnosis and increasing the lifespan of the rotating system • The study recommends optimal input conditions for gearbox health monitoring and condition monitoring.
Introduction
The gearbox is a crucial component of rotating machinery systems. They are crucial in the transfer of power and motion from one rotating shaft to another. 1 However, the gears are failing due to inadequate lubrication, impact load and severe work environment. Additionally, because of geometrical defects and misalignment are important factors in gear failures, particularly when it comes to long-term wear, fatigue, and NVH (noise, vibration, and harshness) problems. Inadequate lubrication, impact loads, and harsh environments are also important contributors. Non-uniform meshing forces during gear rotation can be caused by geometrical flaws like an erroneous tooth profile, an incorrect pressure angle, or a manufacturing flaw like an uneven tooth cut. Dynamic loading results from this, hastening surface fatigue and raising operating noise levels. Micro-pitting, scoring, or even catastrophic gear tooth failure may result from these forces over time. Uneven load distribution across the tooth surface is introduced by gear misalignment, whether it is parallel or angular. A sudden gearbox failure can degrade the performance and life of all rotating machinery systems and can even lead to an incurable failure. 2 Therefore, monitoring and controlling the initial fault status of the gearbox is crucial. Gearbox fault diagnosis implementing vibration signals has been the focus of intensive research for decades in an effort to identify the early deterioration of this rotating component. Signals based on vibration provide important information regarding the gearbox’s current state of condition. 3 Gearbox systems are generally used in a variety of industrial applications, such as automobiles, aeronautics, transportation, astronautics, manufacturing, etc. 4 Numerous methods, including vibration signals, oil debris, acoustic emission, and acoustic investigation, have been utilized to identify gearbox fault conditions.5–10 To address the industrial-based challenges related to rotating systems, a variety of fault diagnosis techniques have been used and demonstrated, notably support vector machines, random forest algorithms, artificial neural networks, decision trees, fuzzy logic and different hybrid approaches.11–17 A local spectrum enhancement-based approach was put forth by Shi et al. 18 to identify early flaws in rotating equipment. The technique makes weak defect features in vibration signals more visible. It improves local spectral components, which increases the efficacy of early-stage fault diagnostics. Simulations and experimental data were used to validate the methodology. Compared to conventional methods, the results demonstrated increased diagnostic accuracy. The wavelet transformation-based extraction features were effectively implemented for failure detection of spur bevel gearbox by means of artificial neural networks and proximal support vector machine. They stated that the ability to distinguish proximal support vector machine and artificial neural networks is very similar, but the training and testing period for artificial neural networks is more comparable to proximal support vector machine. 19 Response surface methodology was applied in an experiment to track the condition of a misaligned rotor system. Modelling and analysing how misalignment affects rotor vibration behaviour was the goal of the study. Response Surface Methodology was used to build a variety of experimental runs in order to assess vibration responses. 20 Important elements affecting the state of the system were found and improved. The study showed that rotor misalignment-induced vibrations may be accurately predicted and analyzed using the Response Surface Methodology. The results back up better rotating machinery defect detection and maintenance scheduling. When diagnosing gearbox faults, kurtosis and root mean square are frequently employed statistical indicators because of their ease of use, sensitivity, and diagnostic utility in vibration studies. A vibration signal’s total energy or power content can be determined by calculating its root mean square. When referring to a gearbox, a rise in Root mean square frequently signifies increased vibration levels brought on by gear flaws like tooth fracture, wear, or imbalance. It is a valuable tool for tracking the evolution of damage and is especially good at capturing the overall severity of a fault because it is sensitive to signal loudness. Kurtosis, on the other hand, is extremely sensitive to impulsive occurrences and quantifies how tailed a signal’s probability distribution is. Because of this, it is especially useful for identifying early-stage defects like pitting or cracking in gear teeth, which frequently cause brief shocks or vibration signal spikes. These two parameters were probably chosen due to their shown diagnostic value as well as their simplicity of computation. Kurtosis detects sudden changes in the signal or the commencement of a problem, whereas root mean square provides a measure of fault severity. A recent study by B. Samanta 21 used artificial neural networks and support vector machine to compare gear fault output under normal and defective conditions and optimize input parameters through genetic algorithms. They mentioned that there is better classification accuracy of support vector machine with using genetic algorithms than artificial neural networks, and the classification efficiency with genetic algorithms is comparable. A multi-sensor information fusion-based malfunction detection technique was put forth for rotating machinery. The technique combines data from multiple sensors to increase the accuracy of the diagnosis. 22 From vibration signals, time-domain characteristics, including Root Mean Square, Kurtosis, and Skewness were derived. To identify faults, a Support Vector Machine classifier was used. The accuracy and dependability of defect detection were enhanced by the combination of sensor data. The technique worked well for differentiating between different kinds of rotating equipment faults. Kelesoglu et al. 23 created a bevel gear testing rig setup to analyze the impact of several parameters, including applied load, shaft rotational speed, abrasive contamination, and lubrication level, with varying operating hours. The findings demonstrated that vibration measurement and sound-based signals can be effectively utilized to predict the bevel gear fault condition. Sharma et al. 24 used autoregressive and discrete wavelet transform methods to study the failure identification of gear teeth in bevel gearboxes. They came to the conclusion that the autoregressive coefficients obtained from a defective signal had a higher variance than those obtained from a normal signal. By simulating four types of gear faults by modifying the loading situation, Kane et al. 25 identified and compared the gear fault features using different types of signals. In comparison to acoustics and vibration statistical features, they came to the conclusion that psychoacoustic features are thought to be more capable of identifying problems. The fault of rotary machinery elements was studied by Zhang et al. 26 using hybrid wavelet and integration of main component analysis and artificial neural networks to predict the situation of systems. Using a vibration signal, Medina et al. 27 used the symbolic dynamics analysis method to identify gearbox problems. According to them, the suggested algorithms can be modified for automated monitoring systems in factories to effectively and precisely predict failures. A methodological approach for multi-fault detection in rotary systems utilizing random forest and K-nearest-neighbors algorithms was presented by Sanchez et al. 28 Ranking methods like chi-square, the Relief-F, and information gain are used to select the important attributes. This method performs effectively for interactive applications while the features are extracted in the time domain. Using the grey-Taguchi technique, Khoualdia et al. 29 created a multi-objective model that predicted integrated gear bearing failures. The artificial neural networks classifier has been trained and tested using time and frequency features that were obtained. The findings showed that the recommended method is beneficial and efficient for rotating machinery monitoring and diagnostics. In order to research other faults and processes, they can be effectively expanded. The response surface methodology was utilized to examine the connections between various input factors and the response characteristics of the ball-bearing system. They considered the effects of applied load, rotating speed, and defect size on the vibration response as Kurtosis and found that the defect size, the interaction between the defect’s size and applied load, and the interaction between the defect’s size and rotational speed are all significant. 30 The dynamic behaviour of roller bearings under normal and simulated bearing failures in relation to applied load, defect size, and speed were analysed. 31 Fast Fourier transform vibration peak and torque peak-to-peak were used as the output parameters, and the results showed that speed significantly influences both outputs and that load has a greater impact on bearing capacity than speed. The Mahalanobis–Taguchi System in conjunction with Singular Value Decomposition and Empirical Mode Decomposition was suggested as a technique for diagnosing bearing faults and evaluating health. Empirical mode decomposition is used to first break down vibration signals into intrinsic mode functions. The prominent characteristics are then extracted from the Intrinsic Mode Functions using singular value decomposition. A Mahalanobis space for defect detection is built using these features. The technique successfully differentiates between faulty and healthy circumstances. When compared to conventional techniques, the results show increased diagnostic robustness and accuracy. 32
Based on the above literature, the present study introduces a novel approach that fill a gap in the literature by addressing the deficiency of regression models and parametric optimization techniques targeted at reducing the dynamic properties of gearboxes for efficient fault classification. Analysis of variance and a Taguchi L9 orthogonal array design are used in this study, in contrast to earlier studies, to systematically examine how input parameters affect vibration responses. In order to collect vibration signals in real time, a novel experimental setup is created that replicates both normal and defective conditions. Accurate defect detection is made possible by the study’s effective establishment of statistically significant correlations between process parameters and condition indicators. Additionally, it suggests a prediction model based on regression to measure how these parameters affect the gearbox’s dynamic behavior. Incorporating experiment design not only streamlines the procedure but also minimizes the amount of experimental trials without affecting reliability. The study provides fundamental understanding into the complicated dynamic responses of bevel gear systems by integrating statistical methods with engineering analysis. One of the earliest structured optimization frameworks created especially for gearbox failure diagnostic applications is this work.
The structure of the article is as follows: The material and methodology are explained thoroughly in Section 2. Section 3 discusses the experimental setup and procedure. Section 4 integrates the discussion and analysis of the experimental results by evaluating the results to those of the proposed method. Subsequently, Section 5 presents our findings.
Material and methodology
Experimental planning using Taguchi approach
Taguchi techniques are a robust and economical design approach to solve engineering problems. 33 In the Taguchi method, the expression “greater is better, smaller is better, and nominal is best” describes the three different objective function types that are used to assess a process or product’s performance or quality based on the intended result. These are called Signal-to-Noise (S/N) ratio formulations, and the particular objective of the performance metric being optimized determines which one is used. When lower values are preferred, for as when reducing wear, vibration, or noise, the adage “smaller is better” is used. This criterion might be suitable, for example, in the detection of gearbox faults if lower vibration amplitudes or Root mean square values signify healthier operation. Conversely, when higher values signify superior performance, the phrase “greater is better” is employed. When output torque, efficiency, or detection sensitivity is the metrics of concern, this can be pertinent. This method could be applied to improve fault detectability, for instance, if larger kurtosis values are thought to be more sensitive markers of fault occurrence. When a particular target value is perfect and variations in either direction are undesirable, the third category “nominal is best” applies. This frequently occurs in alignment parameters or dimensional limits where accuracy around a predetermined value is crucial.34,35
Cases with the related equation are defined as follows:
Higher the better:
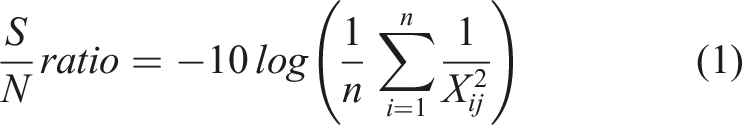
When it is necessary to maximize the quality of interest features, equation (1) is applied.
Smaller the better
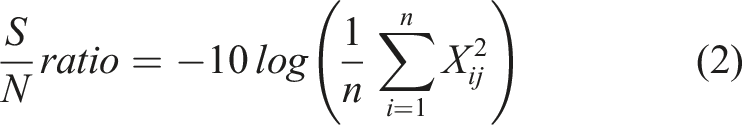
Equation (2) is used if the quality characteristic needs to be minimized.
Nominal the better
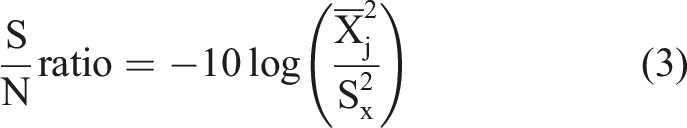
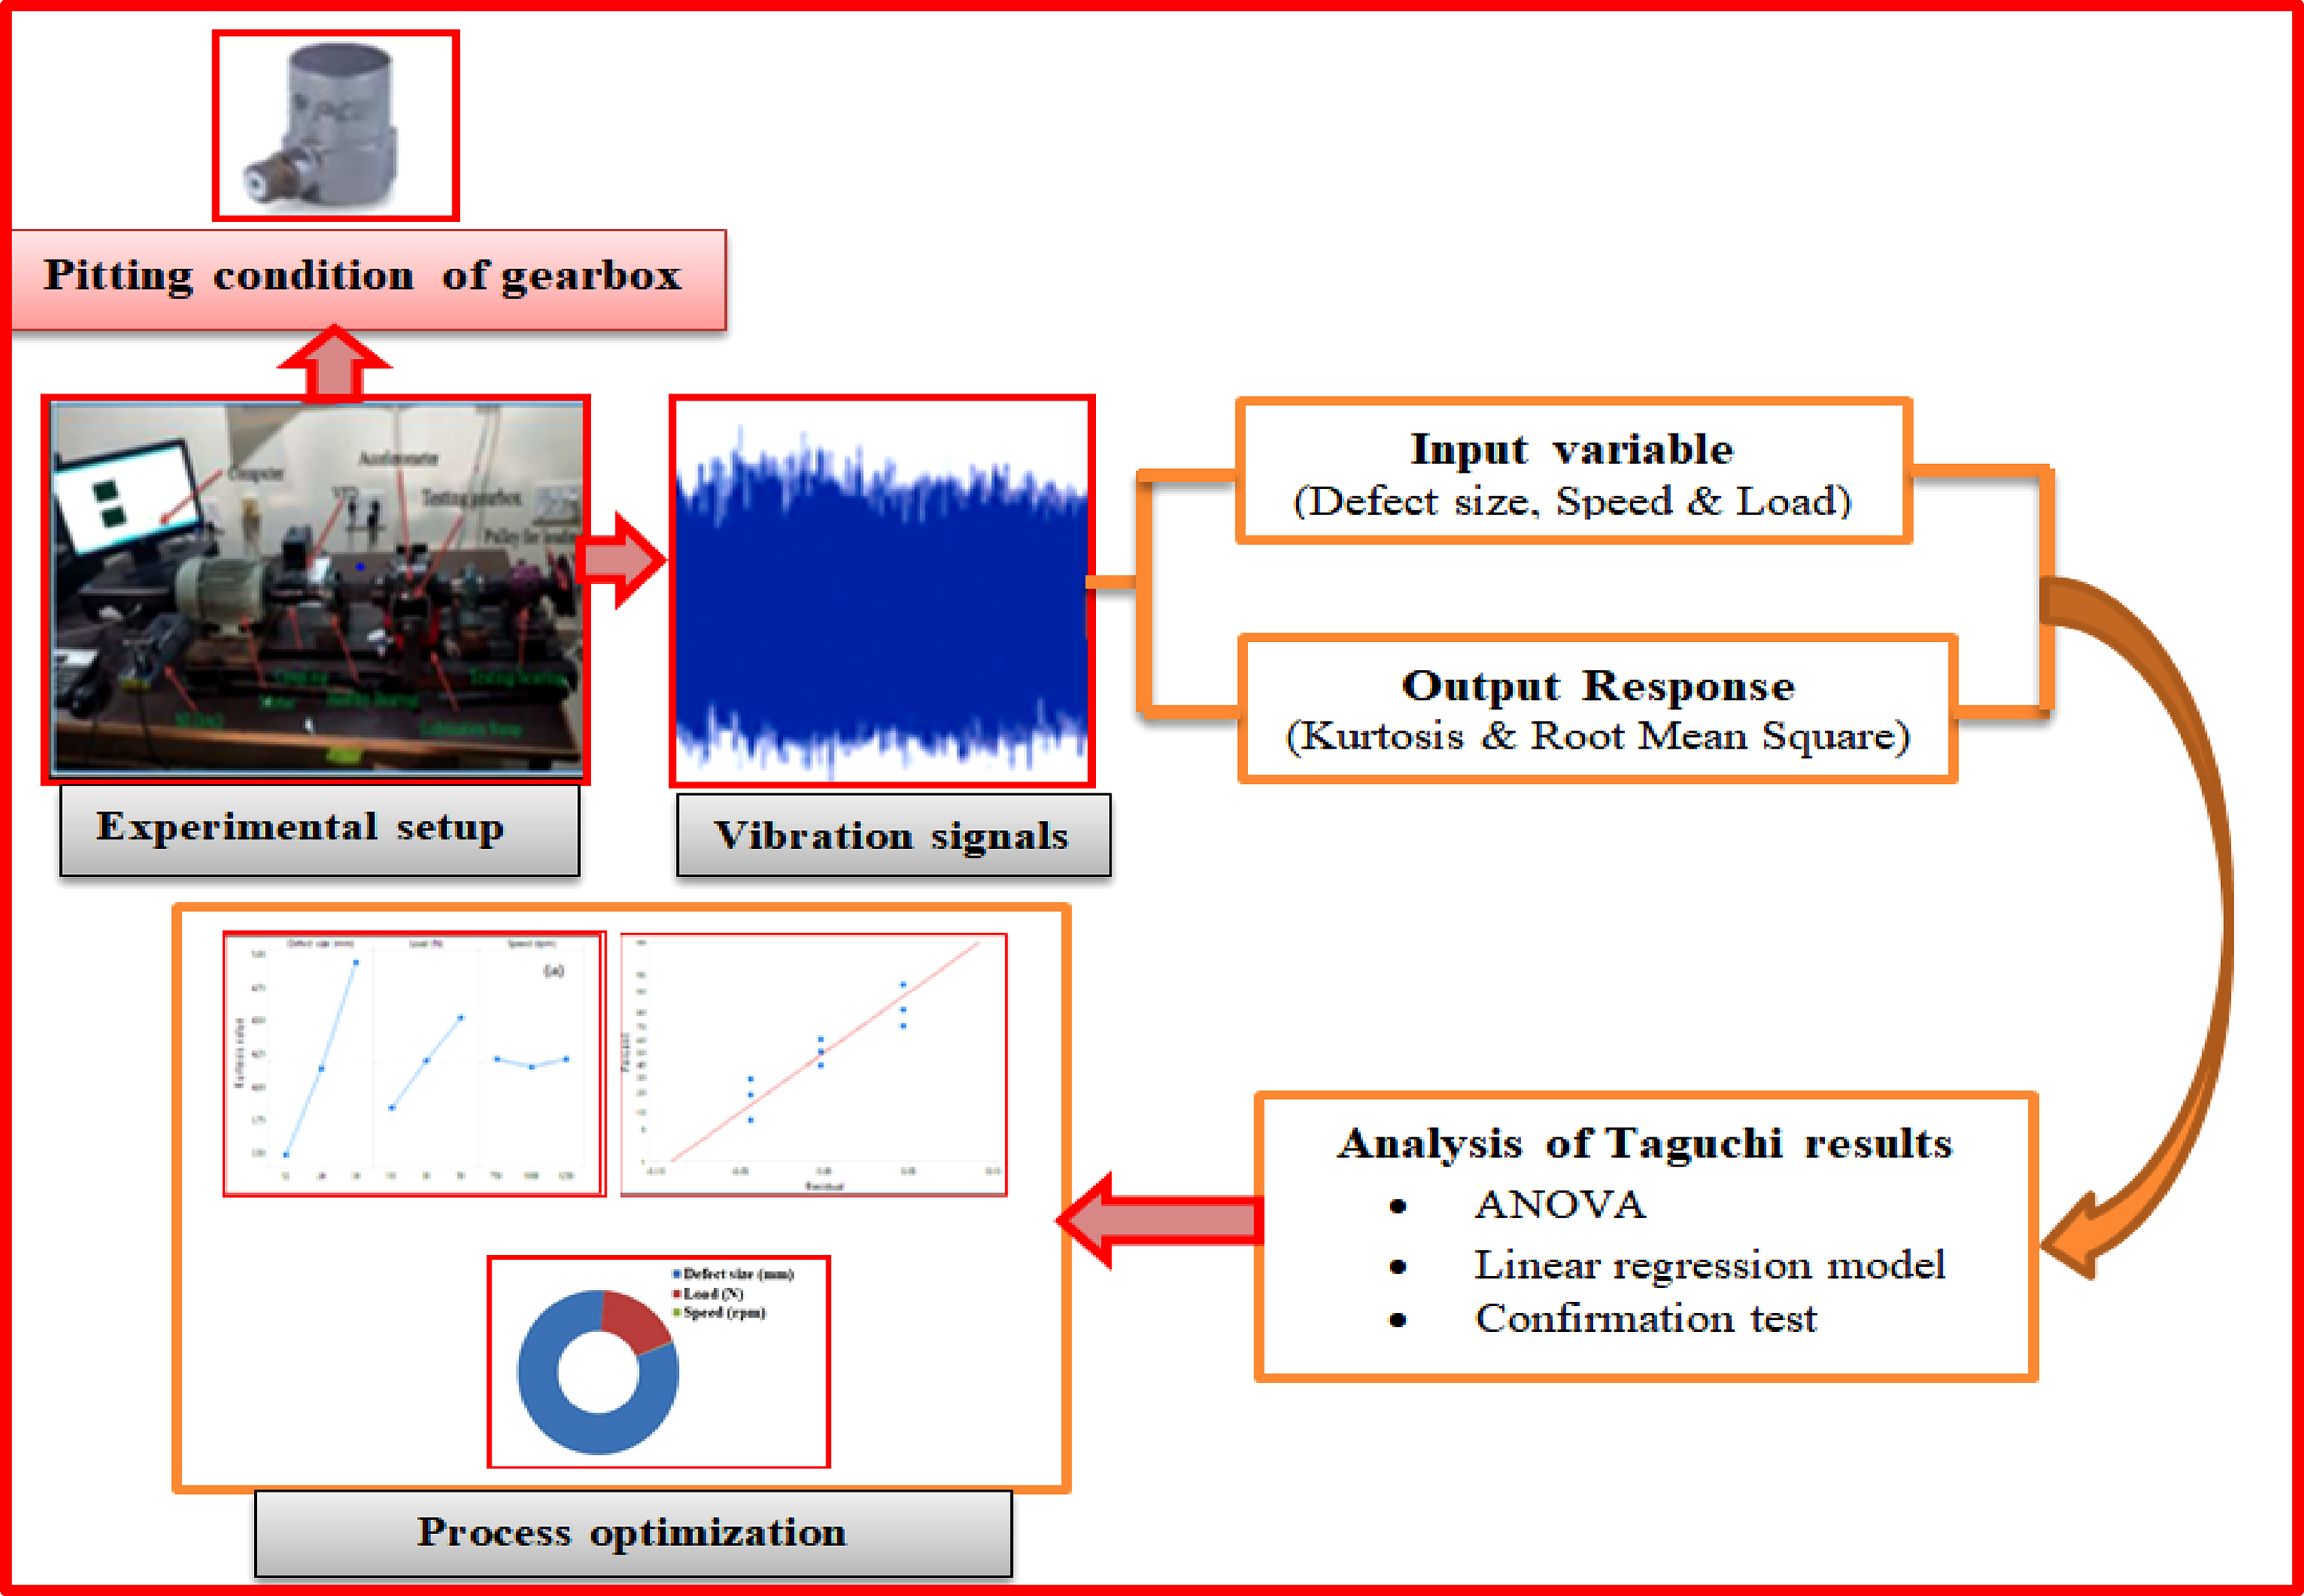
Equation (3) is used when the mean squared error is kept to a minimum around a specified objective value, and the nominal is the optimal form. The techniques of optimization implemented in this study are divided into four phases: planning, performance, analysis, and validation. The steps in the predicted Taguchi approach are depicted in, Figure 1. Step involved in planned methodology of Taguchi.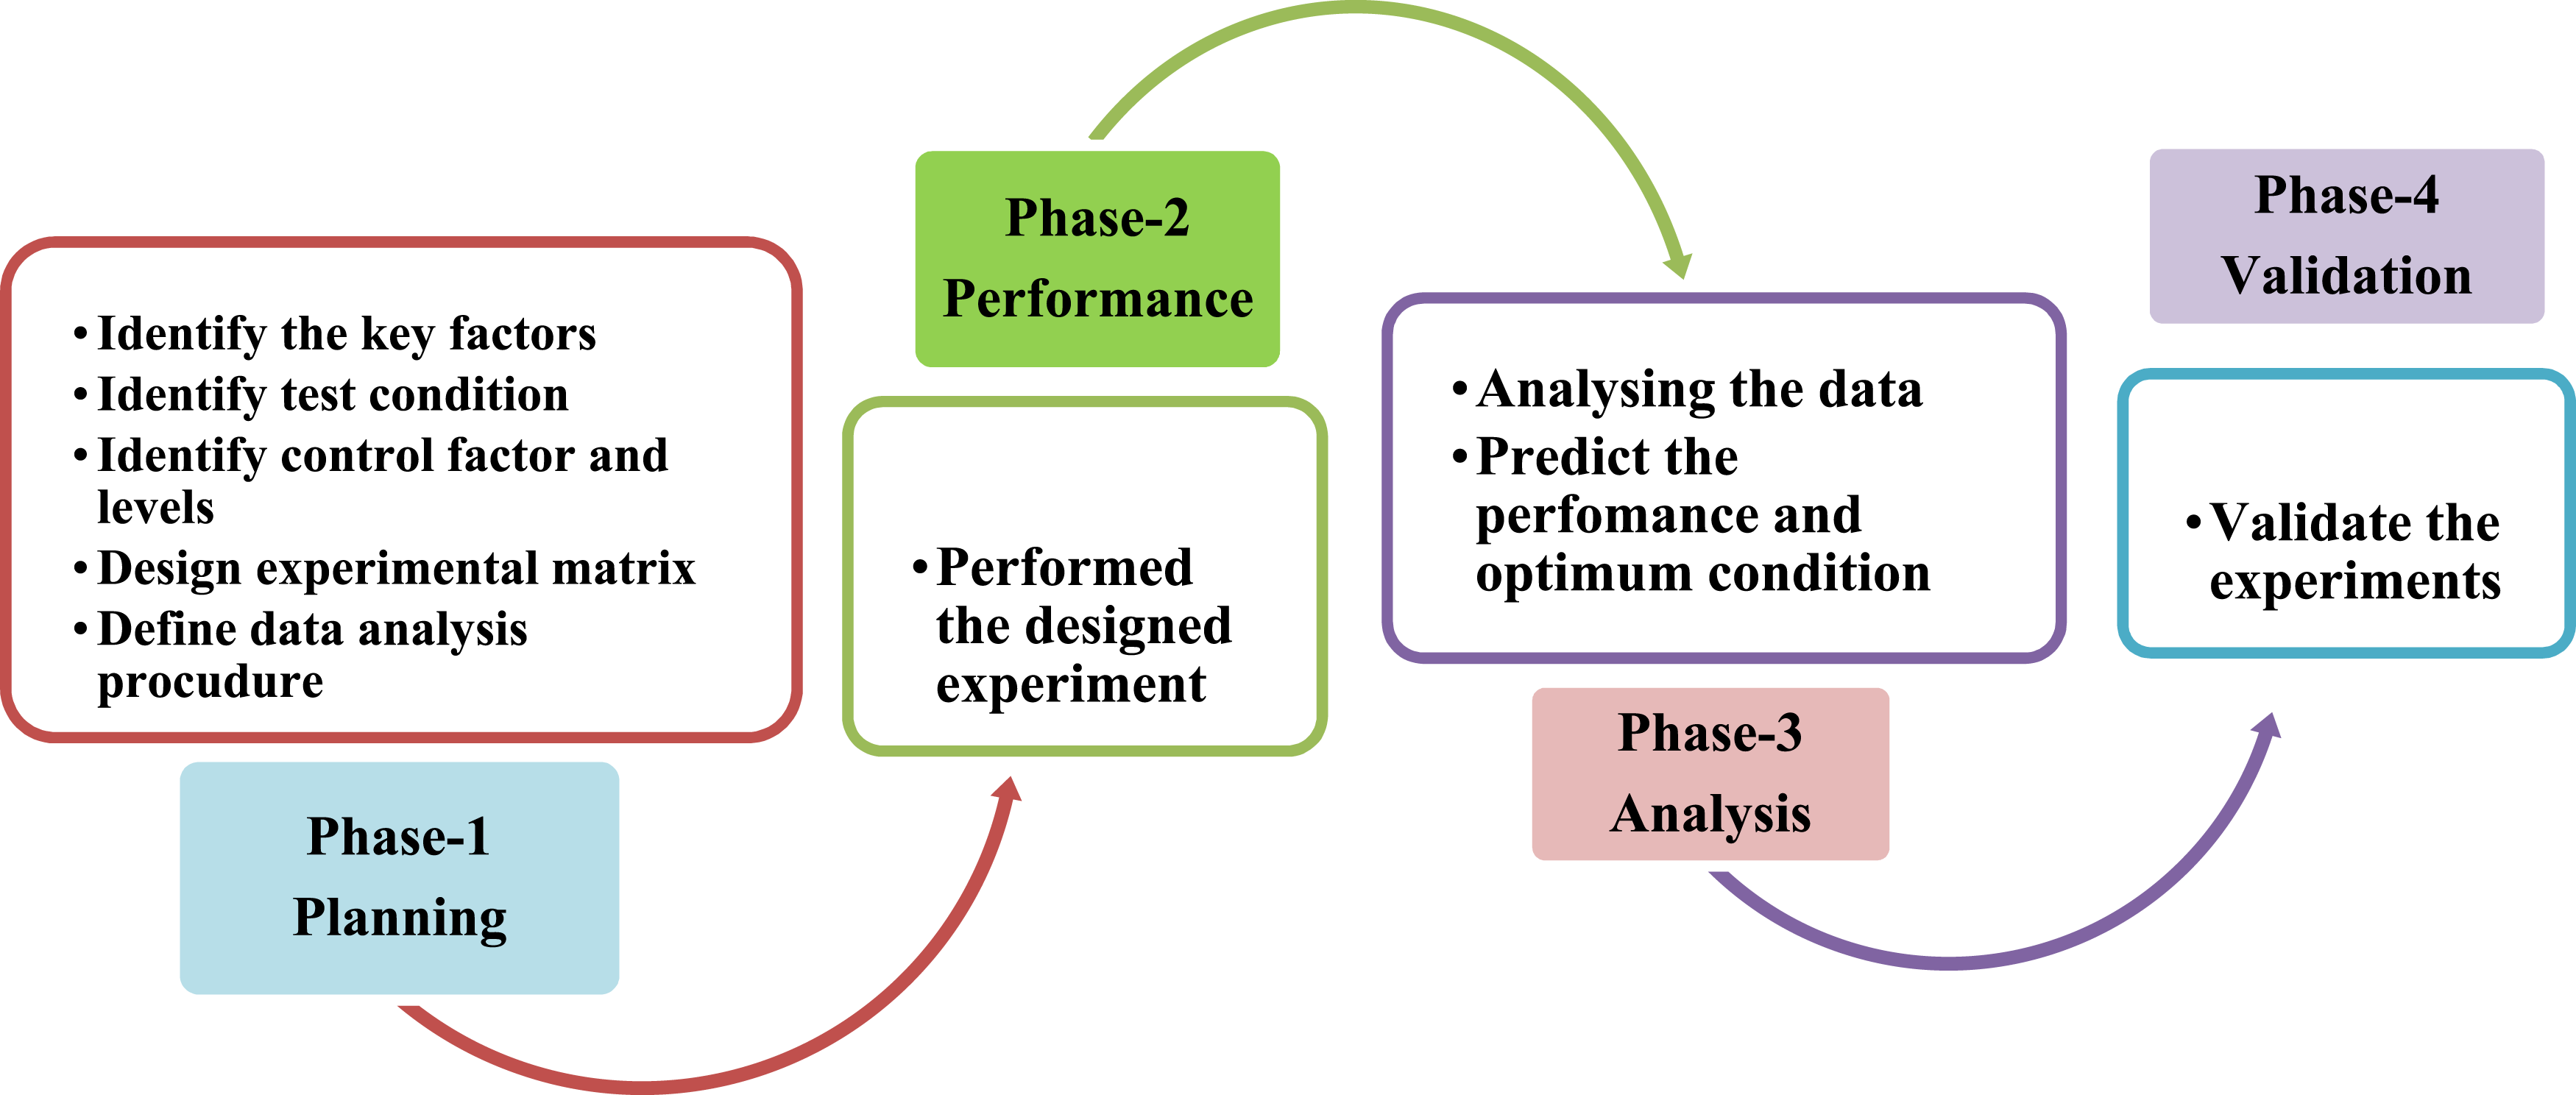
Experimental set-up and data acquisition
To illustrate the fundamentals of bevel gearbox defect detection, an experimental setup was established. Using the bevel gearbox test rig, experiments were conducted for this study under various pitting fault conditions while altering the load and speed. The actual and schematic experimental test setup used to identify bevel gearbox faults under defective conditions is depicted in, Figure 2. Under both normal and faulty circumstances, the tests were conducted on a bevel gearbox that uses a 1 HP three-phase induction motor to transfer power. A piezoelectric accelerometer with a sensitivity of 10.19 mV/(m/s2) and a frequency range of 1 to 4000 Hz was utilized to gather the vibration signals of gearbox systems operated between 100 and 1440 r/min with a sampling frequency of 25.6 kHz. The data was obtained using the four-channel data acquisition kit NI 9234 and analyzed using the Lab-VIEW National Instruments software, demonstrated in Figure 3. Data acquisition received the accelerometer’s output and converted it into electrical signals based on determined physical characteristics. Bevel gearbox experimental set-ups. NI 9234 – 4 channel data acquisition card (DAQ).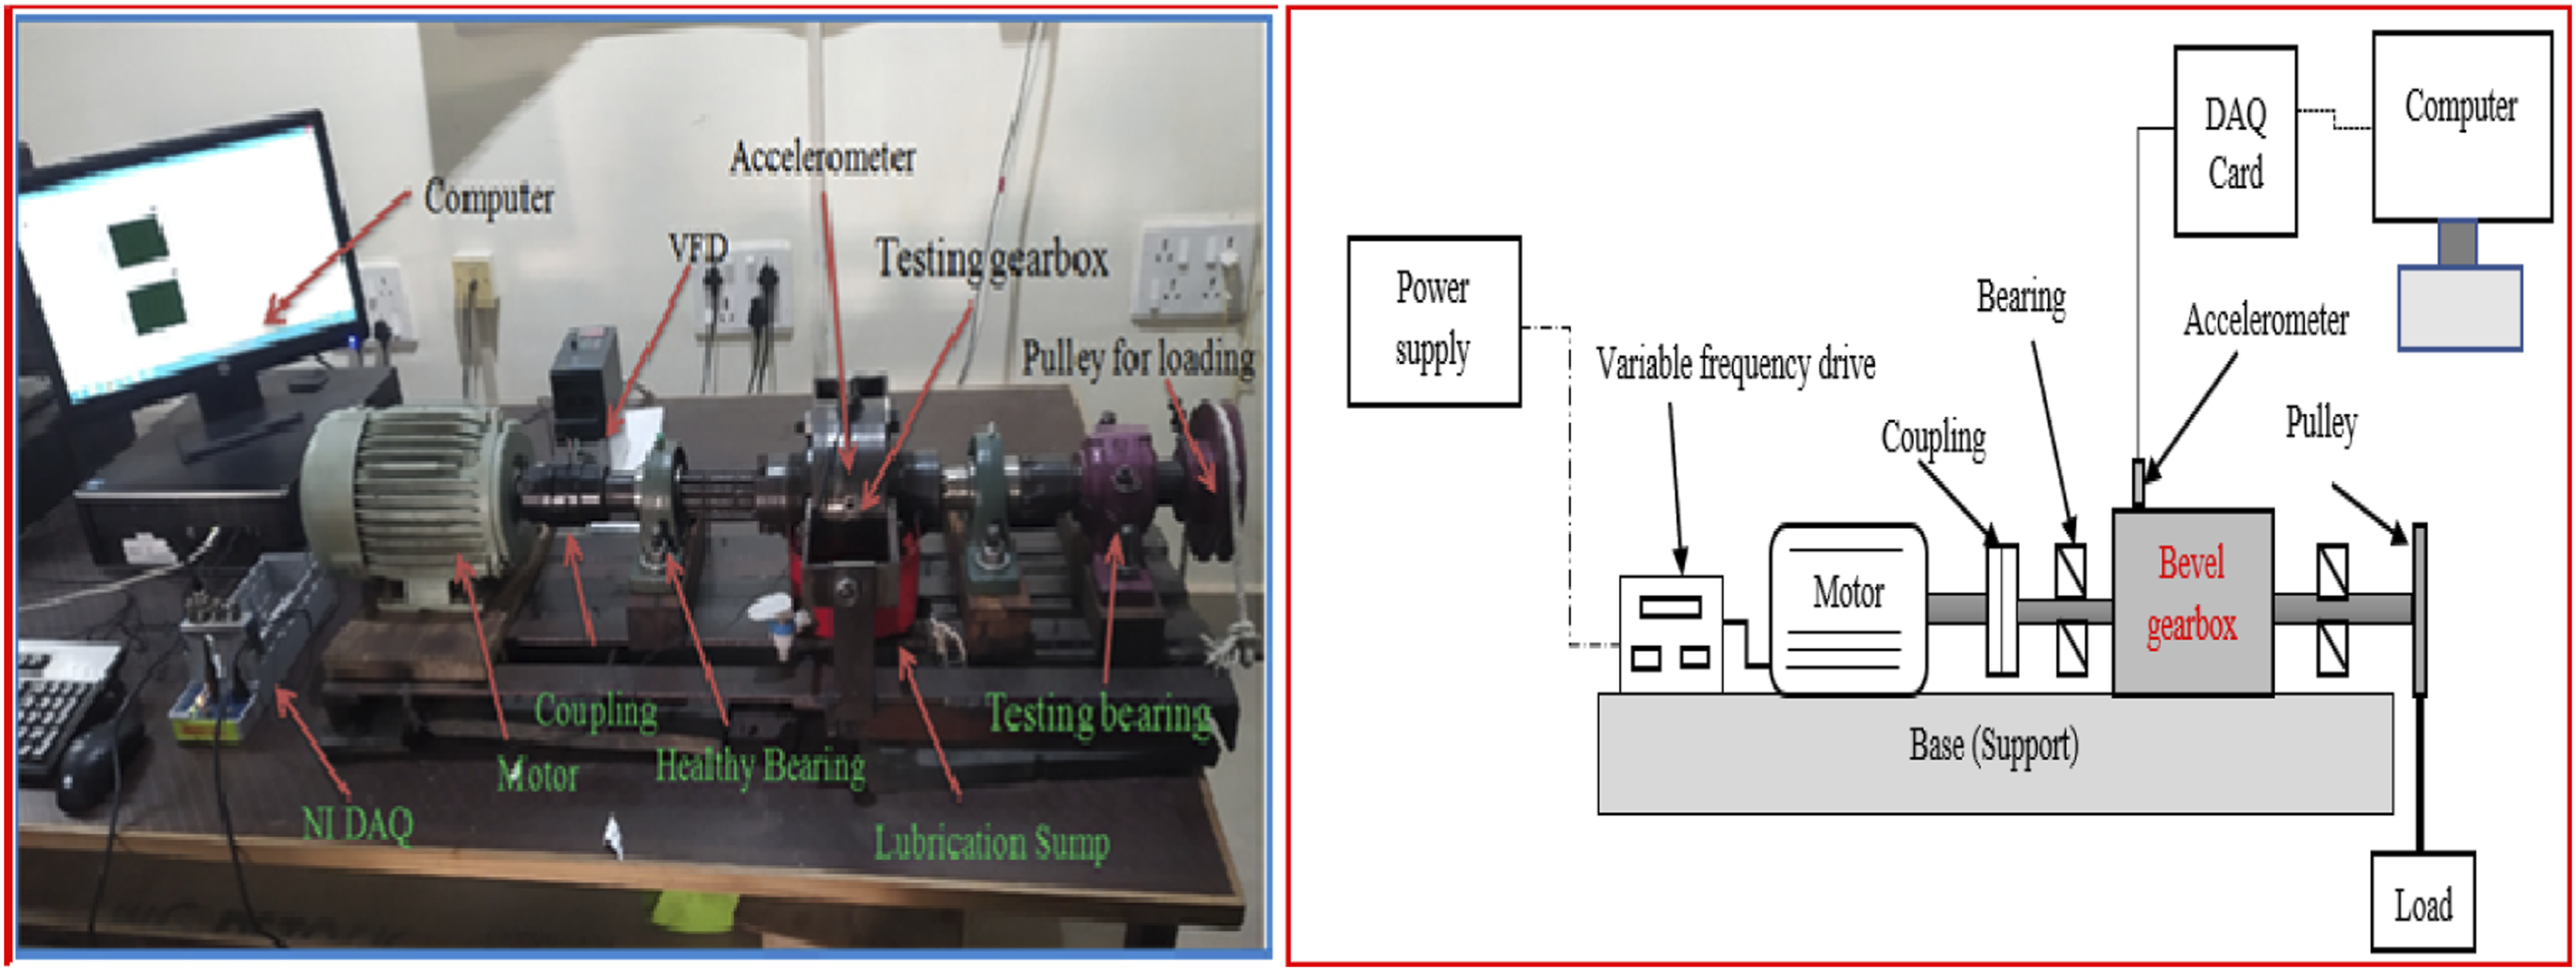
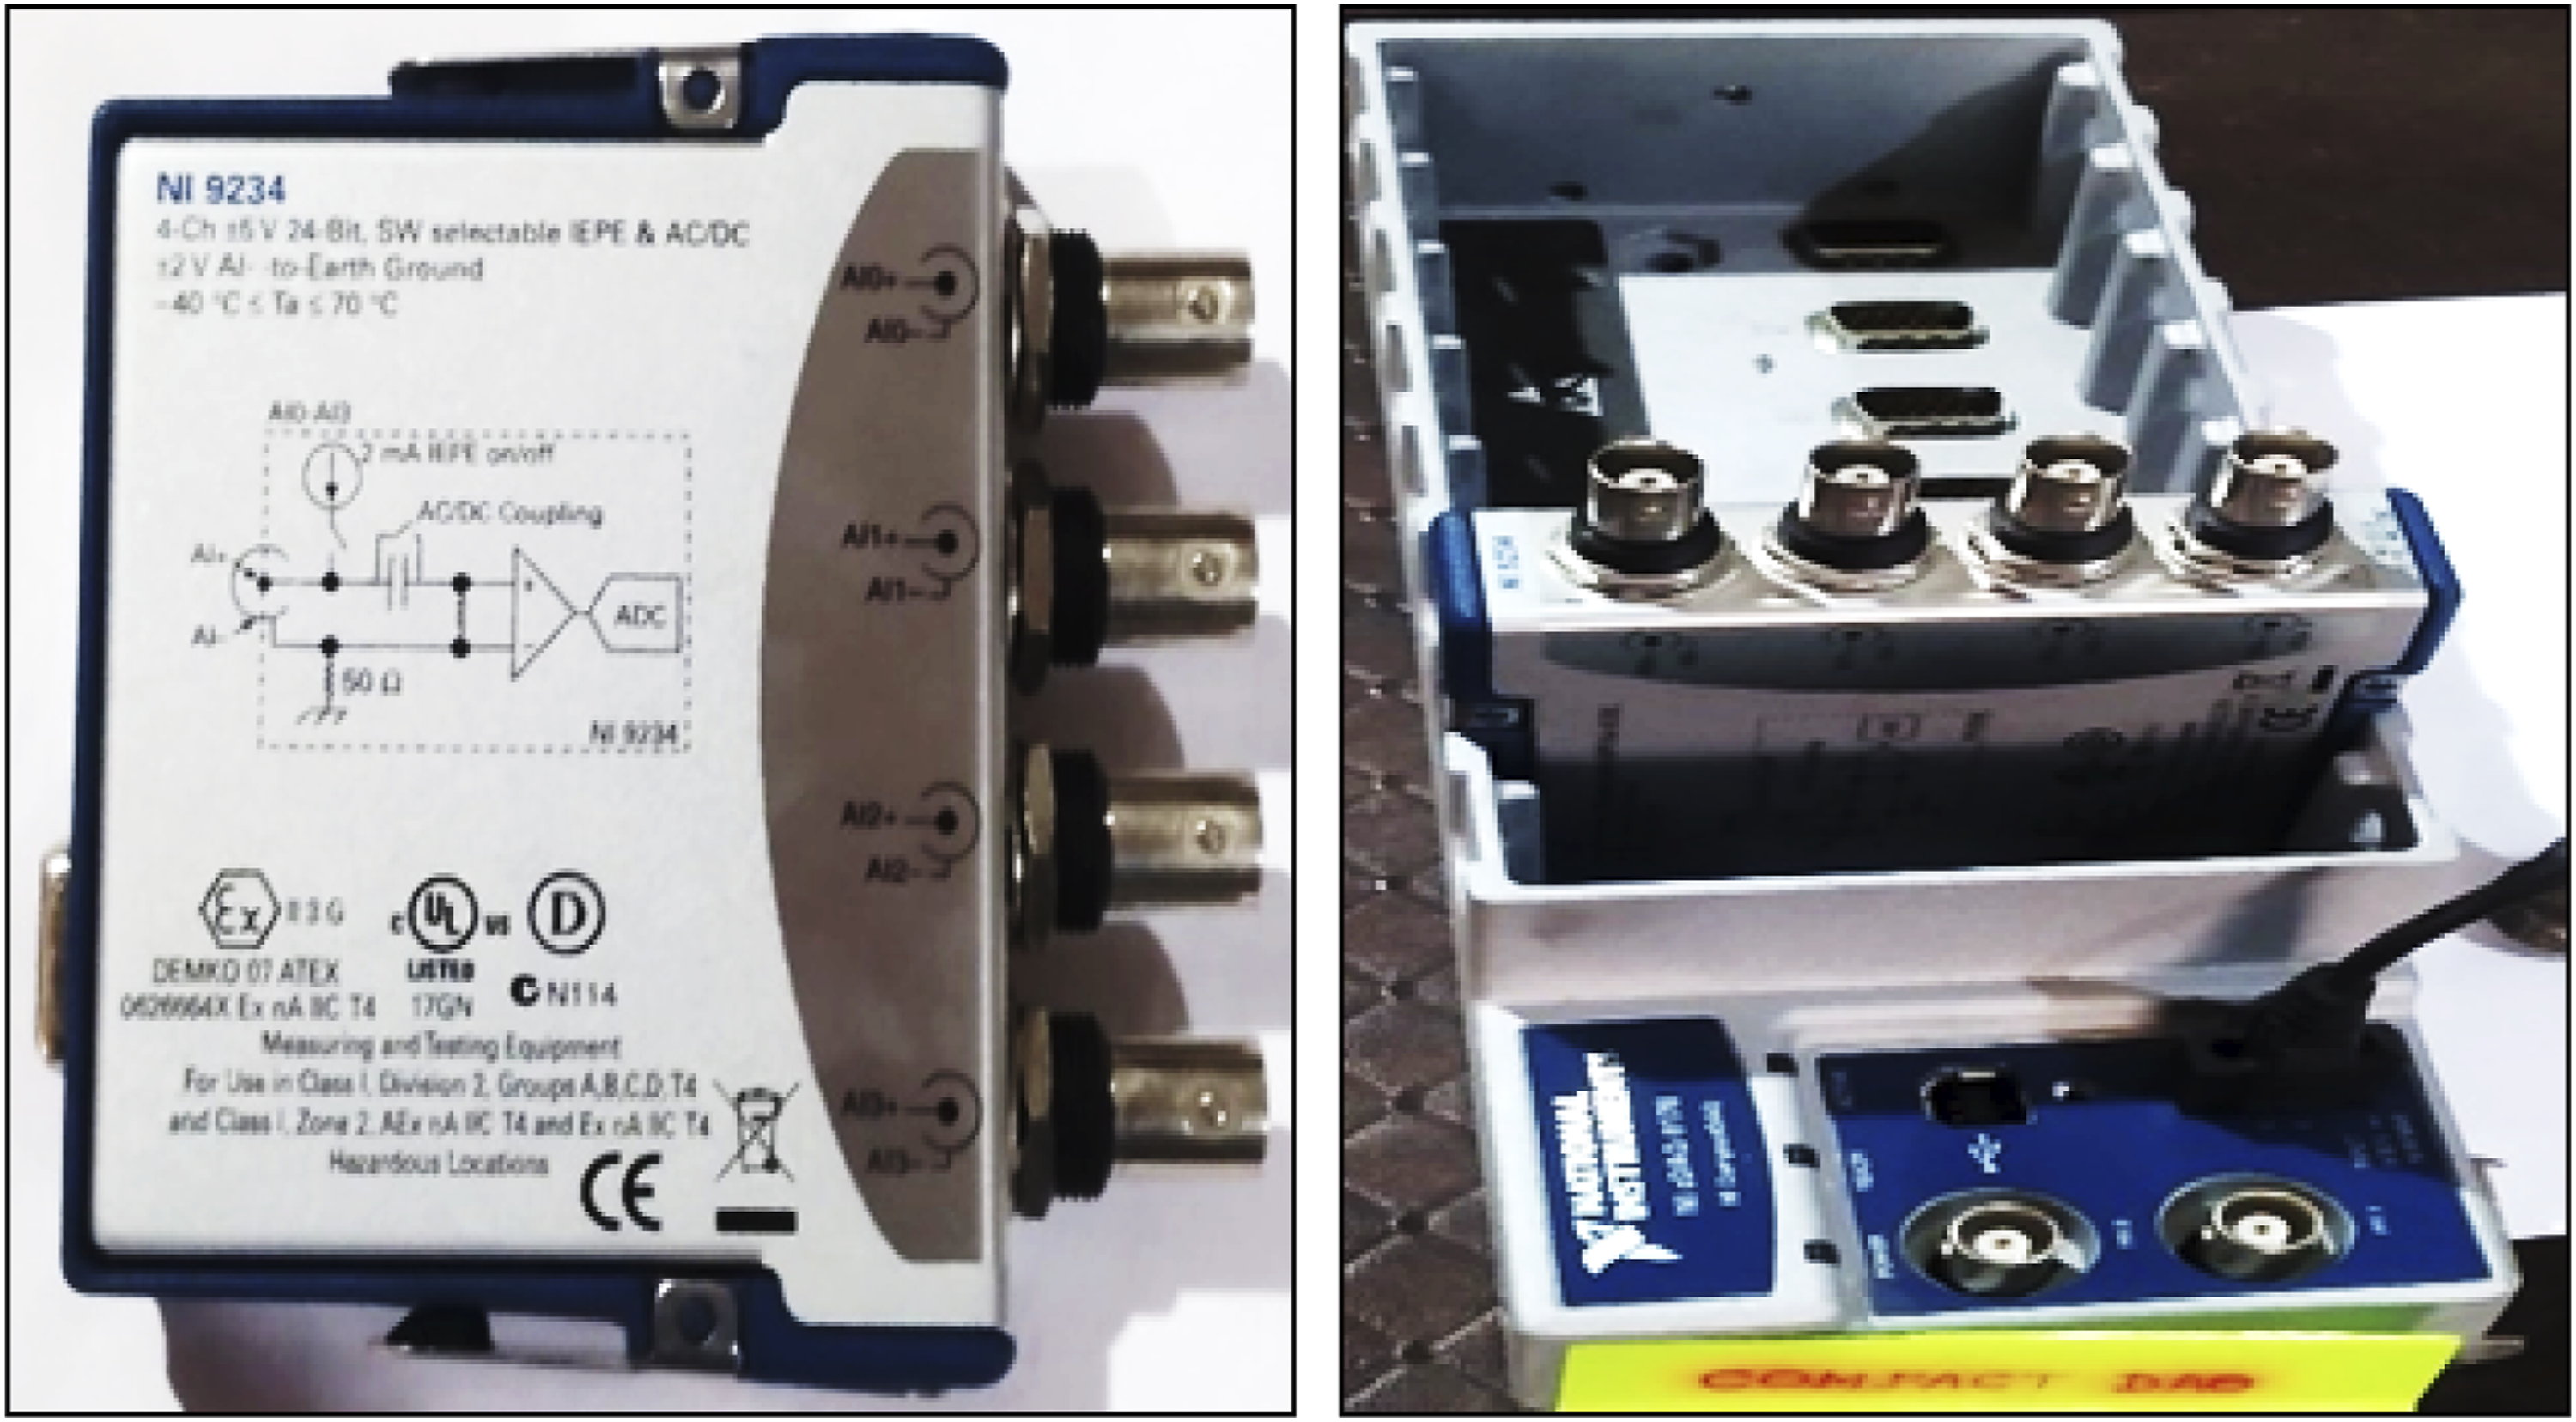
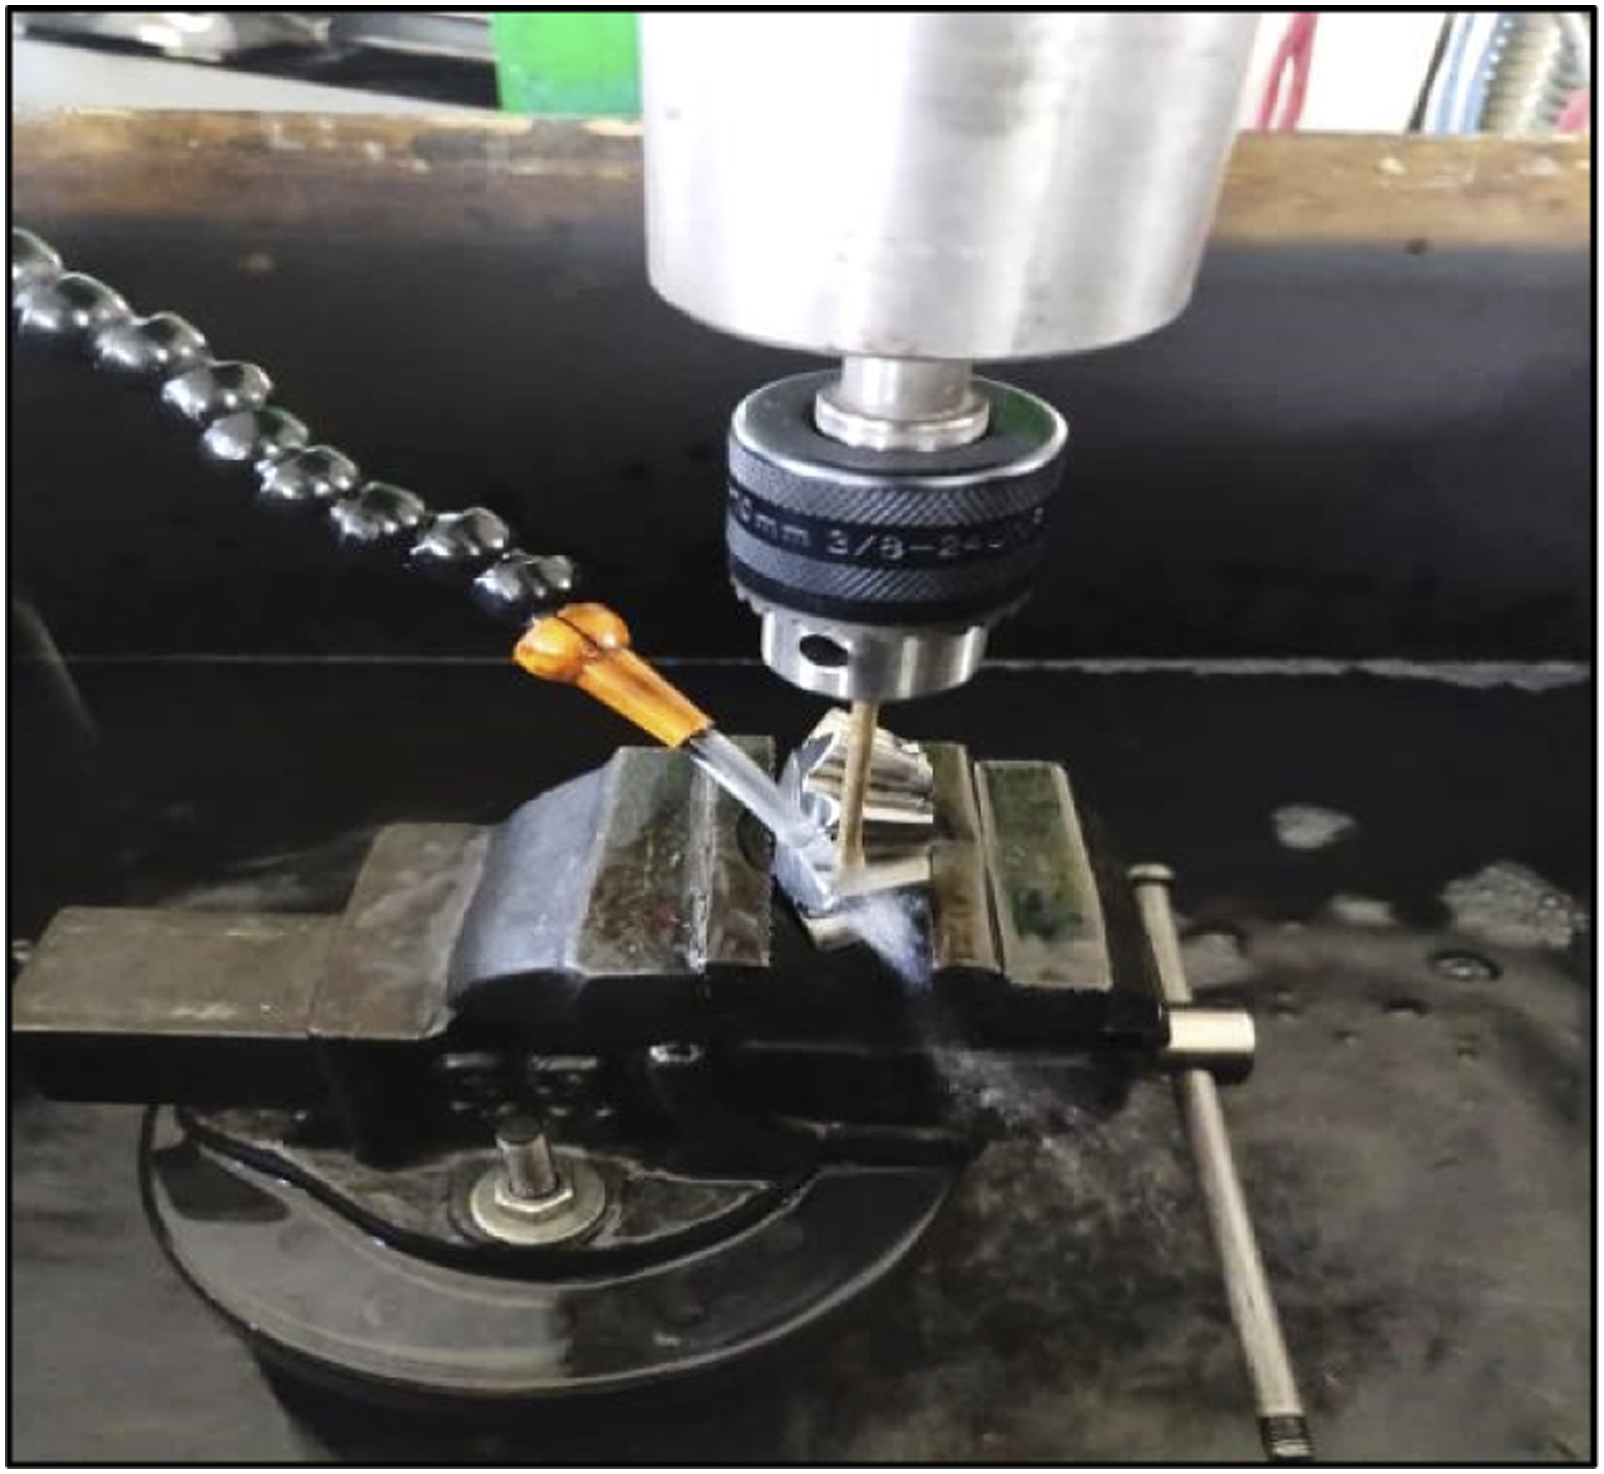
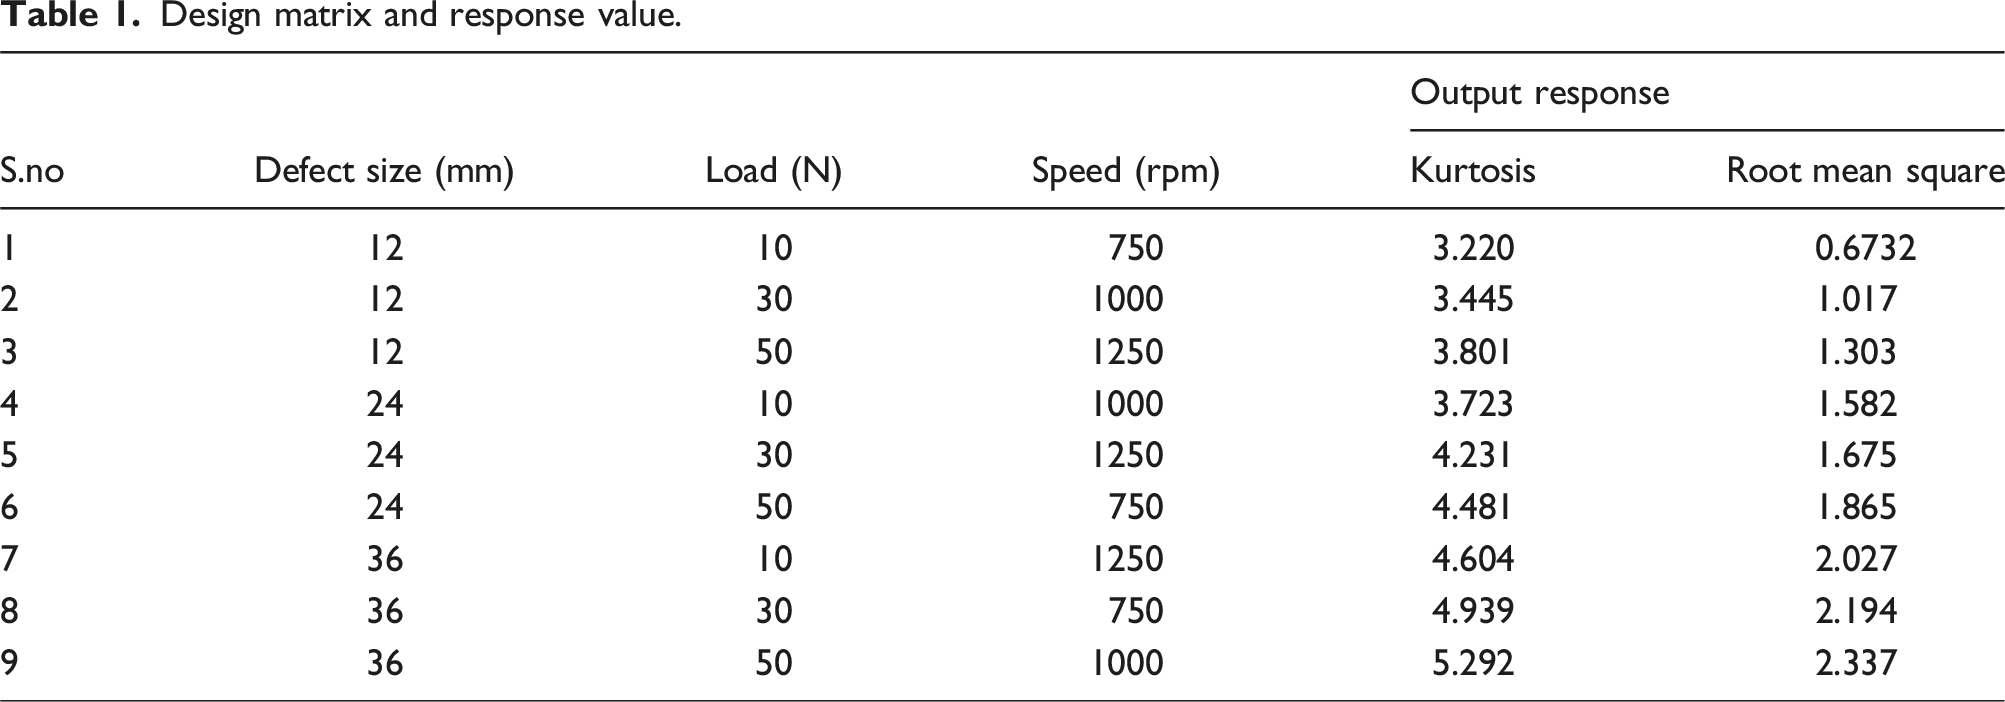
A DAQ system consists of sensors, DAQ measuring equipment, and computers with programmable software when employing NI (National Instruments) equipment for vibration data collecting in fault diagnostics. Five trials were conducted at the predetermined pace to prevent data acquisition inconsistencies. In this experimental procedure, bevel gears were used, Figure 4. In gears, the simulated defects were created using an electric discharge machine on the bevel gearbox to possess the magnitude of the defect, is illustrated in, Figure 5. Three gear teeth were machined to provide each pitting level in gear. The number, diameter, and depth of the holes characterize the increase in pitting. The quantity, size, and pitting percentage of holes for each pitting severity level are displayed in Table 1. This variety in severity is represented by the proportion of the surface affected, which varies from 12 % to 36 %. The vibrational signals were extracted from the accelerometer mounted on the test rig. After the faults were introduced, the vibration data was captured from the bevel gearbox after allowing some time. According to the Nyquist sampling theorem, the sample length should be 12800, chosen for each condition, and the sampling frequency should be 25.6 kHz. Bevel gearbox conditions (a) Slight Pitting (b) Medium Pitting (c) Severe Pitting. Electric discharge Machine. Design matrix and response value.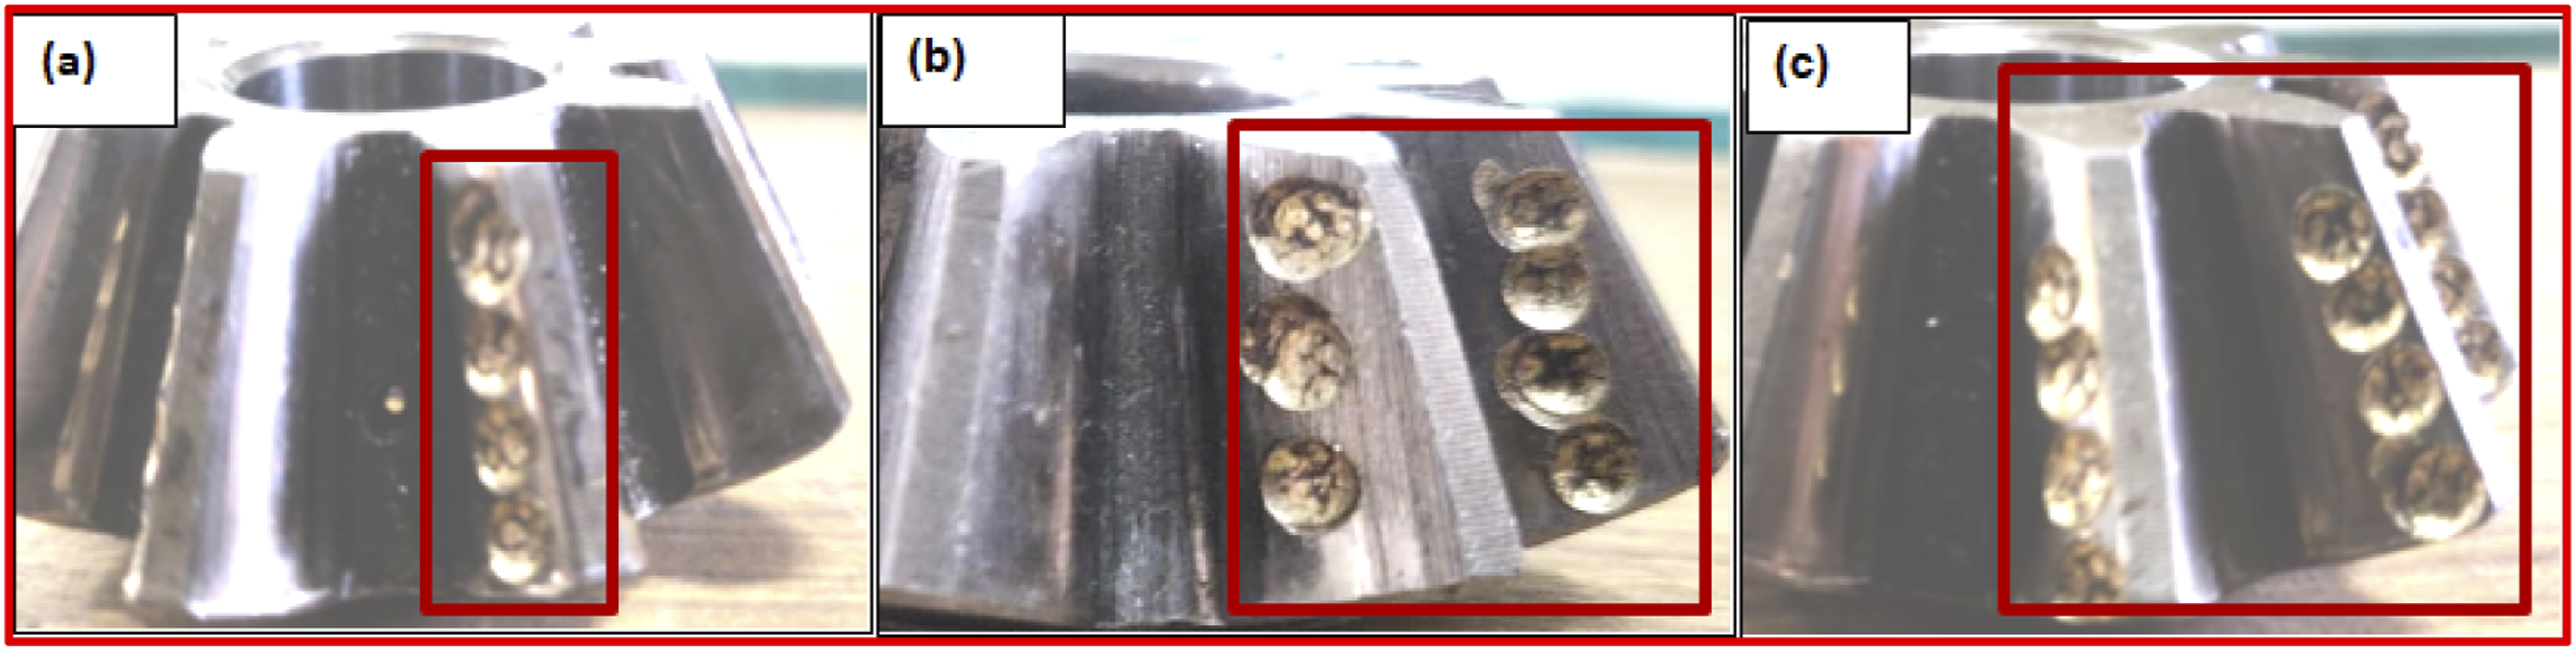
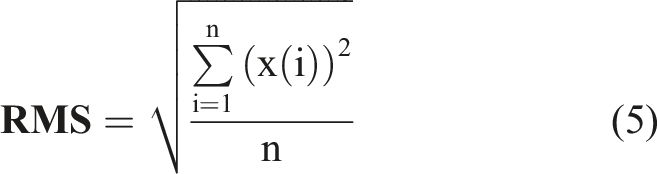
Signal preprocessing and feature extraction
The efficient detection of the bevel gearbox fault depends on the essential and accurate statistical characteristics of vibration signals. The accuracy of fault detection and improved computational time are diminished by imprecise and improper characteristics. Kurtosis and Root mean square statistical characteristics were derived from vibration approximation signals in this analysis. The characteristics which have been extracted are given below.36,37
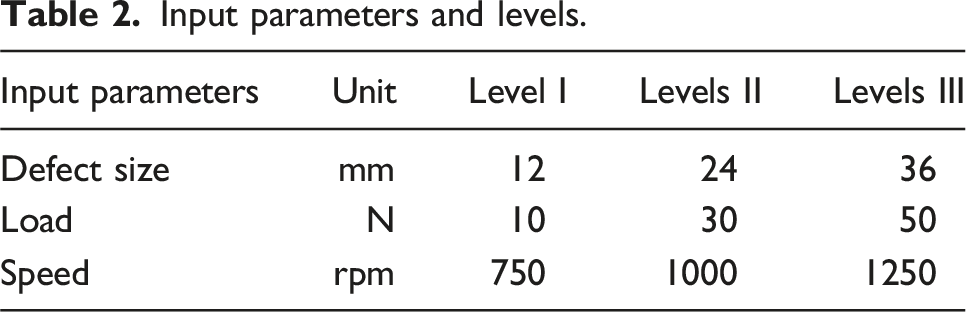
Input parameters and levels.
• Slight pitting means 4 numbers of pits are created, (12 % of the area of tooth is pitted)
• Moderate pitting means 7 numbers of pits are created, (24 % of the area of tooth is pitted)
• Severe pitting means 10 numbers of pits are created, (36 % of the area of tooth is pitted)
Results and discussions
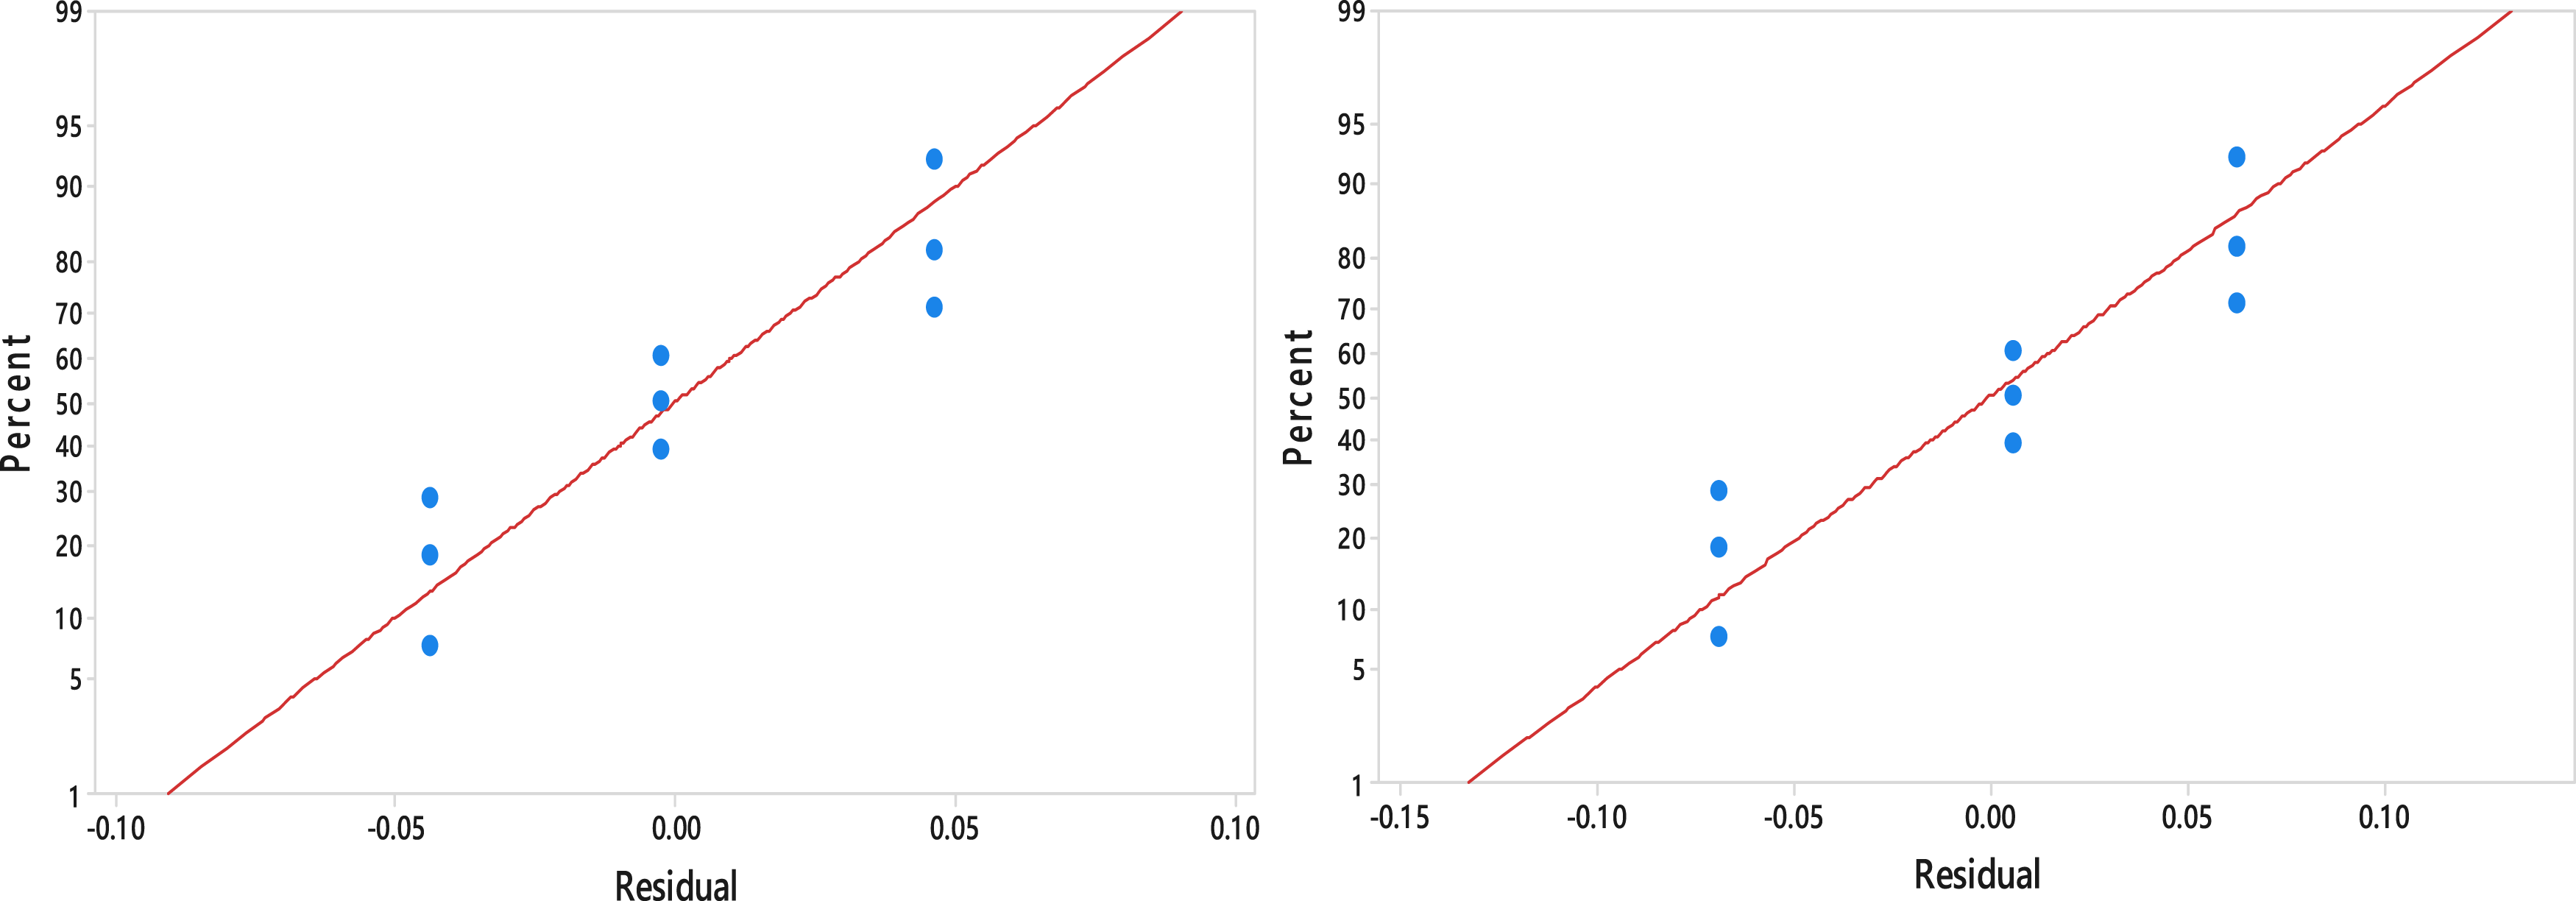
The main effect plots for output parameters and input process parameters that monitor the working condition of the gearbox are represented in Figure 6. The kurtosis value was observed to increase with an increase in the size of the defect and the loading state, but the effect of velocity on the kurtosis value was less. As the defect size, load, and rotating speed increase, the kurtosis value increases as well, as seen in Figure 6(a). The Root mean square value variance resulting from variations in the defect size, applied load, and applied speed is displayed in Figure 6(b). It was easily noticed that the Root mean square value increased with increasing defect size, load and rpm, which play a significant character in the detection of gearbox faults. Analysis of Variance data used to create the residual plot in Figure 7 show the discrepancies between the observed and expected values of the response variable, which is usually the root mean square and kurtosis in gearbox fault diagnosis. The projected response values are determined for every trial based on the factor levels following the fitting of a model utilizing the experimental design, such as Taguchi’s approach. After then, residuals are calculated by deducting these expected outcomes from the measured values. To determine whether the model is adequate and whether the Analysis of variance assumptions are met, these residuals are demonstrated. Main effect plots for (a) kurtosis value (b) Root mean square. Main effect of residual (a) kurtosis value (b) Root mean square.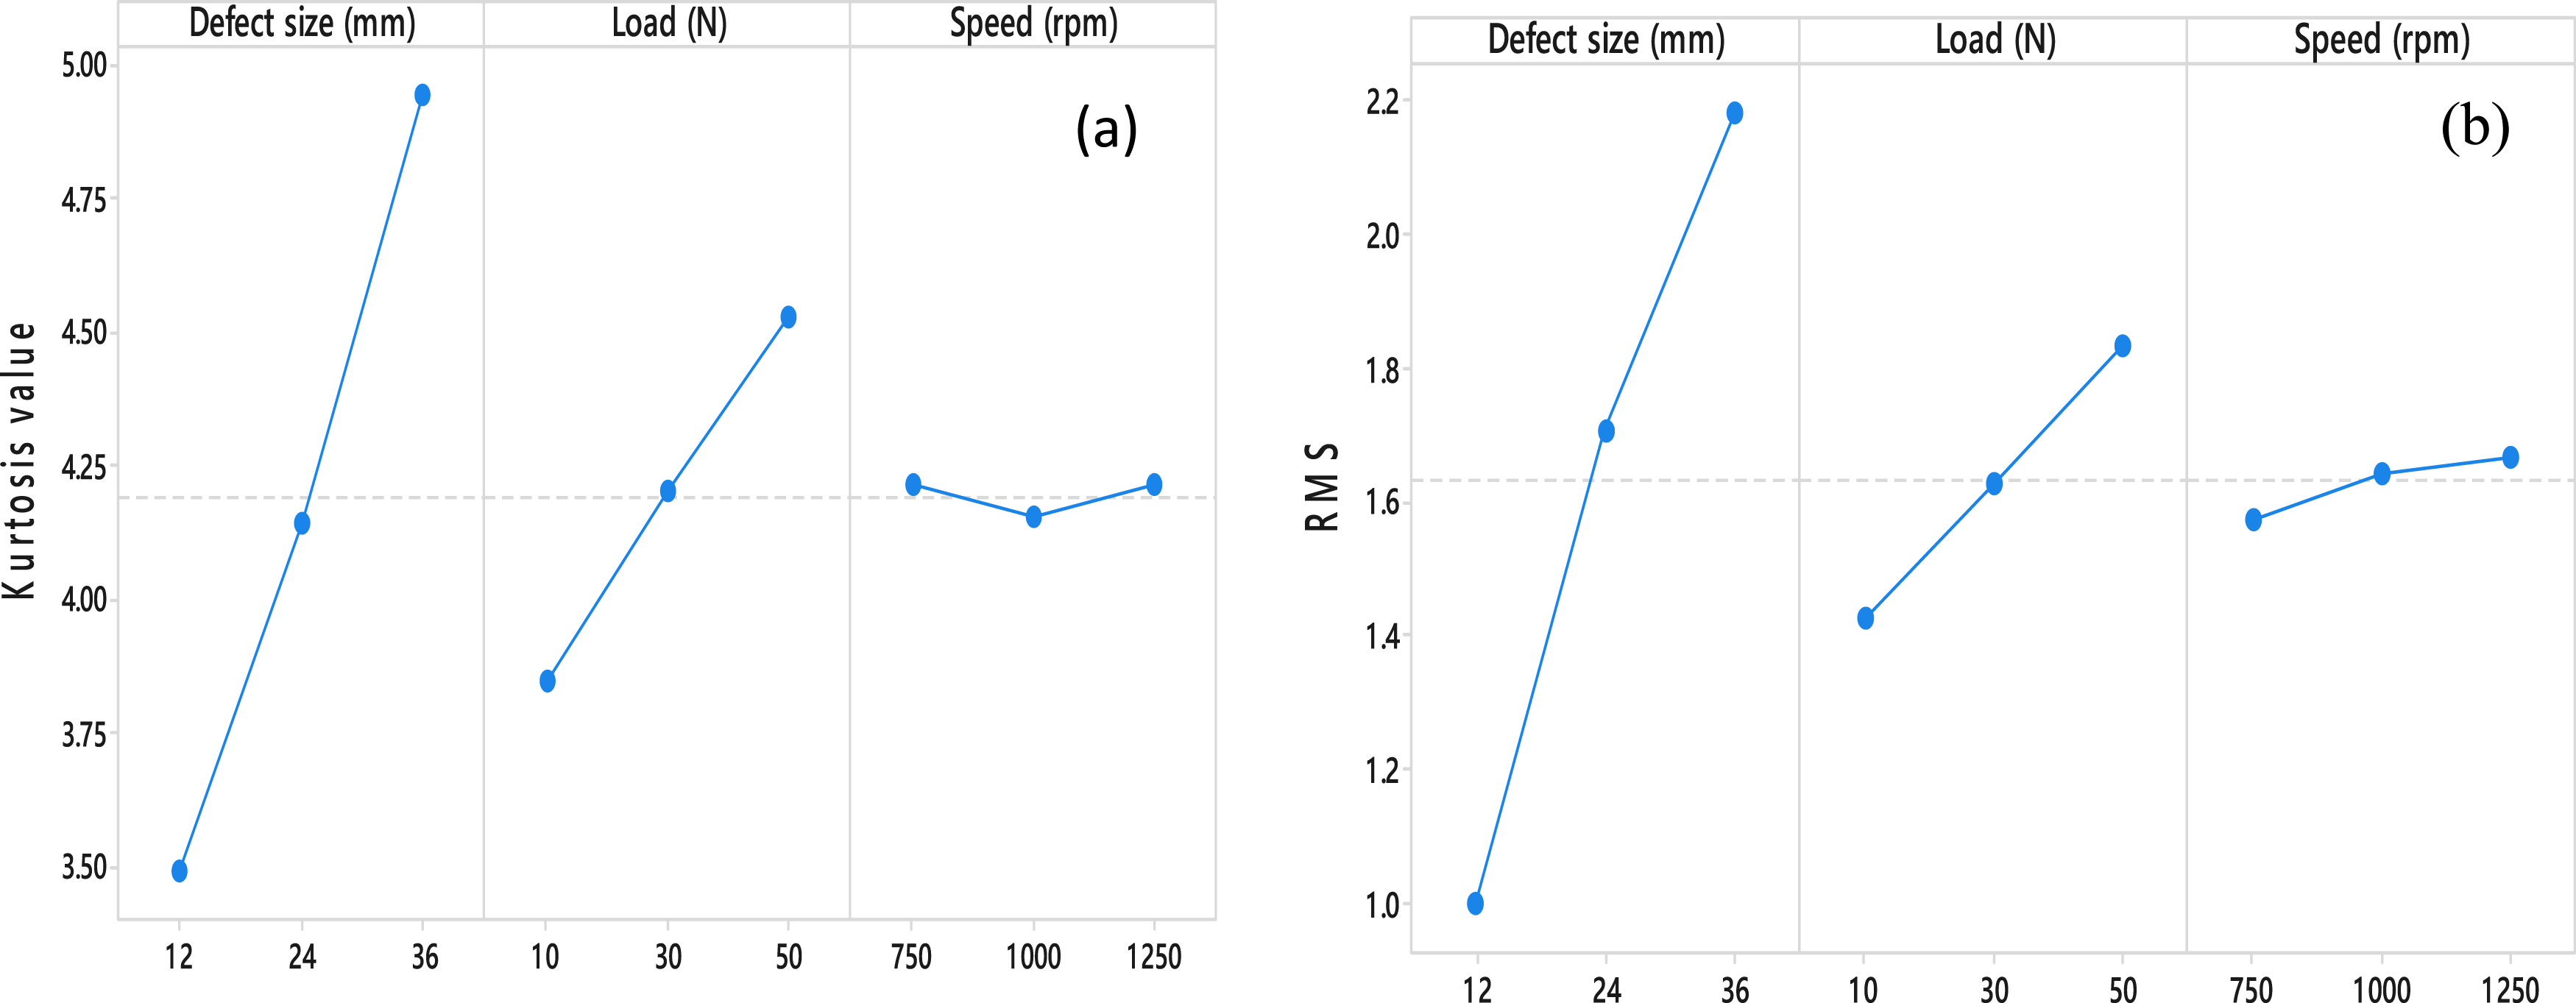
Analysis of variance
Kurtosis table for Analysis of variance.
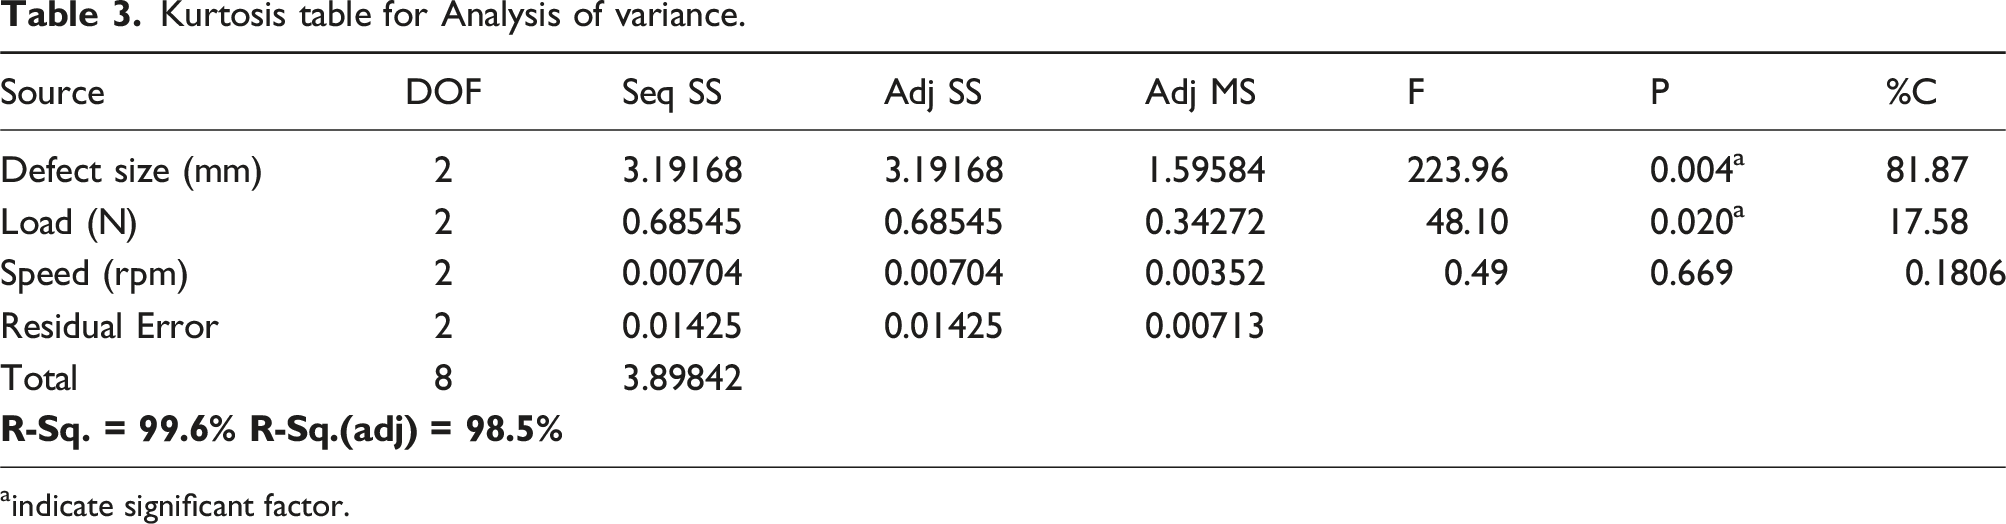
aindicate significant factor.
Root mean square table for Analysis of variance.
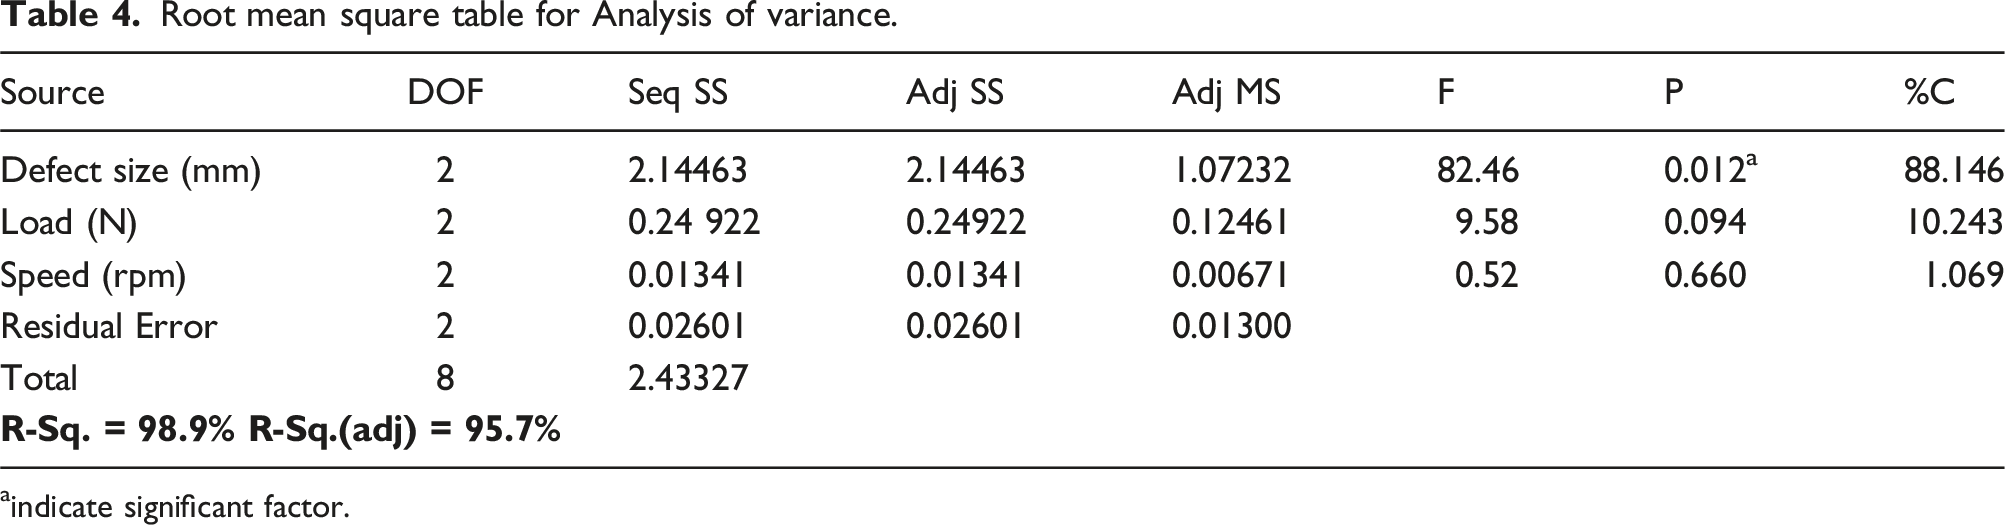
aindicate significant factor.
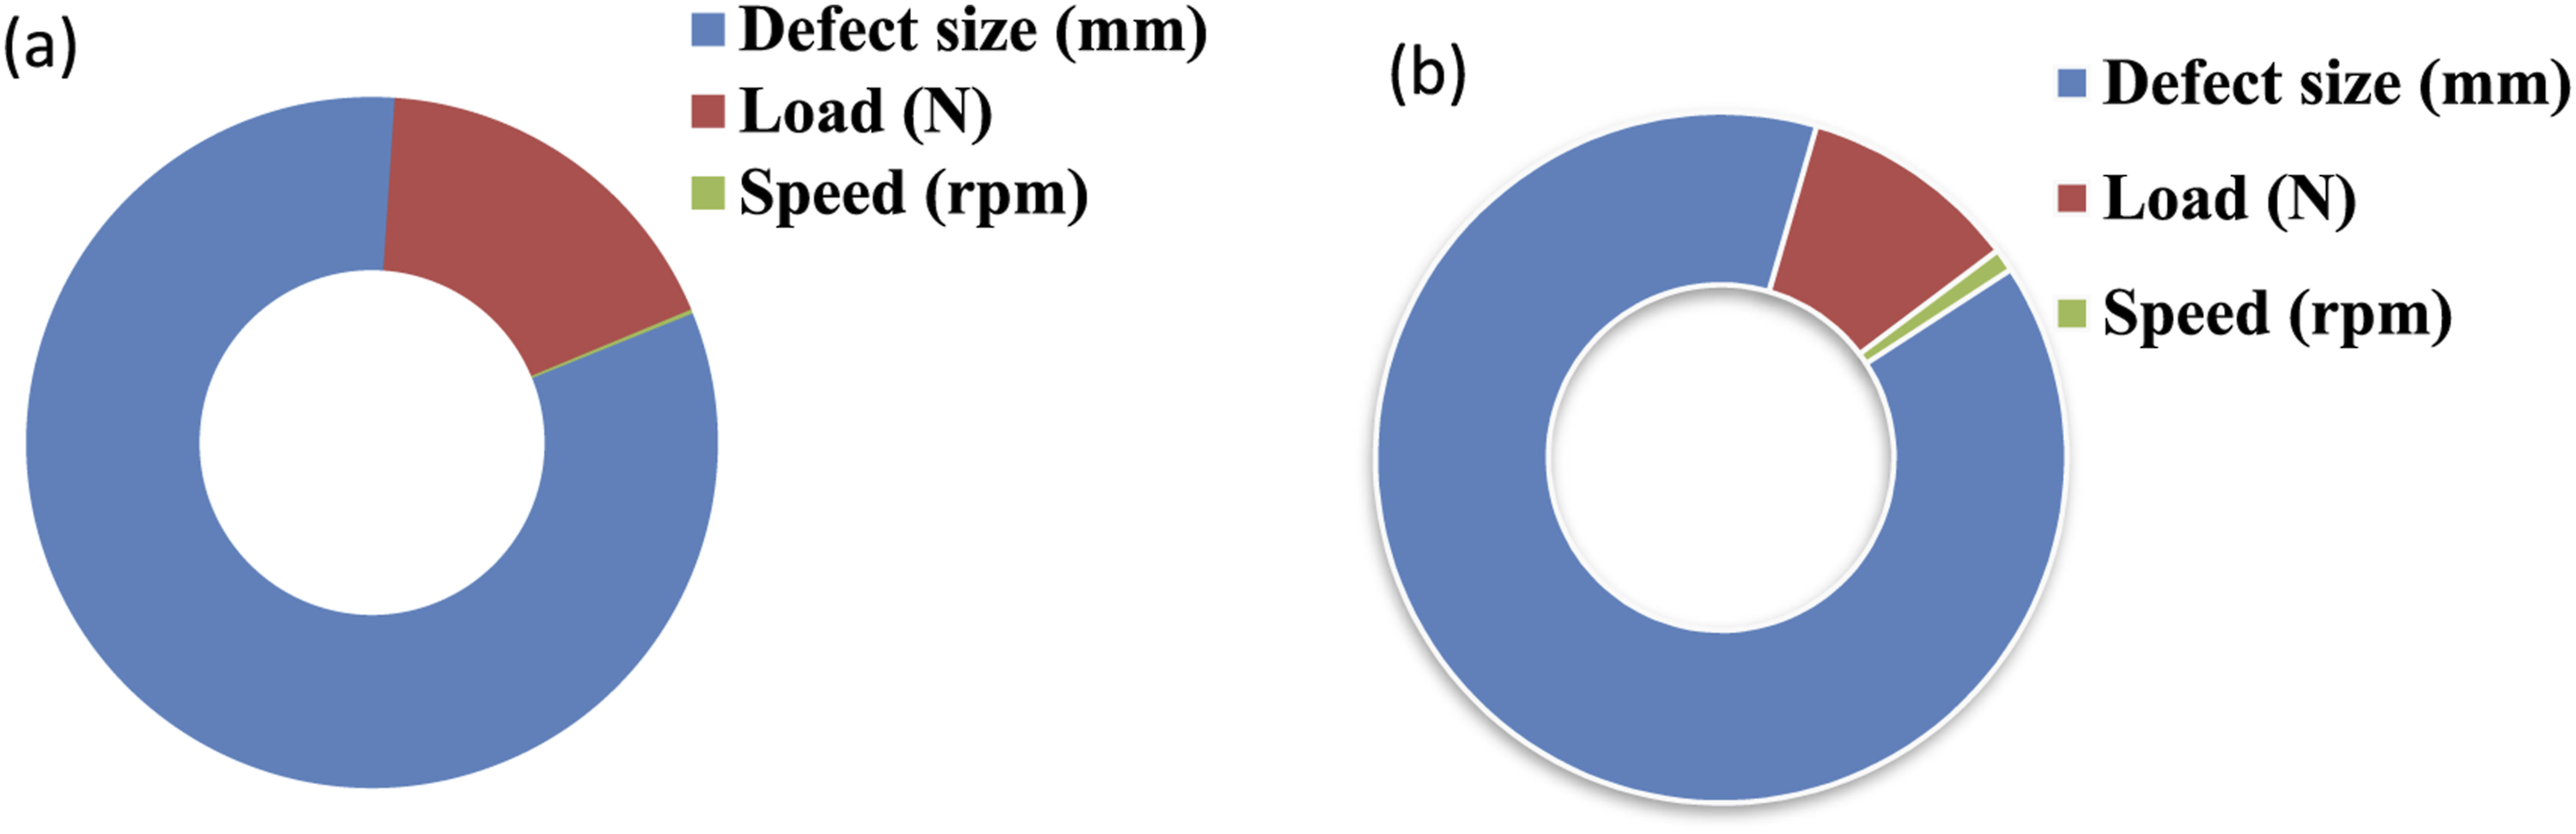
Contribution (%) of input parameters (a) Root mean square (b) kurtosis.
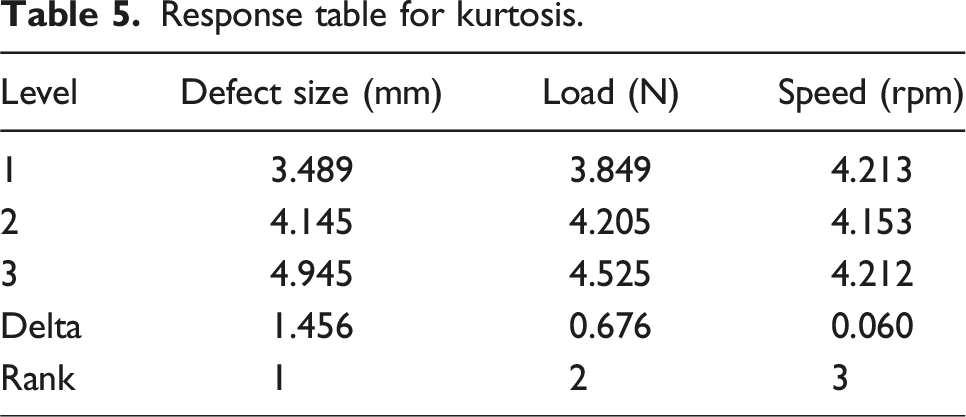
Response table for kurtosis.
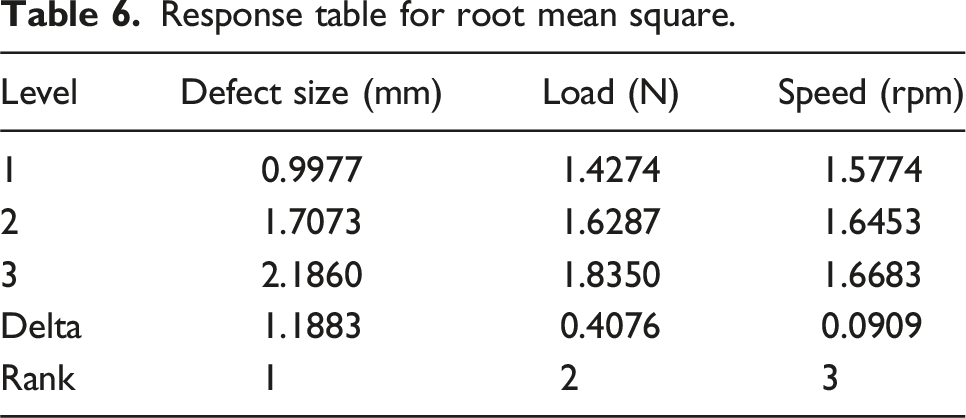
Response table for root mean square.
Linear regression model
A linear regression model was constructed as a second-order polynomial to correlate the input parameters using the response of the predicted variables. The relationship between the input variables, such as velocity (S), applied load (L), and pitting defect size (D), was defined using second order polynomial regression models. Equation (6) for Kurtosis shows that the first-order coefficients are orders of magnitude larger than the second-order terms (D2, L2, and S2), which have values like 0.000499, −0.000073, and 0.000002 correspondingly. Similar to this, the squared and interaction factors in equation (7) for Root Mean Square, such as D2, L2, S2, D*L, and D*S, all have modest coefficients, primarily in the range of 10−4 to 10−6, indicating a negligible contribution to the total response. This indicates that the response surface is almost linear across the range under study, and the addition of second-order elements probably only slightly refines or curvatures the model. Unless the variable values are very large, these modest values might not have a major impact on the model’s output. As a result, it is reasonable to say that the major effects predominate and that the second-order effects in these equations are barely noticeable. However, if provided, statistical significance, p-values, or confidence intervals would offer a more accurate explanation.
The output response regression equation as kurtosis and Root mean square value is given in below.

Confirmation test
To ensure that Taguchi is in the predicted optimal condition, confirmation tests must be carried out. To calculate and validate the response at the predicted optimum response state, the expected S/N ratio (η) was employed, and the equation (8) was utilized for measurement.
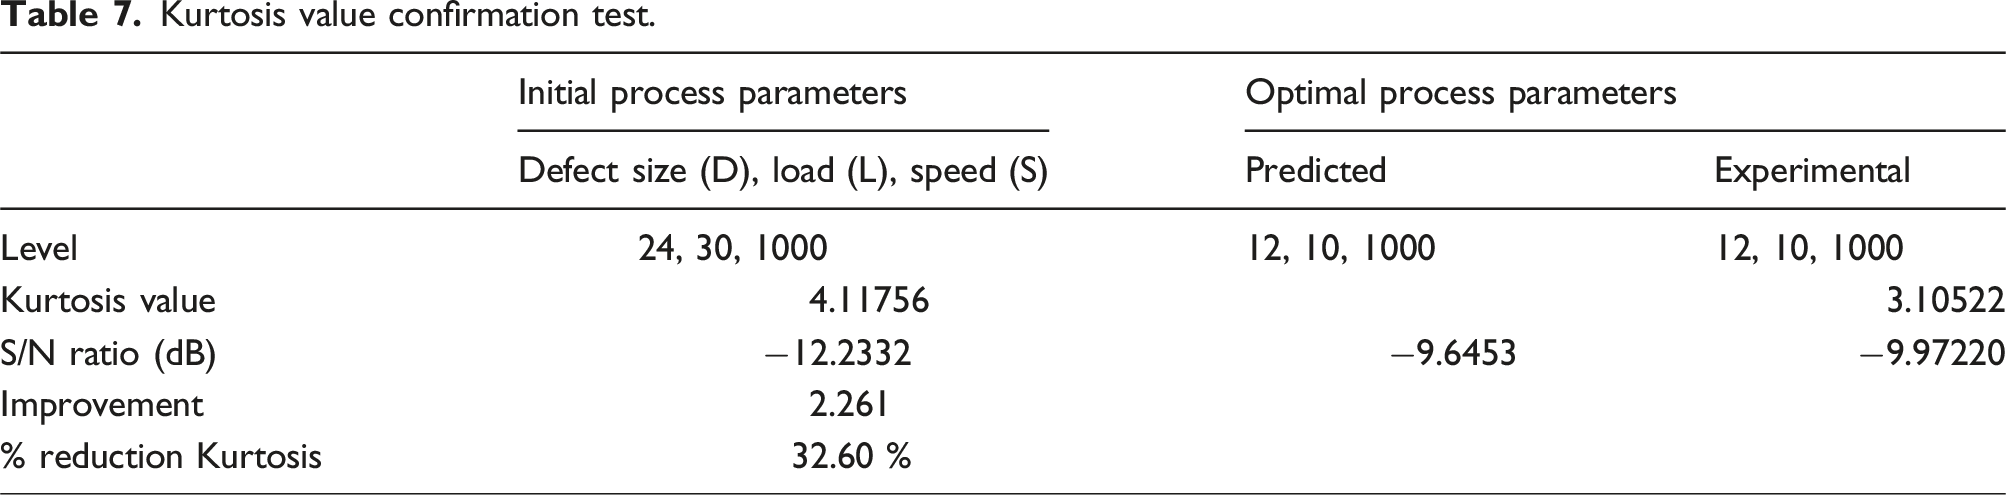
Kurtosis value confirmation test.
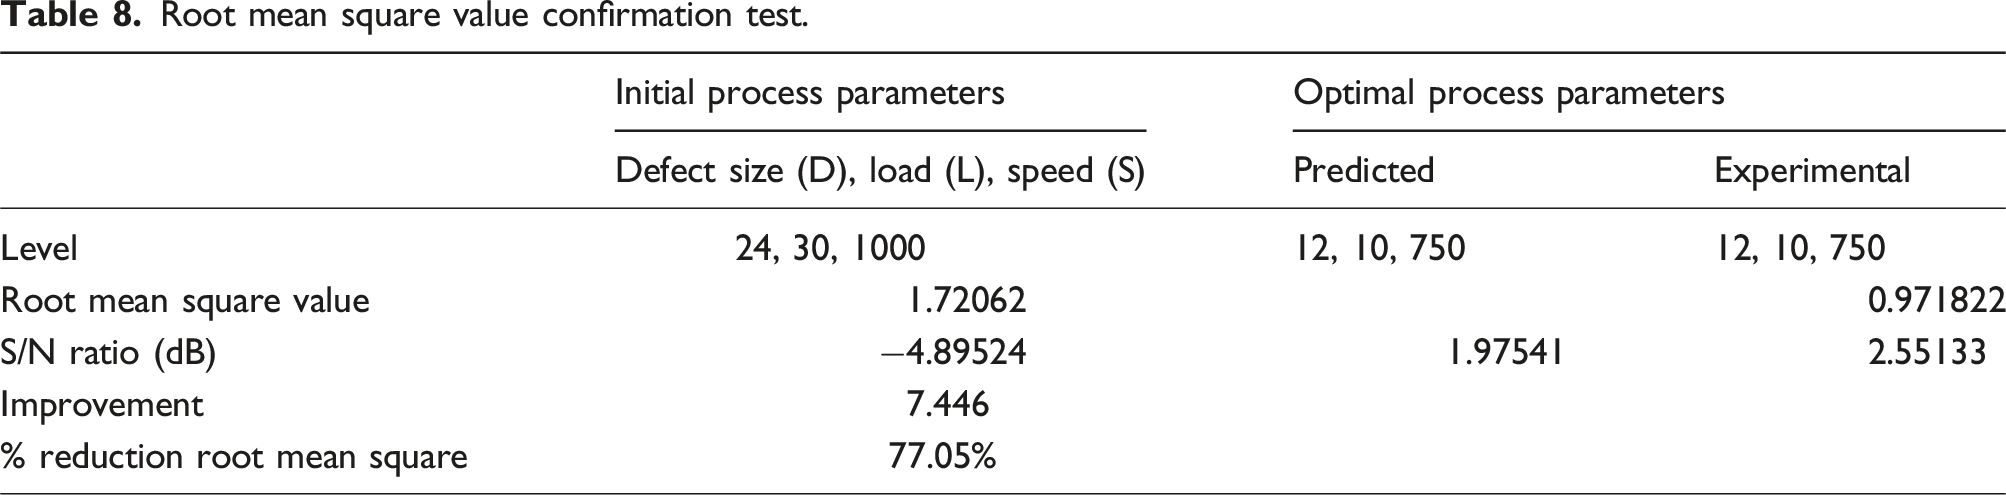
Root mean square value confirmation test.
Conclusions
In the current study, an examination for various input parameters for gearbox fault, on response parameters has been done. The Taguchi L9 (OA) has been used to design the experiments. Various input parameters such as pitting defect size, load and speed were chosen to evaluate the dynamic response of gearbox. Different pitting level is simulated by using EDM to control the size of defect. To replicate the typical engineering conditions, an experimental test rig set was built with varying load and velocity. Vibration signals were extracted using piezoelectric accelerometers and kurtosis and Root mean square response were measured. • Using Minitab (2017) and Analysis of variance, statistical analysis has shown an important approach to evaluating the different input parameters that contribute to gearbox faults. • The optimum performance parameters for attaining the low kurtosis value was found as defect size 12 mm, load 10N and speed 1000 rpm. The kurtosis value rises in response to the increase in applied load and defect size. It was observed that 32.60 % reduction of kurtosis was found at the optimal parameters. • The parameters were defect size 12 mm, load 10 N and speed 750 rpm using Taguchi as the optimal condition to obtain low Root mean square response value. The factors that affect the value of the Root mean square are the size of the defect, load and speed, but the effect of the size of the defect is more important. The optimal performance calculated by Taguchi decreased the Root mean square value by 77.05%. • The results of Analysis of variance show that kurtosis and Root mean square response significantly affected the size of the pitting defect, with a influence of 81.87% and 88.146%, correspondingly, followed by the load and speed applied. • There was a perceived proximal decision between the expected and experimental response based on the established regression models for kurtosis and Root mean square. In order to monitor the gearbox failure diagnostics, the created regression models might be used to appropriately acquire various input parameters.
Footnotes
Acknowledgments
We are grateful to the Director MNNIT Allahabad, Prayagraj, Uttar Pradesh, India for providing necessary laboratory facilities. The Ministry of Education, Govt. of India, New Delhi, India, is acknowledged for providing financial assistance to Sheo Kumar throughout this tenure.
Author contributions
P.K.A.: Designed the study and guided to perform experiments; S.K.: Performed the experiments analysed the results, Writing- original draft preparation; all authors read and commented on the manuscript.
Declaration of conflicting interests
The author(s) declared no potential conflicts of interest with respect to the research, authorship, and/or publication of this article.
Funding
The author(s) received no financial support for the research, authorship, and/or publication of this article.