
Abstract
The environmental Kuznets curve (EKC) is a widely tested hypothesis in the environmental economics literature. It explains the dynamics between economic growth and environmental degradation. This study conducts a bibliometric analysis for the past three decades (1994–2021) that contributes to the intellectual structure and knowledge progress of the EKC hypothesis using descriptive analysis and networking analysis. The descriptive analysis comprises publication trends, language, publishers, Web of Science category and research areas, and citation analysis. Meanwhile, networking analysis includes keyword co-occurrence analysis, co-authorship analysis and co-citation analysis. The findings of the descriptive analysis reveal that the number of publications in the EKC hypothesis has gradually increased over the years. The most productive publishers are Elsevier and Springer Nature. Researchers from China and Turkey tend to be the most prolific authors, with the highest number of citations, co-authorships and co-citations. According to the network analysis, the main keywords appearing in the EKC studies are economic growth, CO2 emissions, energy consumption, China, renewable energy and financial development, which is also supported by the most frequently used keyword plus and its clusters. Based on our findings, we have proposed several policy recommendations from the keyword analysis that could foster economic development and improve environmental quality simultaneously. From the emerging trends of EKC, new directions for future research are also proposed.
Keywords
Introduction
Over the past three decades, the relationship between economic growth and environmental degradation has been widely investigated by researchers around the world. The inverted U-shaped linkage between income and pollution is better known as the environmental Kuznets curve (EKC) hypothesis. The original Kuznets curve was proposed by Simon Smith Kuznets—a Russian-American researcher who revealed an inverted U-shaped nexus between income and income inequality.1,a The inverted U-shaped curve was named after the researcher as the Kuznets curve. b Then, “Kuznets curve” was adopted by researchers in the field of environmental economics to portray the inverted U-shaped connectivity between economic growth and environmental pollution. 2 Since early 1990s, researchers have switched their research attention to the income-pollution nexus as the data for various pollutants became available. The linkage between economic growth and environmental pollution was first examined by Grossman and Krueger. 3 Among the early researchers, Panayotou 4 was the pioneer who called the income-pollution relation as the EKC. Meanwhile, the 5 World Development Report has helped to popularize the EKC hypothesis 6 The report highlighted the fact that an inverted U-shaped association exists between economic growth and various types of pollutants such as sulphur oxides and nitric oxides. 5
Since the seminal work of Grossman and Krueger, 3 numerous studies have been conducted in finding the impact of economic growth on environmental quality. A vast majority of the EKC studies intend to test the validity of an inverted U-shaped correlation between real gross domestic product (GDP) and pollution. Indeed, a great number of the existing studies have supported the existence of the EKC hypothesis7–11 while others refuted the allegation of an inverted U-shaped linkage between the variables. To be specific, researchers have revealed a monotonically increasing,12–16 monotonically decreasing,17–19 U-shaped20–22 or even an N-shaped23–25 connection between economic growth and environmental degradation. In addition, EKC researchers have been using various types of environmental indicators in examining the growth-pollution nexus. According to Sarkodie and Strezov, 26 the most commonly used environmental indicators include ecological indicators,27,28 atmospheric indicators,29–31 land indicators,32,33 ocean and biodiversity indicators34–37 as well as freshwater indicators38,39
The EKC hypothesis suggests that environmental pollution worsens at the initial stage of economic development. As economic growth reaches a certain threshold level, environmental quality tends to improve due to increased environmental awareness. Several reasons can be put forth to explain the inverted U-shaped relationship between economic growth and environmental pollution. First, the EKC hypothesis can be justified by scale, composition and technological effects.40,41 At the beginning of economic development, composition and technological effects are not apparent. Thus, the association between economic growth and pollution is solely dependent on the scale effect. Based on the scale effect, environmental quality tends to deteriorate as the size of the economy increases with more output produced at the initial stage of economic development. As the economy continues to grow to a certain extent, composition and technological effects emerge, leading to an improvement in environmental quality. The composition effect is caused by the structural change that occurs in the economy as national income increases. There would be a switch from industrialization to services and knowledge-based industries, resulting in less pollution to the environment. As a nation becomes richer, it would be possible for the country to adopt newer and greener technologies that can lead to reduced environmental pollution. This is coined as the technological effect. 42 According to Vukina, Beghin and Solakoglu, 43 composition and technological effects tend to outweigh the scale effect with a sufficiently high level of income. Second, Focacci 17 and World Bank 5 suggest that an inverted U-shaped EKC can be justified by a positive income elasticity of demand for a clean environment. Treating environmental quality as a luxury product, people tend to demand better air quality as their income reaches a certain amount. At the initial stage of economic development, however, people are reluctant to give up consumption and allocate more resources for environmental protection. As a result, there is a deterioration in environmental quality at the early phase of economic growth. Third, the inverted U-shaped nexus between economic growth and environmental pollution can be supported by the fact that environmental quality is indeed a productive asset. According to Dinda, 2 sustainability in different types of capital (including physical capital, human capital and environmental/natural capital) are crucial to ensure continuous economic growth. In needy nations, for example, too many resources are utilized in the production of goods and services that harm the environment. In the meantime, inadequate capital goods are used to carry out environmental protection activities in these countries. This phenomenon explains the rationale behind the inverted U-shaped EKC. At the initial stage of an economic upswing, countries tend to spend less on environmental abatement activities, thus leading to a rise in environmental pollution. As national income increases, their capability to invest in environmental mitigation efforts enhances, causing an improvement in environmental quality.
Undeniably, the important implications of EKC studies in policy formulation have inspired scholars to engage in an abundance of such research. In particular, the findings of the EKC studies are able to provide crucial policy suggestions to policymakers in implementing relevant economic and environmental strategies. For example, if the relationship between economic growth and environmental degradation were revealed to be inverted U-shaped, it may imply that real GDP can be the cause and remedy for environmental problems. In other words, the inverted U-shaped EKC also indicates that ecological pollution in a country could be solved “automatically” due to economic prosperity without policy interventions from the government. Over the long run, countries would be able to benefit from both superb economic development and clean environment.
Despite plentiful of past EKC studies in the literature, critical reviews on the earlier papers remain scarce. To our best knowledge, there are merely two recent review papers namely, Pincheira and Zuniga 44 and Sarkodie and Strezov 26 which have analysed past empirical studies within the EKC framework. Different from Pincheira and Zuniga 44 and Sarkodie and Strezov, 26 our study aims to explore the pool of past EKC studies in a more comprehensive and detailed manner. Similar to Sarkodie and Strezov, 26 we also conducted the systematic review using bibliometric analysis. However, our study extends and improves the EKC review by incorporating the network analysis, which is absent from Sarkodie and Strezov 26 's work. The network analysis comprises keyword co-occurrence analysis, co-authorship analysis and co-citation analysis. The main advantage of including network analysis in our study is that it provides a clear picture of past studies pertaining to issues such as author keywords, authors’ organizations and countries and cited authors. In addition, another main contribution of our paper is that we consider the latest EKC publications, i.e. up to July 2021. Looking at the literature, not a single review paper has included the most recent EKC publications. For instance, Pincheira and Zuniga 44 took into account EKC papers published from the early 1990s to 2017. Thus, our paper is able to provide the latest view on the trend and development of EKC studies.
The next section explains the research methodology adopted for the study. It is then followed by a thorough discussion on the research findings, which covers both the descriptive analysis and network analysis. Section Conclusion concludes the paper by incorporating mainly the policy suggestions and directions for future research.
Research methodology
Bibliometric search
The articles included in this bibliometric study were extracted in July 2021 by employing Web of Science (WoS) Core Collection database. WoS is a Thomson Reuters subsidiary that allows bibliometricians to compile large amount of data and provide statistics based on bibliometric indicators. 45 Following rigorous selection procedures and objective evaluation processes, WoS comprises the most authoritative and prominent academic publications in numerous categories. 46
The keywords of Environmental Kuznet Curve or Kuznet Environmental Curve are used in the search to ensure that sufficient and relevant articles are included. During the literature search, the recommended search terms are combined with “OR” logical operations and asterisk marks to extract the search results. The search for articles spans the years 1994 to July 2021, and it covers all studies on the EKC. Next, the document types are filtered to include only journal articles. Journal articles are supposed to be reviewed based on innovation and subjected to extensive peer review of the best quality. 47 The WoS Core Collection database yielded a total of 3918 articles.
Bibliometric analysis
The study examines the EKC hypothesis using bibliometric analysis. A series of bibliometric analysis is conducted on 3918 articles from the bibliometric search in WoS Core Collection database based on the analysis strategy (see Figure 1). This bibliometric analysis incorporates both descriptive and networking analysis. The descriptive analysis includes publication trends, language, publishers, WoS category and research areas, and citation analysis. Network analysis is carried out to learn more about the authors’ research and collaboration trends based on keyword co-occurrence analysis (author keywords and keywords plus), co-authorship analysis (authors, organizations and countries) and co-citation analysis (cited authors and cited sources). To support the metadata file provided by WoS, the VOS viewer 1.6.16 software is utilized for bibliometric analysis. The software is famous for its animated visualization, ability to load and export data from different resources and strong graphical user interface to engage on science mapping analysis for bibliometrics study. 48
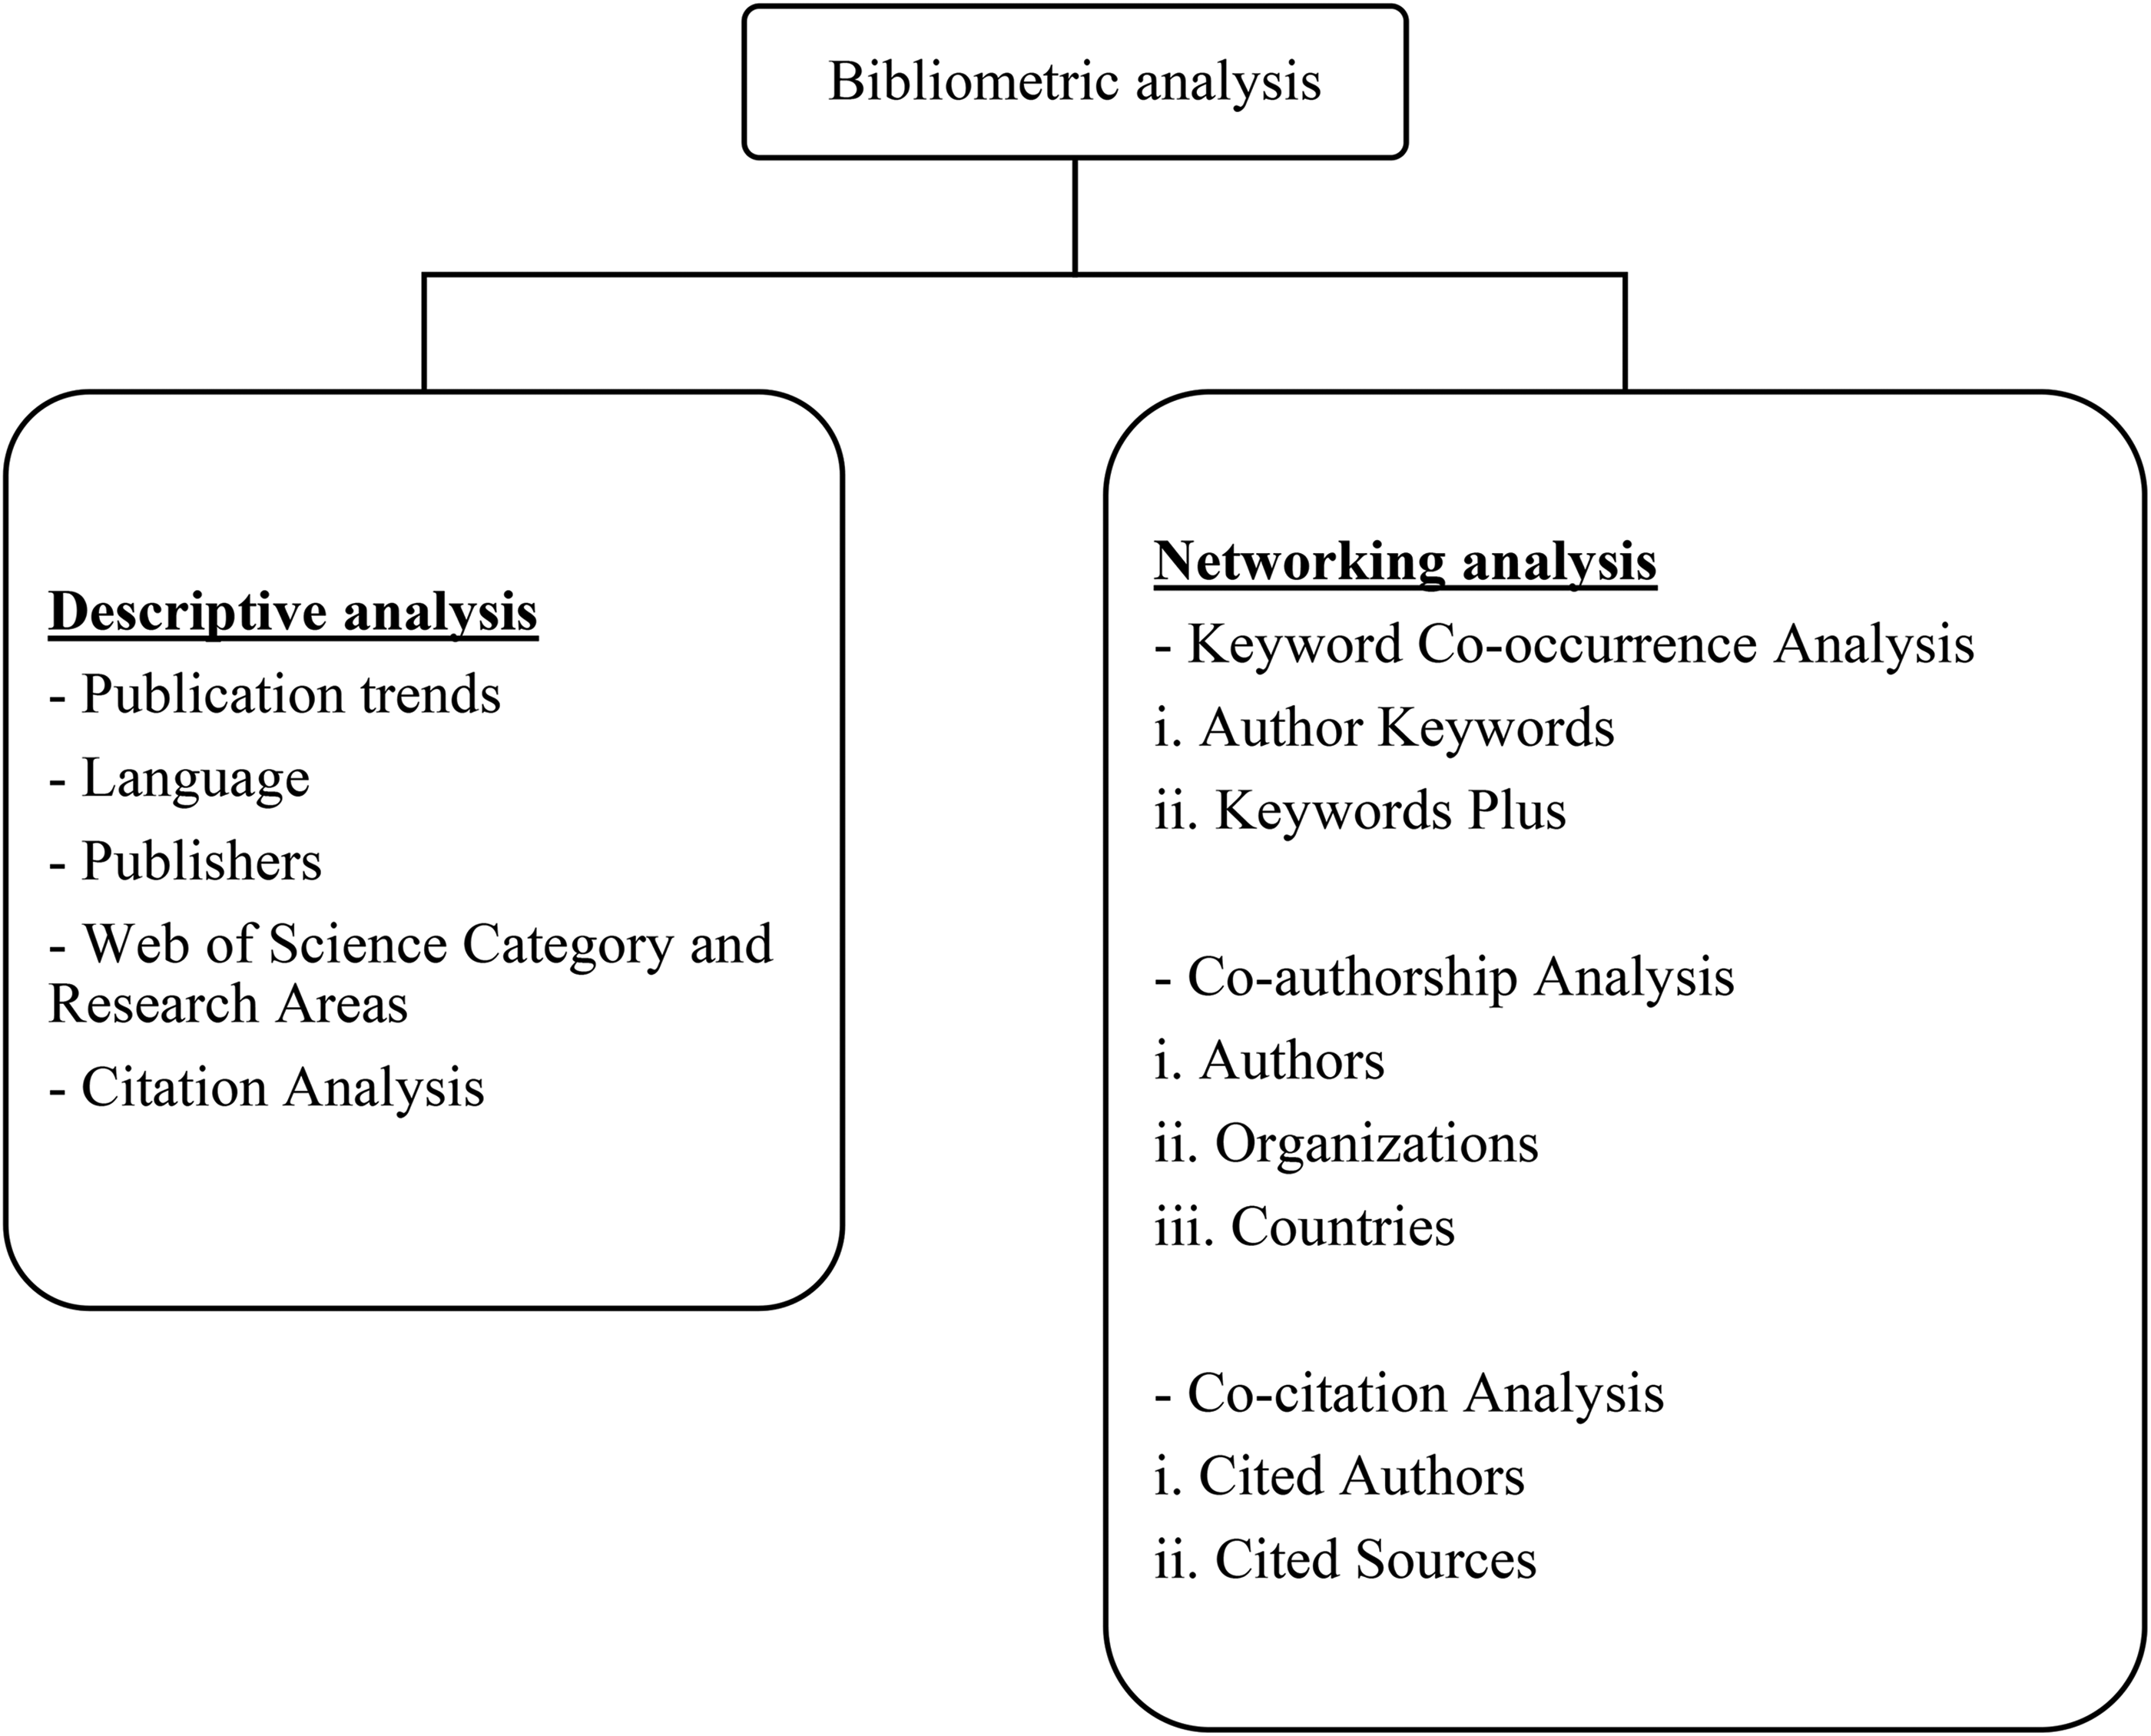
Analysis strategy for bibliometrics analysis.
Results and discussion
The results of this study are presented and discussed in this section. Following the bibliometric analysis in the previous section, we separate our results and discussion into two main subsections, namely descriptive and network analysis.
Descriptive analysis
The descriptive analysis in the following subsections consists of an in-depth exploration for the publication trend, languages used, publishers, WoS category and research areas, as well as a detailed citation breakdown for the EKC literature.
Publication trend
Figure 2 shows both publication and citation trend since the emergence of the EKC hypothesis in 1994. Since then, the EKC hypothesis has been gaining attention and popularity among researchers. This led to a gradual increase in the number of publication in the EKC field and eventually top the chart in 2020 with 836 EKC articles published in a year. The number of citations of EKC articles increased significantly with the number of publication. However, the number of citations peaks the graph in 2018 with 31,863 citations and then started to experience a decreasing trend. In addition, it is worth noting that the number of citations rose 280% (6520-24.808) from 2016 to 2017 before it started to decline in the overall trend.
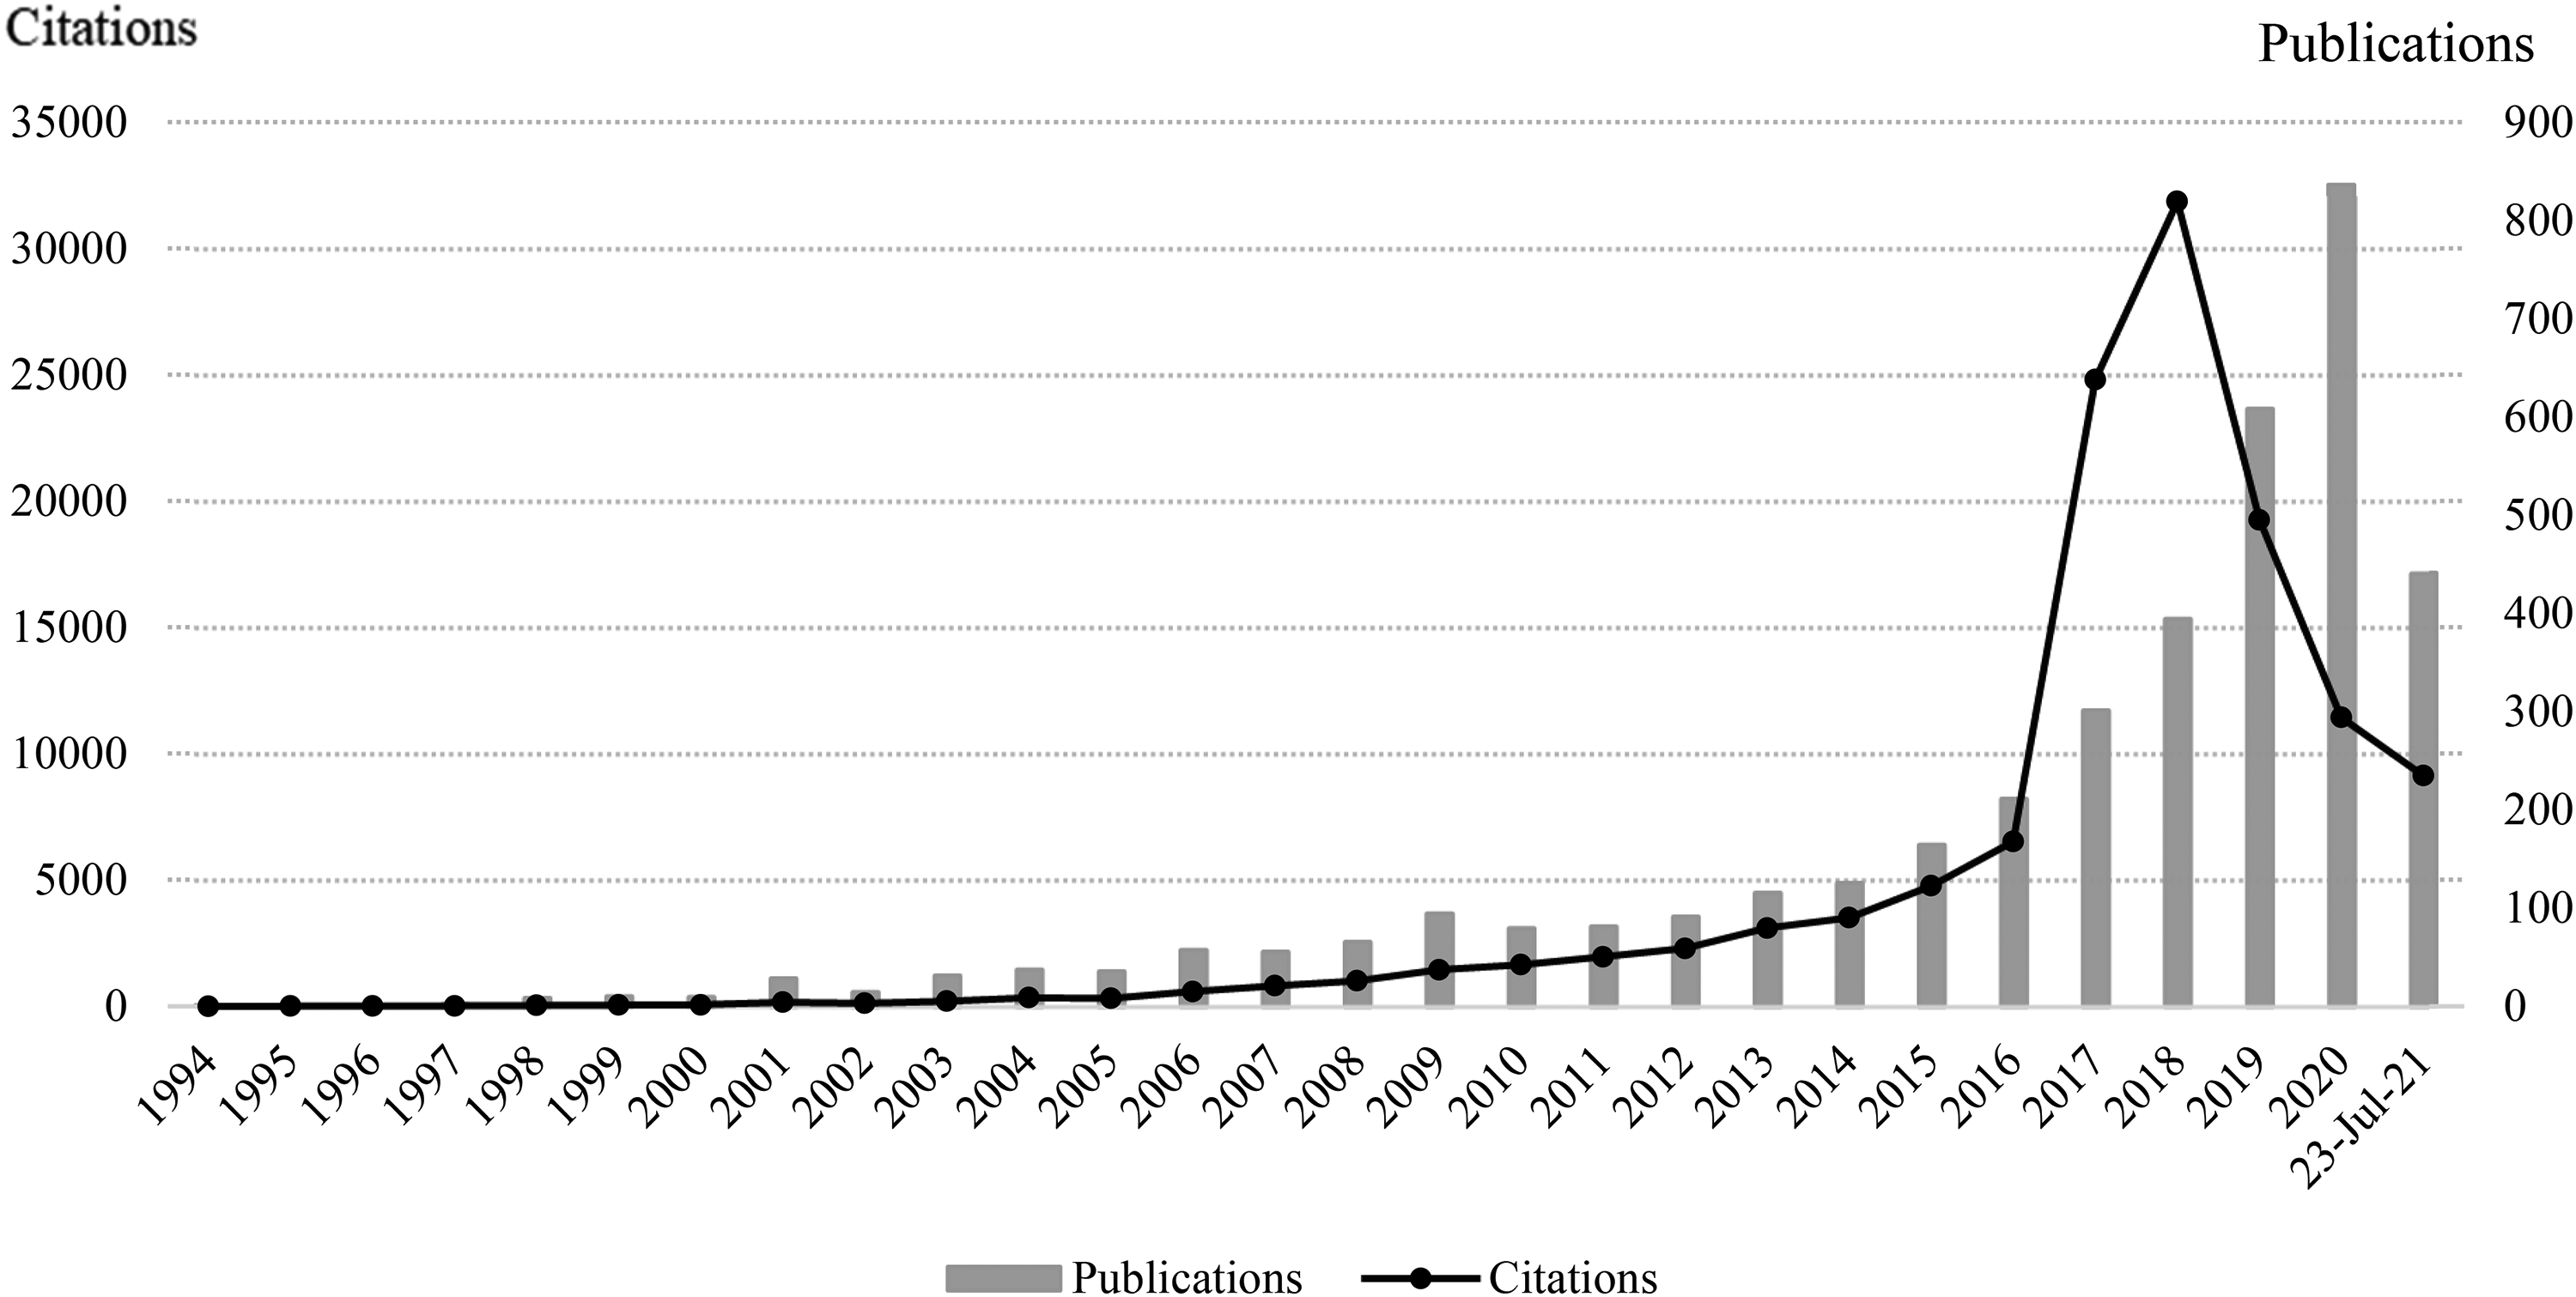
Publication trend, 1994–2021.
Language
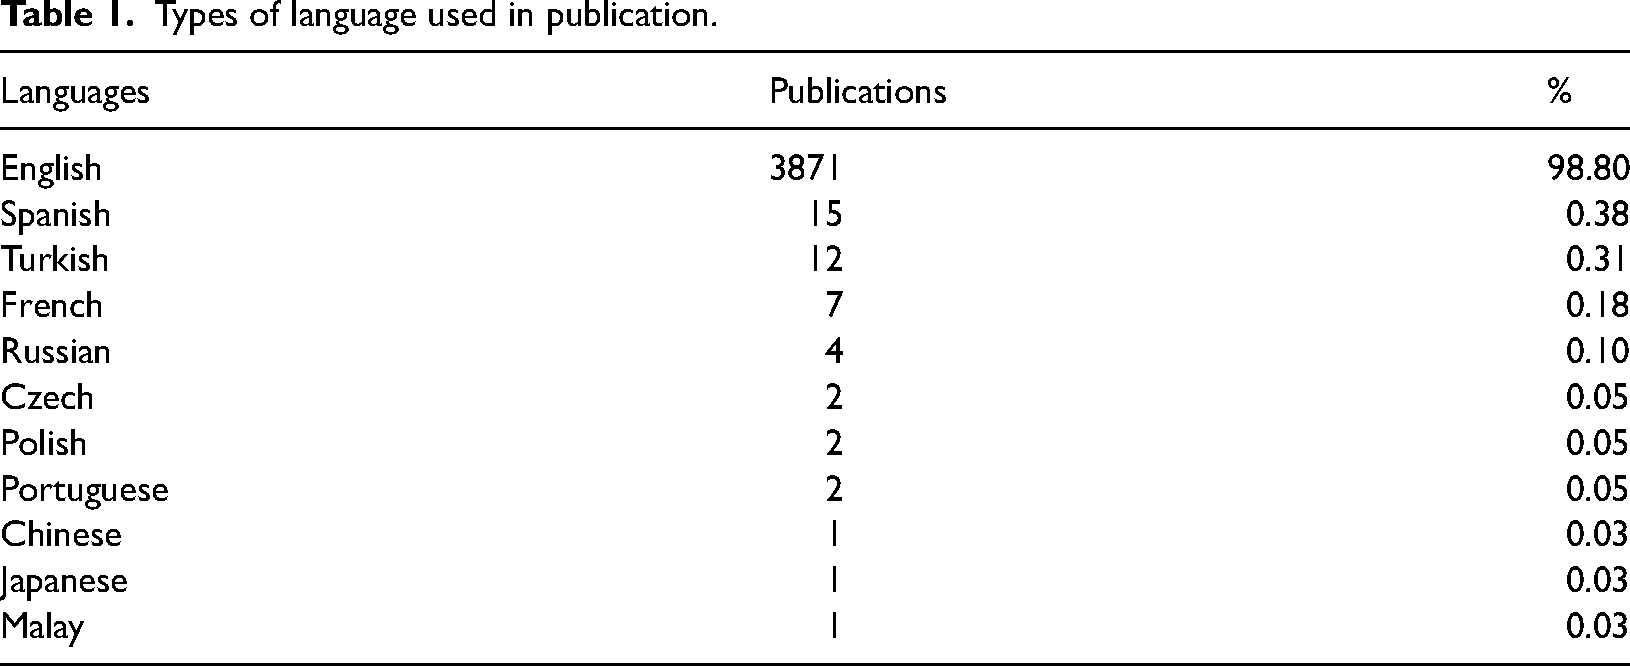
The language used in the EKC publication is mainly English. Table 1 reveals that 3871 articles or 98.8% of the EKC articles are written in English. Other languages include Spanish (15 or 0.38%), Turkish (12 or 0.31%), French (7 or 0.18%), etc. The least used languages in writing and publishing an EKC article are Chinese, Japanese and Malay, each with one article or 0.03%.
Types of language used in publication.
Publishers
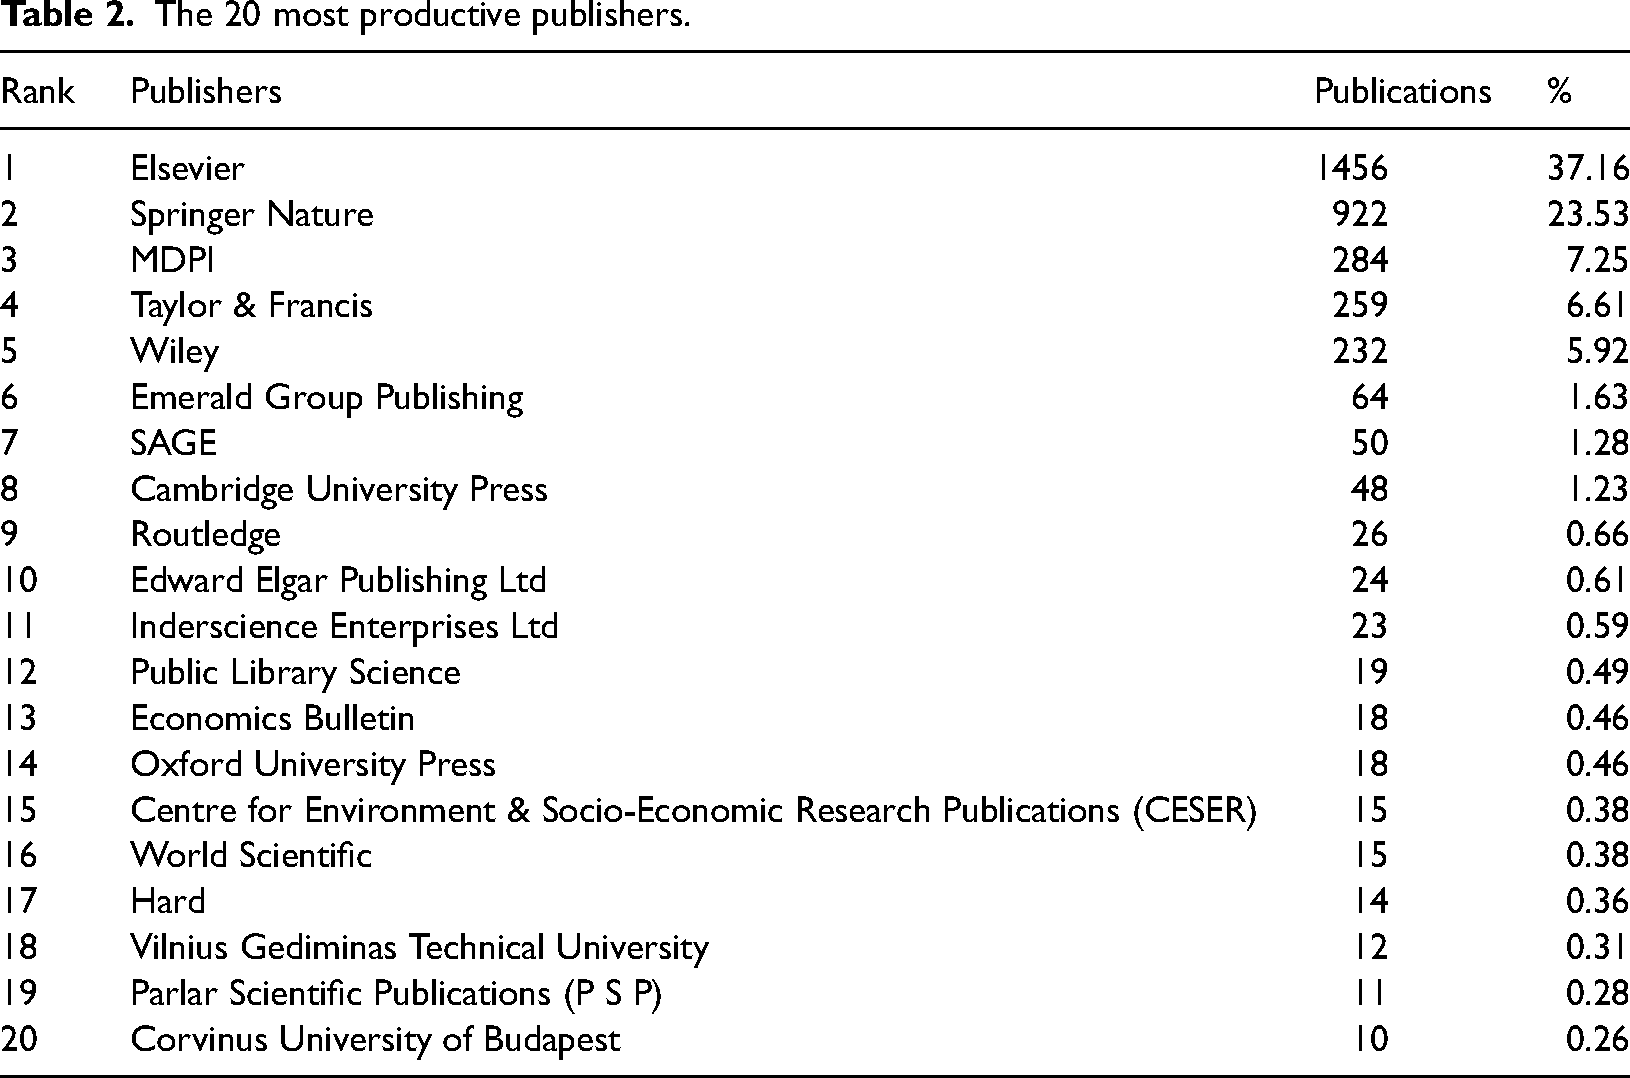
From Table 2, it is noticed that Elsevier appeared to be the most productive publisher for EKC studies. Elsevier tops the ranking table with 1456 EKC publications or 37.16%. Springer Nature is after Elsevier with 922 publications or 23.53%. It is not a surprise that the two publishers appear on the top of the list as they both have more than 100 years of publishing experience (since 1880s) c . Other well-known publishers include MDPI, Taylor & Francis, Wiley, Emerald, SAGE, Routledge, etc.
The 20 most productive publishers.
WoS category and research areas
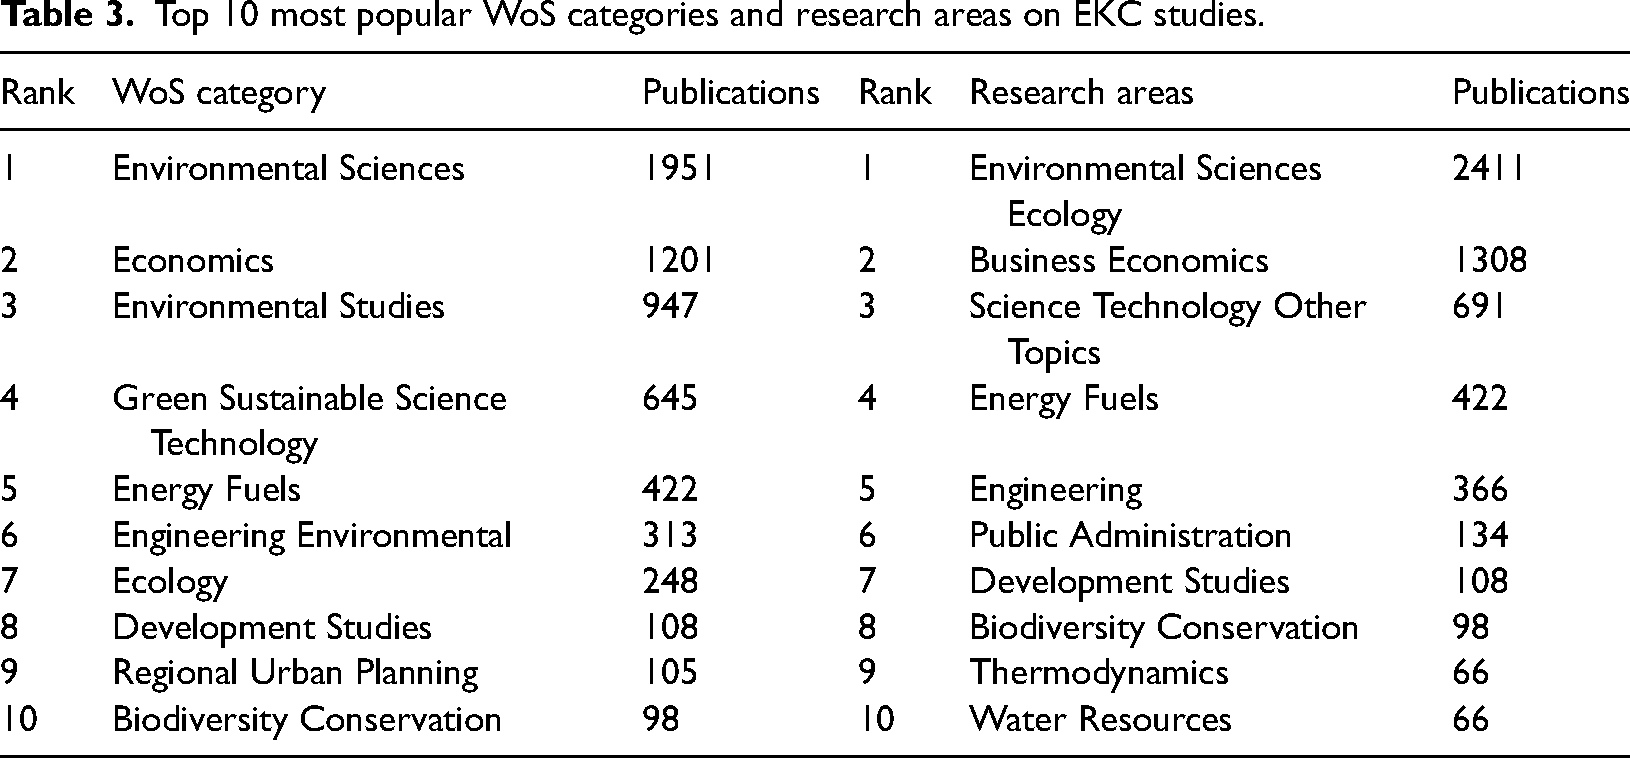
Table 3 presents the top 10 most popular WoS categories and research areas on EKC studies. Most of the EKC studies fall into the category of “Environmental Sciences” with a total of 1951 publications. Following this is the category of “Economics” and “Environmental Studies” each with a total of 1201 and 947 publications. In terms of research area, most of the EKC studies are associated with the area in “Environmental Sciences Ecology” with 2411 publications up to date. Next in the ranking is the area in “Business Economics” with 1308 publications followed by “Science Technology Other Topics” with 691 published works. The above categories and research areas reveal that the EKC hypothesis is a blend of environmental and economic issues. As it is believed that there is a tradeoff between both environmental and economic issues, the argument of the tradeoff could be the reason behind its popularity and publication value.
Top 10 most popular WoS categories and research areas on EKC studies.
Citation analysis
Table 4 indicates the top 10 most influential papers on EKC studies. We perform the analysis by selecting a threshold of minimum of 300 citations for a document. As a result, 51 documents were identified. The paper that tops the ranking in Table 4 is the work by Stern, 49 entitled “The rise and fall of the Environmental Kuznets Curve” published in World Development. In the paper, the author pointed out possible explanations for the turning point in the EKC hypothesis as well as potential econometric problems in the framework. This paper receives significant attention in the field by having 1428 citations to date with an average 79 citations per year. The paper that ranks second in Table 4 is the paper by Selden and Song 50 entitled “Environmental-quality and development—Is there a Kuznets curve for air-pollution emissions?” published in Journal of Environmental Economics and Management. This paper is considered as one of the pioneering works in the EKC works back in the 90 s. Up to date, the paper has a total of 1188 citations and an average of 42 citations per year.
The 10 most influential papers on EKC studies.
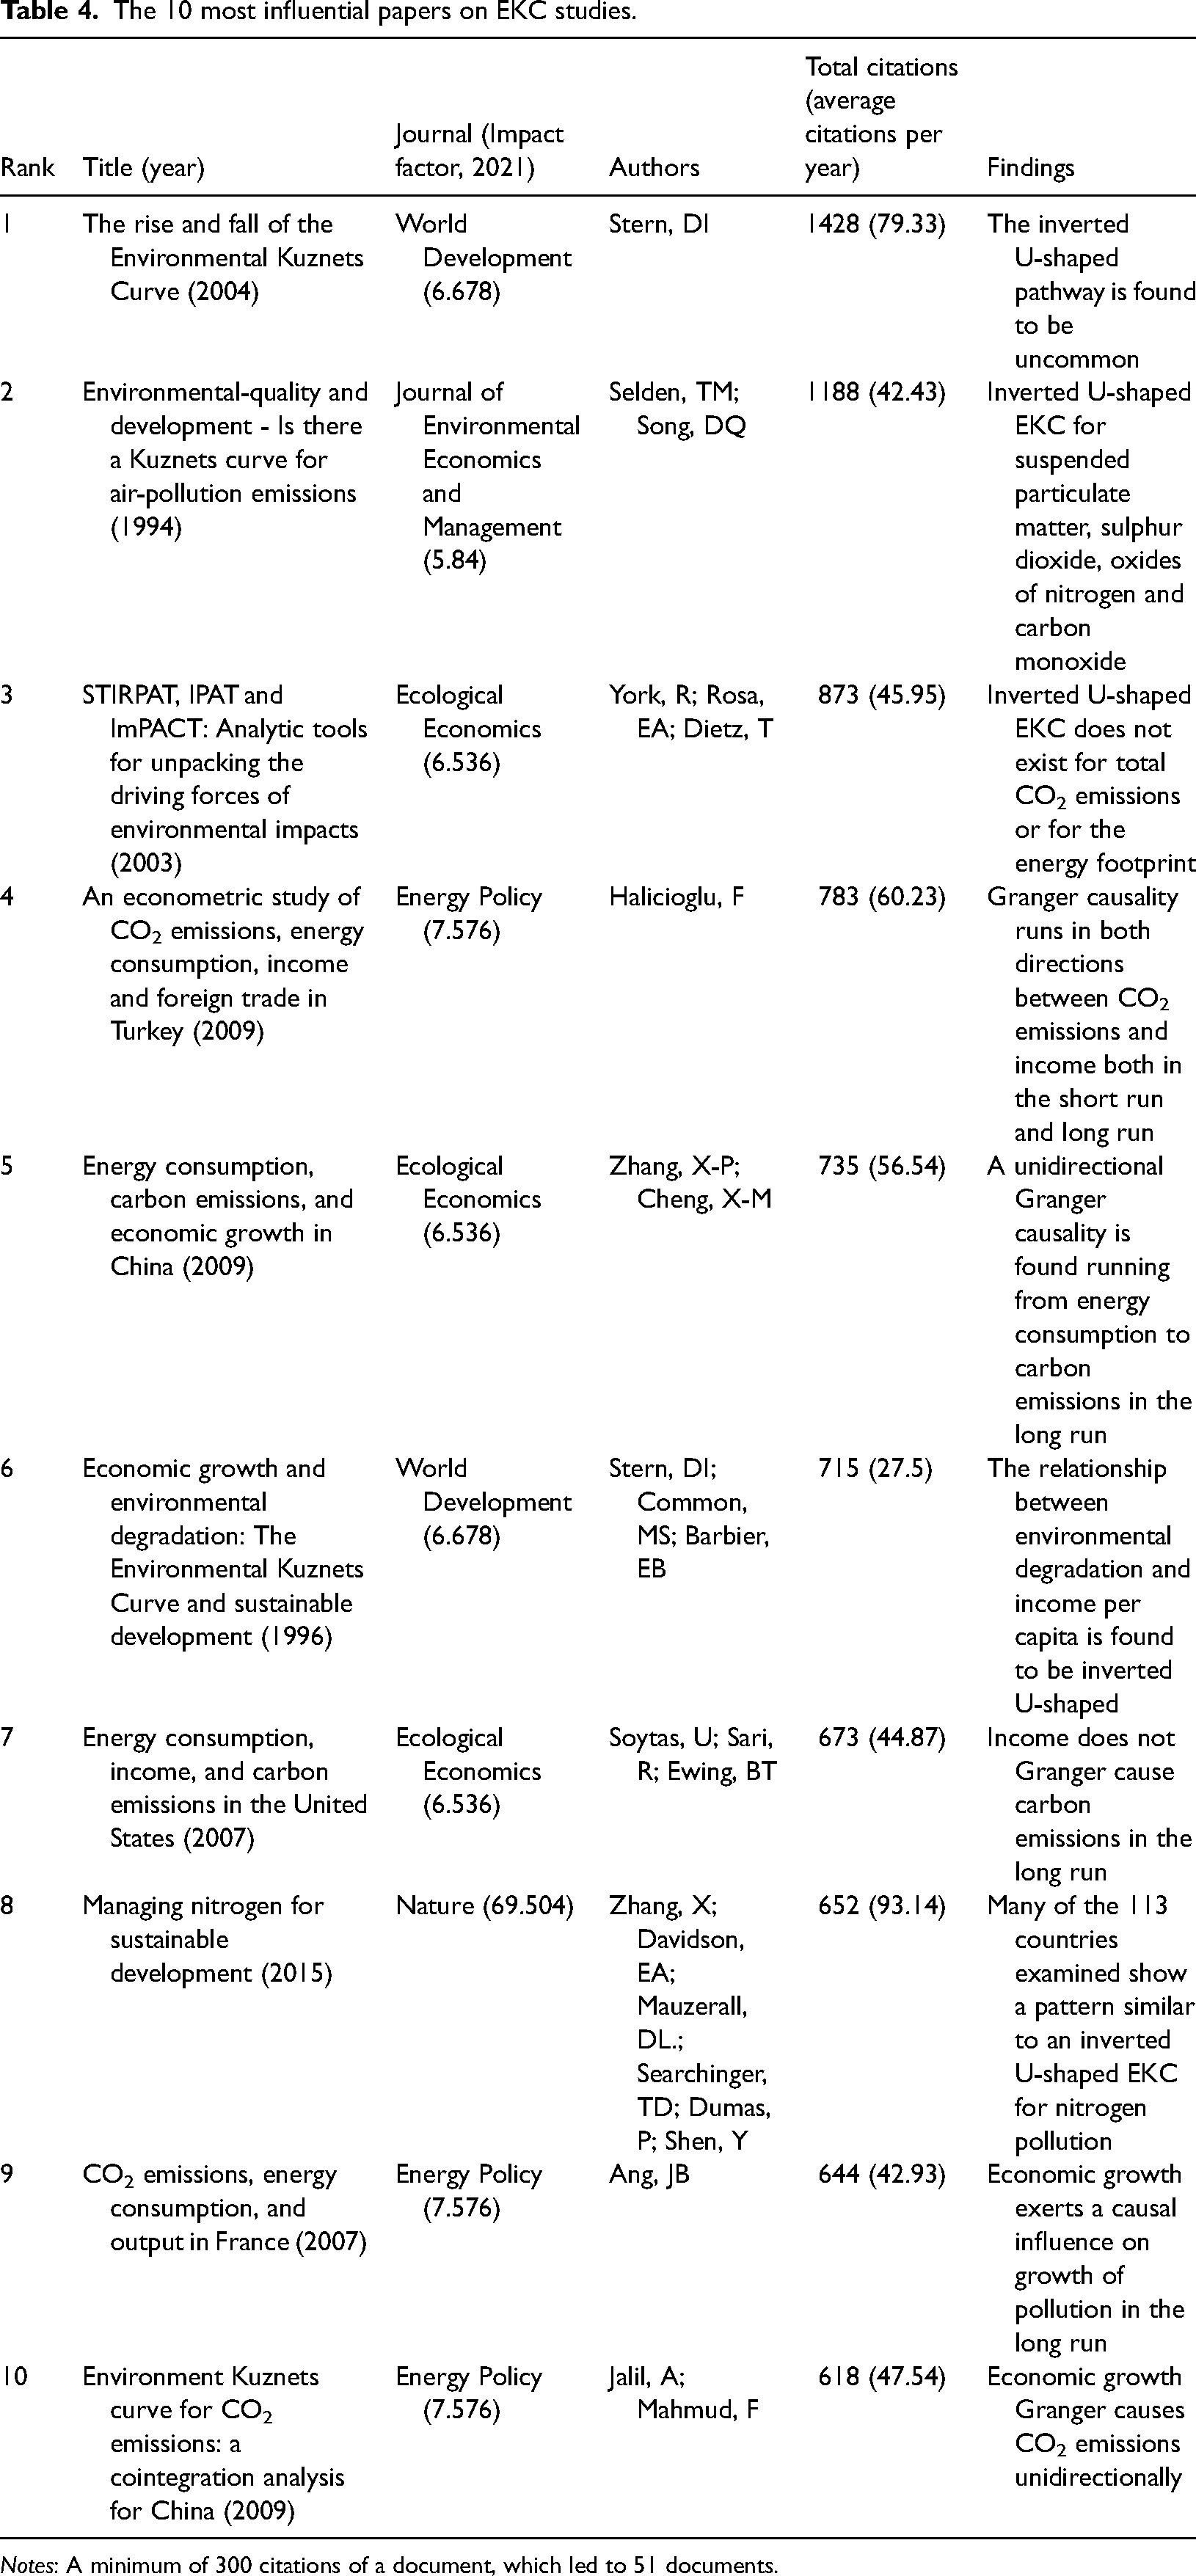
Notes: A minimum of 300 citations of a document, which led to 51 documents.
Another interesting finding that could be noticed from Table 4 is the paper that ranked 8th. It is the most recent paper in the list written by Zhang et al. 51 entitled “Managing nitrogen for sustainable development” published in Nature. Though the paper receives 652 citations to date, the average citations per year outperform other papers in the table with 93 citations per year. It could be due to the fact that researchers are moving the direction of analysing different pollutants other than carbon emission and air pollution. This could shed some lights on the recommendation or direction for future research.
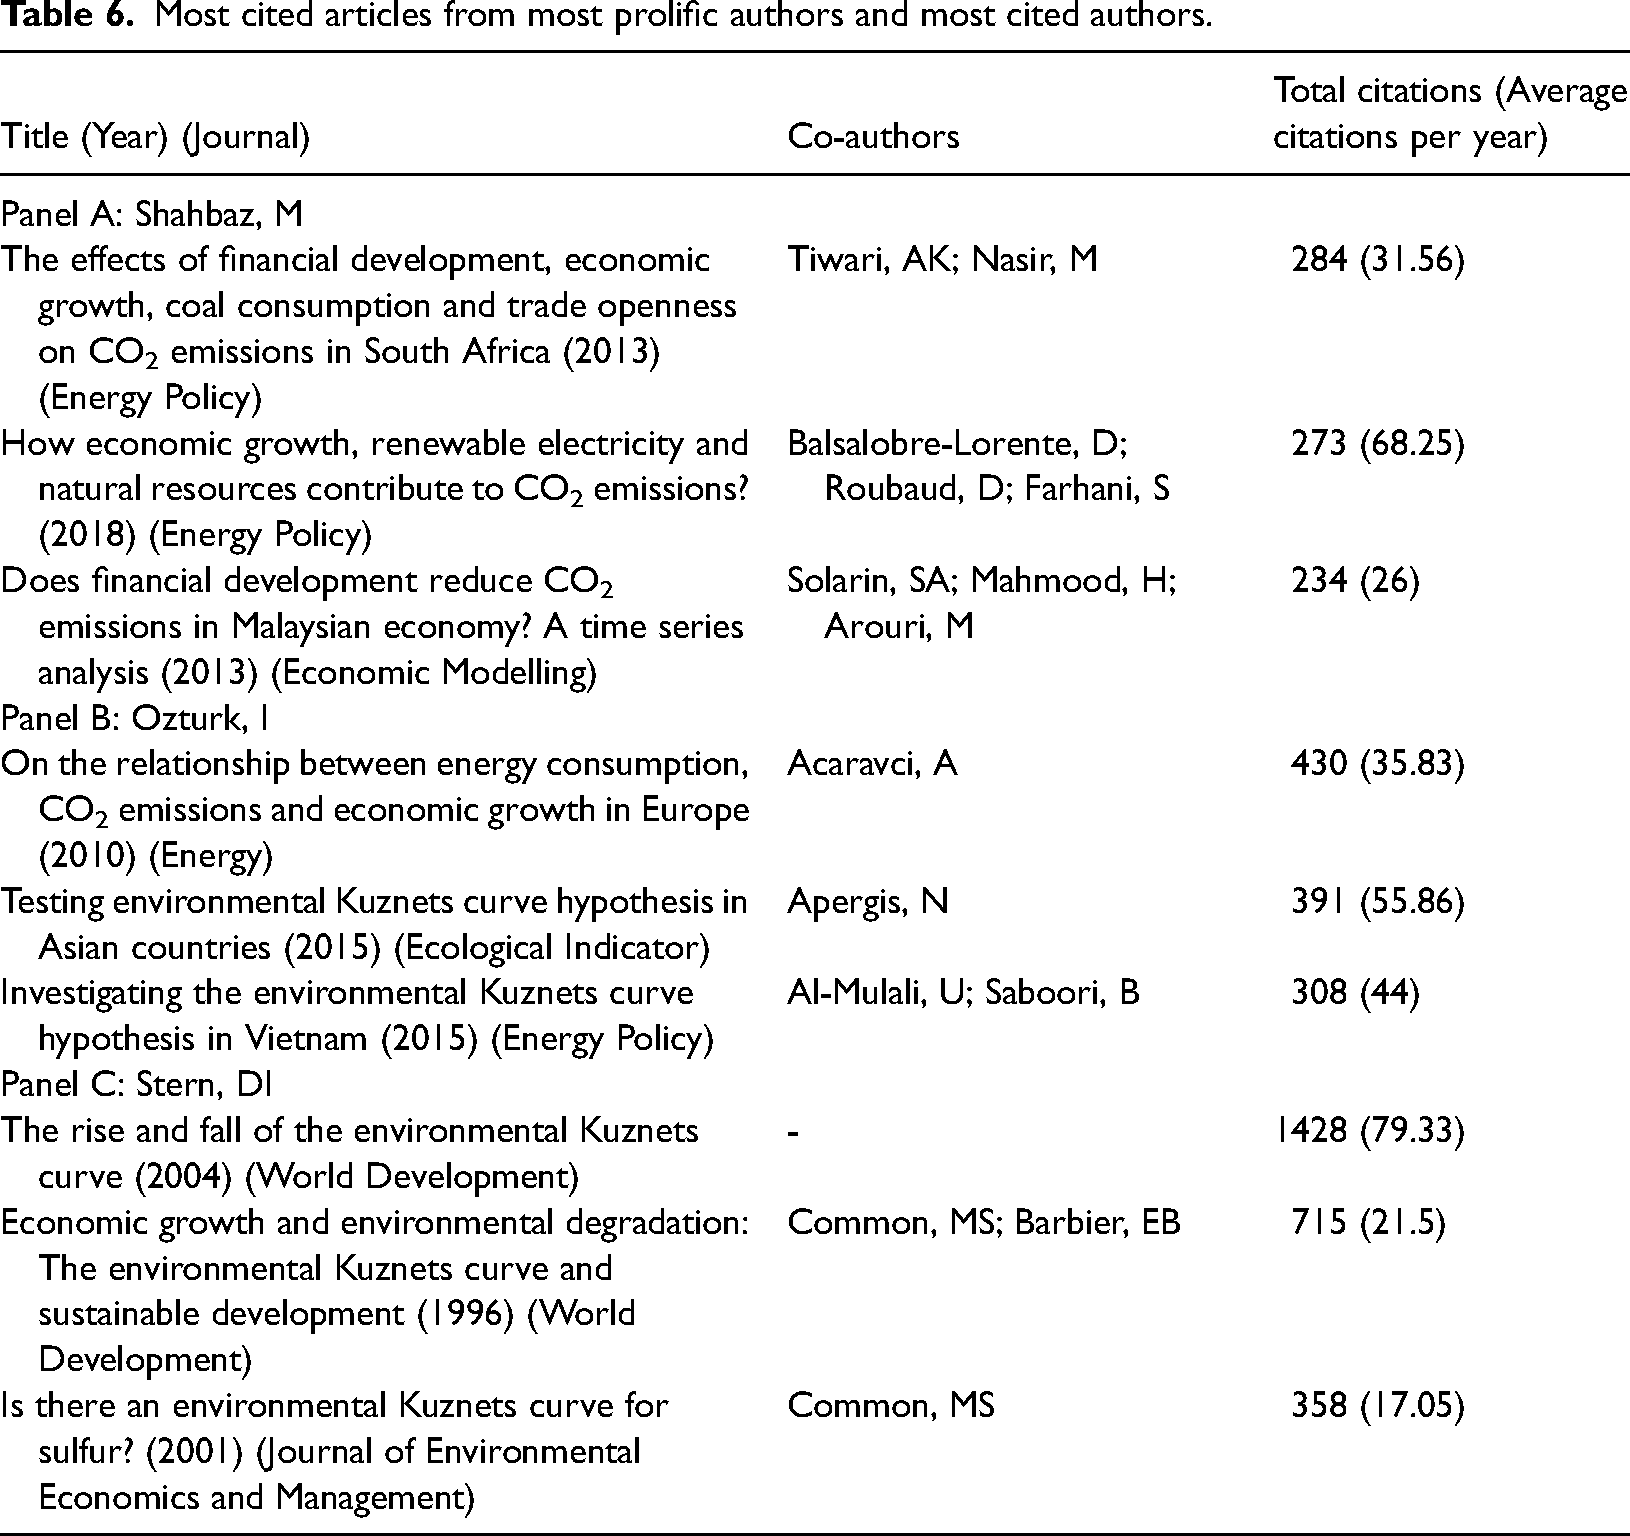
Next, Table 5 tabulates the top 20 most prolific and most cited authors in EKC studies. The criteria we used to perform the analysis is a minimum of five works of an author and 50 citations of an author, which gave us 254 authors in total. For both productivity and citations, Muhammad Shahbaz and Ilhan Ozturk appear on the top of the list, with 72 and 51 publications, and 4690 and 4337 citations, respectively. A narrow breakdown of the most cited articles from the authors are summarized in Table 6. The most cited EKC article by Muhammad Shahbaz is his work published in 2013 in Energy Policy entitled “The effects of financial development, economic growth, coal consumption and trade openness on CO2 emissions in South Africa” with a total citation of 284 and an average of 32 citations per year. On the other hand, Ilhan Ozturk's “On the relationship between energy consumption, CO2 emissions and economic growth in Europe” published in 2010 in Energy receives a total of 430 citations with an average of 36 citations per year. Overall, it is plausible to conclude that higher number of publication has a higher possibility in having more citations.
The 20 most prolific authors and most cited authors.
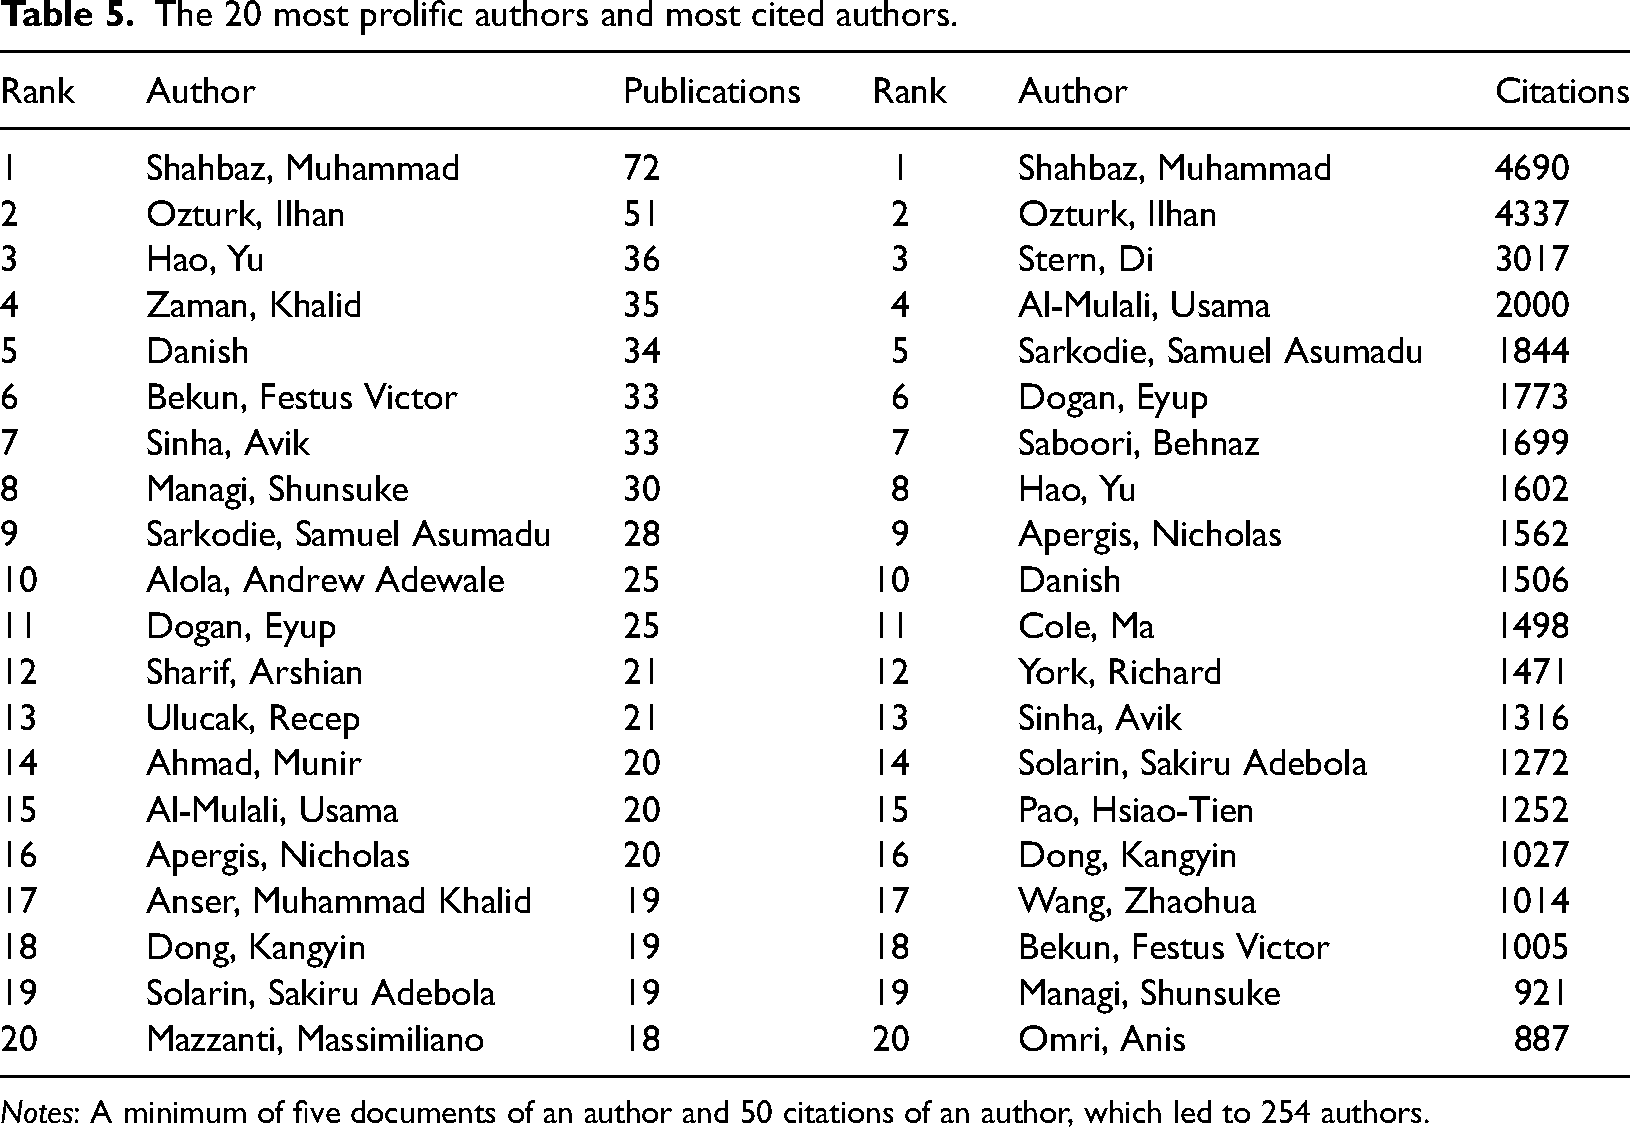
Notes: A minimum of five documents of an author and 50 citations of an author, which led to 254 authors.
Most cited articles from most prolific authors and most cited authors.
In terms of EKC publication in journals, Table 7 summarizes top 20 journals on EKC studies from both the number of publications and citations point of view. A minimum of 20 works of a source and 50 citations of a source are adopted in the analysis process, which results in 26 sources. The journal that has the highest number of EKC publication is Environmental Science and Pollution Research (559 publications), followed by Journal of Cleaner Production (224 publications), and Ecological Economics (172 publications). However, Ecological Economics has the highest number of citations from EKC works (15,652 citations), follows by Energy Policy (15,146 citations) and Environmental Science and Pollution Research (8949 citations). As mentioned in Section WoS category and research areas, the EKC hypothesis is a blend of environmental and economic issues; hence, it is considered as a multidisciplinary research topic and is widely accepted for publication in both Social Science Citation Index and Science Citation Index journals.
Top 20 journals on EKC by publication and by citation.
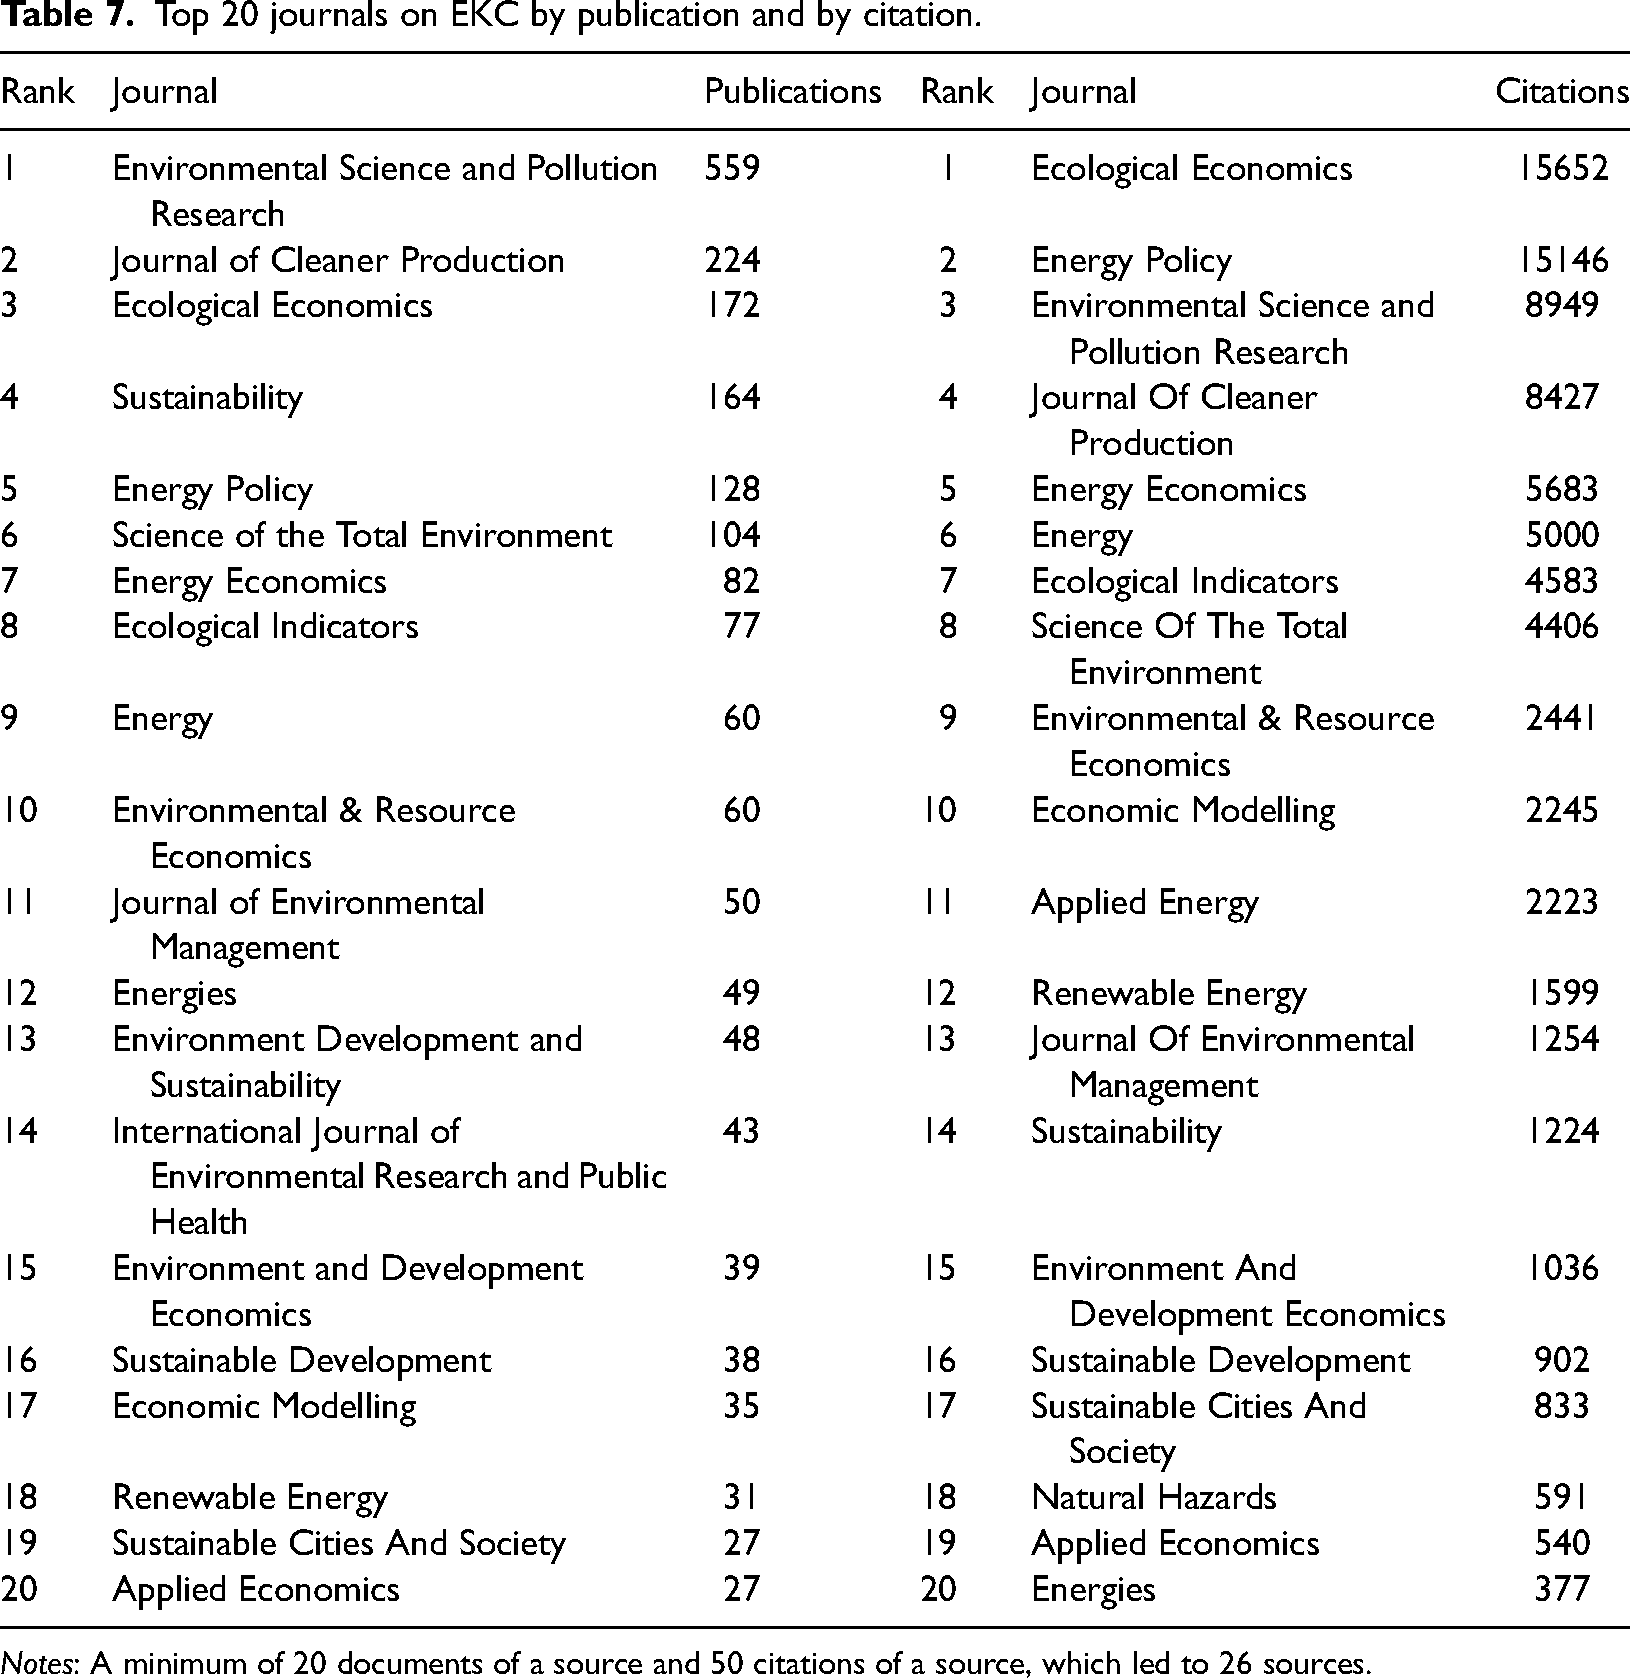
Notes: A minimum of 20 documents of a source and 50 citations of a source, which led to 26 sources.
Based on our analysis, we find that most of the EKC publications are associated with China. This is shown in Tables 8 and 9. The tables unveil the most popular organization/institute and the most popular countries related to EKC articles. For the results in Table 8, we filtered 55 organizations based on the criteria of a minimum of 20 documents and 50 citations. On top of the list is the Beijing Institute of Technology in China with a total of 140 publications and 5589 citations. Other organizations/institutes in China that are actively engaged in EKC-related research include Chinese Academy of Sciences, Tsinghua University, North China Electric Power University, Jiangsu University, etc. Other than China, the organizations/institutes from Turkey, France, Pakistan, Australia and Malaysia were found to contribute significantly to the development of the EKC studies.
Top 10 most popular organizations.
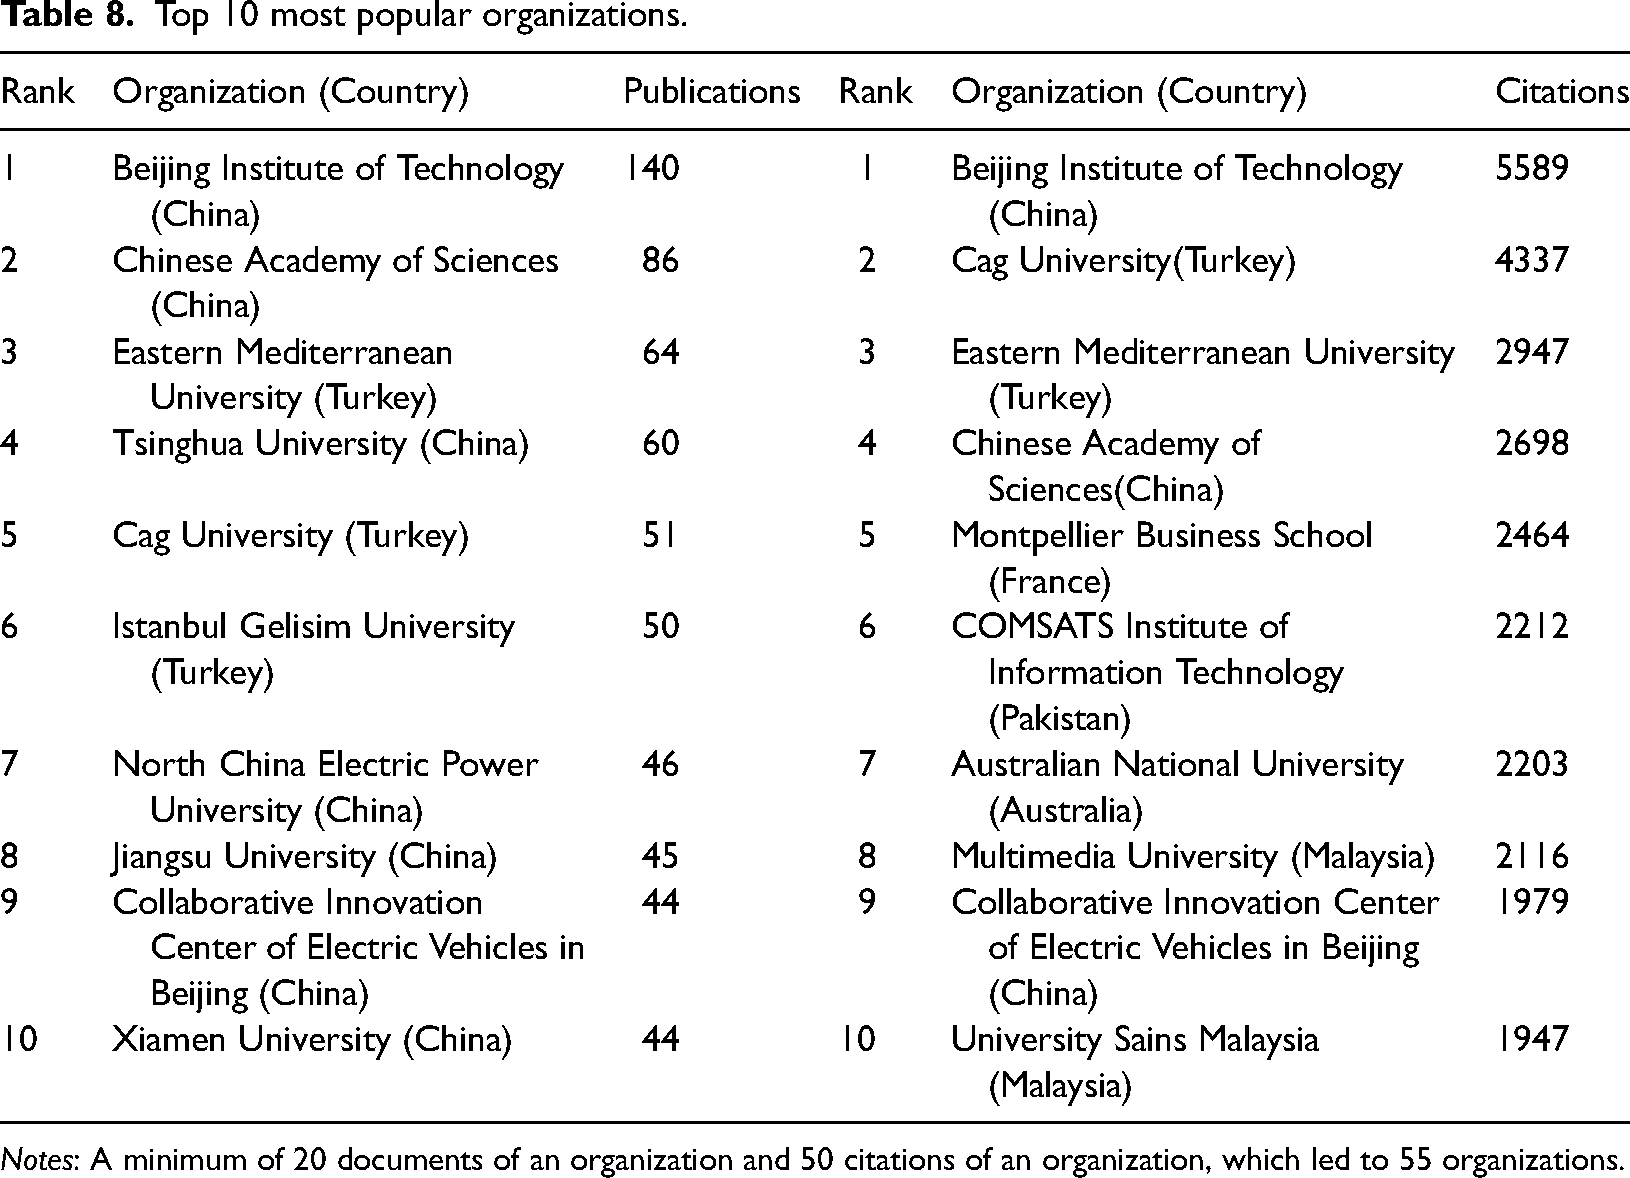
Notes: A minimum of 20 documents of an organization and 50 citations of an organization, which led to 55 organizations.
Top 20 most popular countries.
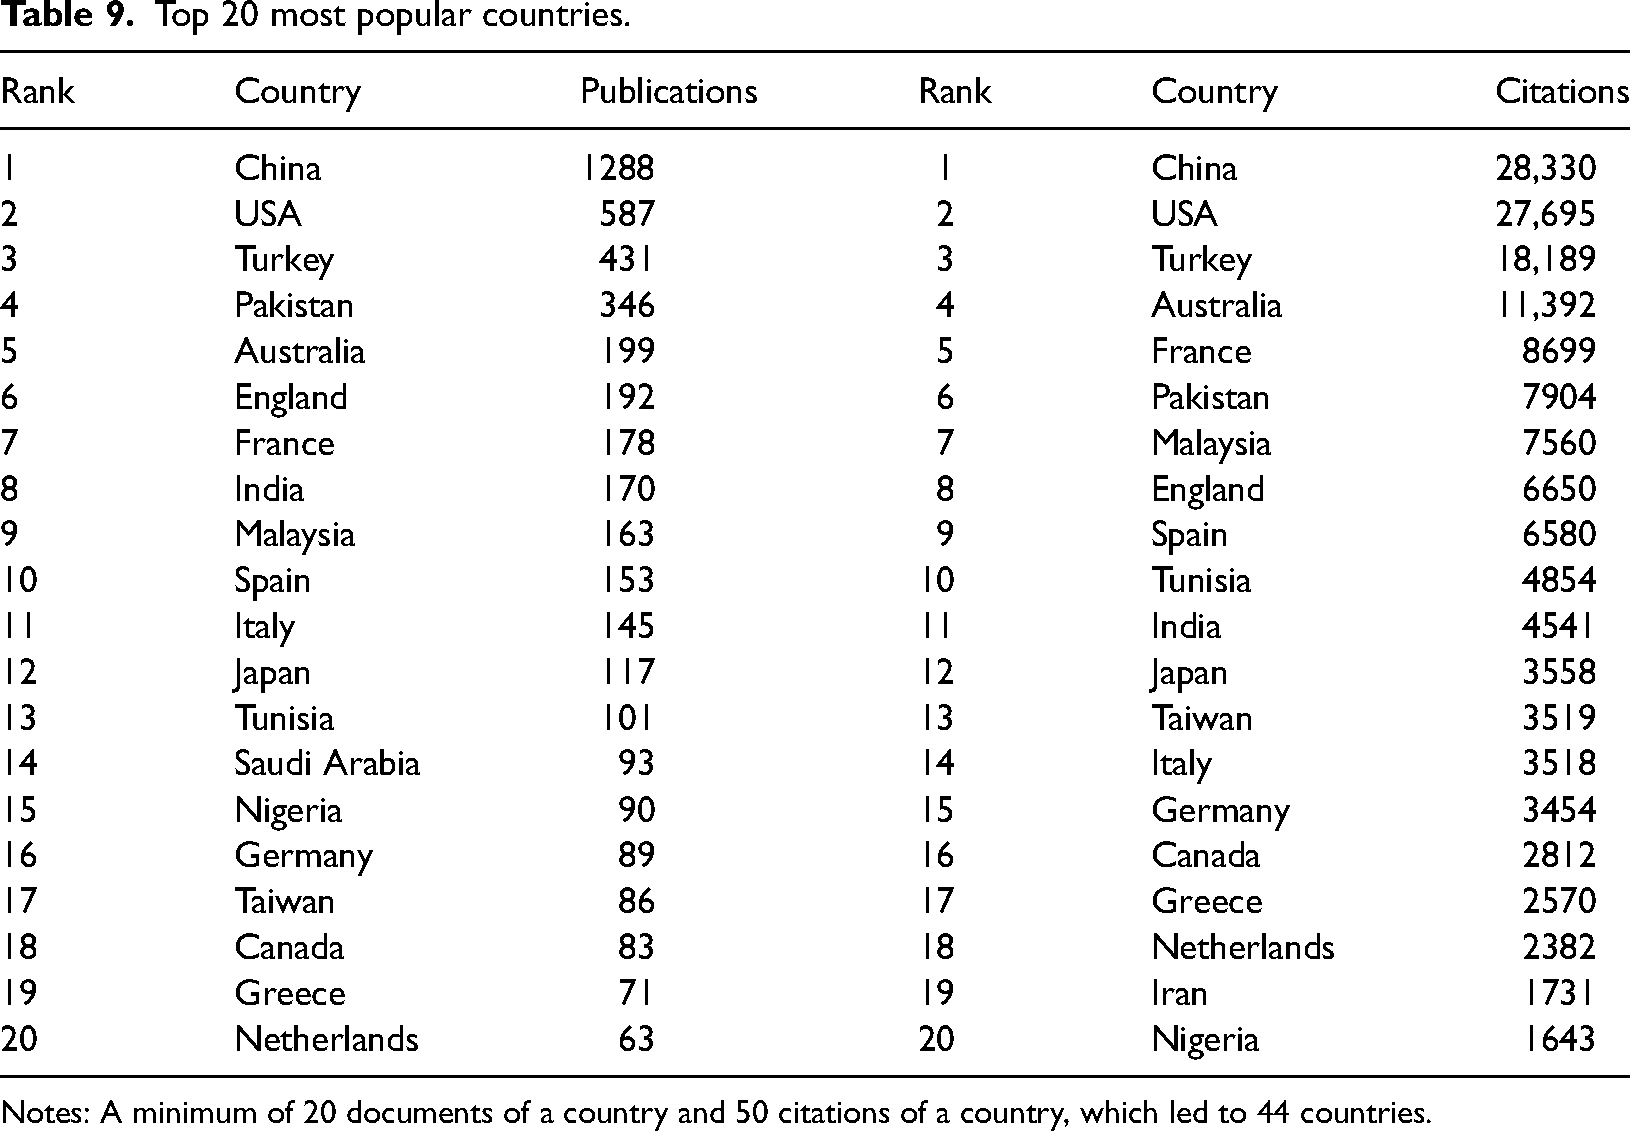
Notes: A minimum of 20 documents of a country and 50 citations of a country, which led to 44 countries.
For the results in Table 9, we gathered 44 countries based on a minimum of 20 documents and 50 citations of a country. The results unfold that China and the United States are the most popular research countries in the EKC literature. This could be due to the major role of both countries in the world economy and their high carbon emissions.
Network analysis
Keyword co-occurrence analysis
Keyword co-occurrence networks are typically built on words retrieved from a publication's title and abstract, or on words generated by the author. 52 It generates a two-dimensional map of a co-occurrence network of keywords using adjectives and nouns. When two keywords appear in the same title/abstract or citation context, they are called to co-occur. The distance between two keywords or nodes is roughly proportional to their similarity in terms of co-occurrence. Keywords with a greater incidence of co-occurrence are more likely to be found together. The VOSviewer includes a clustering tool that assigns keywords to clusters based on their co-occurrence.53,54 The benefits of conducting co-occurrence analysis include the ability to analyse a wide range of problems, such as academic communication, research front, intellectual structure of research fields and cross-disciplinary research.55,56
Author keywords
According to Table 10, EKC is the most often used author keyword, with 809 occurrences and 603 TLS. EKC (176 occurrences) and EKC hypothesis (102 occurrences) are author keywords that are related to the EKC (102 occurrences). It is not surprising that it is one of the most frequently used author keywords because it pertains to the main title.
Top 30 most frequently used author keywords.
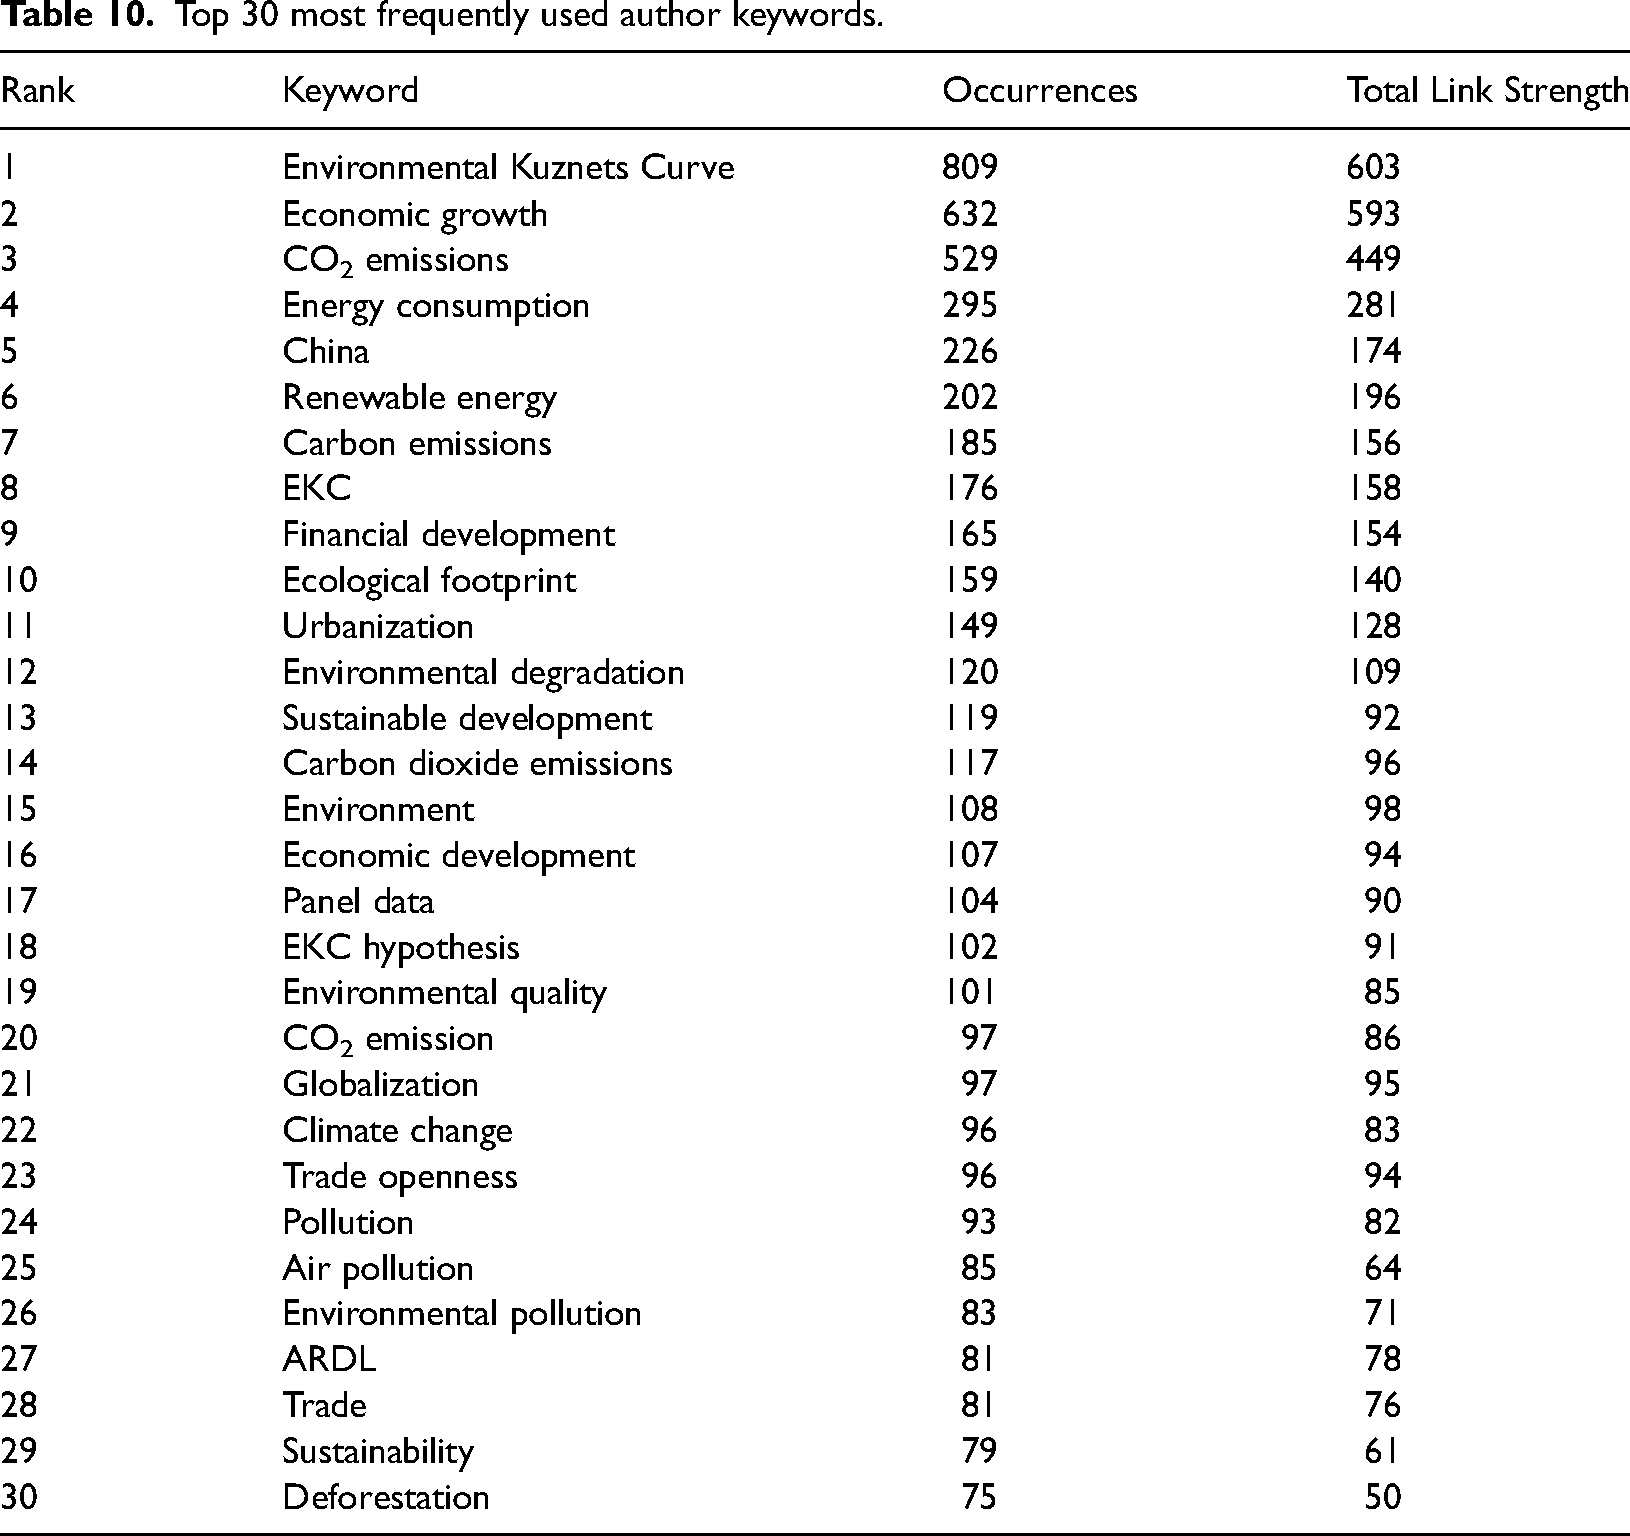
Author keywords such as economic growth and CO2 emissions (akin to carbon emissions, carbon dioxide emissions and CO2 emission) are also frequently employed in the study of EKC. This is due to the inverted U-shaped relationship between economic growth and environmental degradation (commonly proxied by CO2 emissions), which is used to examine the validity of the EKC hypothesis.19,57,58 This is followed by author keywords related to energy consumption, which is the fourth most frequently used (295 occurrences). A rise in CO2 emissions caused by fossil fuel consumption could lead to environmental degradation. Reducing energy consumption would be the most effective way to address the emissions issue. As a result, many authors investigate the emissions-energy-income nexus31,59–66 in order to understand its long-run relationship in respective economies and policy alternatives for averting global warming. 67
Furthermore, China is another most frequently used author keywords, with 226 occurrences, matching the Top 20 most popular countries (see Table 2). Numerous investigations on the ECK hypothesis have been conducted in China.68–70 This is because China is the world's second largest energy consumer and producer of energy-related carbon dioxide. Meanwhile, China has seen a significant increase in energy consumption and carbon emissions due to its remarkable economic growth around the world. Between 1980 and 2007, the average annual GDP growth rate was more than 9%, yet primary energy consumption and CO2 emissions increased by approximately 340% and 352%, respectively. 71
Table 11 displays the author keyword within six clusters and is reinforced by the network visualization map in Figure 3. Cluster 1 (red cluster) indicates that the main author keyword is EKC with 809 occurrences. This is followed by the keywords of China, sustainable development, economic development and environmental quality, which appear 226 times, 119 times, 107 times and 101 times, respectively. This also supports the Top 5 most frequently used author keywords, where many EKC studies have been undertaken sustainable development in China,72–81 economic development26,82–89; and environmental quality.90–97
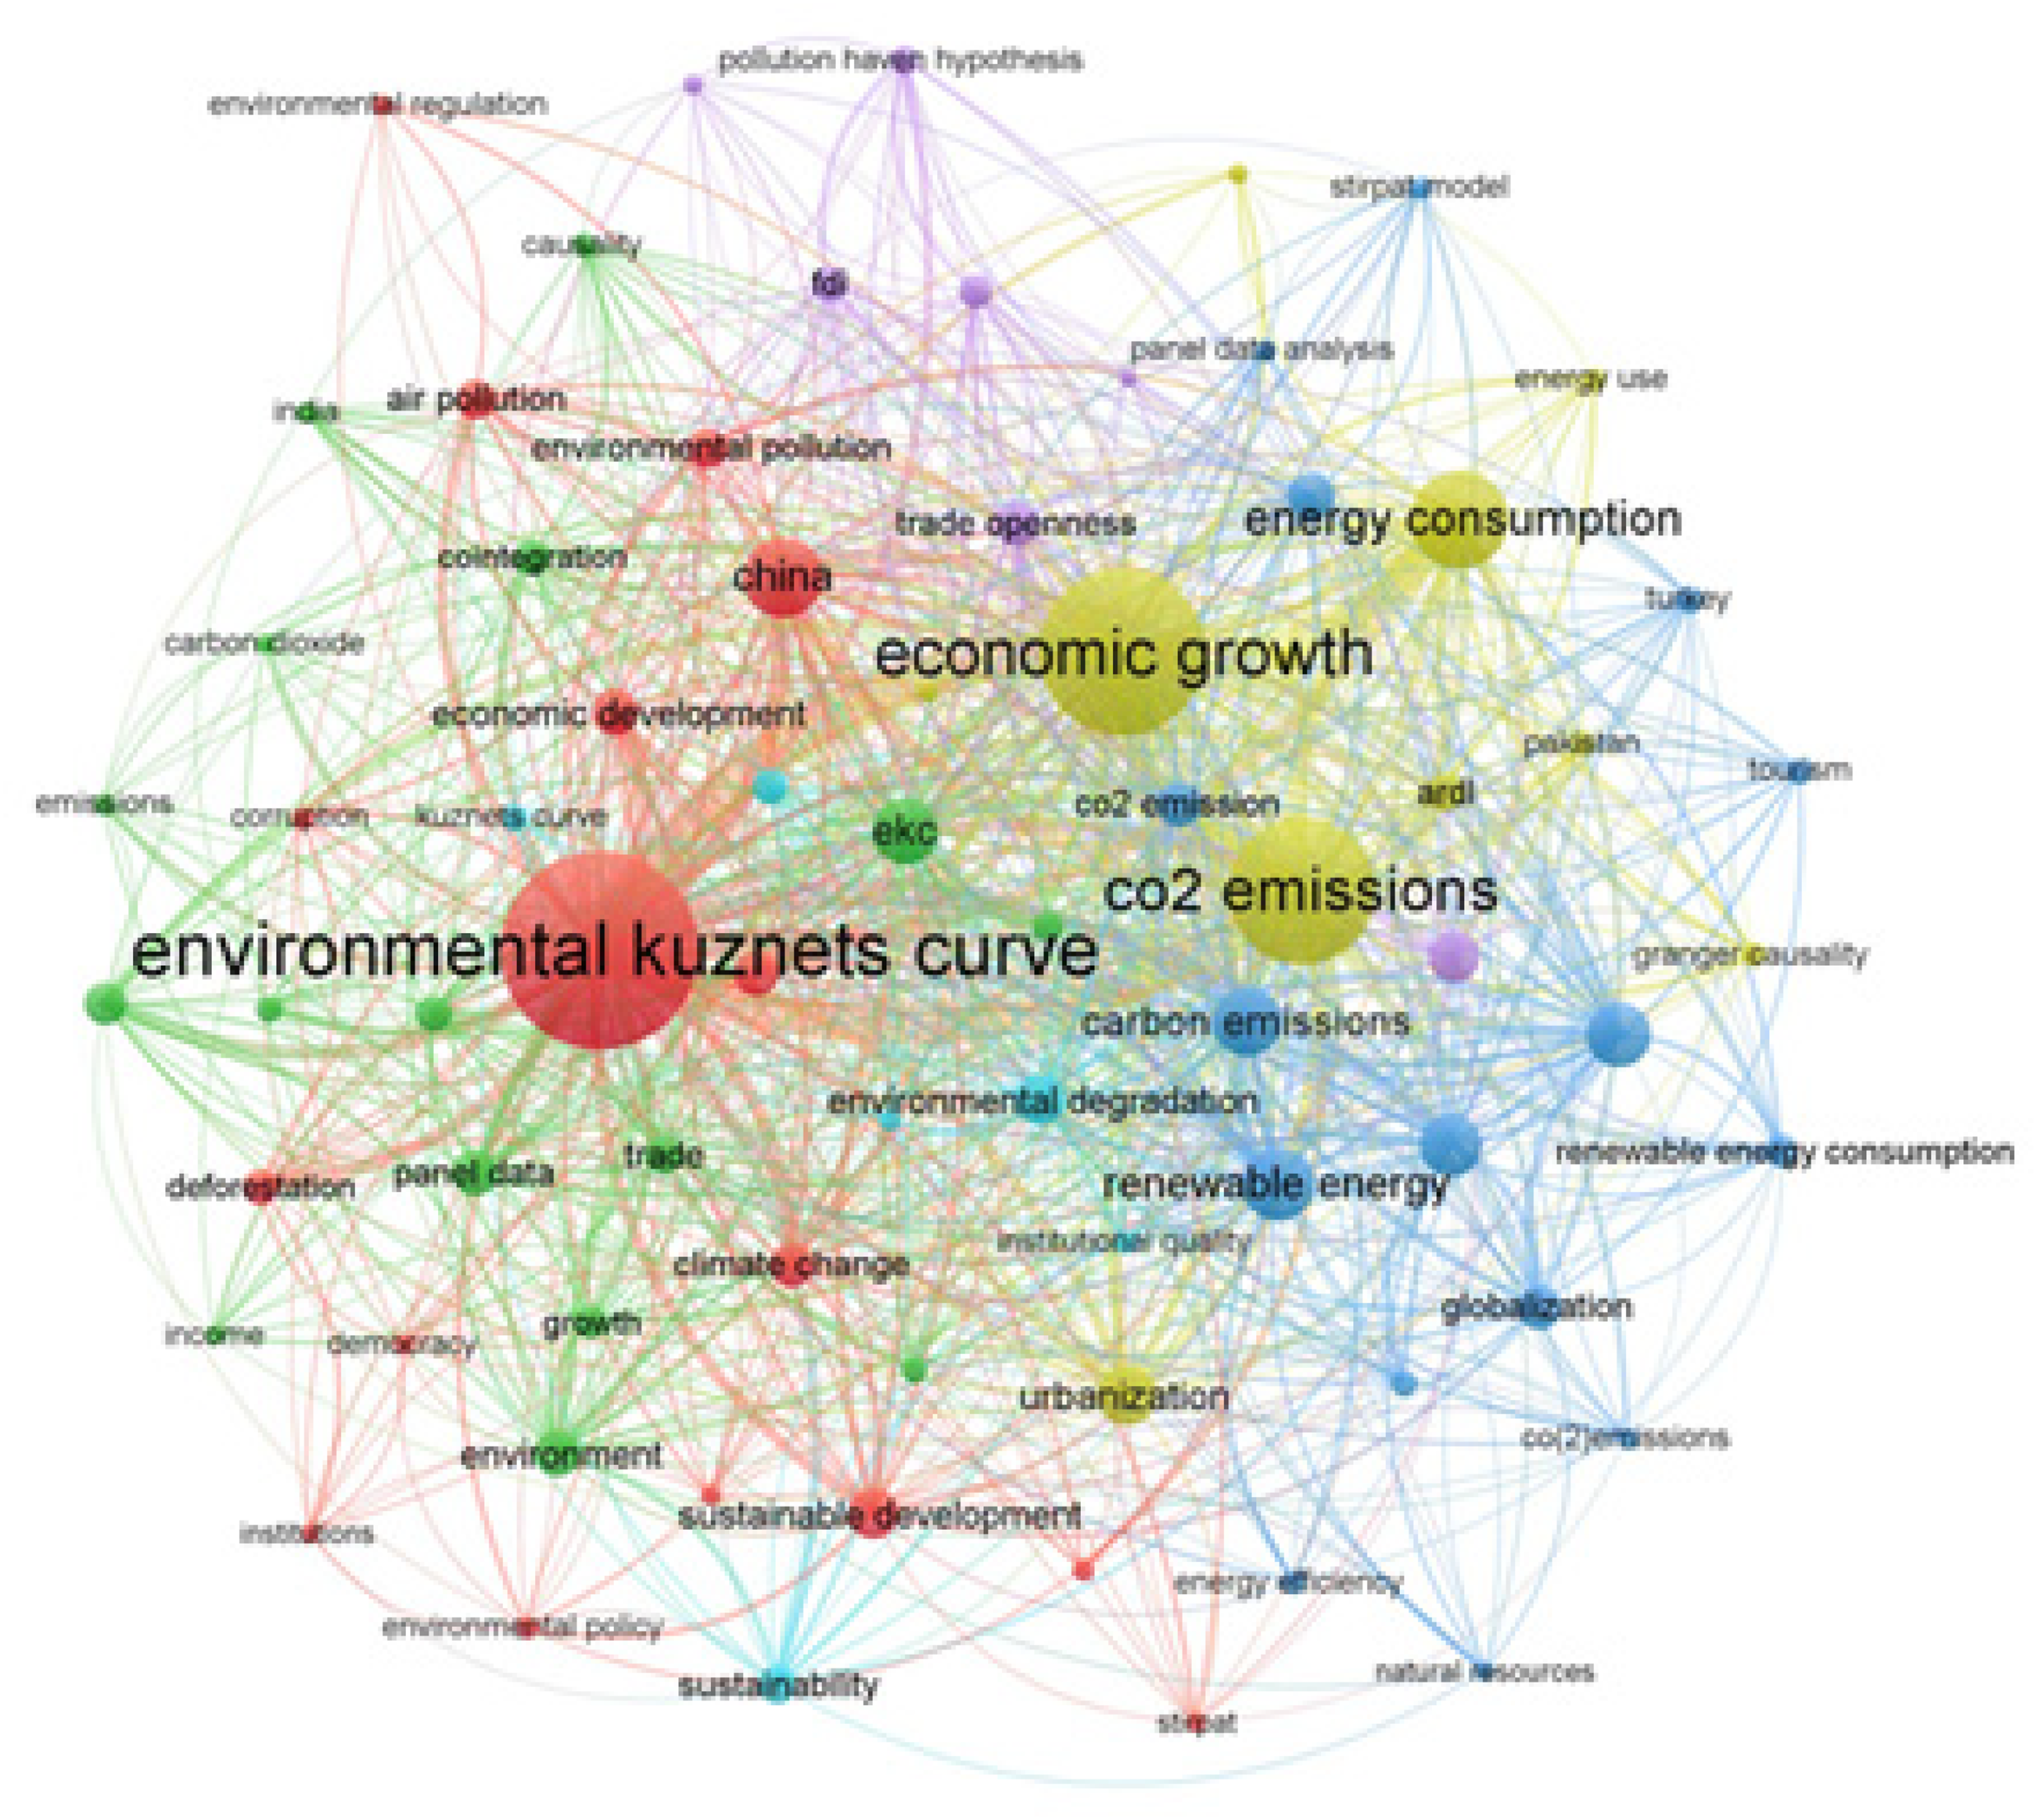
Author keywords network visualization map.
Author keyword clusters
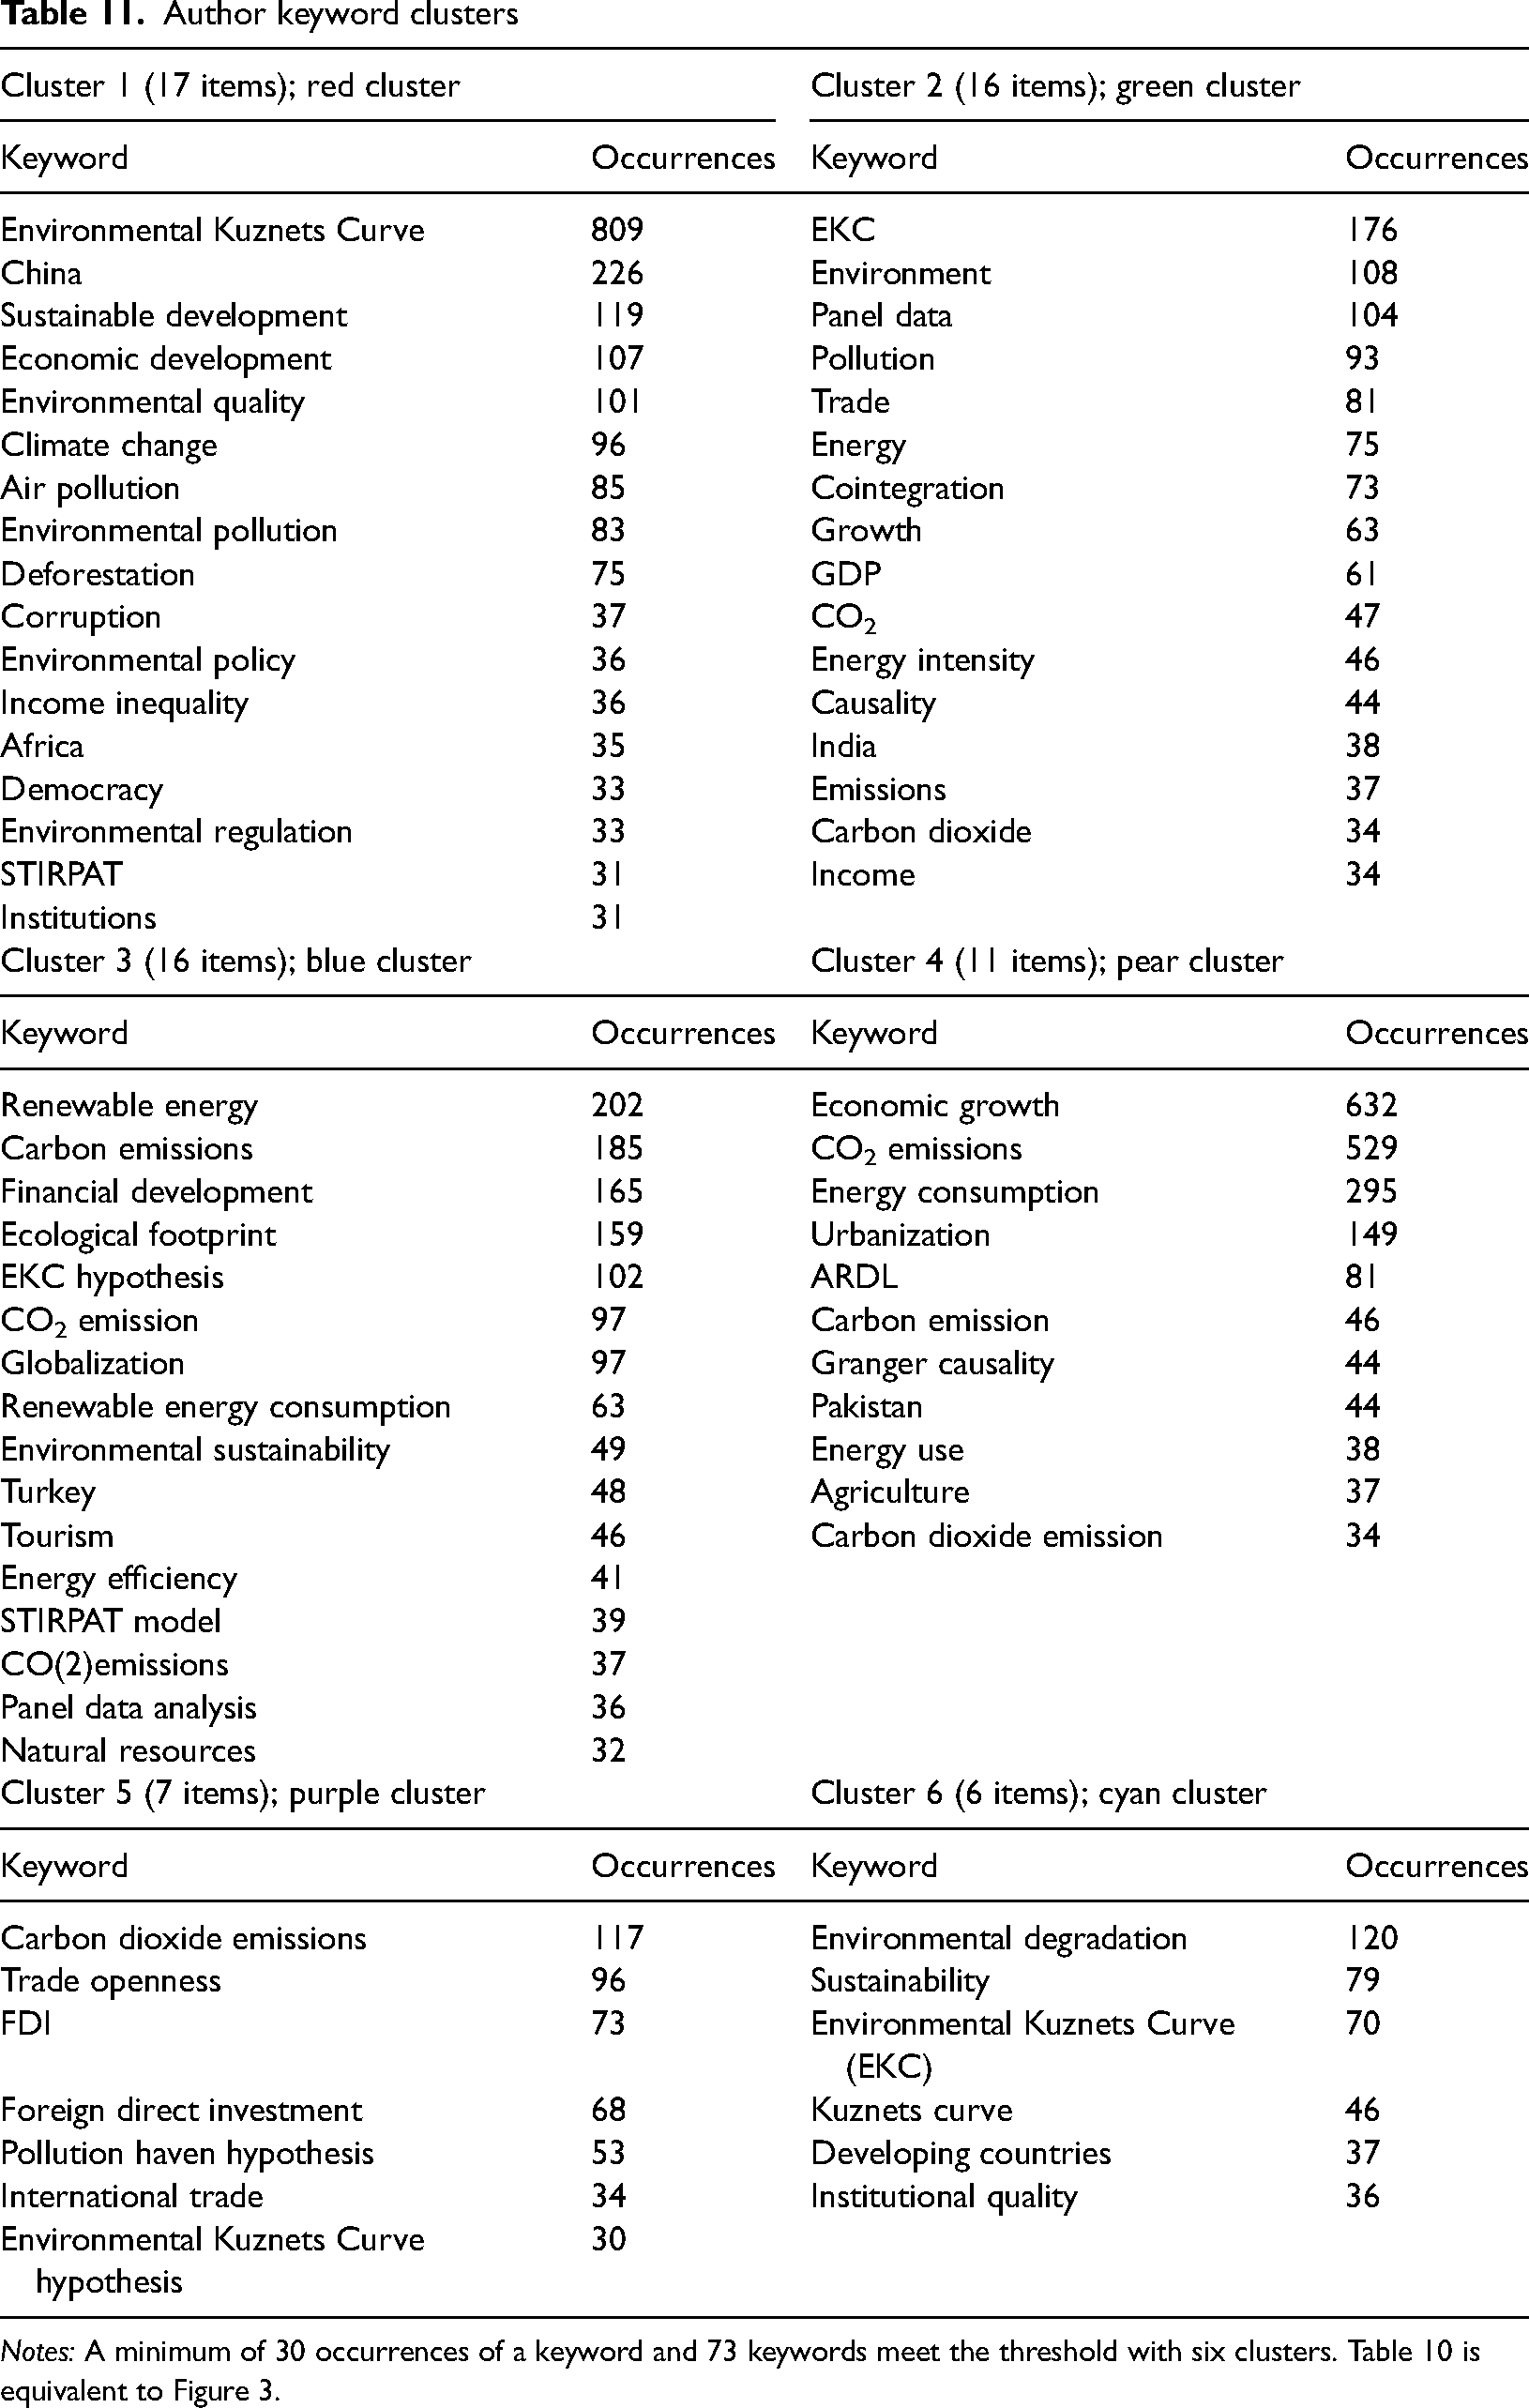
Notes: A minimum of 30 occurrences of a keyword and 73 keywords meet the threshold with six clusters. Table 10 is equivalent to Figure 3.
EKC, environment and panel data have the three highest occurrences in Cluster 2 (green cluster), with 176 times, 108 times and 104 times, respectively.98–102 Many studies start to engage in different types of panel data analysis, such as time series cointegration,57,63,103–109 panel cointegration,59,101,110–113 threshold cointegration,114–116 cointegration and nonlinearity, 117 time-varying cointegration,118,119 Maki cointegration 120 and Cramer-Von Misses cointegration. 121
Cluster 3 has the highest occurrences of keywords such as renewable energy (202), carbon emissions (185), financial development (165) and ecological footprint (159) related to the EKC hypothesis (102). This demonstrates an understanding of additional variables like renewable energy and financial development towards carbon emissions. Meanwhile, ecological footprint has been identified as a novel proxy for environmental degradation.
Keywords plus
Table 12 displays the top 30 most frequently used keywords plus. Economic growth is the highest ranking keyword with 1694 occurrences and 1663 total link strength. This is followed by similar keywords such as EKC (1686 occurrences and 1637 total link strength) and Kuznets curve (754 occurrences and 729 total link strength), which rank second and fifth, respectively. The third keyword plus ranking refers to CO2 emissions, which has 1534 occurrences and 1530 total link strength. Carbon-dioxide emissions, a related keyword plus, is ranked sixth with 614 occurrences and 614 total link strength. Moreover, energy consumption ranks among the top four most frequently used keywords plus, with 946 occurrences and 945 total link strength. This can be noticed that the top keywords plus are comparable to the author keywords when EKC studies are carried out.
Top 30 most frequently used keywords plus.
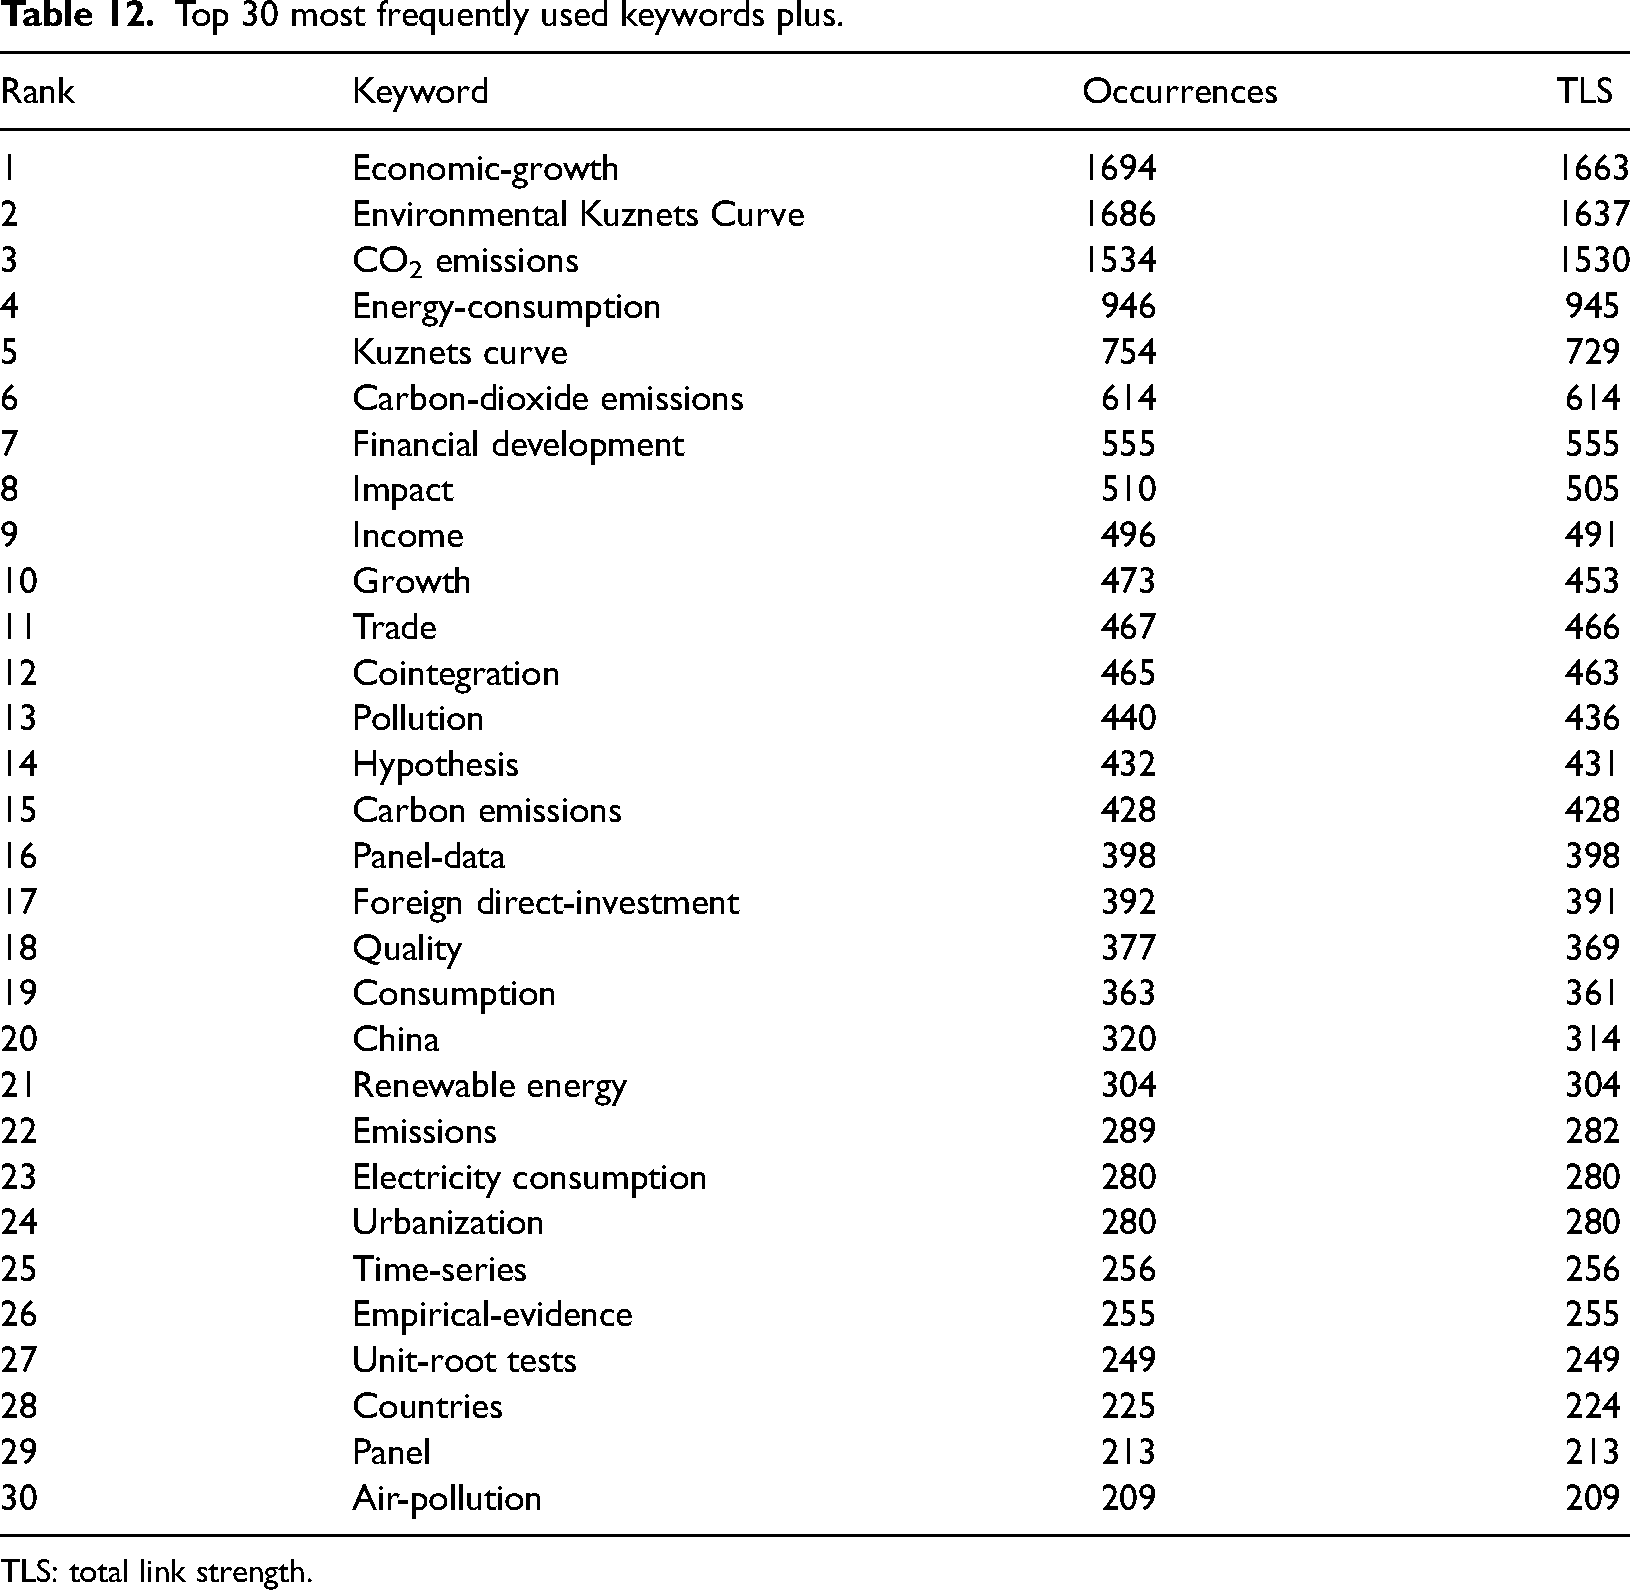
TLS: total link strength.
Table 13 shows the five keyword plus clusters, which are supported by the network visualization map in Figure 4. The first cluster of red nodes and links consists of 31 keywords plus. As can be observed, economic growth (or growth) is highly associated with the EKC (or Kuznets curve), which has the occurrence of 1694 (or 473) and 1686 (or 754), respectively. This is because economic growth is one of the explanatory variables in testing the EKC hypothesis test. The foundation of EKC theory is drawn from Beckerman's notion that, while economic growth normally leads to environmental degradation in the early stages of the process, being rich is the best method for countries to achieve a decent environment. 122 According to Panayotou, 123 after an economy has attained an adequate level of economic growth, continuing economic expansion leads to the improvement of services and technology, which in turn improves environmental degradation.
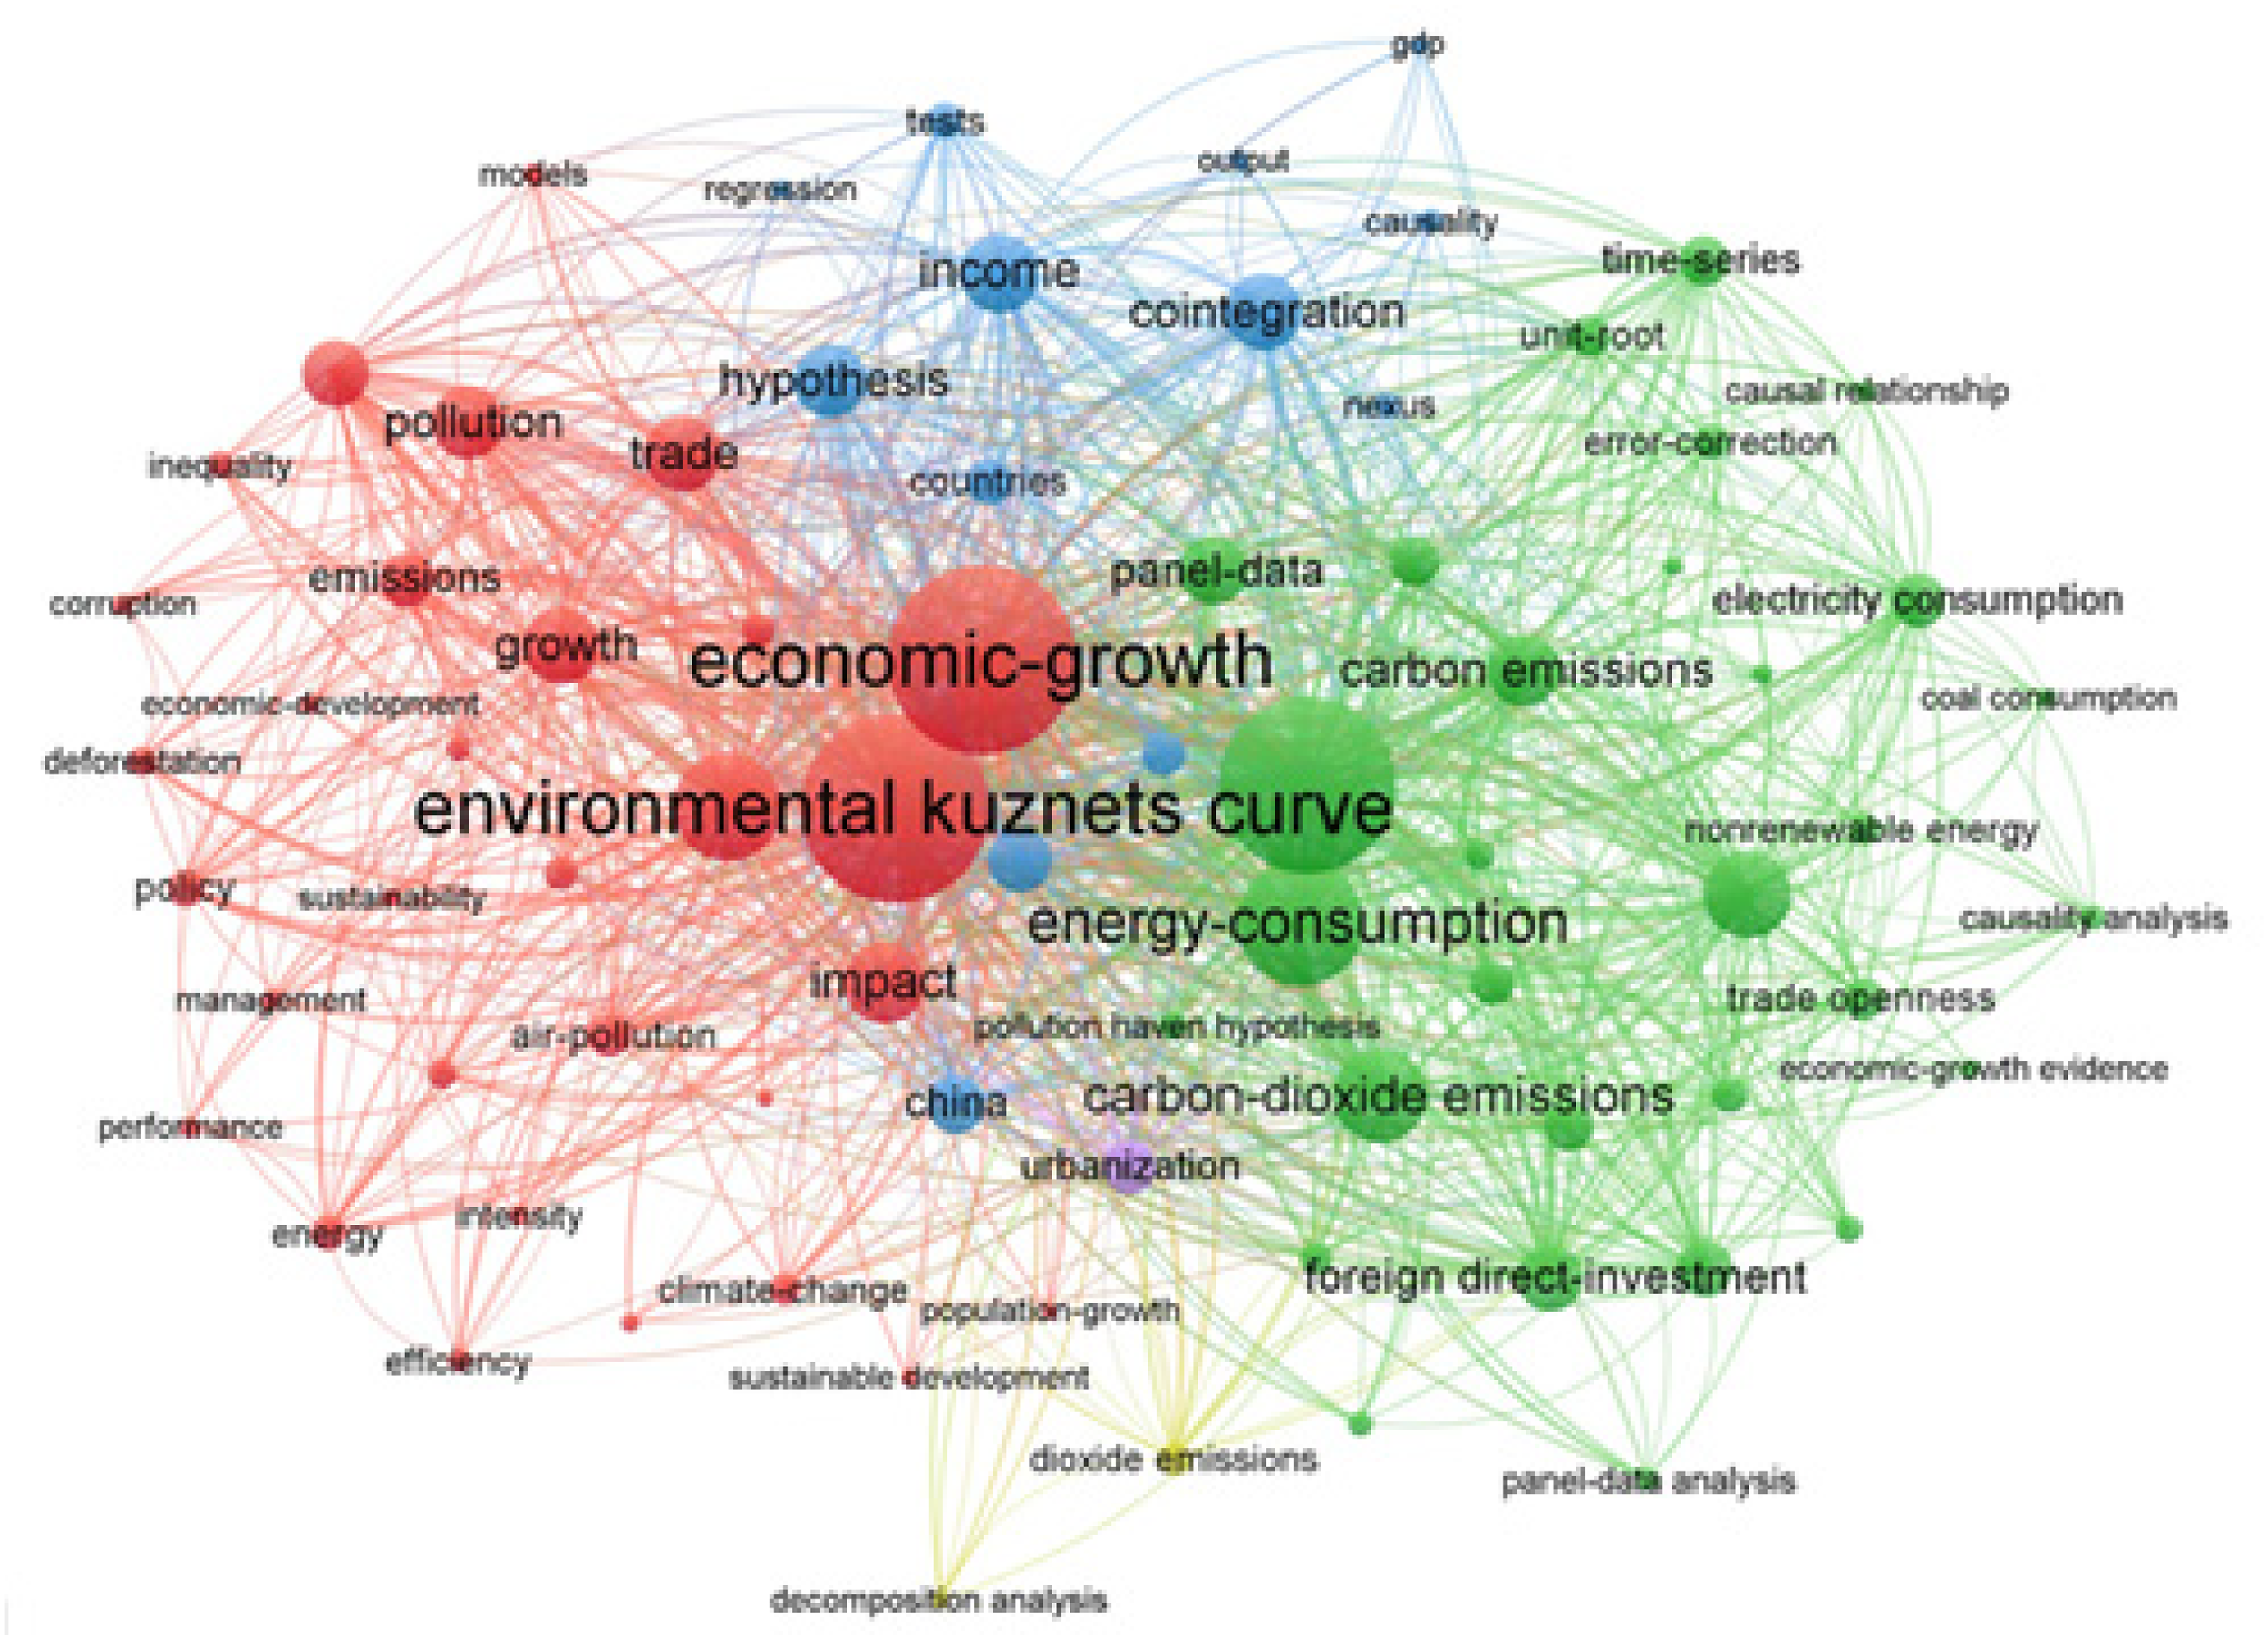
Keywords plus network visualization map.
Keyword plus clusters
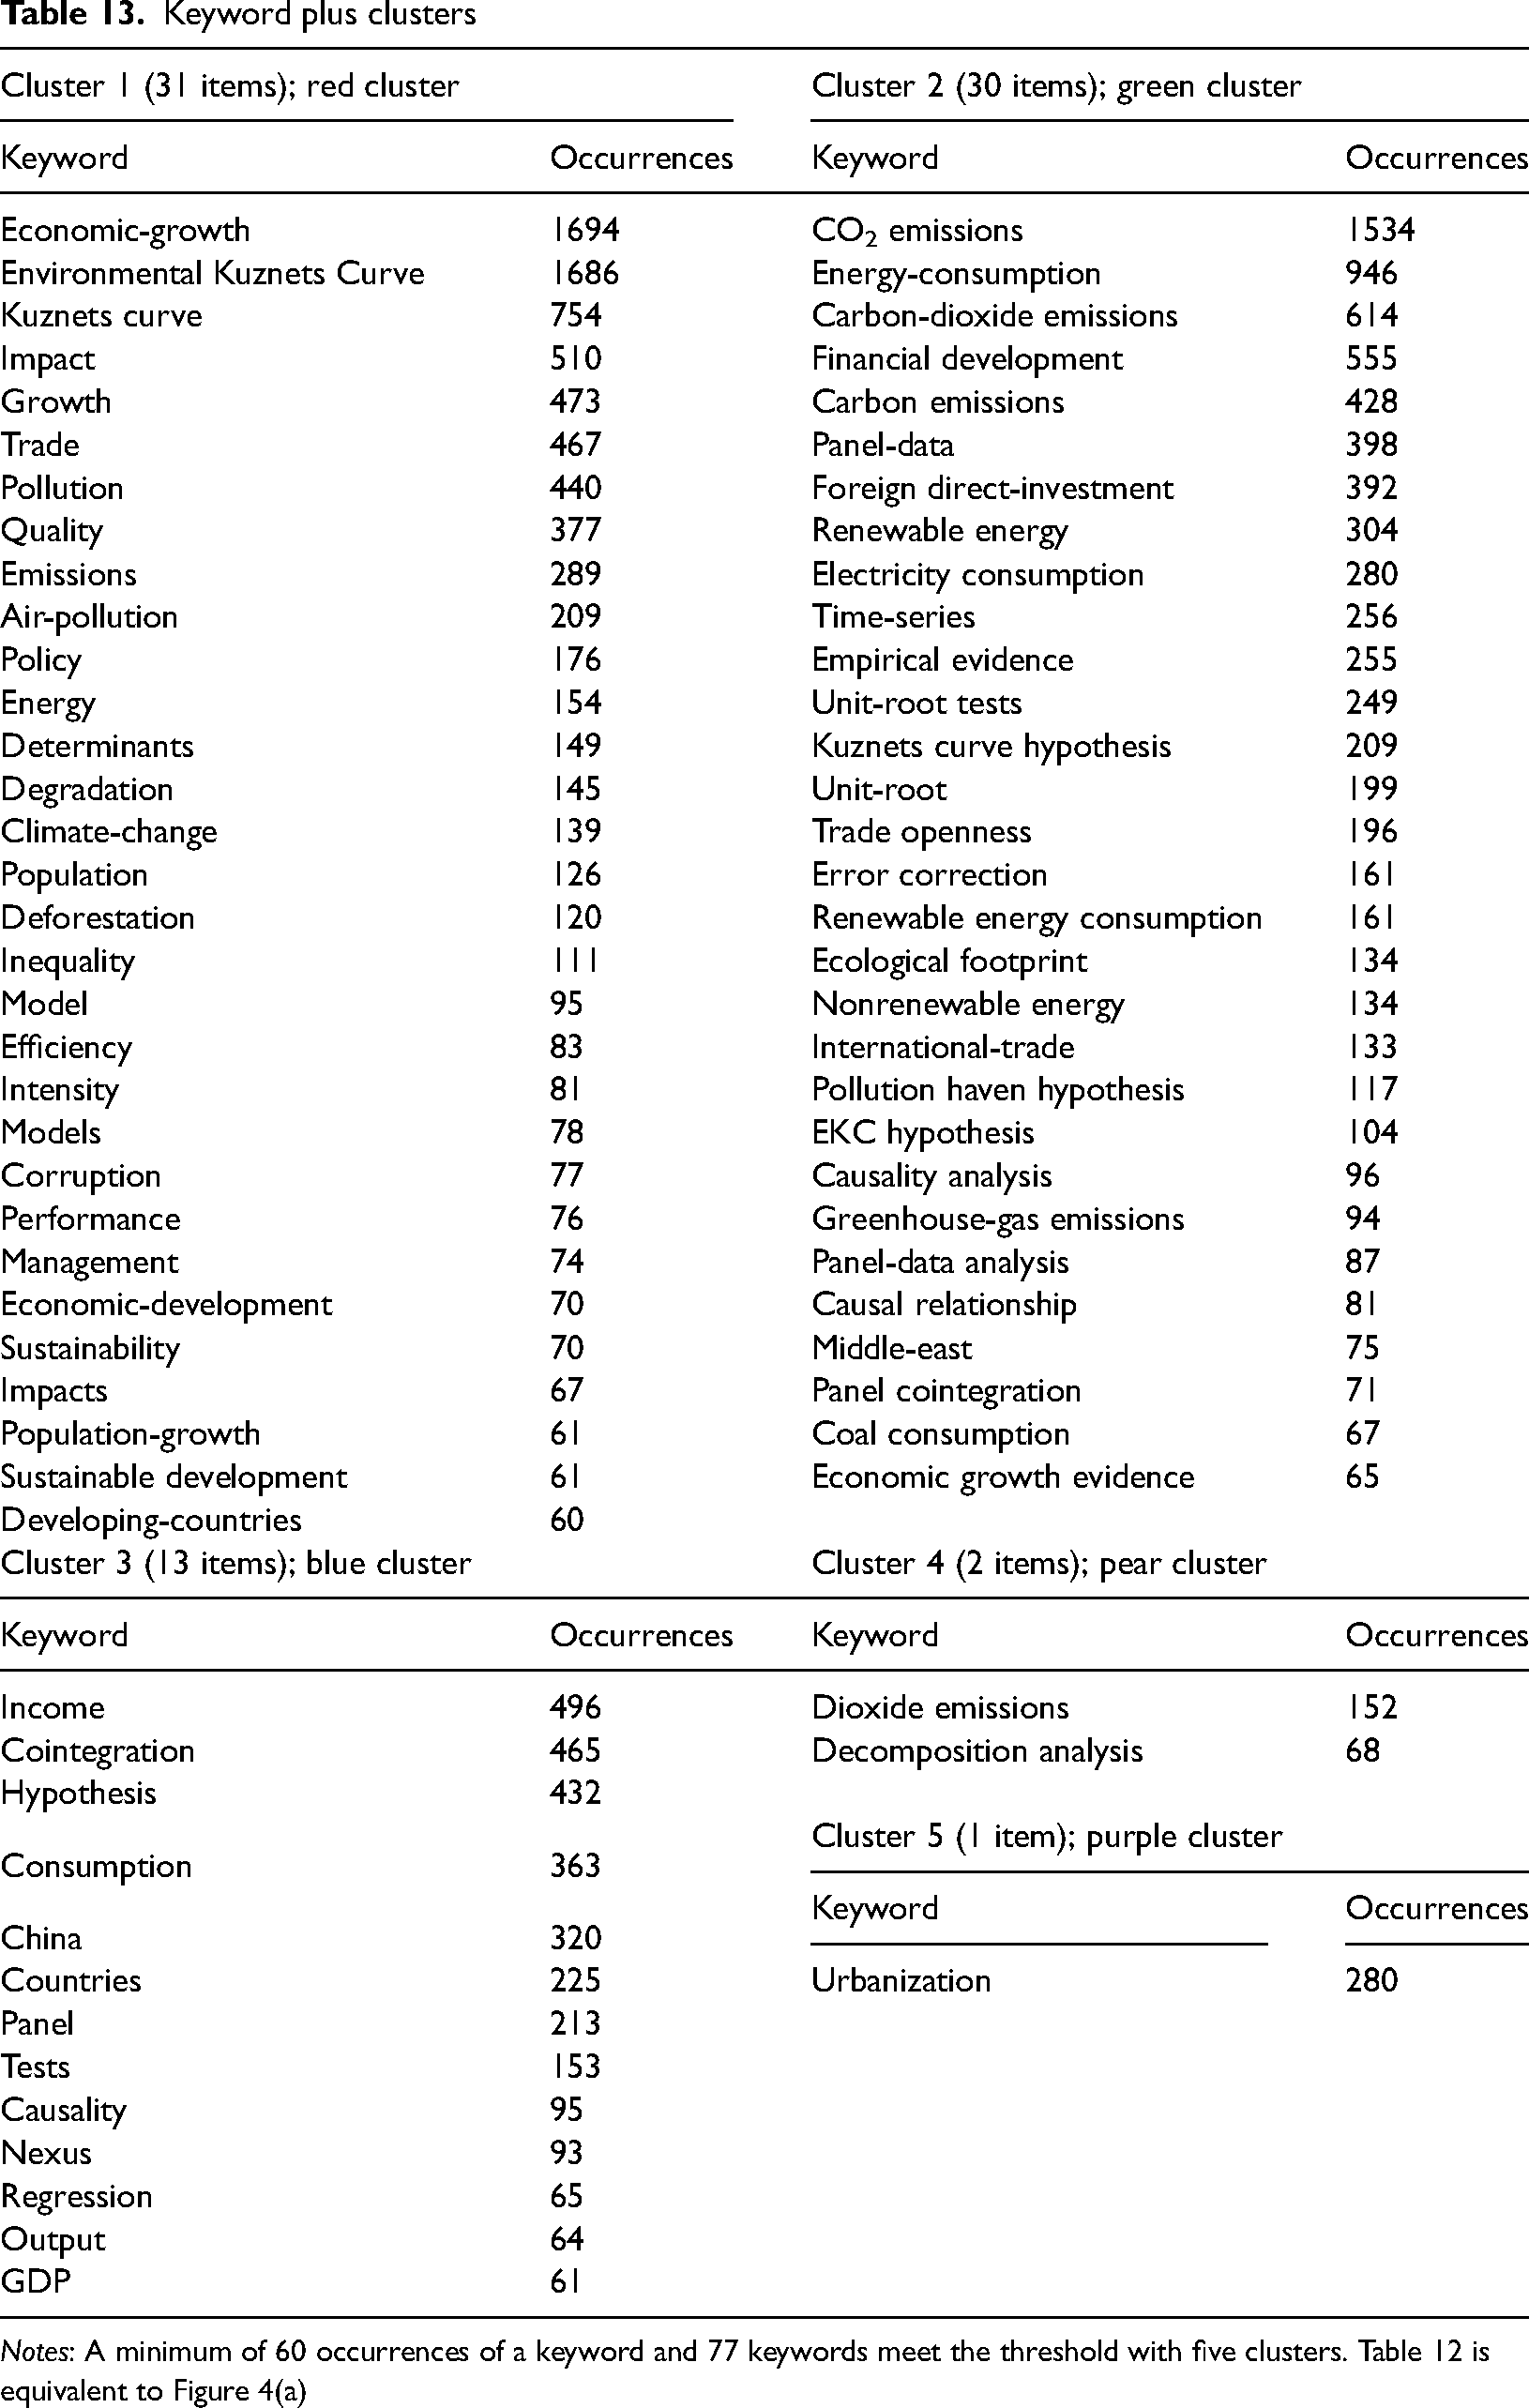
Notes: A minimum of 60 occurrences of a keyword and 77 keywords meet the threshold with five clusters. Table 12 is equivalent to Figure 4(a)
The inverted U-shape of EKC related to income and environmental degradation is derived from Simon Kuznets’ hypothesized curve regarding the relationship between income inequality and economic growth. 1 When an income level reaches a specific level, the environmental degradation level decreases. This shows that economic growth improves the quality of the environment for those with higher income levels. Additionally, Lieb 124 develops Pollution-Income relationship (PIR) literature demonstrating that environmental deterioration is a by-product of economic activity, where numerous authors investigate the relationship between environmental degradation (pollutant) and economic growth (income).
Next, 30 items are discovered in the second cluster with the green nodes and links. The keyword plus of CO2 emissions, carbon dioxide emissions, or carbon emissions have the most occurrences with 1534 times, 614 times and 428 times, respectively. In evaluating the EKC hypothesis, the majority of researchers use these keywords as the proxy for environmental degradation. Then, energy consumption and financial development are examined alongside economic growth towards environmental degradation for the EKC hypothesis. Energy consumption is widely recognised as one of the most important variables influencing economic advancement. Besides, the use of energy consumption for energy production, such as electricity production, would result in carbon emissions.59,125–127 The energy-environment-output nexus has been thoroughly tested by the researchers. 128
According to Shahbaz et al., 129 financial development helps in the enhancement of environmental quality and fosters economic development. Financial development reduces financial expenses and improves financial networks for businesses, giving them more opportunities to invest and purchase new machines and equipment, which increases energy consumption and CO2 emissions. 130 Meanwhile, some researchers claim that financial development reduces energy consumption and CO2 emissions by improving corporate performance and energy efficiency. 131
The blue nodes and links contain 13 items for the third cluster. Income, cointegration and hypothesis are found to have the highest occurrences with 496 times, 465 times and 432 times, respectively. This shows that income is one of the factors in the EKC hypothesis that symbolizes economic growth and has an impact on environmental degradation. Cointegration is the most common test used to analyse the EKC hypothesis, such as time series cointegration, panel cointegration, threshold cointegration, cointegration and nonlinearity, time-varying cointegration and Cramer-Von Misses cointegration. 121
The fourth cluster comprises two items, which are dioxide emissions (152 occurrences) and decomposition analysis (68 occurrences). It is coloured in the pear nodes and links. Meanwhile, urbanization is the only keyword plus that comes in the fifth cluster under the purple node and link. An increased urban population would increase industrial output, transportation, energy consumption and CO2 emissions.132,133
Co-authorship analysis
According to Mourao and Martinho, 134 co-authorship analysis refers to the relatedness of items from various affiliations and countries on specific topics based on the number of co-authored documents. Co-authorships analysis is gaining popularity since it provides codified markers of collaboration and evidence for evaluating universities’ R&D performance. 135 Joint writing to gain new knowledge usually leads to journal co-authorship that receiving acknowledgement through peer review and quality control. Co-authorships denote continuing collaborative relationships among researchers who are competing and collaborating in the research publication. 136
Authors
Figure 5 depicts the co-authorship of authors network visualization map. Muhammad Shahbaz possesses the greatest number of co-authorships with other authors. This is understandable given Shahbaz's high number of publications and citations in the EKC studies. In the same cluster (red node), here are 19 prominent authors with the co-authorship, including Haider Mahmood and Antonio Cardoso Marques. Then, Ilhan Ozturk, the second most prolific author, is also the second most frequently co-author with other authors (brown node), such as Khorsed Alam, Russell Smyth and Usama Al-Mulali. This is followed by Danish who leads another cluster (blue node) with the 14 authors who have the most frequent co-authorship, such as Lee Chien-Chiang. Meanwhile, Zeeshan Khan tops the most co-authorship in another cluster (green node) with 14 authors. Additionally, Eyup Dogan, Recep Ulucak, Halkos George E., Tzeremes Nickolaos G. and Stern David I. are part of the cluster (yellow node) with a high co-authorship.
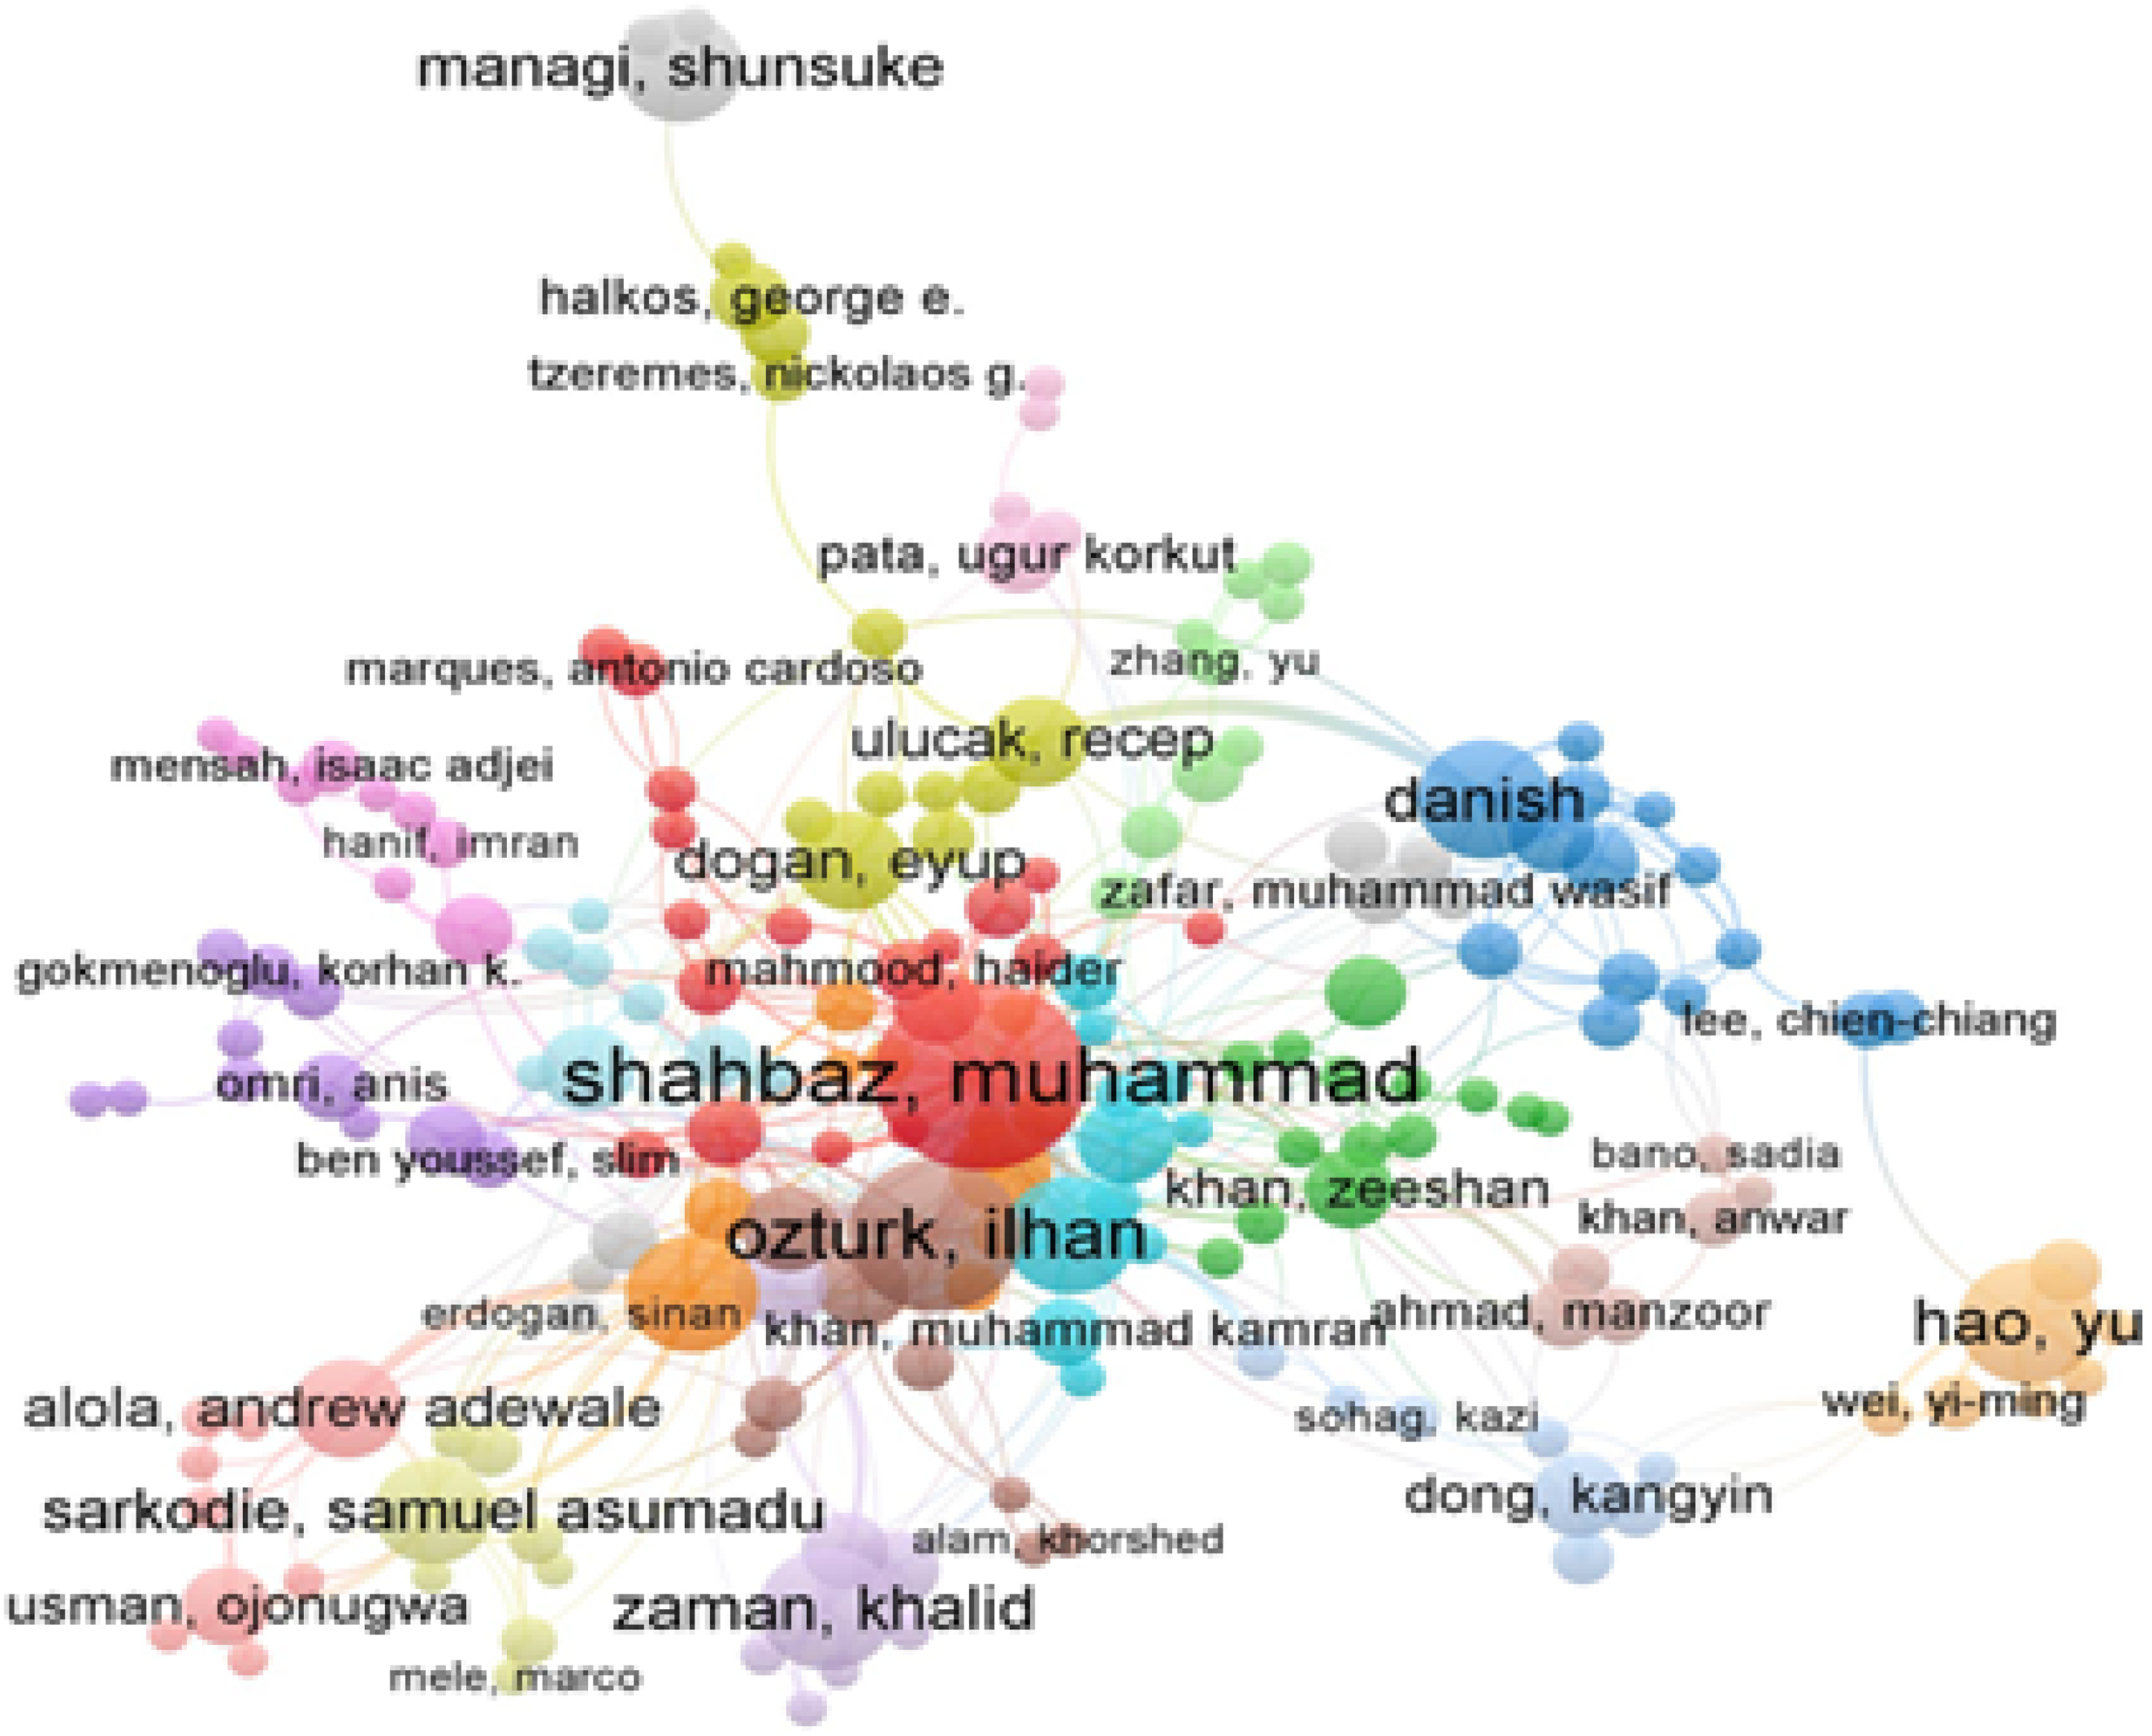
Co-authorship of authors network visualization map.
Organizations
Figure 6 illustrates the co-authorship of organizations network visualization map. The cluster with the largest node (blue node) refers to Beijing Institute of Technology, which has the largest number of publications with co-authorship. The co-authorship in this institution is strongly linked with Collaborative Innovation Center of Electric Vehicles Beijing, Sustainable Development Research Institute for Economy and Society of Beijing, and Beijing Laboratory of Energy Economics and Environmental Management.
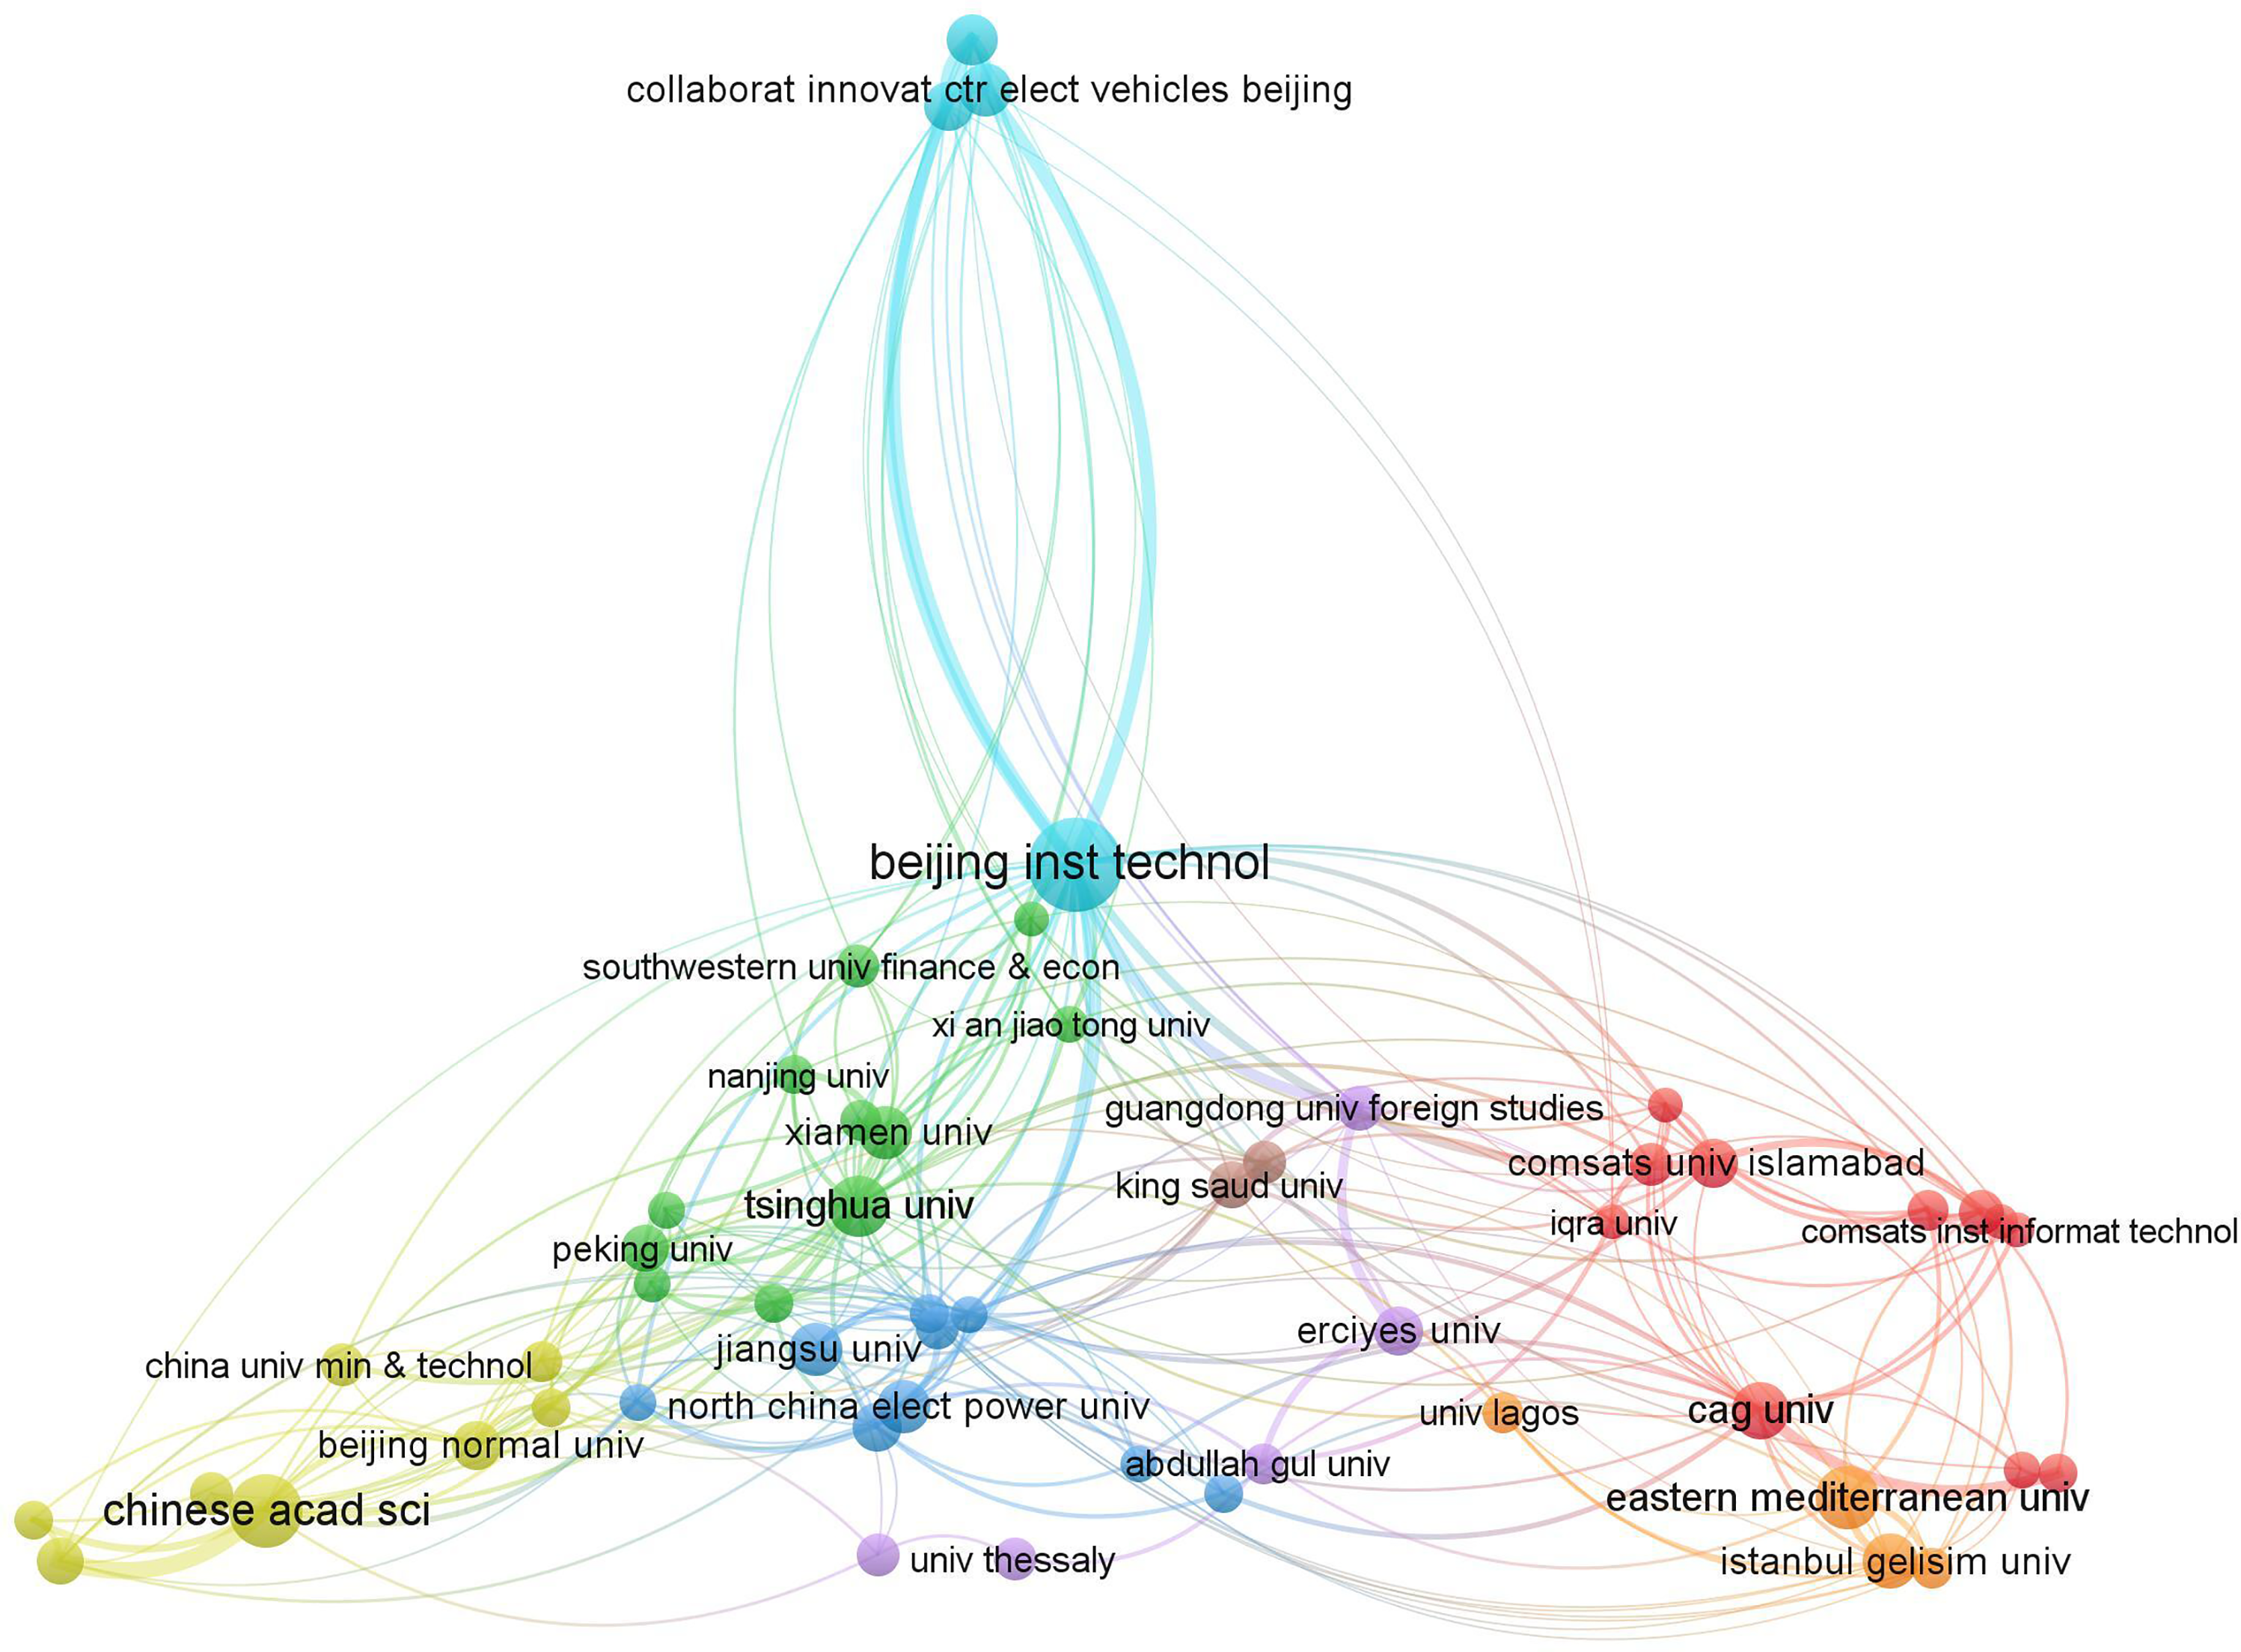
Co-authorship of organizations network visualization map.
Cag University, COMSATS Institute of Information Technology, COMSATS University Islamabad, Iqra University, Multimedia University, Universiti Sains Malaysia and others are among the 11 organizations with the most co-authorship in the red node cluster. Another cluster in the green node has networks of co-authorship in the organizations, including Tsinghua University, Xiamen University, Huazhong University of Science and Technology, Xi’an Jiaotong University, Nanjing University, Southwestern University of Finance and Economics and others. This was followed by the blue node cluster, which possesses the nine organizations for co-authorship, including Jiangsu University, North China Electric Power University, Shenzhen University, Zhejiang University and others.
The cluster in the yellow node indicates that eight organizations have co-authored the papers, including Chinese Academy of Sciences, Beijing Normal University, China University of Mining and Technology, Hunan University, Wuhan University and others. Moreover, the five organizations such as Erciyes University, University of Thessaly, Guangdong University of Foreign Studies, Abdullah Gul University and Australian National University are linked in the same co-authorship cluster (purple node). The cluster in orange node is made up of four organizations for co-authorship, including Eastern Mediterranean University, Istanbul Gelisim University, the University of Lagos and South Ural State University. Meanwhile, the two organizations in the brown node cluster refer to King Saud University and University of Wah, both of which have a linked co-authorship.
Countries
Figure 7 depicts the network visualization map for the countries of co-authorship. China has been highlighted (orange node) as the country having the highest publications and co-authorship linked with Taiwan. This is backed by the fact that China has the most popular countries in the publication, the most frequently used author keywords and the greatest amount of co-authorship's authors and organizations from China. The red node cluster as the largest group, which links the nine countries such as England, South Africa, Netherlands, Spain, Portugal, Brazil, Chile, Scotland, Austria, Switzerland and Germany. The second leading cluster (green node) includes Australia, Malaysia, Bangladesh, Vietnam, Singapore, Japan, Iran and Indonesia as co-authors. This is followed by the dark blue node cluster, which shows the co-authorship network among the eight countries, including Pakistan, Saudi Arabia, France, India, Tunisia, Egypt, Tunisia and United Arab Emirates. Moreover, the orange node cluster reveals that authors from Turkey have collaborated extensively with those from Russia, Nigeria, Sweden, Ghana and Norway. The purple node cluster indicates that the USA is the leading country in terms of co-authorship in EKC studies, together with Poland, Lithuania, Romania and South Korea. Furthermore, co-authorship in the light blue node cluster has been traced to five countries, including Greece, Canada, Finland, Belgium and Italy.
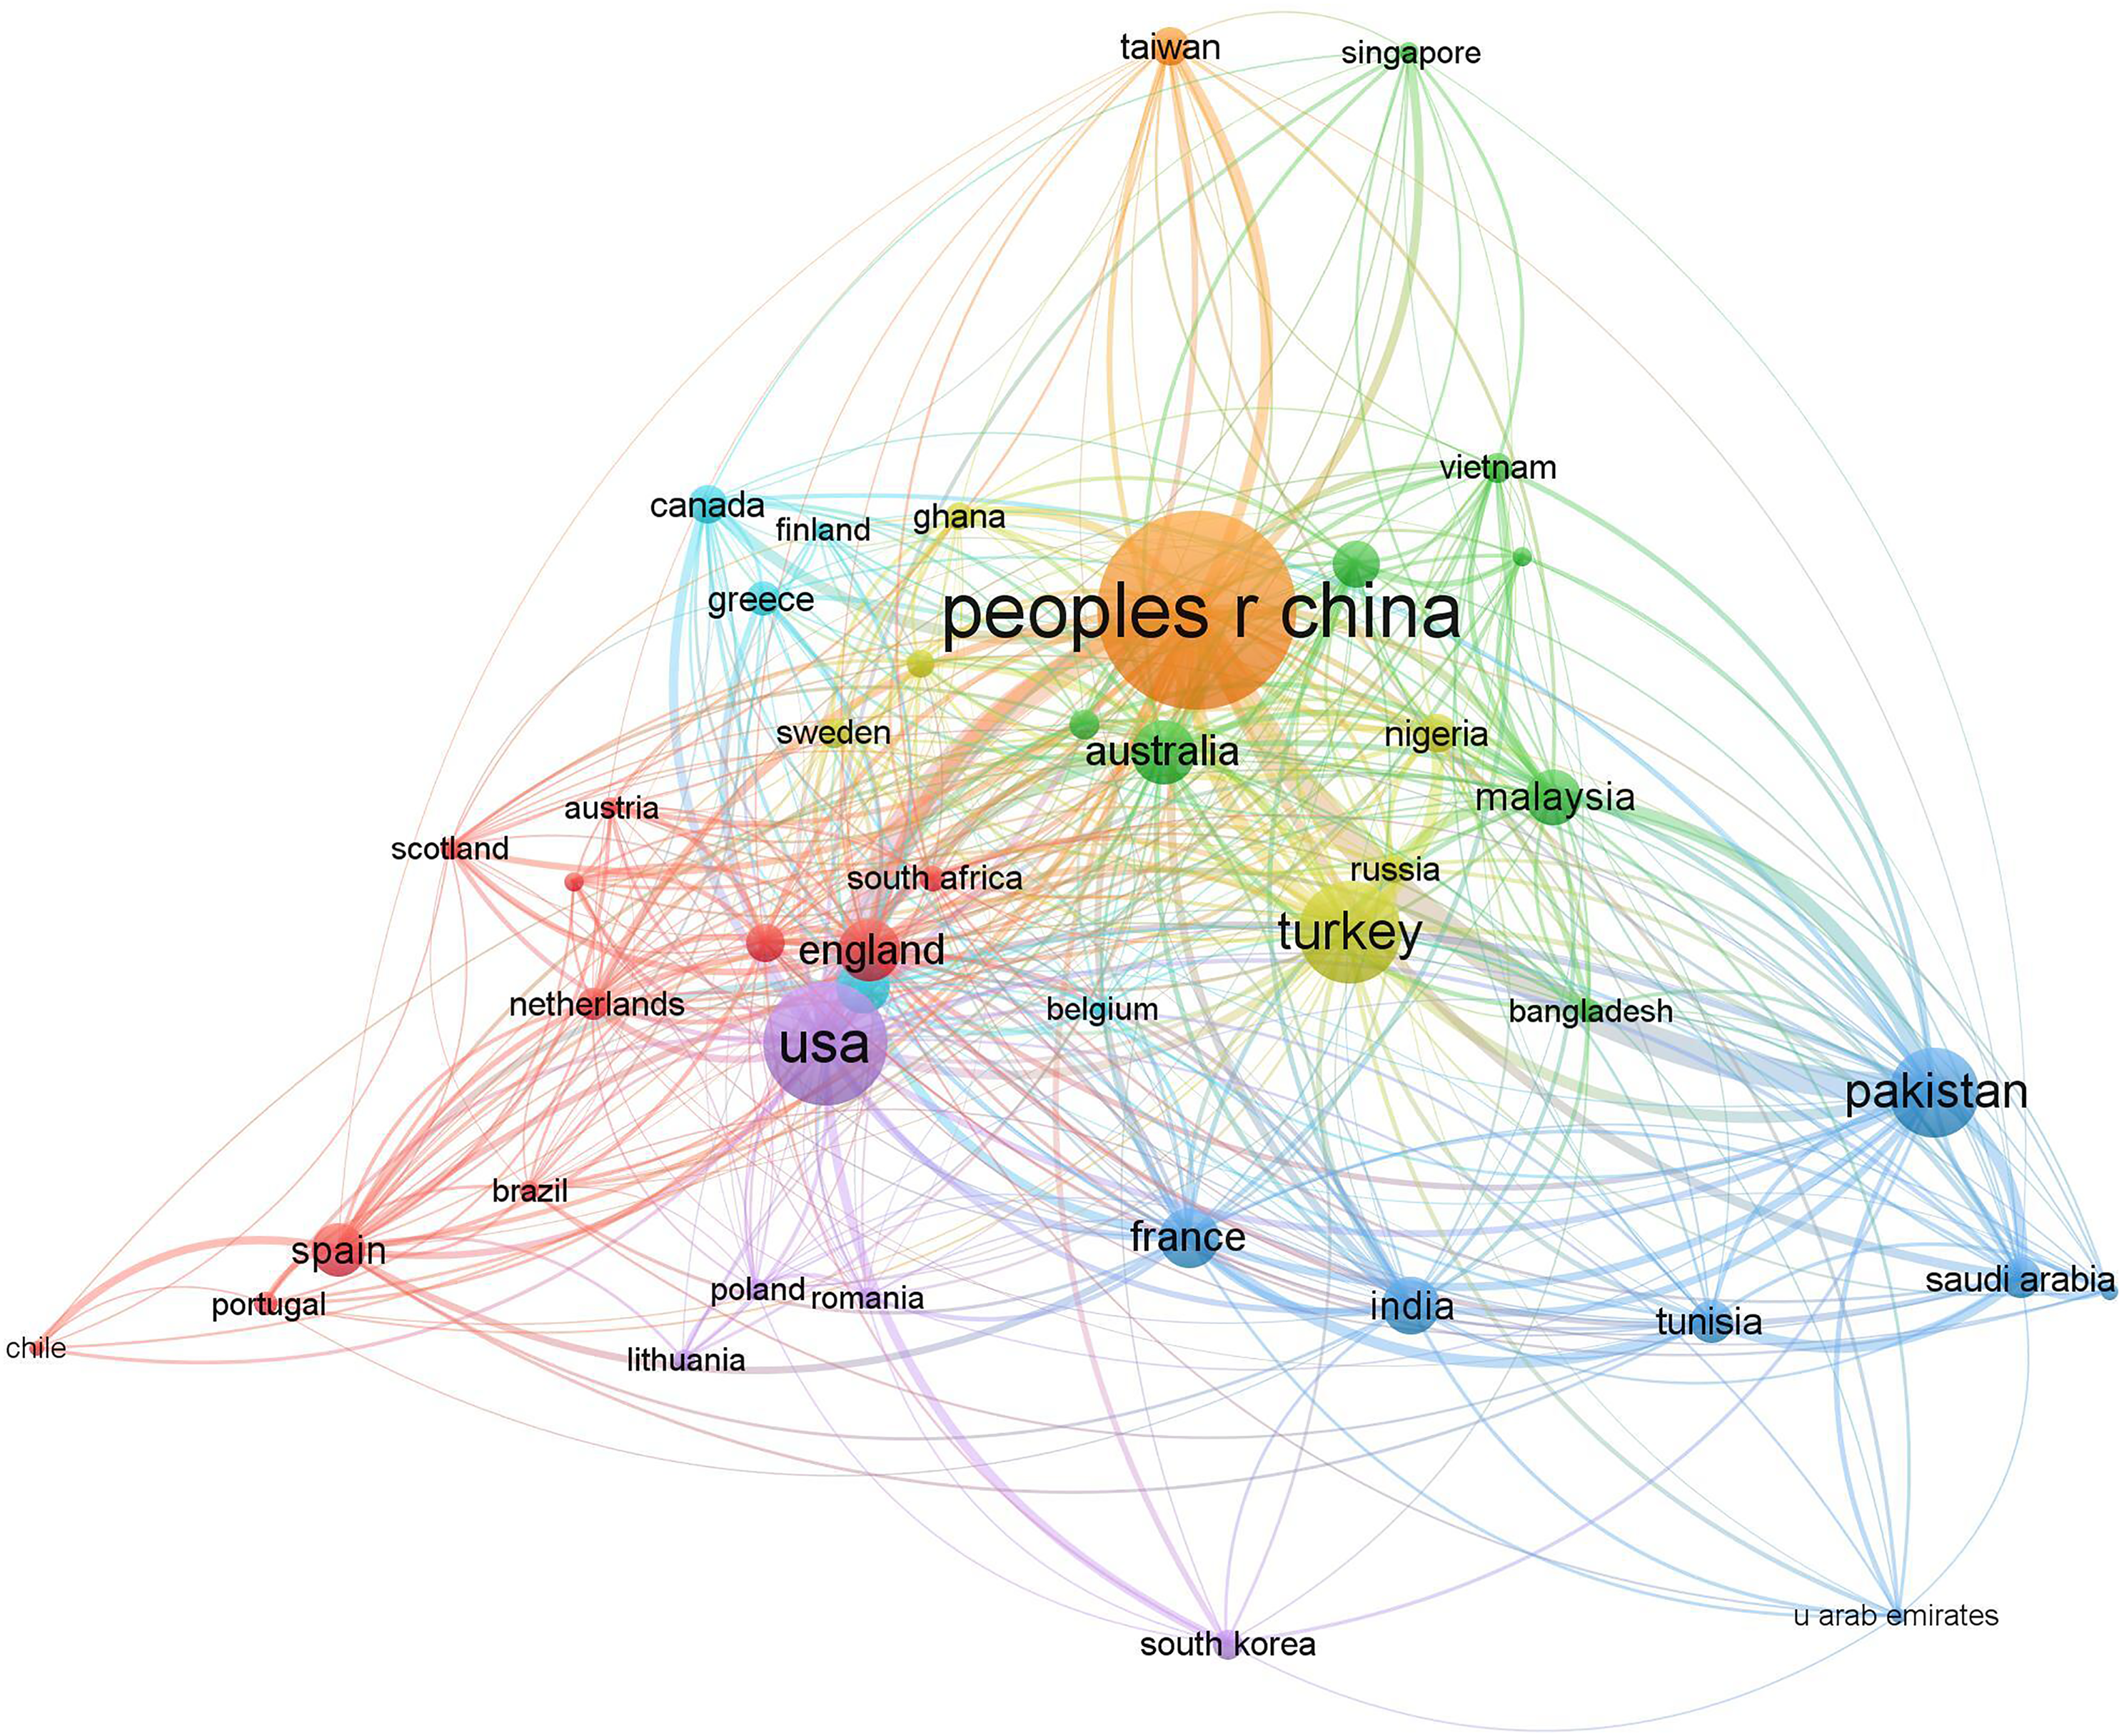
Co-authorship of countries network visualization map.
Co-citation analysis
Co-citation occurs when two articles appear in the reference list of a third article. 137 The co-citation frequency is the frequency in which two publications are cited together. Co-citation focuses on references that occur in pairs on a regular basis, whereas bibliographic coupling focuses on groups of articles that cite the same source article. 138 Guan et al. 139 also investigate the impact of collaboration and knowledge networks on citations. These attempts demonstrate that co-citation analysis is a reliable and valid method for studying intellectual structure due to the measurement target.
Cited authors
Figure 8 illustrates a network visualization map of author co-citations in four clusters. Muhammad Shahbaz has been the most active researcher in the largest cluster, which is indicated in red node, researching and revisiting the EKC hypothesis in different countries using econometrics analysis methodologies such as cointegration, Granger causality and trivariate analysis. The effects of various explanatory variables on environmental degradation in various countries are tested, including economic factors (economic growth, trade openness, foreign direct investment, globalization and tourism development), financial factors (financial development and income inequality) and energy factors (coal consumption, clean energy and renewable energy).
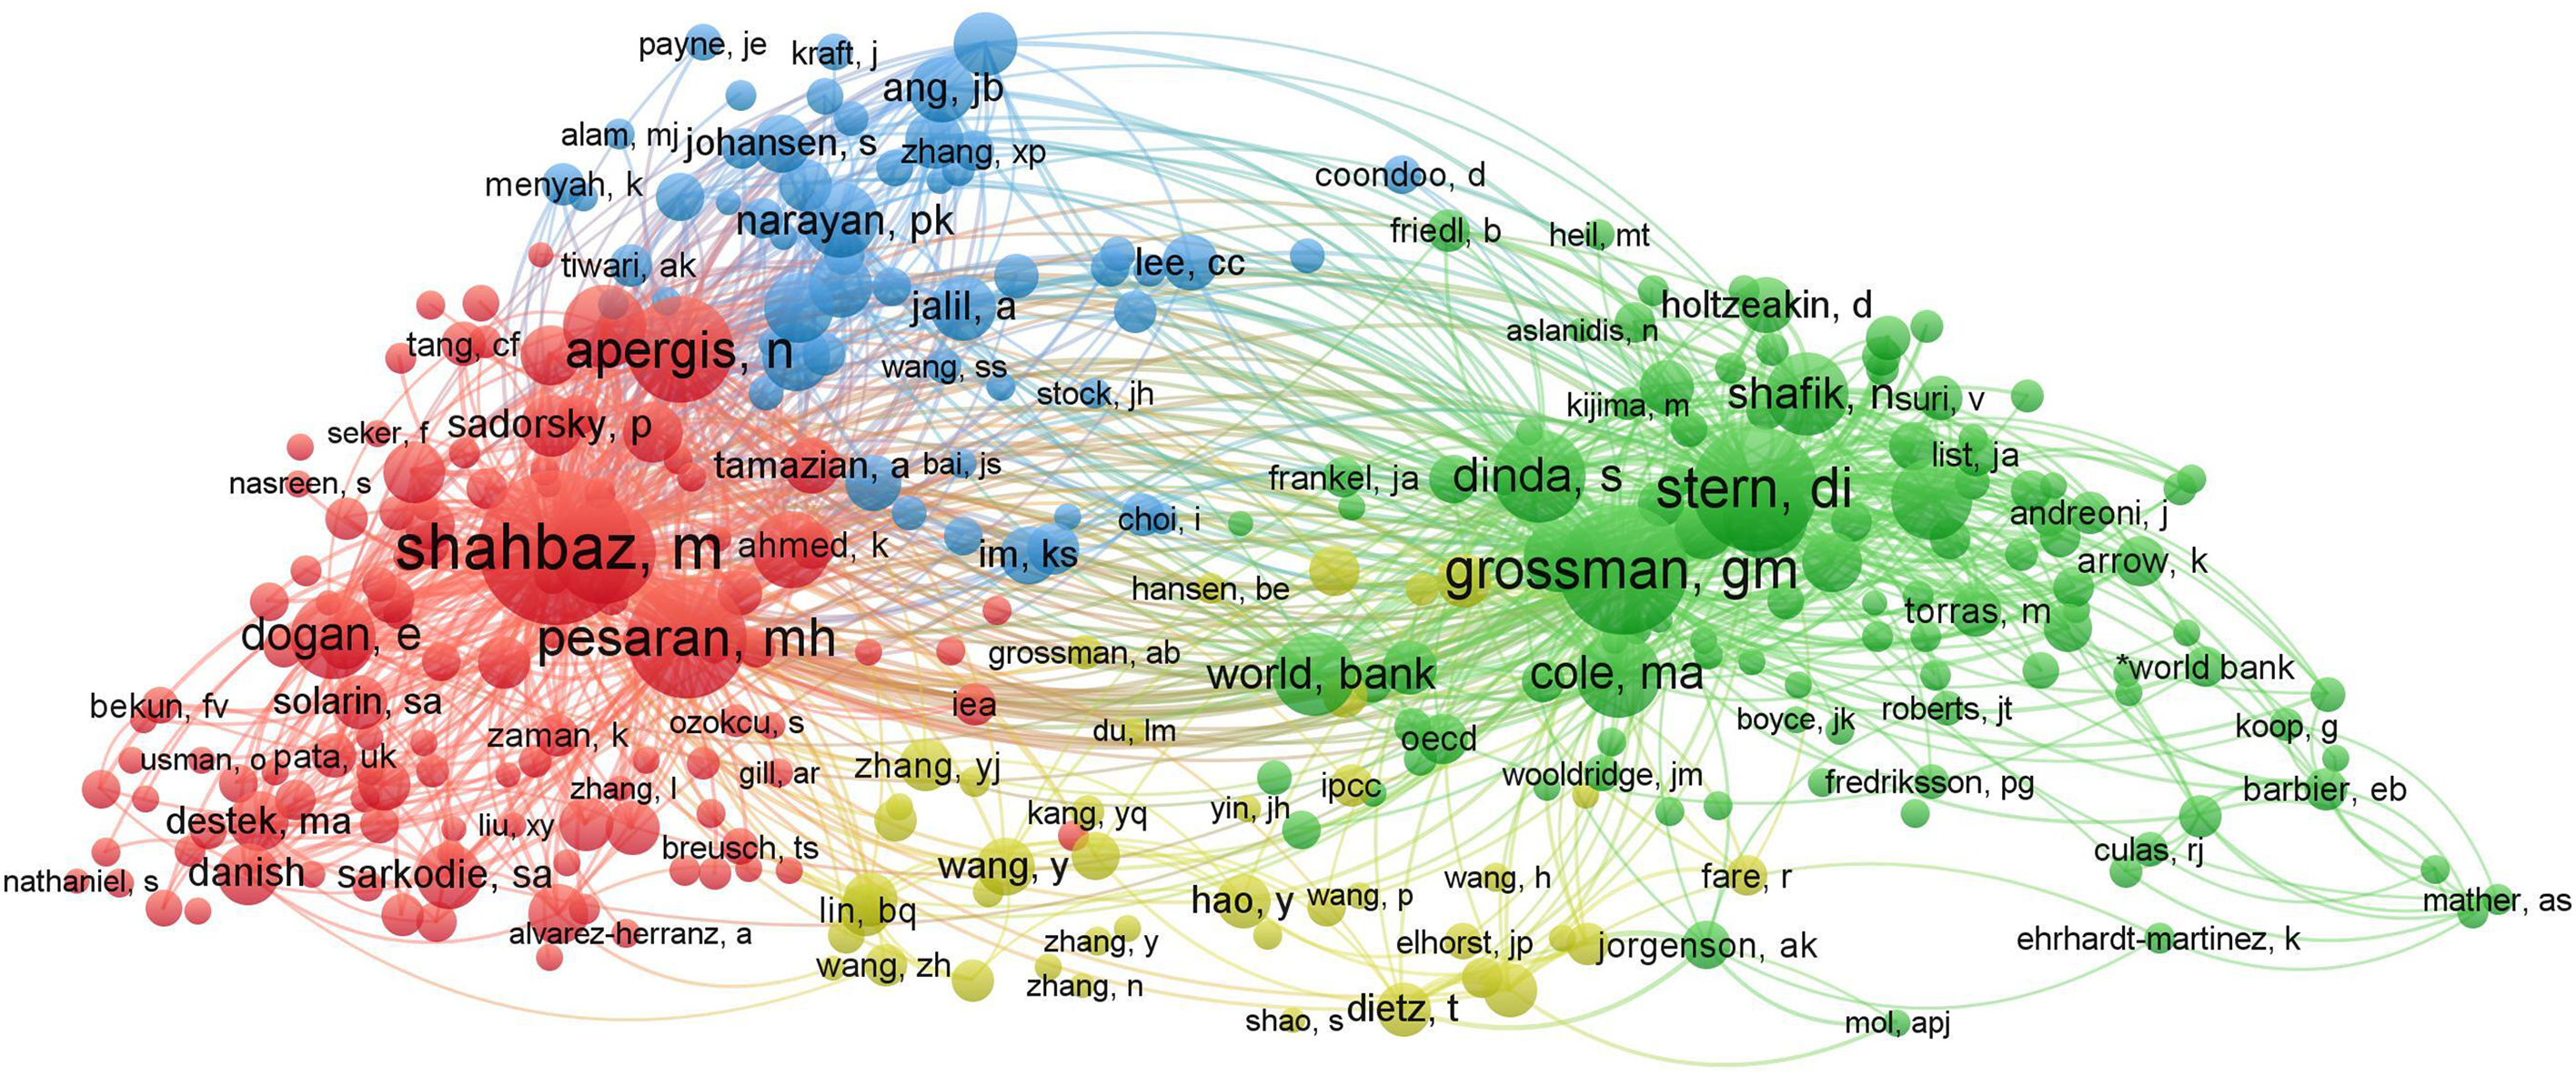
Co-citation of authors network visualization map.
Meanwhile, Mohammad Pesaran contributes to econometrics in time series and panel data analysis methodologies such as linear and nonlinear multivariate models, bounds testing, unit roots, autoregressive distributed lag modelling, panel cross-sectional dependence, impulse response and vector error correction. This shows that author keywords and keywords plus clusters such as panel, panel data, panel data analysis and panel data cointegration are supported. Nicholas Apergis analyzes the EKC hypothesis using panel and country- and state-level data on energy and renewable consumption, economic growth and CO2 emissions. Additionally, Eyup Dogan primarily extends the EKC hypothesis by analysing explanatory variables such as trade, urbanization, financial development towards CO2 emissions or ecological footprints using a wide range of econometrics analysis methodologies.
In the second cluster shown in green node, Gene Grossman's publications have been proven to be highly co-cited. In the early 1990s, Grossman begins to explore economic growth and the environment using neoclassical growth of theory and endogenous growth theories. Thus, his early views and findings on the relationship between economic growth and environment lead to the later authors to consider and cite the points in developing the EKC hypothesis.
David Stern has critically explored the development of EKC between 1990s and 2000s. He discovers that EKC implies that indicators of environmental degradation will grow first and subsequently decrease as income per capita rises. However, the findings may differ between developing and developed countries due to their performance in resolving environmental challenges. To test the EKC hypothesis, a new generation of decomposition models is presented to unravel the true relationship between development and the environment.
Soumyananda Dinda conducts a survey on the EKC hypothesis that includes an overview of the literature, background history, conceptual insights, methodological critique and policy implications. He also uses the framework for the endogenous growth model to verify the EKC hypothesis with an inverted U-shaped relationship between income and environmental degradation.
The third blue-highlighted cluster indicates that Paresh Narayan is one of the most co-cited authors. Narayan contributes knowledge of econometrics analysis methodologies such as cointegration, panel cointegration and Granger causality tests, which have been applied in the studies of energy consumption, real GDP and carbon dioxide emissions in various panels of countries. Im Kyung So also adds to the proposal of unit root tests for dynamic heterogeneous panels, which has been frequently cited in most EKC studies to prove the stationary of their panel data. Furthermore, Abdul Jalil, Lee Chien Chiang and James Ang have received a large number of co-citations for their studies that investigated the EKC for CO2 emissions with economic growth, financial development and energy consumption in various countries using time series or panel data analysis.
The fourth cluster, highlighted in yellow, depicts Hao Yu receiving a high co-citation from the study focusing on the EKC hypothesis for coal consumption using advanced econometric analysis, which is the Spatial Durbin Model. Additionally, Zhang Yue-Jun investigates the decomposition of energy-related carbon emissions at the national and state levels by examining aspects such as financial development, environmental innovation, industrial structure, urbanization and corruption. On the other hand, Dietz Thomas employs analytic tools such as STIRPAT, IPAT and ImPACT to calculate the ecological elasticities of population affluence and other CO2 emission parameters. The measurement includes the effects of fossil fuel combustion, fuel wood, hydropower and nuclear power. He also applies the EKC in the assessment of the nation's wealth and environmental stress based on human well-being.
Cited sources
Figure 9 shows the visualization map of the co-citation of sources network, which has been classified into three major clusters. The first cluster, highlighted in red, depicts that Journal of Cleaner Production possesses the most co-citation. This is supported by the fact that it is ranked second in the Top 20 journals on EKC studies, with 224 articles and a total of 8427 citations.

Co-citation of sources network visualization map.
Ecological Indicator is also one of the most frequently co-cited sources on the network visualization map. This could be attributed to its total number of publications, which includes 77 articles and 4583 citations. Interestingly, Applied Energy is not among the Top 20 publications and citations, yet it is a frequently co-cited source in EKC studies. This explains why Applied Energy is semantically related to Journal of Cleaner Production and Ecological Indicator.
Applied Energy aims to focus on the research areas of energy conversion and conservation, the optimal use of energy resources, analysis and optimization of energy processes, pollution mitigation and sustainable energy systems, which aligns with the goals of Journal of Cleaner Production (Discuss and practical cleaner production, encompassing environmental and sustainability issues in corporations, governments, educational institutions, regions and societies) and Ecological Indicator (Integrate the monitoring and assessment of ecological and environmental indicators with management practices).
The second cluster, shown in green, demonstrates that Energy Policy has the most co-citations. This is reinforced by the fact that it has 128 EKC relevant publications and a total of 15,146 citations. There are three most influential papers on EKC research109,140,141 generated from Energy Policy. Energy Policy considers the economic, social and environmental policy implications for energy supply and consumption.
Besides, both Energy Economics and Energy have a high level of co-citations, which could be attributed to the significant number of EKC studies published, with 82 and 60 publications, respectively, and total citations of 5683 and 5000, respectively. Energy Economics is primarily concerned with study on the exploitation, conversion and use of energy, markets for energy commodities and derivatives, regulation and taxation, forecasting, environment and climate, and monetary policy. Meanwhile, Energy covers research in energy analysis, modelling and prediction, energy planning, energy management, renewable energy, as well as economic and policy issues.
Furthermore, Environmental Science and Pollution Research is one of the most frequently co-cited sources, with the most EKC relevant publications (559) and the third highest number of total citations (8949). Environmental Science and Pollution Research covers research in all fields of environmental science, including research and technology, legislation and regulation, education, literature and institutions. The four journals in this cluster can be considered to be energy management and planning from an economic standpoint to the policy implications on regulation.
The third cluster, highlighted in blue nodes, indicates that Ecological Economics is a significant source in terms of co-citation. This is demonstrated by its three most influential papers, published by York et al., 142 Zhang and Cheng 71 and Soytas et al. 143 Ecological Economics also includes 172 publications on EKC studies, ranking third, and has the highest overall number of total citations with 15,652. Ecological Economics is the study of nature's household (ecosystems) and humanity's household (the economy) in order to improve human well-being, sustainability and justice.
Environment and Development Economics is also known as the significant co-citation of source, which includes 39 EKC relevant publications and 1036 citations. This journal aims to bridge the gap between environmental, resource and development economics research. Moreover, the presence of most influential papers such as Stern and Common, 144 Stern 49 and Stern et al. 81 in both Journal of Environmental Economics and Management and World Development leads to them being highly co-cited in different documents.
The Journal of Environmental Economics and Management publishes theoretical and empirical works that address economic issues concerning natural resources and the environment. Meanwhile, World Development seeks research that investigates methods of improving living standards and the human situation, such as poverty, unemployment, environmental degradation and others. This cluster shows the semantic relationship between economic and environmental themes concerning natural resources and human well-being.
Conclusion
The inverted U-shaped linkage between income and pollution is known as the EKC hypothesis, and it has been widely studied by researchers worldwide since the early 1990s. Indeed, the existence of an EKC hypothesis has been substantiated by a large number of current studies, while others denied the inverted U-shaped linkage between the variables. Researchers have discovered different relationships such as positive, negative, U-shaped and N-shaped between economic growth and environmental degradation. Additionally, EKC researchers have examined the growth-pollution nexus using a variety of environmental indicators, such as atmospheric indicators, land indicators, ocean and biodiversity indicators as well as freshwater indicators.
According to the EKC hypothesis, environmental degradation intensifies throughout the initial stage of economic development. When economic growth reaches a certain threshold level, environmental quality tends to improve as a result of increased environmental awareness. The inverted U-shaped relationship between economic growth and environmental pollution can be justified by scale, composition and technological effects. Also, the inverted U-shaped EKC can be supported by a positive income elasticity of demand for a clean environment and environmental quality is a productive asset.
The findings of the EKC studies provide critical policy recommendations to policymakers in the implementation of appropriate economic and environmental policies that benefit countries by providing economic development and clean environment. This study conducts a bibliometric review of the last three decades on the EKC studies by using descriptive analysis and networking analysis. The descriptive analysis includes publication trends, language, publishers, WoS category and research areas, and citation analysis. On the other hand, networking analysis consists of keyword co-occurrence analysis, co-authorship analysis and co-citation analysis.
The results of publication trend in descriptive analysis illustrate that the EKC hypothesis is gaining traction among researchers. From 1994 through 2020, the number of publications gradually increases. Interestingly, the number of citations increased by 280% between 2016 and 2017. Elsevier appears to be the most productive publisher for EKC studies, followed by Springer Nature. It is not surprising that the two publishers are at the top of the list, considering they both have over 100 years of publishing experience since 1880s. Besides, “Environmental Sciences,” “Economics” and “Environmental Studies” are the most common WoS categories for EKC studies. Most of the EKC studies are related to the area of “Environmental Sciences Ecology”, followed by “Business Economics” and “Science Technology Other Topics”. This reveals that the EKC hypothesis represents a confluence of environmental and economic concerns.
Stern, 49 Selden and Song 50 and York et al. 142 write the most influential papers on the EKC hypothesis, which are published in World Development, Journal of Environmental Economics and Management and Ecological Economics, respectively. Muhammad Shahbaz and Ilhan Ozturk both have the most publications and citations. The leading journals with EKC publications and citations are Environmental Science and Pollution Research, Journal of Cleaner Production, Ecological Economics, Energy Policy and Energy Economics. China's universities, such as Beijing Institute of Technology, Chinese Academy of Sciences and Tsinghua University, and Turkey's universities, such as Eastern Mediterranean University, Cag University and Istanbul Gelisim University, lead the most popular organizations.
The results of keyword co-occurrence analysis from the network analysis show that the main keyword of the EKC is frequently associated to the keywords of economic growth, CO2 emissions, energy consumption, China, renewable energy and financial development. These keywords also appear at the top of each cluster in the author keyword clusters. This is supported by the most frequently used keyword plus and its clusters, which include economic-growth, EKC, CO2 emissions, energy consumption and financial development.
In the co-authorship analysis, Muhammad Shahbaz has the most co-authorships, followed by Ilhan Ozturk, Danish, Zeeshan Khan and Eyup Dogan in their respective clusters. The organization with the most co-authored publications is Beijing Institute of Technology, which is closely associated with Collaborative Innovation Center of Electric Vehicles Beijing, Sustainable Development Research Institute for Economy and Society of Beijing and Beijing Laboratory of Energy Economics and Environmental Management. Moreover, China has been identified as the country with the most publications and co-authorship associated with Taiwan. Furthermore, Turkish authors have worked closely with those from Russia, Nigeria, Sweden, Ghana and Norway. The USA leads the way in terms of co-authorship in EKC studies, together with Poland, Lithuania, Romania and South Korea.
According to the results of co-citation analysis, four clusters are generated for the cited authors and cited sources, respectively. For the cited authors, Muhammad Shahbaz has been the most active researcher in the largest cluster, exploring and reviewing the EKC hypothesis in many countries using econometrics analysis methodologies. Meanwhile, an abundance of research has applied econometric methodologies developed by Mohammad Pesaran. Nicholas Apergis examines the EKC hypothesis using panel and country- and state-level data on energy and renewable consumption, economic growth and CO2 emissions. Additionally, Eyup Dogan principally extends the EKC hypothesis by examining explanatory variables such as trade, urbanization and financial development towards CO2 emissions or ecological footprints. Last but not least, Ecological Indicator is one of the most frequently co-cited sources on the network visualization map and found to be associated to Applied Energy and Journal of Cleaner Production. Co-citations are similarly high in Energy Policy, Energy Economics, Energy and Environmental Science and Pollution Research.
Policy implications
Based on our bibliometric analysis, several key issues or variables, including economic growth, energy consumption and renewable energy, have been heavily adopted by the past EKC studies. Following that, some very important policy implications can be produced. In accordance with the EKC literature, mixed results have been obtained for the relationship between economic growth and pollution. The two most common outcomes revealed are inverted U-shaped and non-inverted U-shaped (e.g. monotonically increasing, monotonically decreasing and U-shaped). In countries with an inverted U-shaped growth-pollution nexus, economic growth can be used as a tool to reduce environmental degradation. Thus, policymakers should implement development and growth-induced policies to improve environmental quality. For countries that have not achieved the turning point suggested by the EKC hypothesis, economic prosperity is expected to harm the environment until a certain level of income threshold is reached. This is particularly true for developing countries due to their ongoing industrialization process. Therefore, for these countries, it is recommended to have policies designed to reduce the adverse effects of economic growth on environmental quality. In relation to this, the development of mitigation strategies such as the promotion of environmentally sound technologies and sustainable use of natural resources is expected to reduce environmental pollution despite robust economic growth.
In addition, energy consumption is found to be one of the main factors affecting environmental degradation. Specifically, massive dependence on fossil fuels—including coal, oil and natural gas, as the major energy source has brought about unsustainable economic development among countries. As mentioned by British Petroleum, 145 fossil fuels still accounted for 84 percent of global total energy consumption. The burning of fossil fuels can cause an excessive buildup of greenhouse gases that leads to global warming. To address the problem of climatic change, it is therefore vital for countries to cut non-renewable energy consumption. Alternatively, the use of renewable energy sources such as solar energy and wind power should be enhanced worldwide. For developing countries, however, it is suggested to have a gradual shift from fossil fuels to renewable energy sources. It is because a drastic switch to renewable energy might dampen economic growth in the developing world. Besides adopting renewables, another way to achieve zero carbon emission is to improve energy efficiency among countries. Well-designed energy efficiency policies and programs, for instance, can help to reduce overall energy usage in a country. The establishment of minimum efficiency standards for electrical appliances and construction codes that mandate certain energy performance requirements for design, materials and equipment in building constructions are some examples of energy efficiency policies that can be practiced to improve energy efficiency.
We find that financial development is another common explanatory variable included in the EKC model. Based on past studies, a significant relationship is revealed between financial development and environmental quality. However, the role of finance in explaining environmental degradation is found to be inconclusive. On one hand, financial development is a main driver for economic growth. Higher income growth leads to increased energy consumption, which in turn harms the environment. On the other hand, financial development facilitates the development of the renewable energy sector that could contribute to better environmental quality. Whether finance would influence environmental quality positively or negatively depends very much on which channel of financial development rules in a particular country or a group of countries. For countries that experience environmental deterioration due to financial development, it is advisable for policymakers to design and implement energy-efficient policies in boosting the positive effects of finance on the environment. This policy recommendation is particularly relevant to developed economies, in which energy demand continues to rise with strong development in their financial sector. 146 Meanwhile, in countries with a favourable financial impact on environmental quality, the development of financial sector has contributed to lower financing cost that facilitates the investment for environmental projects. In such a case, it is vital for policymakers to take financial development into consideration while planning for future emission reduction agendas.
Directions for future research
This study provides important knowledge gaps and recommendations for future research that will facilitate the development and expansion of EKC literature from various perspectives. First of all, future authors may consider examining the EKC hypothesis among the top polluting countries in the world, besides China and United States. A look at the previous research reveals that many studies have been focusing on China and United States—two of the world's top emitters, but not some other countries in the list of top 20 carbon dioxide emitters. d Apparently from our analysis, countries such as Russia, Iran, South Korea, Indonesia, Mexico, South Africa, Brazil and Poland have been neglected by past studies despite their significant role in causing global warming. Thus, future research should look into the relationship between economic growth and environmental degradation in these underexplored countries. The findings of future EKC studies will provide essential policy insights to policymakers in dealing with environmental problems in these countries.
Next, when it comes to research areas, the majority of the current EKC studies have a strong emphasis on topics such as “environmental sciences ecology”, “business economics”, “biodiversity conversation” and “water resources”. In view of the existing COVID-19 pandemic around the globe, it is therefore recommended that future researchers may attempt to incorporate health-related issues into the EKC framework. By considering health elements in the context of EKC, the findings will help to improve not only the quality of health care services, but also environmental quality in the countries examined. For example, even though greenhouse gas emission has fallen across the world due to COVID-19 lockdowns, the prolonged pandemic has caused a tremendous increase in global plastic waste. Since the pandemic, millions of single-use plastics, such as masks and gloves, have been used and discarded around the world. e Without proper waste management, these plastics will enter the environment and cause disastrous effects on the ecosystem. Thus, it would be interesting to scrutinize pandemic-related plastic waste in the context of EKC. Additionally, the concept of EKC can also be applied in the area of healthcare along with the recent COVID-19 pandemic. Due to the pandemic, increased attention has been paid to better understand the linkage between economic development and infectious diseases including COVID-19. It would be important for policymakers to know whether a tradeoff exists between economic prosperity and good health. Therefore, this new strand of research is worth recommending for future studies.
Lastly, in the recent global climate summit–COP26 held in Glasgow, Scotland, 109 countries signed the Global Methane f Pledge to cut methane emissions by 30 percent by 2030. 150 If this global reduction target is met, it could help to eliminate more than 0.2°C warming by 2050. 149 In spite of its importance in causing climate change, methane emissions have rarely been examined in the existing EKC studies as compared to carbon dioxide and sulphur dioxide. Thus, future researchers should take methane emissions into consideration while constructing the EKC model. In other words, it is vital to find out the impact of economic growth on methane emissions, so that appropriate mitigation measures can be developed to reduce the pollutant globally. Moreover, COP26 also stresses on other environmental issues including removal of fossil fuel subsidies, phasing out of coal, reduction of forest loss and alignment of financial sector to net-zero. In order to help address the climate crisis, future research should attempt to incorporate those issues highlighted at COP26 into the EKC framework.
Footnotes
Declaration of conflicting interests
The authors declared no potential conflicts of interest with respect to the research, authorship and/or publication of this article.
Funding
The authors received no financial support for the research, authorship and/or publication of this article