
Abstract
Objectives
Neuropsychiatric systemic lupus erythematosus (NPSLE) is associated with adverse outcomes; however, imaging abnormalities are only detectable by conventional brain magnetic resonance imaging (MRI) in up to 50% of patients. This study investigated the variability in cortical thickness and diffusion tensor imaging (DTI) parameters among patients with NPSLE whose brain morphology appeared normal on conventional MRI.
Methods
This retrospective study enrolled 27 female patients with NPSLE (median age: 41.0 years, range: 22–63 years) and 34 female healthy controls (median age: 37.0 years, range: 24–55 years). None exhibited evident abnormalities on conventional MRI. Regional volumes, cortical thickness, and DTI parameters, including fractional anisotropy (FA) and mean diffusivity (MD), were compared. Age-adjusted multivariable logistic regression analysis was conducted to detect significant NPSLE-associated differences.
Results
No significant differences in grey or white matter volume fractions were observed between the groups. However, the NPSLE group demonstrated significant cortical thinning in the right pars opercularis (2.45 vs 2.52 mm, p = 0.007), reduced FA values in the fornix (0.35 vs 0.40, p = 0.001) and left anterior limb of internal capsule (0.50 vs 0.52, p = 0.012), and increased MD in the fornix (1.71 vs 1.48, p = 0.009) and left posterior corona radiata (0.80 vs 0.76, p = 0.005) compared with those of healthy controls.
Conclusions
Cortical thickness measurements and DTI analyses can be used to detect differential variations in patients with NPSLE who exhibit an otherwise normal brain structure on conventional MRI, indicating the existence of subtle changes despite the absence of obvious macrostructural central nervous system involvement of lupus.
Introduction
Systemic lupus erythematosus (SLE) is a chronic, multifactorial, autoimmune inflammatory disease that predominantly affects women, with an 8–10 times higher incidence than in men, and it is most commonly observed in those of child-bearing age. 1 SLE has a higher prevalence in Asian, Hispanic, and African-American individuals than in Caucasians. 2 Neuropsychiatric SLE (NPSLE) remains the least understood manifestation of the disease, despite it having the highest prevalence (14%–80%) and its significant impact on morbidity and mortality.3–5 The American College of Rheumatology (ACR) established definitions for 19 neuropsychiatric syndromes of the disease in 1999, comprising both the central and peripheral neurological deficits that may manifest. 6 With its diverse clinical presentations, NPSLE remains a diagnostic challenge for rheumatologists.
Magnetic resonance imaging (MRI) plays an important role in the detection of neurological abnormalities. In SLE, the most common presentations on conventional MRI include infarctions, periventricular and subcortical white matter (WM) hyperintensities, and cortical atrophy. 7 However, conventional MRI may reveal no macrostructural abnormalities in up to 50% of patients with NPSLE; 8 therefore, new diagnostic modalities are required to facilitate an accurate assessment in such patients.
Cortical atrophy may be one of the most common findings in patients with SLE.9,10 For example, reduced total brain, grey matter (GM), and cortical volumes have been observed in patients with NPSLE. 10 Compared with the imaging findings in non-NPSLE patients as well as in normal populations, several studies have demonstrated the presence of cortical thinning in various regions in patients with NPSLE, including in the middle and inferior frontal, postcentral, supramarginal, precuneus, and occipital regions, 11 as well as a reduction in thalamic and hippocampal volumes;12–15 however, most of those studies did not exclude individuals with overt structural abnormalities. In non-NPSLE patients exhibiting a normal brain structure, reduced GM and WM volumes have still been observed as compared to the volumes in the normal population. 16 However, it remains to be determined whether patients with NPSLE exhibit cortical thinning, despite having an apparently normal brain structure.
Diffusion tensor imaging (DTI) is a technique based on the diffusion of water molecules, which can be used to calculate the magnitude and orientation of diffusion anisotropy.17,18 DTI is particularly helpful in the assessment of WM tracts, as the flow of water runs parallel to the orientation of axonal fibers. 19 Fractional anisotropy (FA), represented as a scalar value ranging from 0 to 1, is very sensitive to alterations in WM integrity and can be used as an indicator of isotropic to anisotropic movements. In the central nervous system (CNS), water diffusion is usually more anisotropic in WM bundles due to the orientation of the neural tracts. A reduction in FA can be detected in diseases that cause axonal injury and degeneration. The diffusivity values may reflect variability in the restricted movement of water molecules, which can occur in diseases that involve tissue necrosis and the demyelination of nerve fibers. 20 DTI has gradually emerged as a valuable tool for assessing WM integrity and microstructural changes in various pathologies.
Previous studies have demonstrated the presence of WM structural abnormalities in patients with SLE, regardless of whether neuropsychiatric symptoms are present.21,22 However, most of those studies did not exclude populations with structural anomalies that were detectable on conventional MRI, such as those exhibiting WM hyperintensities and ischemic changes. We hypothesized that even patients with NPSLE whose brain structure appears to be normal on MRI would still demonstrate subtle microscopic changes as compared with age- and sex-matched controls. Therefore, this study was conducted to investigate potential differences in cortical thickness and DTI parameters between healthy controls and patients with NPSLE with a normal brain appearance based on conventional MRI.
Materials and methods
Participants
This retrospective cohort study was based on data collected from May 2014 to August 2015. A total of 27 adult female patients (aged 22–63 years) were recruited from the Department of Rheumatology of Taichung Veterans General Hospital. All patients met the 2012 SLE International Collaborating Clinics (SLICC) SLE diagnostic criteria. 23 The NPSLE diagnosis was classified based on the ACR criteria 6 by experienced rheumatologists (KLL and YMC) using a comprehensive approach according to clinical presentation, risk factors, laboratory data, and SLE disease activity. The exclusion criteria included the presence of visible WM lesions on conventional MRI, CNS tumors, infection, and a history of CNS trauma. Male patients were also excluded due to potential sex-related differences in brain structure in patients with SLE. Thirty-four age-matched women with no personal or family history of systemic autoimmune diseases were recruited as the control group.
Individuals from both groups underwent the Montreal Cognitive Assessment (MoCA), Mini-Mental State Examination (MMSE), and Frontal Assessment Battery (FAB) for cognitive assessment24–26 on the same day as the MRI studies were conducted. Disease activity in the NPSLE group was evaluated according to the SLE Disease Activity Index 2000 (SLEDAI-2K) scores. 27 Laboratory data, including anti-double stranded DNA (anti-dsDNA), anti-cardiolipin immunoglobulin G/M (IgG/IgM), anti-β2-glycoprotein-1 (anti-B2GP1) IgG/IgM, lupus anticoagulant (LA), and complement component 3 and 4 (C3 and C4) levels were collected, both before and at a timepoint closest to the MRI examination (mean duration, 18.9 days before the MRI). Anti-dsDNA antibodies were detected via enzyme-linked immunosorbent assay (ELISA) using the QUANTA Lite dsDNA (Inova Diagnostics, CA, USA) reagent. The levels of anti-cardiolipin and anti-B2GP1 antibodies were measured using QUANTA Lite ELISA (Inova Diagnostics) and QUANTA flash assays (Inova Diagnostics). The C3 and C4 levels were quantified using the turbidimetric inhibition immunoassay. The cut-off values for the normal ranges of each parameter were as follows: anti-dsDNA, 0.0–92.6 World Health Organization (WHO) units/mL; anti-cardiolipin IgG, <15 IgG phospholipid units (GPL); anti-cardiolipin IgM, <12.5 IgM phospholipid units (MPL); anti-B2GP1 IgG, <20 standard IgG units (SGU); anti-B2GP1 IgM, <20 standard IgM units (SMU); C3, 84–160 mg/dL; and C4, 12–36 mg/dL. A positive lupus anticoagulant result was determined if the screening–confirmation ratio was ≥1.2. This study was approved by the institutional review board of Taichung Veterans General Hospital (IRB number: CF14038, CG19129B). All participants with NPSLE and healthy controls provided written informed consent, and the study was conducted in accordance with the tenets of the Declaration of Helsinki.
MRI acquisitions
All participants underwent MR examinations using a 1.5 T MRI scanner (Aera, Siemens, Erlangen, Germany). The MR protocol included a T1 3-dimensional (3D) magnetization prepared rapid gradient echo (MPRAGE) sequence (echo time [TE], 3.98 ms; repetition time [TR], 2800 ms; field of view [FOV], 256 mm; inversion time, 930 ms; 3.0-mm section thickness; matrix, 256 × 256; flip angle, 8°; voxel size, 1 × 1 × 1 mm), an axial fluid-attenuated inversion recovery (FLAIR) sequence (TE, 350 ms; TR, 5000 ms; FOV, 256 mm; inversion time, 1800 ms; matrix size, 256 × 224; flip angle, 120°), an axial and coronal T2 sampling perfection with application-optimized contrasts using different flip angle evolutions (SPACE) sequence (TE, 280 ms; TR, 3000 ms; echo-train-length, 190; FOV, 256 mm; matrix size, 256 × 224; flip angle, 120°), and a diffusion-weighted echo-planar (EP) sequence (TE, 107 ms; TR, 10,000 ms; FOV, 256 mm; matrix size, 128 × 128; flip angle, 90°; 30 directions; number of excitations, 3; voxel size, 2 × 2 × 2 mm3; b = 1000 s/mm2). The images were reviewed by an experienced neuroradiologist for assessment and further processing or analysis.
Image processing and data analysis
Cerebral volume analysis
Cerebral volumetric analysis was performed using Statistical Parametric Mapping (SPM) software (http://www.fil.ion.ucl.ac.uk/spm/). The segmentation was based on a template for the GM, WM, and cerebrospinal fluid (CSF) to derive an initial estimate of the type of tissue each voxel most likely belonged to. The software performed tissue segmentation, registration, and intensity-bias correction, followed by segmentation of the input image into GM, WM, and CSF components. The GM and WM fraction represented the percentage of the volume in each region within the total intracranial volume (including all GM, WM, and CSF volumes). The volume fractions were used for statistical analysis.
Cortical thickness
Image processing was conducted using the tools included in FreeSurfer version 6.0 (http://surfer.nmr.mgh.harvard.edu) for sagittal 3D-MPRAGE T1-weighted images. FreeSurfer is a well-documented program and is widely utilized for surface-based morphometric analysis, the full methodology of which has been described previously. 28 The processing included the following steps: stripping of all non-brain tissues; automated Talairach transformation; volumetric labeling; signal-intensity normalization; topology-error correction; and reconstruction and registration of the WM, GM, and CSF surfaces. By measuring the distance between the GM/WM interface and the GM/CSF interface at each vertex, the cortical thickness was extracted and subsequently mapped onto the inflated surface to diminish interference from the cortical folds. The Desikan-Killiany-Tourville (DKT) atlas was used for cortical parcellation.
DTI
Whole-cerebral WM tracts based on the FA, mean diffusivity (MD), axial diffusivity (DA), and radial diffusivity (DR) were identified using the Functional Magnetic Resonance Imaging of the Brain (FMRIB) Software Library v5.0 (FSL; http://www.fmrib.ox.ac.uk/fsl) and SPM software, and 68 WM tracts were extracted with the assistance of the region of interest (ROI) stereotaxic atlas created by Susumu Mori. 29
Statistical analysis
Statistical analyses were performed using Statistical Package for the Social Sciences (SPSS) statistical analysis software, version 22.0 (IBM SPSS statistics, Chicago, IL, USA). All continuous variables were compared between groups using the Mann–Whitney U test, whereas nominal variables were compared using either Fisher’s exact test or the chi-square test. Logistic regression analysis was performed to identify the significantly different parameters that were associated with NPSLE, after adjusting for age. Due to the small number of DTI parameters, the unit was set as 10−5 for statistical calculation, and p-values less than 0.05 were indicative of statistical significance.
Results
Demographic data
Demographics of the participants included in the overall study cohort and the SLE and control sub-cohorts
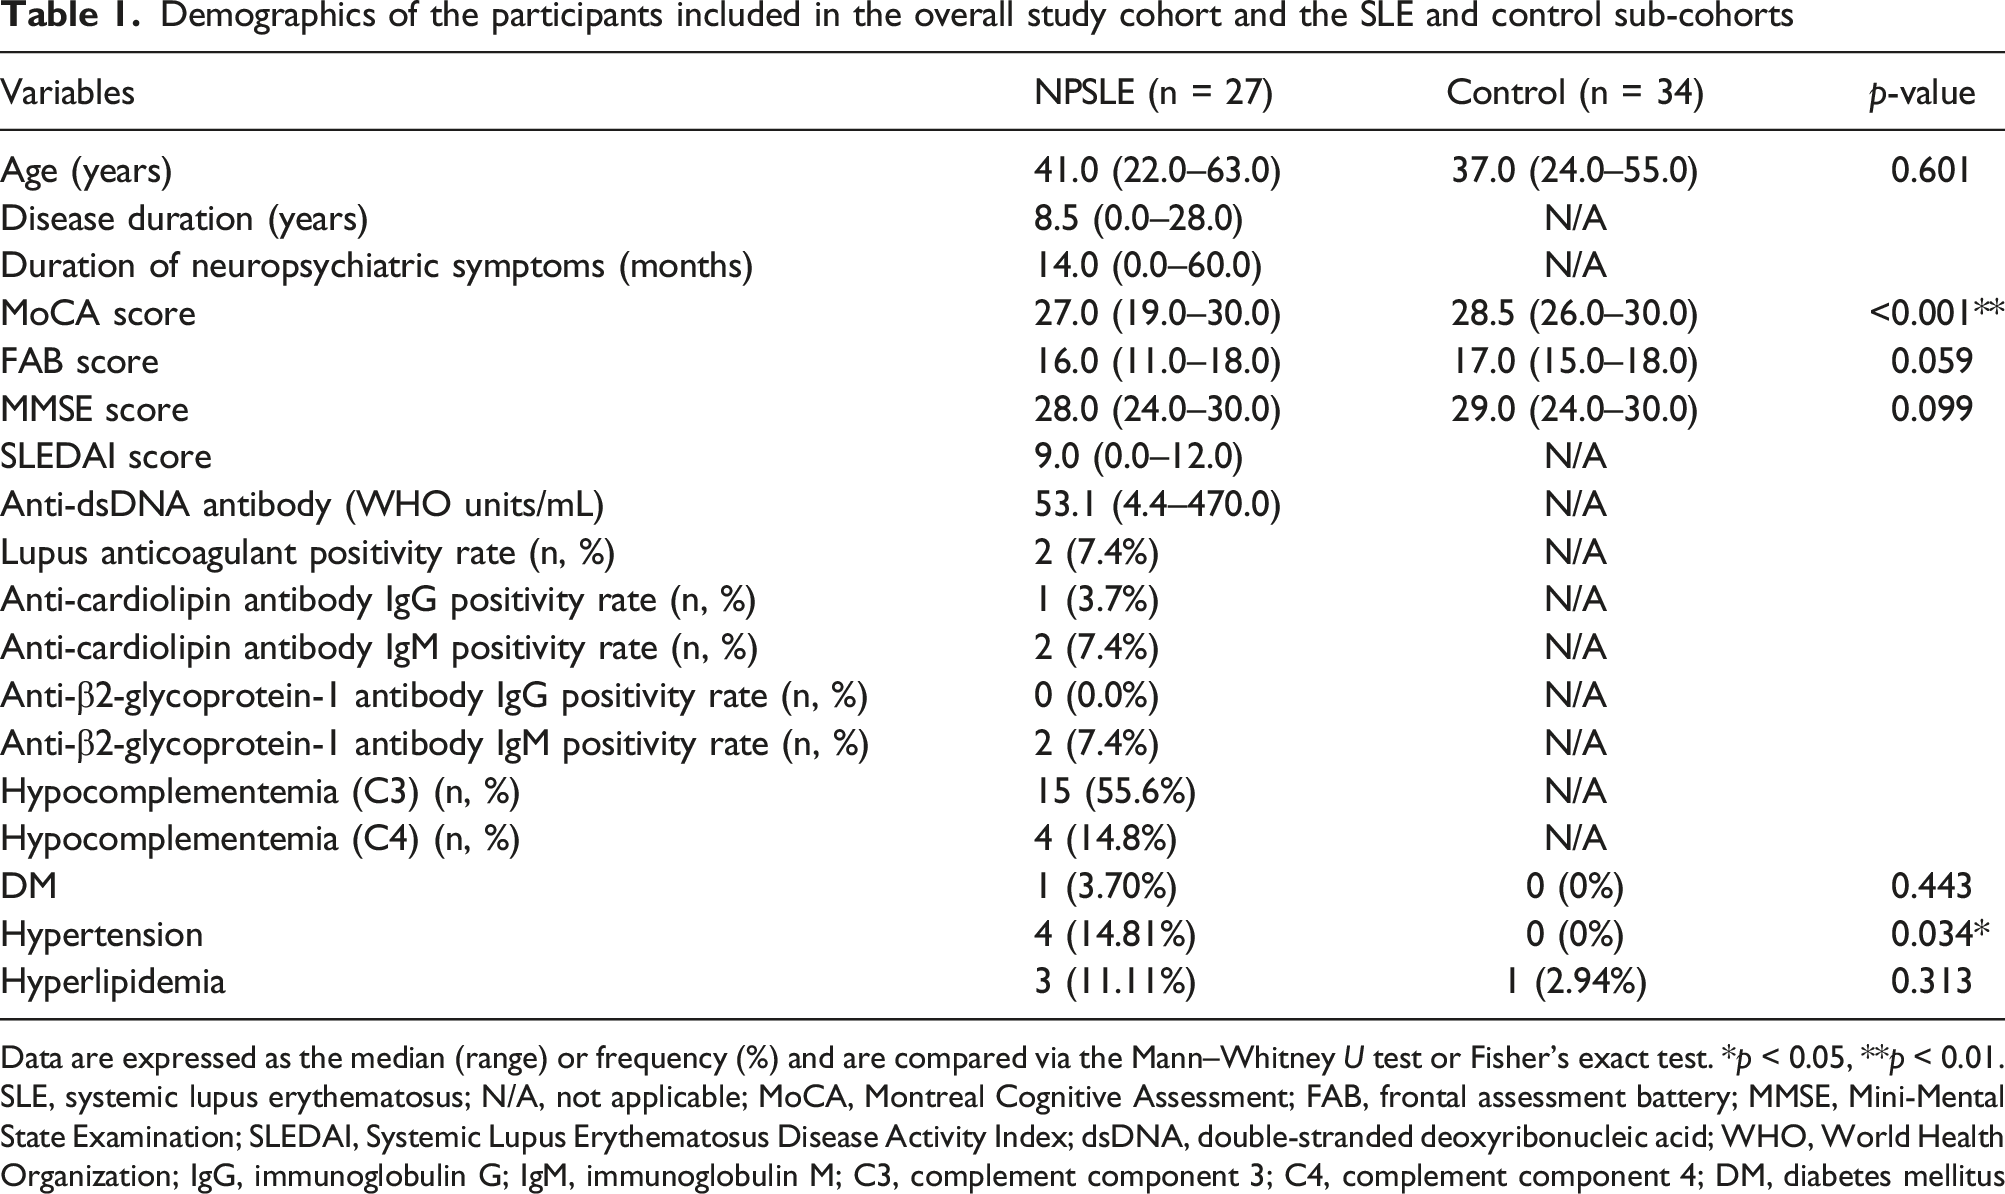
Data are expressed as the median (range) or frequency (%) and are compared via the Mann–Whitney U test or Fisher’s exact test. *p < 0.05, **p < 0.01.
SLE, systemic lupus erythematosus; N/A, not applicable; MoCA, Montreal Cognitive Assessment; FAB, frontal assessment battery; MMSE, Mini-Mental State Examination; SLEDAI, Systemic Lupus Erythematosus Disease Activity Index; dsDNA, double-stranded deoxyribonucleic acid; WHO, World Health Organization; IgG, immunoglobulin G; IgM, immunoglobulin M; C3, complement component 3; C4, complement component 4; DM, diabetes mellitus
SPM volumetric and cortical thickness analysis
Comparison of SPM volume analysis between patients with NPSLE and healthy controls
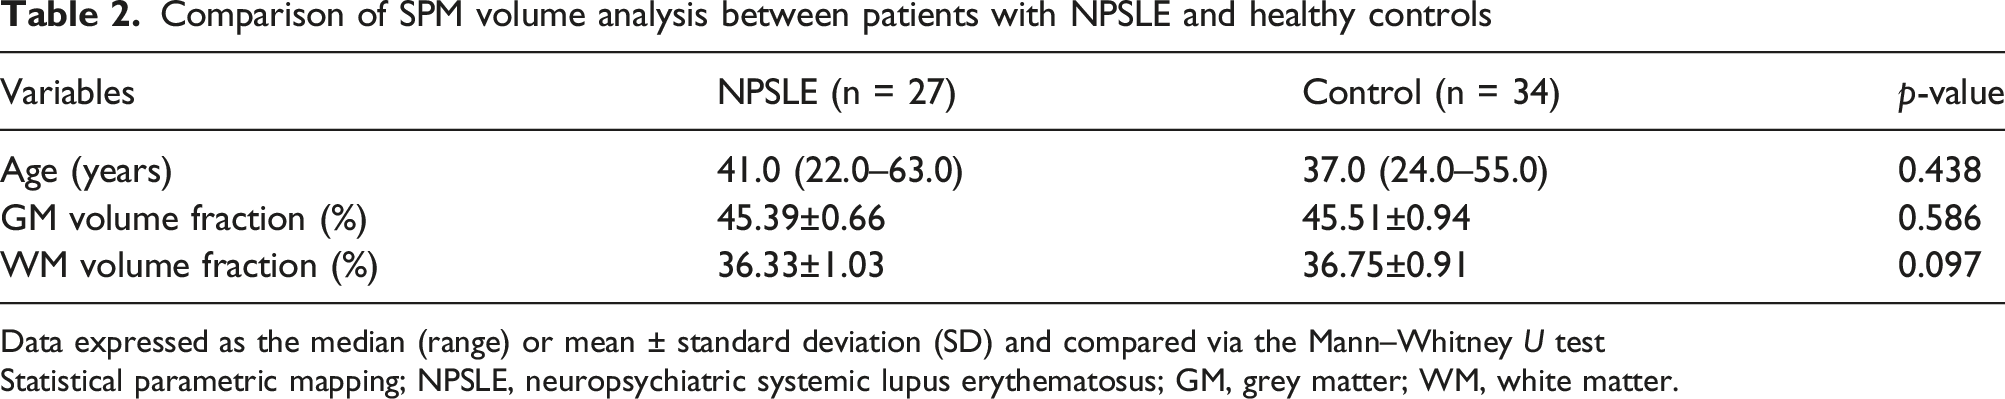
Data expressed as the median (range) or mean ± standard deviation (SD) and compared via the Mann–Whitney U test
Statistical parametric mapping; NPSLE, neuropsychiatric systemic lupus erythematosus; GM, grey matter; WM, white matter.
Comparison of cortical thickness by region between patients with NPSLE and healthy controls
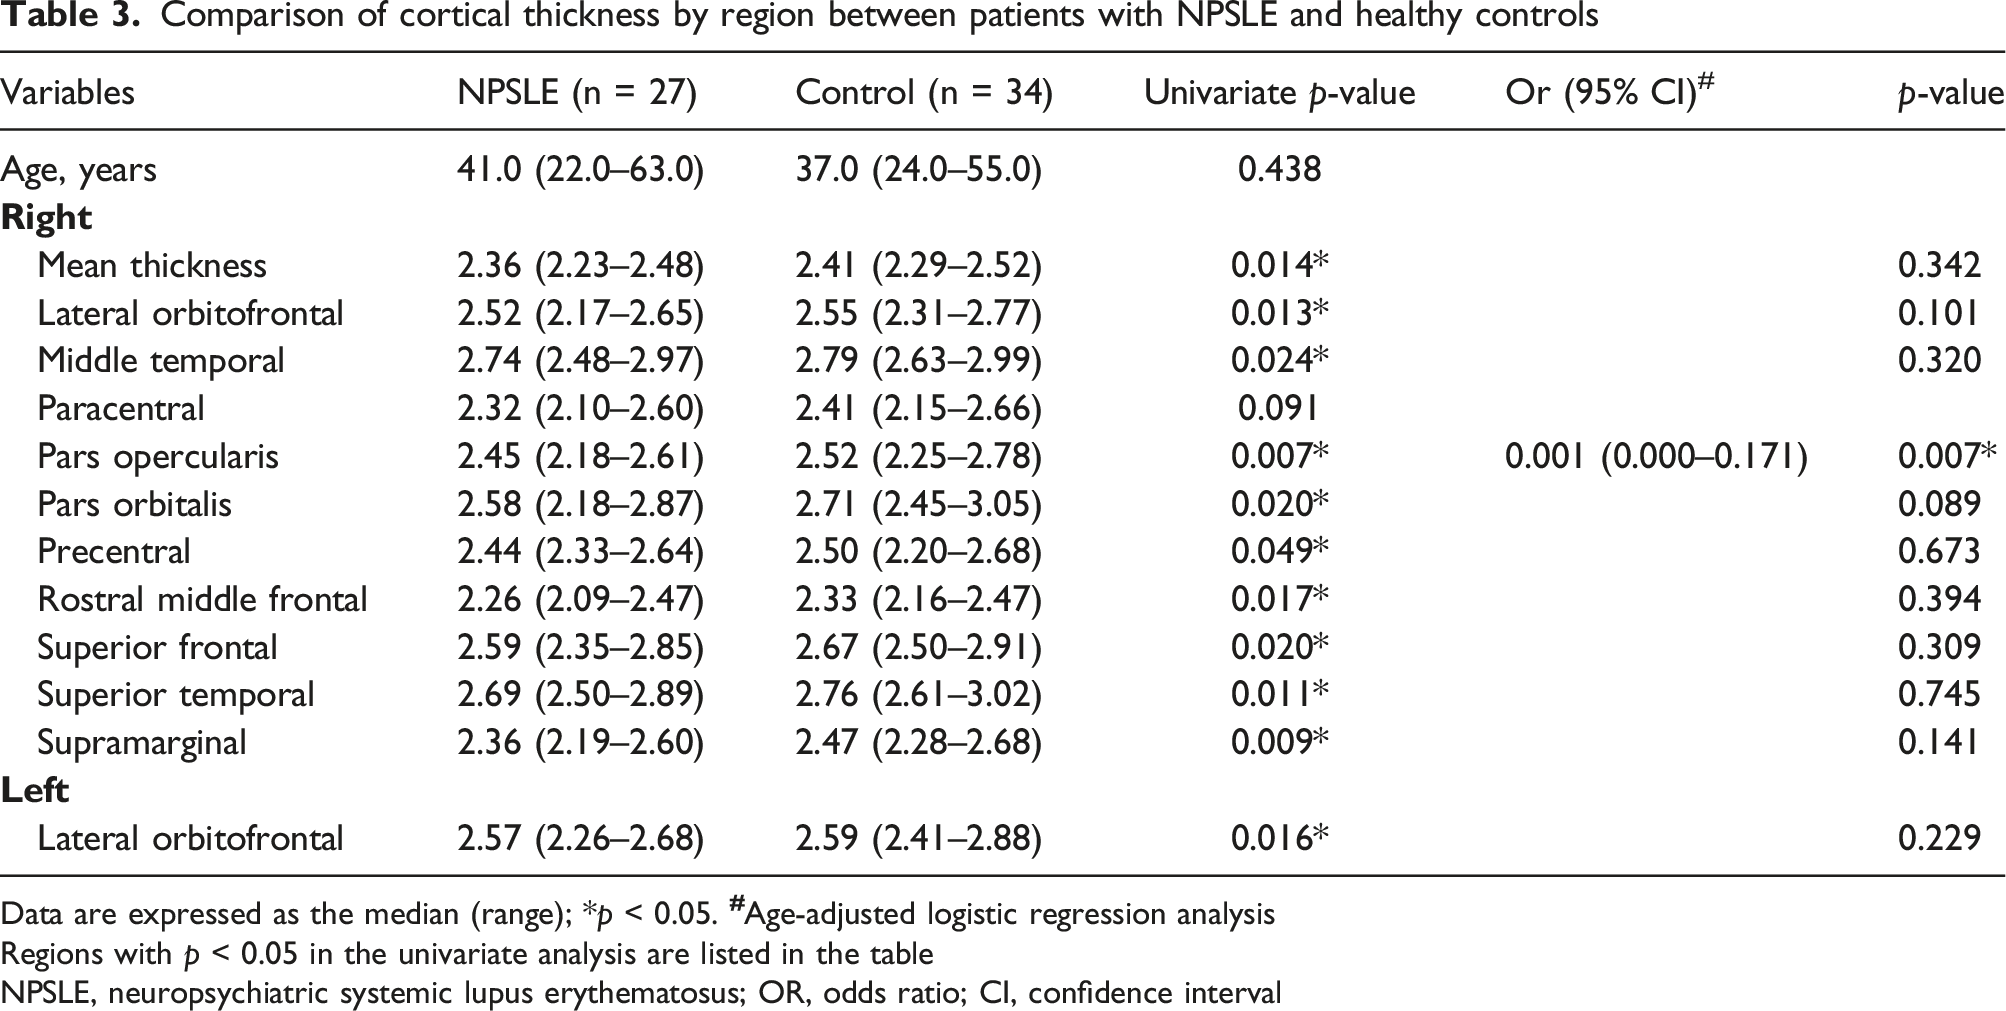
Data are expressed as the median (range); *p < 0.05.
Regions with p < 0.05 in the univariate analysis are listed in the table
NPSLE, neuropsychiatric systemic lupus erythematosus; OR, odds ratio; CI, confidence interval
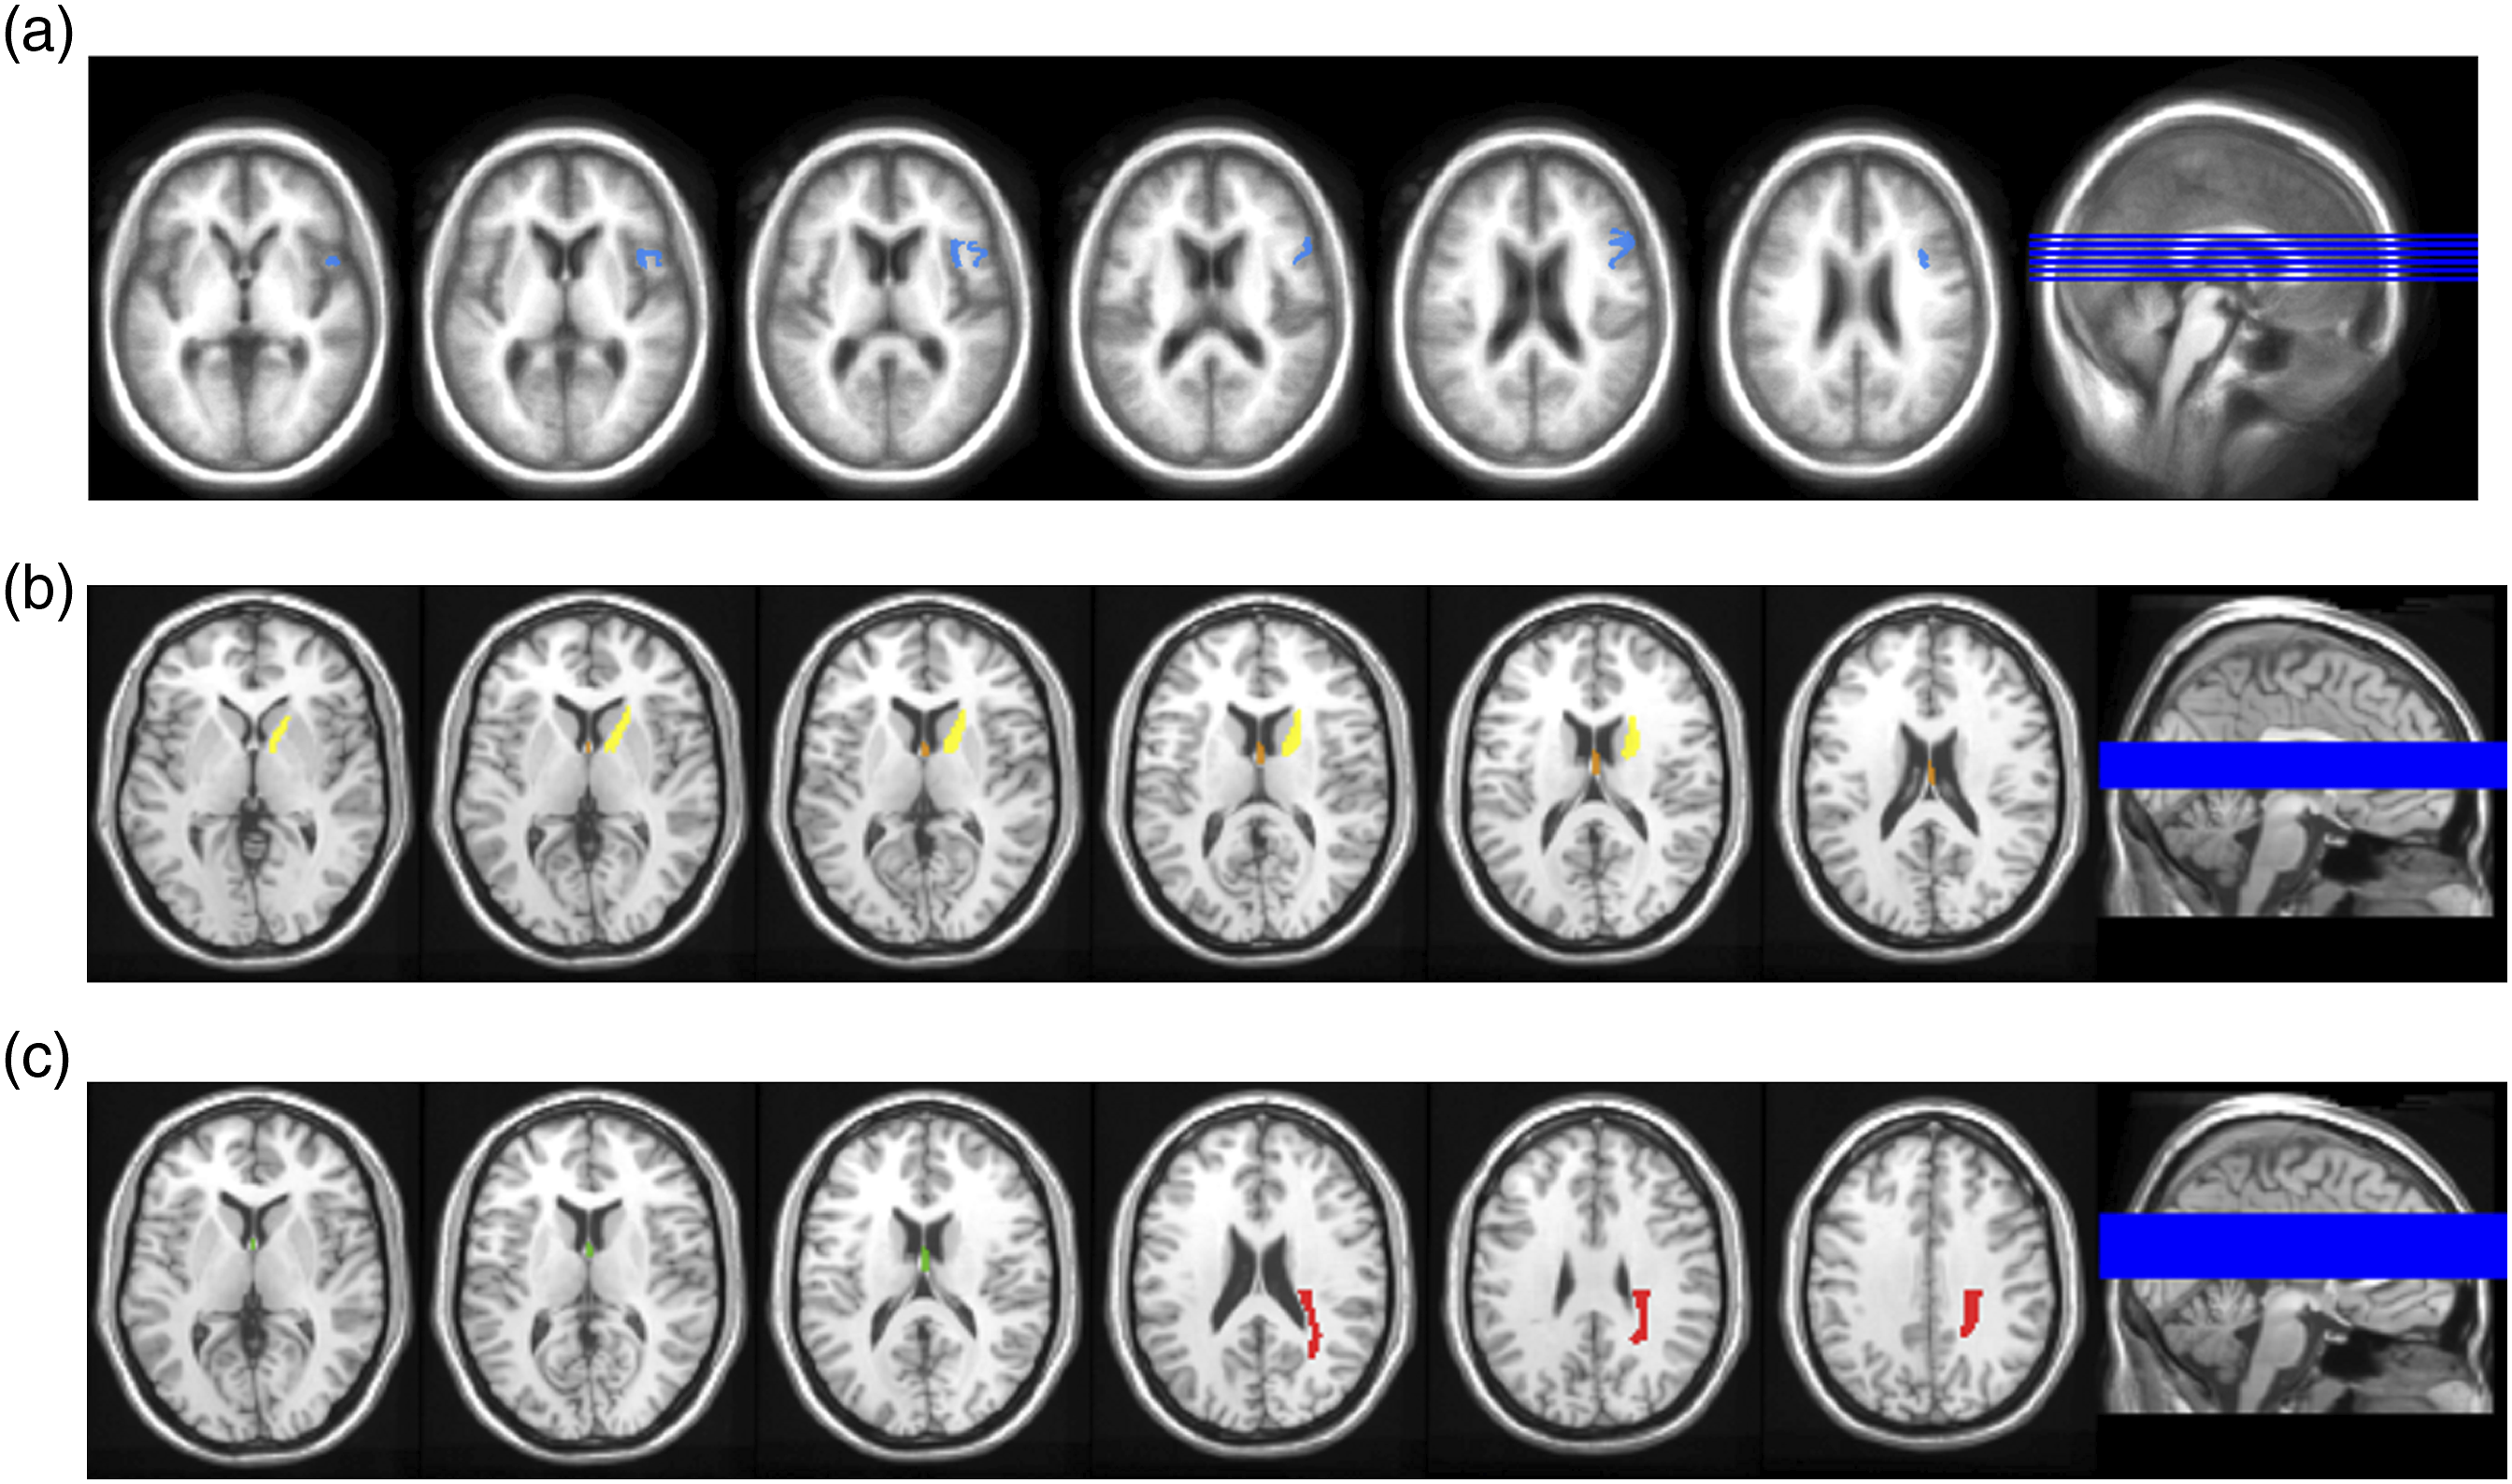
Colored mapping of regions with significant differences between patients with NPSLE and healthy controls. (a) The cortical thickness of the pars opercularis in the right hemisphere (blue) is significantly thinner in the NPSLE group. (b) A significant decrease in fractional anisotropy (FA) is observed in the fornix (orange) and left anterior limb of the internal capsule (yellow) in the NPSLE group. (c) A significant increase in mean diffusivity (MD) is observed in the fornix (green) and in the left posterior corona radiata (red) in the NPSLE group.
Analysis of cerebral WM tracts by DTI
Comparison of fractional anisotropy (FA) findings by region between patients with NPSLE and healthy controls
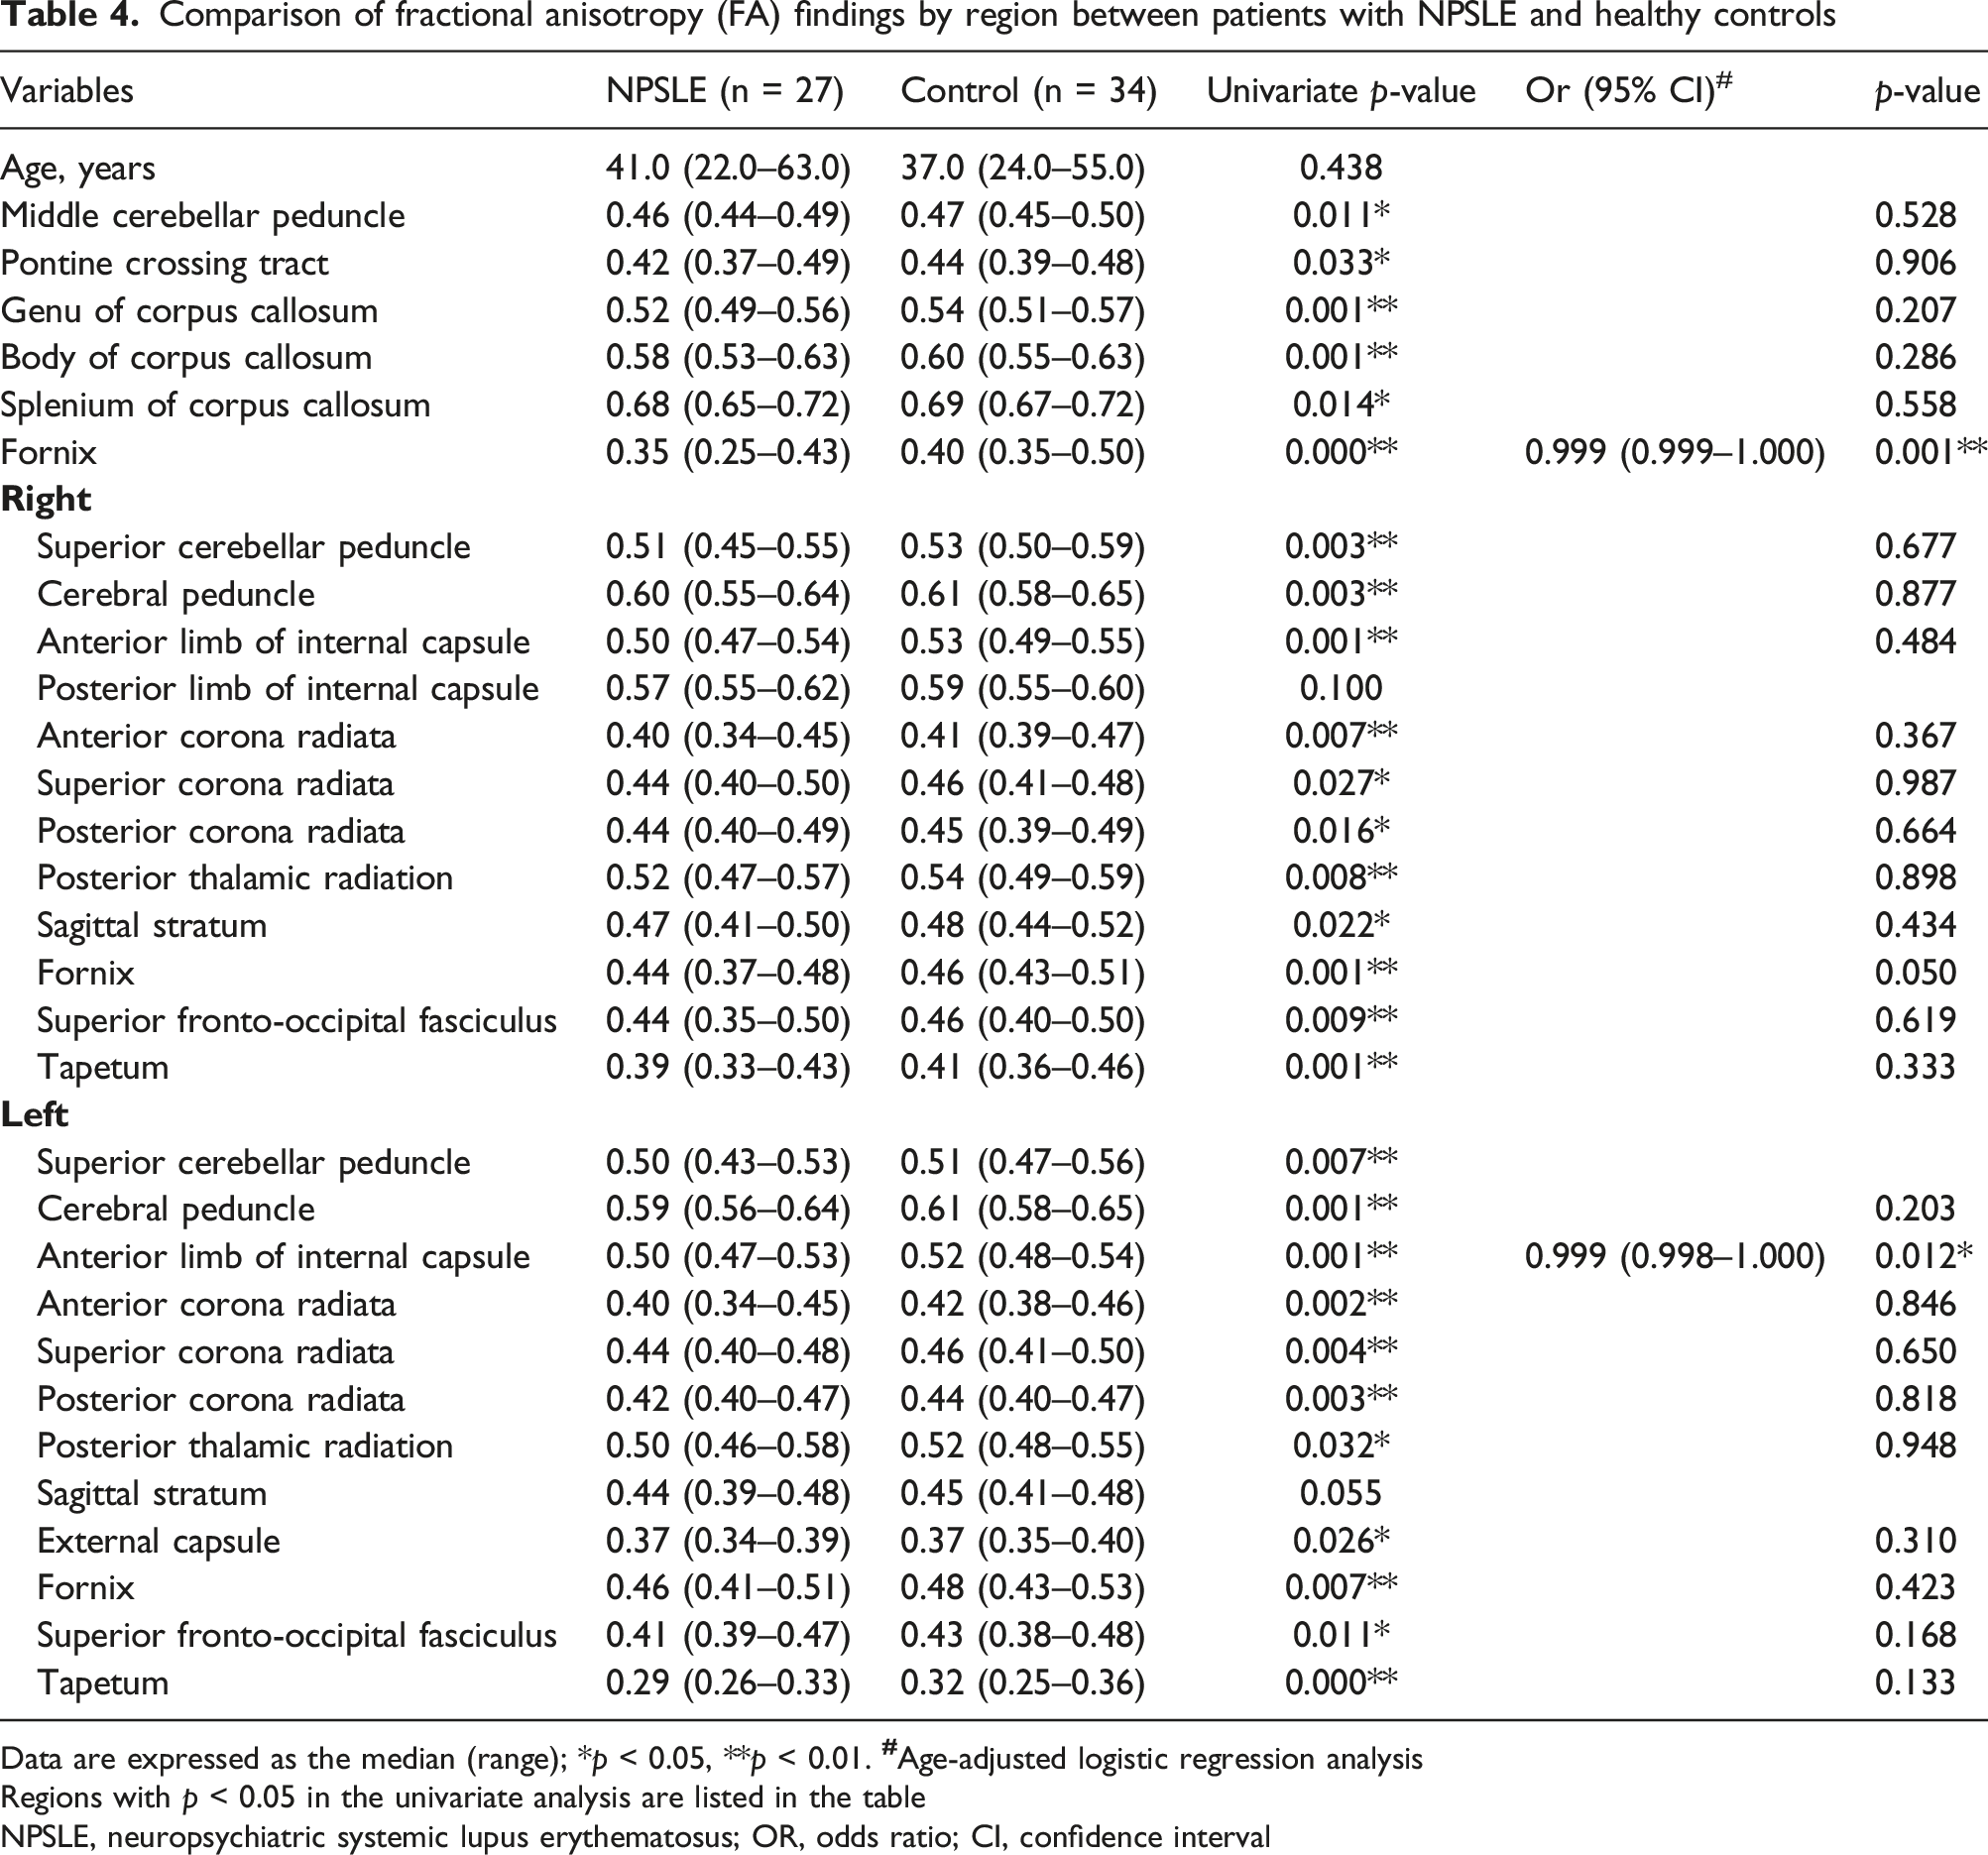
Data are expressed as the median (range); *p < 0.05, **p < 0.01.
Regions with p < 0.05 in the univariate analysis are listed in the table
NPSLE, neuropsychiatric systemic lupus erythematosus; OR, odds ratio; CI, confidence interval
Comparison of mean diffusivity (MD) values by region between patients with NPSLE and healthy controls
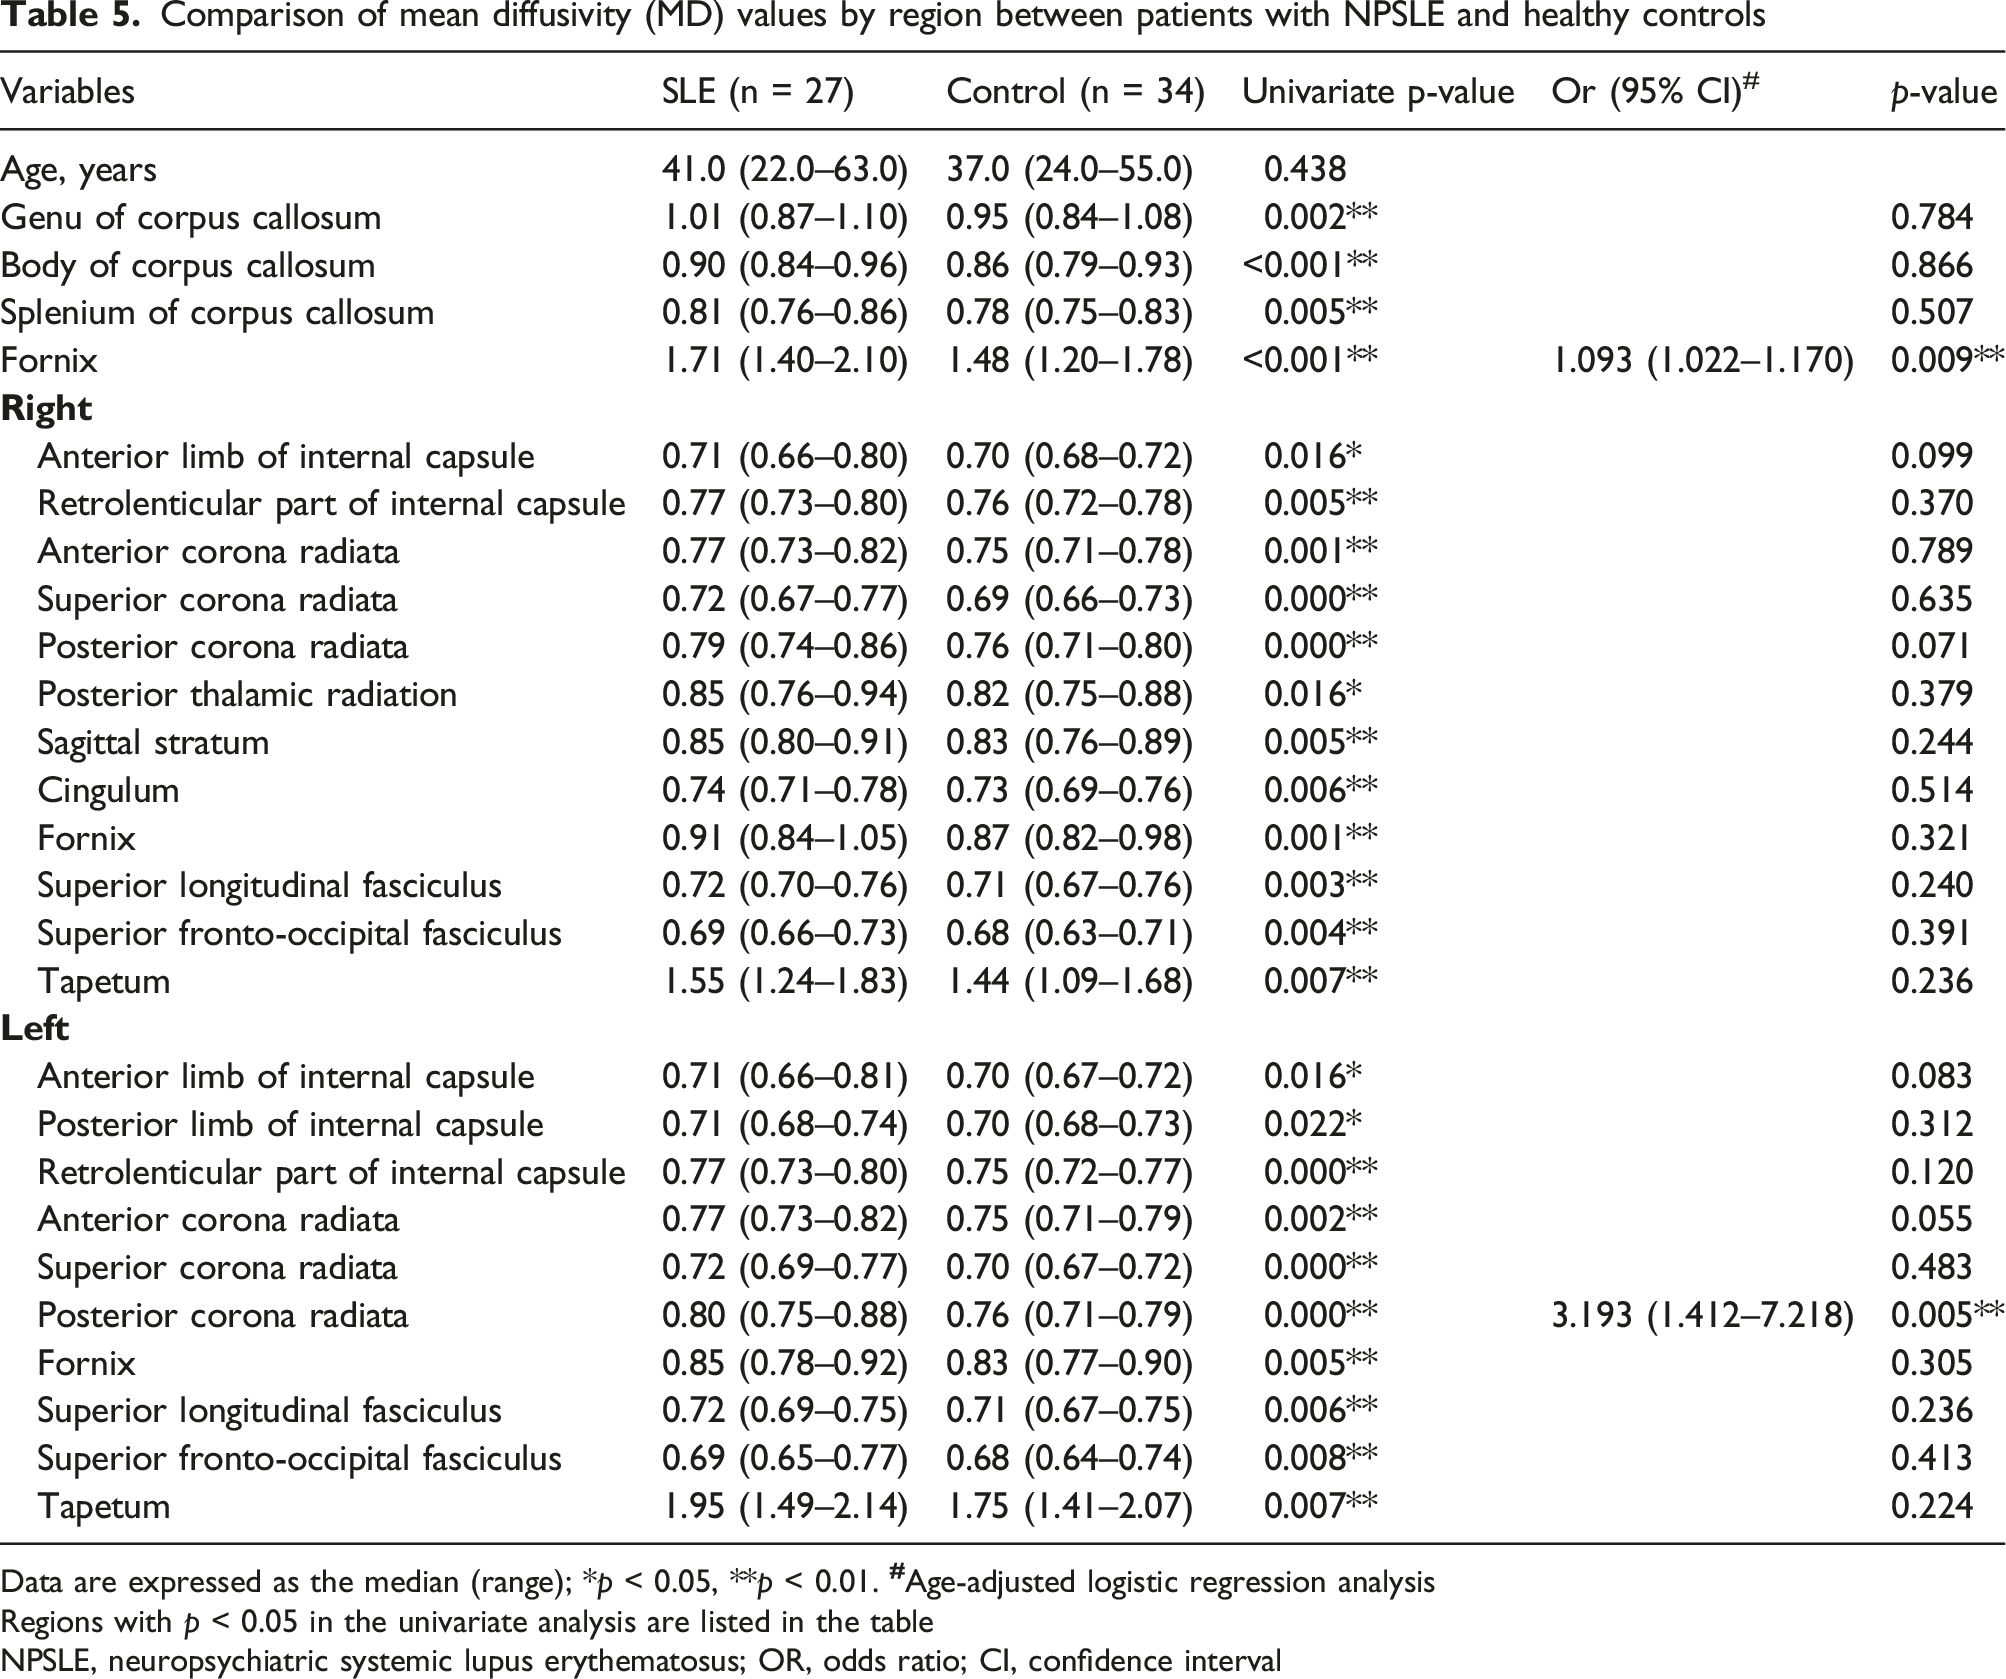
Data are expressed as the median (range); *p < 0.05, **p < 0.01.
Regions with p < 0.05 in the univariate analysis are listed in the table
NPSLE, neuropsychiatric systemic lupus erythematosus; OR, odds ratio; CI, confidence interval
Discussion
In this study, the SPM analysis revealed no significant differences in the GM and WM volume fractions between the patients NPSLE and the healthy controls, confirming the absence of macroscopic brain atrophy in our patient group. However, the ROI-based cortical thickness analysis and DTI demonstrated microscopic changes in several regions, indicating that it is feasible to identify subtle CNS involvement of lupus through cortical thickness and DTI analyses. Whether such findings warrant the adjustment of immunosuppressant regimens in certain individuals deserves further exploration.
The reported prevalence of brain atrophy in patients with NPSLE has varied widely depending on the study, although it may occur in up to 67% of patients with SLE and NPSLE. 30 The manifestation of this atrophy often occurs at an earlier age in patients with NPSLE than it does in the normal population (mean age 42.5 years in 6.0%–18.5% of patients). 30 Brain atrophy is sometimes evident in conventional image studies, presenting as a reduction in GM and WM volumes as well as the widening of sulci and ventricles. However, our results showed that volumetric analysis based on SPM may not be sensitive enough to detect minute changes, suggesting that a novel imaging modality is required to fill the diagnostic gap in certain situations.
Our age-adjusted analysis demonstrated a significant degree of cortical thinning at the pars opercularis of the right hemisphere in patients with NPSLE. Cortical thinning in this area has been reported in patients with and without NPSLE.11,14 Zimmermann and colleagues compared the regional cortical thickness between neurological (N-SLE) and psychiatric SLE (P-SLE) groups and noted that the N-SLE group exhibited significantly greater cortical thickness values than the P-SLE group in the right pars opercularis. 31 The pars opercularis, along with the pars triangularis and the pars orbitalis, forms the inferior frontal gyrus and is the most caudal segment of the three areas. The pars opercularis and the pars triangularis correspond to the location of Broca’s area in the dominant hemisphere, which is involved in language-based communication and comprehension. The same cortical region in the non-dominant hemisphere is involved in gesticulation, imitation, facial expression, and speech intonation.32,33 Only a few studies have discovered a connection between this area and the pathogenesis of NPSLE.14,31 As the majority of the patients with NPSLE enrolled in this study could be categorized as having cortical dysfunction, we hypothesize that the cortical thinning observed in the language area coincides with an impairment of verbosity that is characterized by the inability to identify the right words, which is a common finding in patients with lupus with CNS involvement. Further studies are required to confirm the association between certain brain segments and the corresponding domains of cortical dysfunction.
The results reported here are consistent with the findings of previous studies. Compared with those seen in the healthy controls, the participants with NPSLE exhibited reduced FA values and increased MD, DA, and DR values in multiple WM tracts, including in the bilateral corpus callosum, fornix, internal capsule, corona radiata, and tapetum. The multivariable logistic regression analysis revealed a significant reduction in FA in the fornix and the left anterior limb of the internal capsule, an increase in MD in the fornix and the left posterior corona radiata, an increase in DR in the fornix and left anterior limb of internal capsule, and an increase in DA in the fornix and left posterior corona radiata.
A systematic review of DTI findings in patients with SLE showed a reduction in FA and an increase in MD values in both NPSLE and non-NPSLE groups as compared to those in healthy controls. 34 Some studies have reported lower FA and higher MD values in several WM regions of patients with NPSLE than in those of non-NPSLE patients. In most studies that have compared patients with NPSLE with normal controls, the FA values were significantly lower in the corpus callosum, prefrontal, frontobasal, temporal regions, thalamus, cingulum, and corticospinal tracts,35–40 whereas the MD values were increased in both NPSLE and non-NPSLE patients, mainly in the corpus callosum, corticospinal tract, corona radiata, and cingulum.39,41–43 All of these findings are consistent with the results of our study.
The fornix is a midline WM bundle consisting of two major components that connect to the hippocampus and subcortical structures. Although the exact function of the fornix is not fully understood, several studies have detected its involvement in cognitive function and memory.44–46 Fletcher and colleagues found that the presence of even microscopic changes in the fornix were strong predictors of episodic memory performance, regardless of age or related structural pathology. 47 The reduction in FA and the increase in MD values were mainly found in the body and columns of the fornix. Patients exhibiting pathological changes in these areas were reported to experience both retrograde and anterograde amnesia. 46 The reduced MoCA score observed in the patients with NPSLE in our study might be explained by microstructural changes in the fornix. However, the reason why the fornix is more vulnerable than other areas to such changes remains unknown.
The analysis of anisotropy and diffusivity may provide some benefits in terms of evaluating possible WM tissue damage in patients with SLE and the correlated clinical outcomes and disease activity. Previous studies that have evaluated longitudinal changes in the WM integrity in patients with SLE have reported a decrease in FA and an increase in MD in the follow-up exams, which remain unrelated to symptomatic activity.48,49 In contrast, Mackay and colleagues reported that both metabolic and microstructural abnormalities in patients with SLE correlated with cognitive impairment that remained unchanged over a mean follow-up period of 15 months. 50 Further studies are needed to investigate whether reduced FA and increased MD values in the corresponding brain regions are indicative of specific deficits in various domains of NPSLE, as this information could guide prompt immunosuppressive treatment and follow-up assessments to improve therapeutic outcomes.
Several limitations of this study must be noted. First, we only included patients from a single institution. Our results could be underpowered due to an insufficient sample size, and the study lacked a group of non-NPSLE patients for comparison. Due to the small size, it was not feasible to confirm the area of decreased cortical thickness, DTI differences in WM tracts, or the pathogenesis of NPSLE. Second, the category and severity of the neuropsychiatric symptoms experienced by the patients were not associated with the cortical thickness and DTI results. Therefore, we cannot draw any conclusion as to the correlation between cortical thinning, DTI parameters, and lupus disease activity, and further studies will be needed to assess these relationships. Third, the MoCA used in this study to evaluate cognitive performance has been shown to have low specificity, and it may not have adequate validity in the assessment of cognitive impairment. 51 Finally, the cross-sectional study design prohibited an observation of how the FA and MD values might change following immunosuppressive treatment. However, our study has some strengths. Given the immense heterogeneity of NPSLE, the tools for clinical diagnosis and assessment may make it very challenging to detect CNS involvement. All of the patients with NPSLE included in this study exhibited a normal CNS appearance based on conventional MRI; nevertheless, by using advanced MR techniques, we were able to detect subtle microstructural differences in these patients. We believe the findings in our patient group build on those of previous studies and may provide additional tools to aid in NPSLE evaluation. Further studies with a larger sample size and longitudinal follow-up are needed to confirm the relationship between these microstructural changes and the clinical manifestations observed in patients with NPSLE.
Conclusion
Our study demonstrated cortical thinning, as well as decreased FA and increased MD values in several WM regions in patients with NPSLE who exhibited otherwise normal brain morphology based on conventional MRI. Advanced imaging techniques now allow for the measurement of cortical thickness and DTI analysis, which could be valuable diagnostic modalities for detecting microstructural alterations and may facilitate the implementation of new therapeutic strategies for treating patients with NPSLE.
Supplemental Material
Supplemental Material - Cortical thickness and diffusion tensor imaging in patients with neuropsychiatric systemic lupus erythematosus, with normal structure on brain MRI
Supplemental Material for Cortical thickness and diffusion tensor imaging in patients with neuropsychiatric systemic lupus erythematosus, with normal structure on brain MRI by Shao-Yen Liang, Yi-Ying Wu, Ni-Jung Chang, Kuo-Lung Lai, Hsian-Min Chen, Hung-Chieh Chen, Yen-Chieh Ouyang, Yi-Ming Chen, Jyh-Wen Chai in Lupus
Footnotes
Acknowledgments
The authors thank the Biostatistics Task Force of Taichung Veterans General Hospital for their assistance with the statistical analysis undertaken in this study.
Declaration of conflicting interests
The author(s) declared no potential conflicts of interest with respect to the research, authorship, and/or publication of this article.
Funding
The author(s) disclosed receipt of the following financial support for the research, authorship, and/or publication of this article: This work was supported by the Taichung Veterans General Hospital (grant number TCVGH-1105502C), Taiwan, Republic of China.
Ethical approval
This study was conducted in compliance with the World Medical Association Declaration of Helsinki, the institutional review board of Taichung Veterans General Hospital (IRB number: CF14038, CG19129B) approved the research protocol, and written informed consent was obtained from all subjects (or their legally authorized representative).
Data availability
The data underlying this article will be shared on reasonable request to the corresponding author.
Supplemental Material
Supplemental material for this article is available online.
References
Supplementary Material
Please find the following supplemental material available below.
For Open Access articles published under a Creative Commons License, all supplemental material carries the same license as the article it is associated with.
For non-Open Access articles published, all supplemental material carries a non-exclusive license, and permission requests for re-use of supplemental material or any part of supplemental material shall be sent directly to the copyright owner as specified in the copyright notice associated with the article.