






Abstract
Background
Systemic lupus erythematosus (SLE) features aberrant T-B cooperation and expansion of atypical memory B cells (aMBCs) characterized by the expression of CD11c and T-bet. We investigated the relationship between IL-21/IL-21R and the activation state of cTfh and Tph, with CD11c+T-bet + B cell subsets and clinical activity.
Methods
A cross-sectional study was conducted involving 40 patients with systemic lupus erythematosus (SLE) and 15 healthy subjects (HS). A multiparameter flow cytometry was used to evaluate Tph (CD4+CXCR5-PD-1+), cTfh (CD4+CXCR5+PD-1+), and aMBCs (CD19+CXCR5-CD11c+) subsets and intracellular expression of IL-17A (iIL-17A), IL-21 (iIL-21), and T-bet. The disease activity was assessed using the SLEDAI-2K.
Results
We found an increased frequency of cTfh PD-1vh, HLA-DR+, IL-21R+, and Tph PD-1vh, HLA-DR+, and iIL-21+ cells in SLE patients. The aNAV T-bet+ cells were expanded in SLE patients. Activated T-cell states (iIL-21+/IL-21R+/PD-1vh/HLA-DR+) correlated with T-bet+ B cells subsets. Finally, activated cTfh/Tph and aMBCs correlated with SLEDAI-2K.
Conclusions
Our findings provide new insights into the cooperative expression of IL-21/IL-21R and T-bet and their potential relationships with extrafollicular B-cell responses in SLE. These results highlight the IL-21/T-bet axis, offering potential avenues for biomarker development and targeted therapeutic intervention in SLE.
Introduction
Systemic lupus erythematosus (SLE) is a chronic inflammatory autoimmune disease of unknown etiology, characterized by hyperactivation and proliferation of B lymphocytes, uncontrolled production of autoantibodies, and damage to multiple organs and systems. 1 Cooperation between T helper (Th) cell subsets and B lymphocytes is essential for follicular responses and antibody generation. 2 Among these, T peripheral helper cells (Tph) and circulating T follicular helper cells (cTfh) play a pivotal role through CD40–CD40L and TCR-MHCII interactions, and secretion of interleukin-21 (IL-21), promoting B cell survival and differentiation into memory or plasma cells.3,4
An extrafollicular pathway has been described in which B cells receive continuous signals through the B cell receptor (BCR), Toll-like receptors 7/9 (TLR7/9), and cytokines such as interferon gamma (IFN-γ) and IL-21, most likely provided by Tph and cTfh cells. 5 These cells, termed atypical memory B cells (aMBCs),6–8 are classified according to the differential expression of CD27 and IgD, 5 the loss of expression of C-X-C chemokine receptor type 5 (CXCR5) and CD21, and mainly by the expression of CD11c and T-bet, features associated with an activated phenotype and extrafollicular differentiation.9–11 In fact, T-bet promotes the atypical phenotype in B lymphocytes, enhances their ability to activate Tfh, and favors high-affinity selection within germinal centers (GC). 11 In SLE, the most relevant atypical populations include double-negative B lymphocytes (DN; CD27-IgD-), DN type 2 lymphocytes (DN2; CD27-IgD-CXCR5-CD11c+T-bet+), and activated naïve B lymphocytes (aNAV; CD27-IgD+ CXCR5-CD11c+T-bet+), which have been linked to disease activity.12,13 In vitro, these B lymphocytes display a high capacity to differentiate into plasmablasts following stimulation with IFN-γ, TLR7 agonists, and IL-21.5,14
IL-21, produced by cTfh, Tph, Th17, and NK cells, is a key pleiotropic cytokine that, upon binding to its receptor (IL-21R) on B lymphocytes, activates the JAK/STAT3 pathway, promoting proliferation, maturation, and differentiation into antibody-producing plasmablasts. 15 In CD4+ T cells, IL-21 favors polarization toward follicular phenotypes (Tfh, cTfh, Tph). 16 In the context of SLE, IL-21 acts synergistically with IFN-γ and TLR signals to induce T-bet expression in B lymphocytes, thereby driving the differentiation of the atypical phenotype (CD11c+T-bet+).17,18 Overexpression of CD11c in aMBCs has been associated with the migration capacity to inflamed tissues. 19 T-bet expression is essential for generating specific antibodies and cellular functions such as homing, residence, 20 and plasmablast differentiation. 21 In murine lupus models, T-bet overexpression accelerates GC formation, augments B lymphocyte activation, and promotes autoantibody production, leading to renal injury; conversely, T-bet deletion curtails nephritis and improves survival, implicating T-bet as a key driver of tissue-damaging humoral immunity. 22 Taken together, these observations suggest that the IL-21 and T-bet expression may represent a key node in amplifying the autoimmune and inflammatory responses involving aMBCs, cTfh, and Tph cells. Therefore, this study aimed to evaluate the expression of T-bet and other activation markers in Tph, cTfh, and aMBCs in patients with SLE and healthy controls to understand their potential contribution to disease pathophysiology.
Materials and methods
Subjects
Forty SLE patients were recruited from the Rheumatology Department at Hospital General de Occidente (Guadalajara, Mexico); all patients fulfilled the 2019 EULAR/ACR classification criteria. 23 Fifteen age- and sex-matched healthy subjects (HS) without infections, allergies, or chronic diseases were included. At inclusion, disease activity was assessed using the SLEDAI-2K, 24 and the damage was evaluated through the SLICC damage index. 25 Patients were stratified as mildly active/nonactive (<6 points) and clearly active disease (≥6 points). The Ethics and Research Committees of both institutions approved the protocol with the following registration numbers: CEI-146/21 and CI-146/21 for the Hospital General de Occidente Committee, and CI-02123 for the Universidad de Guadalajara Committee; all participants provided written informed consent in accordance with the Mexican General Health Law and the Declaration of Helsinki.
Flow cytometry
Peripheral blood mononuclear cells (PBMCs) were isolated from whole blood samples using density gradient centrifugation with Histopaque-1077 (Sigma-Aldrich, Merck; Darmstadt, Germany). Cell surface staining was performed using standard flow cytometry methods with fluorochrome-conjugated anti-human antibodies, as detailed in Supplemental Table 1. The raw data were screened using the PeaCoQC algorithm, 26 and from there the analysis strategy utilized for the cTfh, Tph, and aMBCs lymphocyte populations followed the previously described methods from our working group (Supplemental Figures 1-2).27,28 The relative proportions of Tph (CD4+CXCR5-PD-1+), cTfh (CD4+CXCR5+PD-1+), and aMBCs (CD19+CXCR5-CD11c+) were reported as percentages (%). For the intracellular staining of IL-17A (iIL-17A), IL-21 (iIL-21), and T-bet, we used cell permeabilization with the Cyto-Fast™ Fix/Perm Buffer Set (Cat. No. 426803; BioLegend Inc, San Diego, CA, USA). Compensation was performed using VersaComp Beads (Cat. No. B22804; Beckman Coulter®, Brea, CA, USA). Fluorescence minus one (FMO) control was used to adjust for background fluorescence and set gates for PD-1, IL-21, IL-21R, IL-17A, CD11c and T-bet expression. Flow cytometric acquisition was conducted with a CytoFLEX® cytometer (Beckman Coulter™, Brea, CA, USA), at least 200,000 events were acquired from lymphocyte region and the data were analyzed using FlowJo software version 10.10 (BD Biosciences, Franklin Lakes, NJ, USA).
Statistical analysis
Data were analyzed using GraphPad Prism v.10. Descriptive statistics were presented as medians with minimum and maximum values, or interquartile range (IQR) 25th-75th, for continuous variables. Categorical variables were expressed as absolute frequencies. The Mann-Whitney U test and the Kruskal-Wallis test with a post hoc Dunn test were used to compare independent groups, as appropriate. Correlation analysis was evaluated using Spearman’s rank correlation test. A p-value <0.05 was considered statistically significant.
Results
Clinical and demographic characteristics in SLE patients.
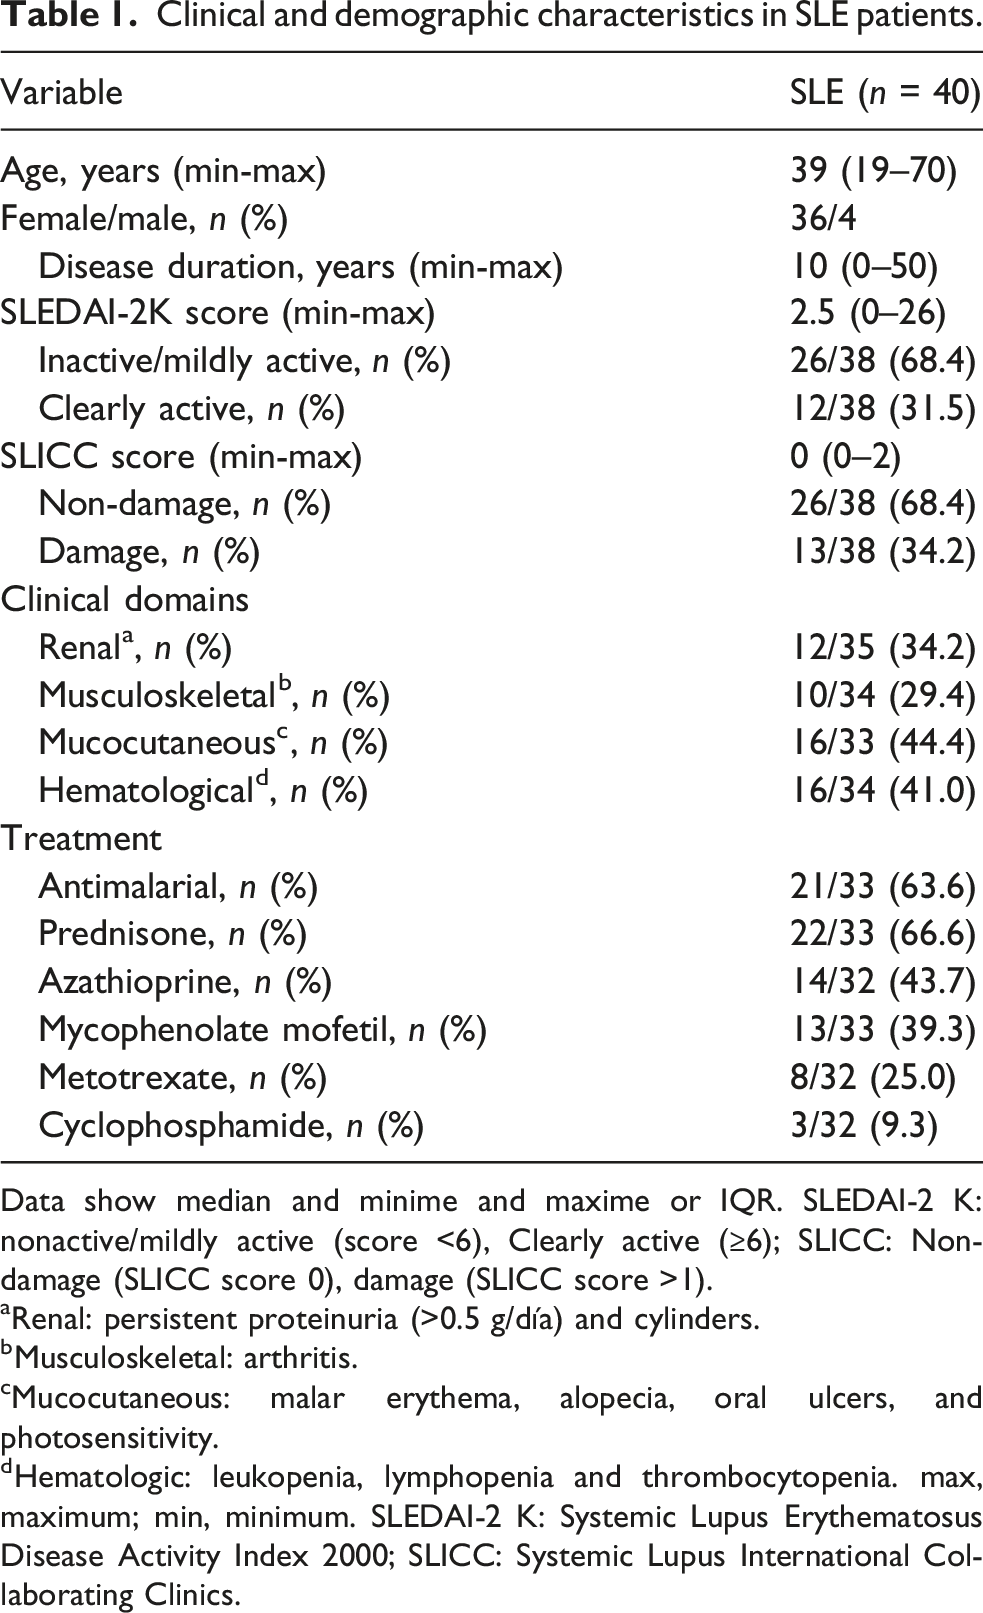
Data show median and minime and maxime or IQR. SLEDAI-2 K: nonactive/mildly active (score <6), Clearly active (≥6); SLICC: Non-damage (SLICC score 0), damage (SLICC score >1).
aRenal: persistent proteinuria (>0.5 g/día) and cylinders.
bMusculoskeletal: arthritis.
cMucocutaneous: malar erythema, alopecia, oral ulcers, and photosensitivity.
dHematologic: leukopenia, lymphopenia and thrombocytopenia. max, maximum; min, minimum. SLEDAI-2 K: Systemic Lupus Erythematosus Disease Activity Index 2000; SLICC: Systemic Lupus International Collaborating Clinics.
cTfh and Tph frequencies and activation profile
Frequency of cTfh cells showed no significant difference between groups (p = 0.4575; Figure 1(a)), or according to disease activity (Supplemental Figure 3(a)). cTfh cells stratified as PD-1 very high (PD-1vh) were higher in SLE patients than HS [14.7% (IQR 9.03-22.0%) versus 10.1% (IQR 6.83-13.5%), p = 0.0053; Figure 1(b)], this difference was not associated with the SLEDAI-2K index (Supplemental Figure 3(b)); additionally, cTfh iIL-21+ cells were similar in both groups (p = 0.1138; Figure 1(c)). cTfh IL-21R+ cells showed higher distribution in SLE patients compared to HS [10.65% (IQR 6.09-15.4%), versus 7.1% (IQR 4.23-12.2%) p = 0.0488; Figure 1(d)]. The cTfh HLA-DR+ cells were more prevalent in SLE patients [2.91% (IQR 1.87-5.39%)] than in HS [0.9% (IQR 0.48-1.7%)] with a statistical difference (p < 0.0001; Figure 1(e)), when comparing the distribution in SLE patients according to SLEDAI-2K stratification, mildly/non active [2.85% (IQR 1.51-4.79%)] and clearly active [4.51% (IQR 2.32-8.04%)] subgroups did not showed statistical difference (p > 0.05), however, both subgroups were higher than HS (p < 0.001), supplemental Figure 3(c). On the other hand, cTfh iIL-17A + cells exhibited a similar distribution between the SLE and HS groups (p = 0.4898; Figure 1(f)). cTfh and Tph lymphocyte frequencies from HS and SLE. Frequency of cTfh cells (a) in HS and SLE from CD4+ T cells. Frequencies of cTfh PD-1vh (b), iIL-21+ (c), IL-21R+ (d), HLA-DR+ (e), and iIL-17A+ (F) from HS and SLE. Frequency of Tph cells (g) in HS and SLE from CD4+ T cells. Frequencies Tph PD-1vh (h), iIL-21+ (i), IL-21R+ (j), HLA-DR+ (k), and iIL-17A+ (l) cells from HS and SLE. Statistical analysis was performed using the Mann-Whitney U test. All graphs represent scatter plots where each point represents an individual subject. Horizontal lines and error bars indicate the median and interquartile range, respectively. *p<0.05, **p<0.01, ***p<0.001, ****p<0.0001. cTfh: circulating T follicular helper; Tph: T peripheral helper; iIL-21: intracellular interleukin 21; IL-21R: interleukin 21 receptor; iIL-17A: intracellular interleukin 17A; HLA-DR: human leukocyte antigen class II; PD-1: programmed cell death protein 1.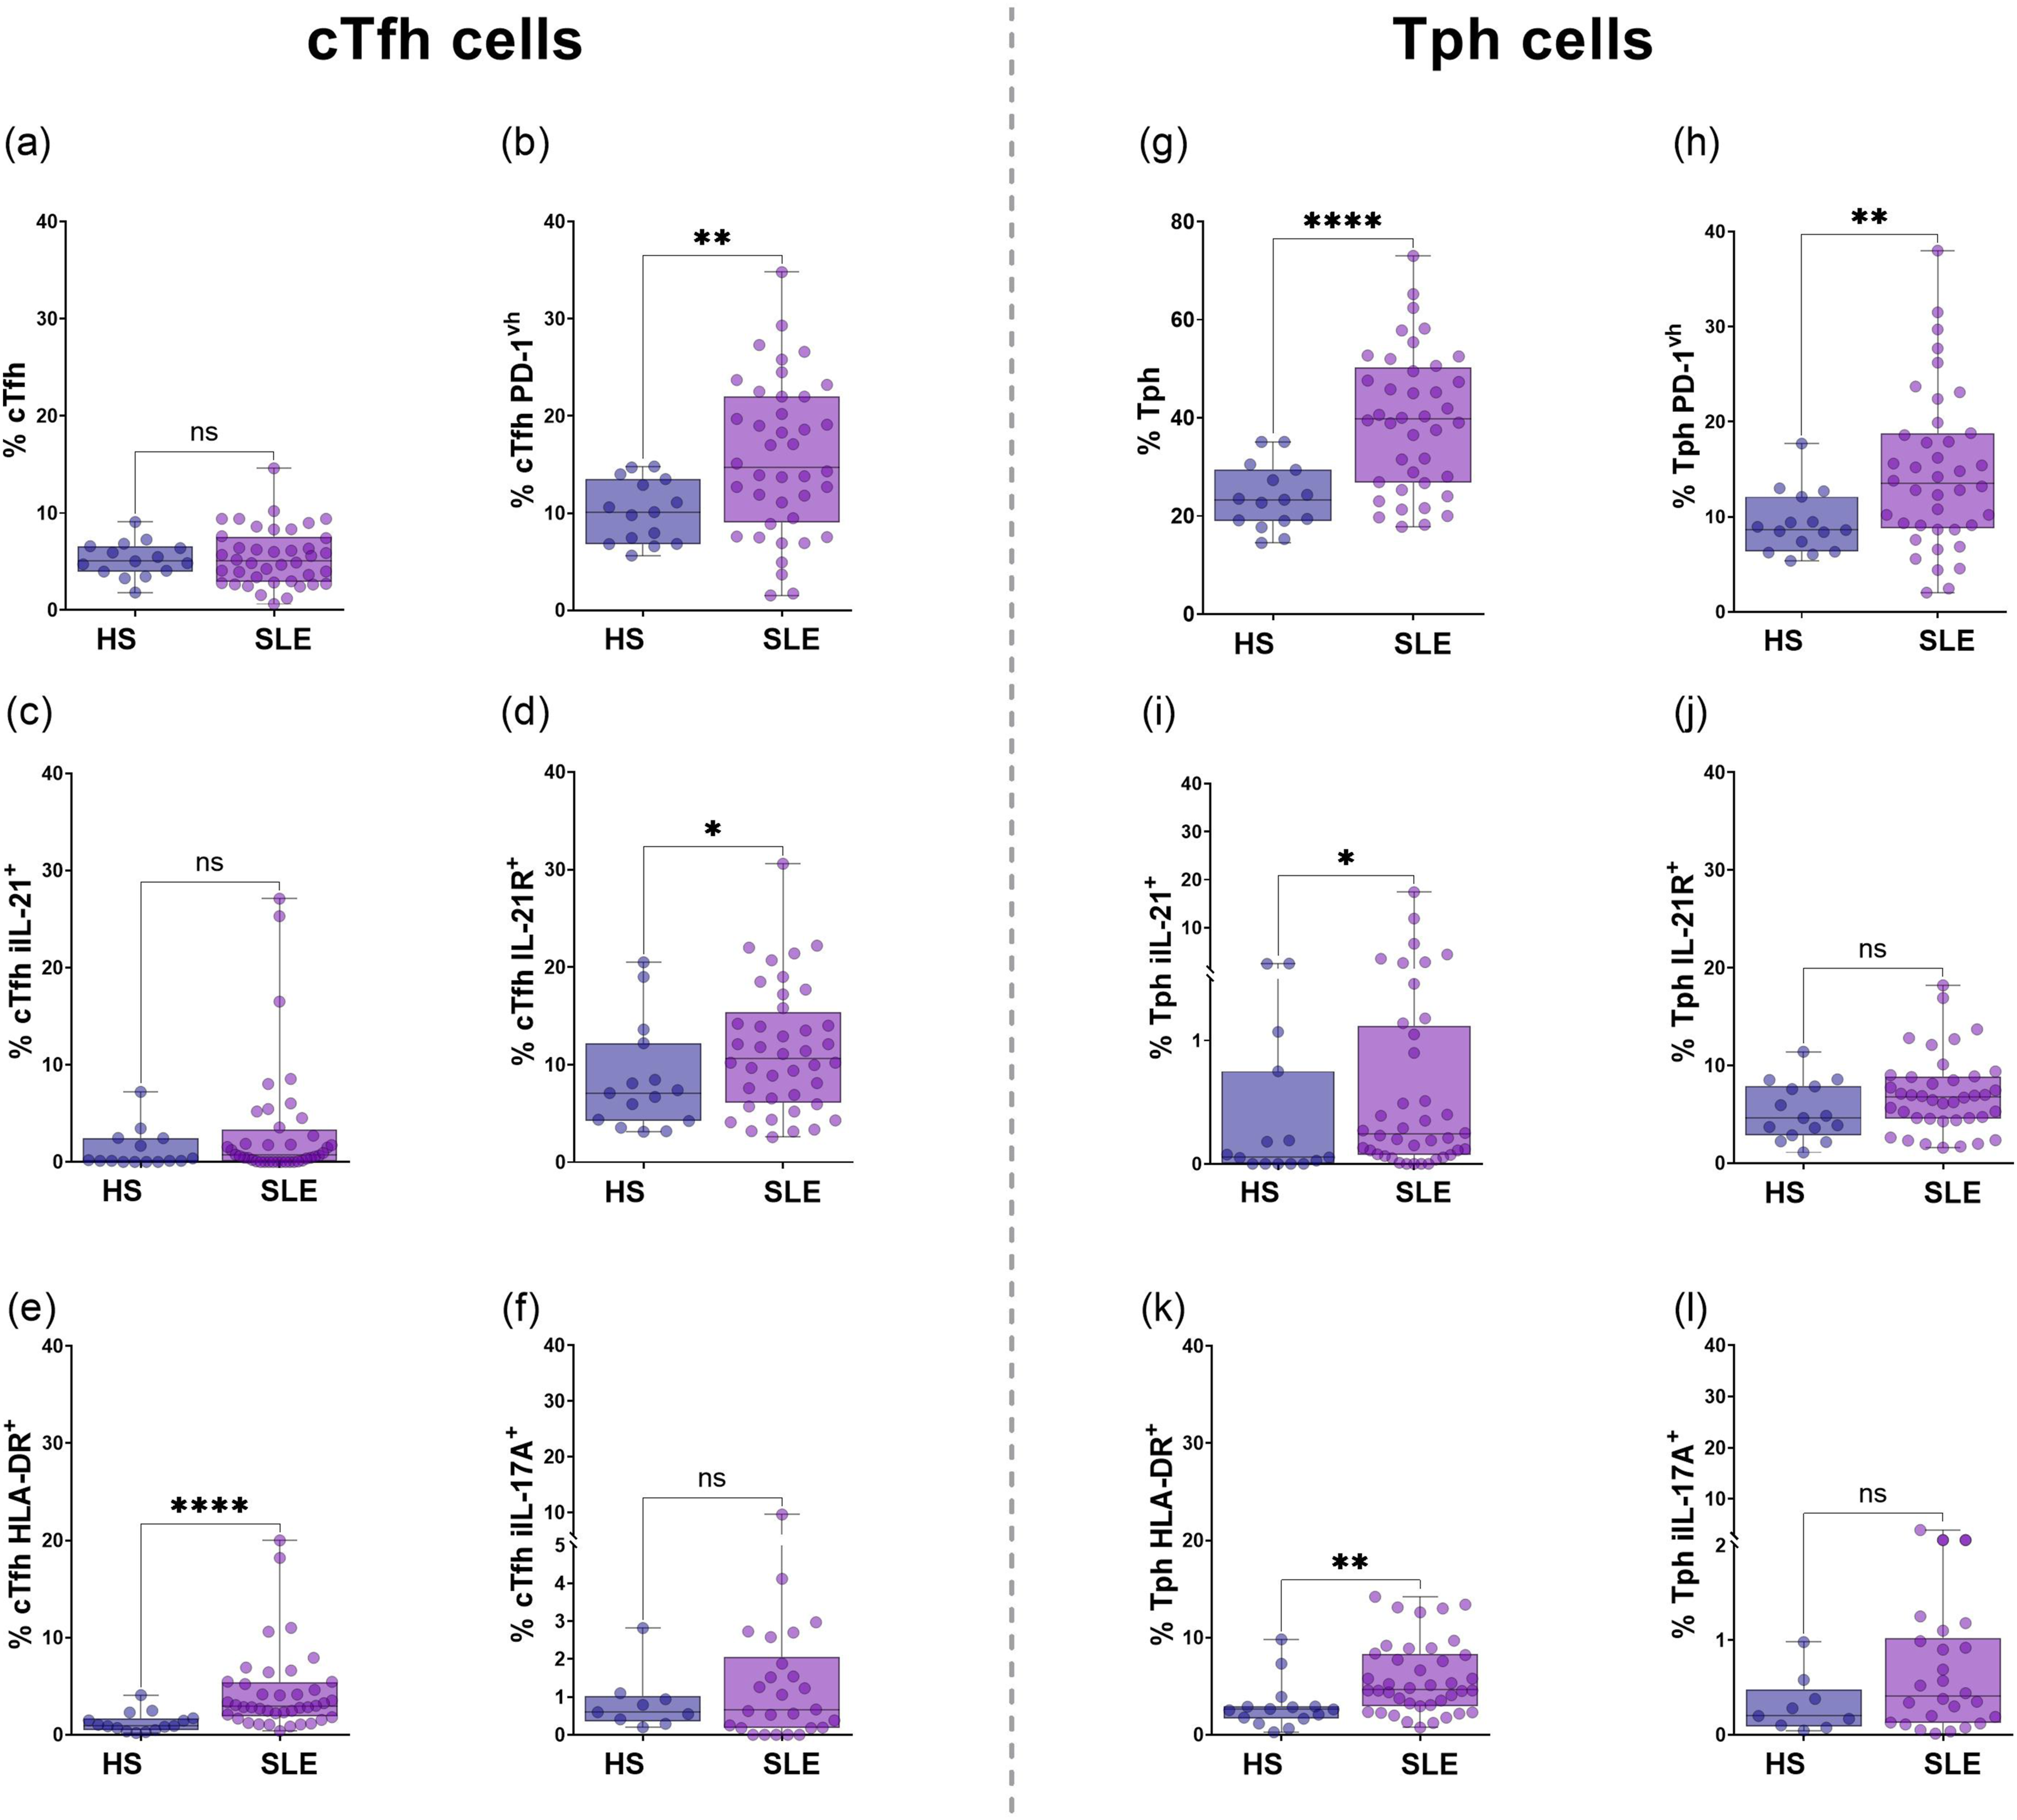
Distribution of Tph cells showed a significant increase in SLE patients [39.75% (IQR 26.75-50.33%) than HS 23.3% (IQR 19.6-29.4%), p < 0.0001; Figure 1(g)] even after stratified by SLEDAI-2K index, mildly/non active [39.5% (IQR 24.65-47.45%)] and clearly active [41.9% (IQR 27.9-58.0%)] compared to HS [23.3% (IQR 19.6-29.4%), p = 0.0256 and p = 0.0015, respectively; Supplemental Figure 3(d)]. A significant increase in Tph PD-1vh cells in SLE patients compared to HS [13.5% (IQR 8.76-18.75%) versus 8.6% (IQR 6.32-12.1%), p = 0.0049; Figure 1(h)) was observed; this difference was maintained after classification according to SLEDAI-2K, with a higher frequency in the clearly active group (Supplemental Figure 3(e)). Regarding functional markers, a significant increase of Tph iIL-21+ cells in SLE patients was found [0.24% (IQR 0.07-1.11%) versus 0.053% (IQR 0.0-007.5%), p = 0.0242; Figure 1(i)). Tph IL-21R+ cells did not present significant differences (p = 0.0707, Figure 1(j)), while Tph HLA-DR+ cells were significantly higher in SLE patients than HS [4.68% (IQR 2.96-8.33%) versus 2.61% (IQR 1.65-2.91%), p = 0.0012; Figure 1(k)). SLE clearly active group showed a higher frequency compared to HS [6.63% (IQR 4.14-11.14%) versus 2.61% (IQR 1.65-2.91%), p = 0.0019, Supplemental Figure 3(f)). No differences were found between SLE patients and HS in Tph iIL-17A+ cells distribution (p = 0.0903; Figure 1(l)).
B subsets frequencies and phenotypes
No significant differences between groups were observed in the frequencies of NAV, SWM, or DN cells; however, the frequency of USM cells was significantly lower in SLE patients than in HS (Supplemental Figure 4(a)–(d)). Also, a lower frequency was observed in rNAV, SWM CXCR5+CD11c-, and USM CXCR5+CD11c- cells in SLE patients versus HS, not in DN1 cells (Supplemental Figure 4(e)–(h)). The aNAV and SWM CXCR5-CD11c+ cells were expanded in SLE patients, and no differences were observed for USM CXCR5-CD11c+ and DN2 subsets (Supplemental Figure 4(i)–(l)).
T-bet expression in B cell subsets
The frequency of NAV CD11c+T-bet+ cells was significantly increased in SLE patients compared to HS [1.68% (IQR 0.95-2.76%) versus 0.99% (IQR 1.49-0.59%), p = 0.0144; Figure 2(a)). There were no differences in the frequency of SWM CD11c+T-bet+ (p = 0.2074; Figure 2(b)), USM CD11c+T-bet+ (p = 0.4064; Figure 2(c)), or DN CD11c+T-bet+ subsets (p = 0.3056; Figure 2(d)). Within the non-atypical B cell subsets (CXCR5+CD11c-), there were no significant differences between rNAV T-bet+ and DN1 T-bet+ cells across the groups (p = 0.0621 and p = 0.4603; see Figure 2(e) and (h), respectively), nor in T-bet MFI (p = 0.1865 and p = 0.1336; see Figure 3(a) and (d), respectively). The frequency of SWM CXCR5+CD11c-T-bet+ subsets was lower in SLE patients than HS [1.43% (IQR 0.55-5.36%) versus 4.5% (IQR 2.07-5.79%), p = 0.0249, Figure 2(f)], as well as T-bet MFI [4031 (IQR 3814-5071) versus 5209 (IQR 3874-6295), p = 0.0422, Figure 3(b)]. USM CXCR5+CD11c-T-bet+ subsets had a significantly lower frequency in SLE patients than in HS [0.42% (IQR 0.1-1.34%) versus 1.28% (IQR 0.66-1.65%), p = 0.0131; respectively, Figure 2(g)]; however, T-bet MFI did not differ (p = 0.4053, Figure 3(c)). T-bet expression in B cell subpopulations from total CD19+ in HS and SLE. To comprehensively map the distribution of the extrafollicular/atypical program, we additionally assessed CD11c⁺T-bet⁺ co-expression across general B cell populations (NAV, SWM, USM, DN), this dual-positive readout largely overlaps with the CXCR5⁻CD11c⁺ atypical compartment and serves as a confirmatory marker of the extrafollicular phenotype,5,50 frequency of NAV CD11c⁺T-bet⁺ (a), SWM CD11c⁺T-bet⁺ (b), USM CD11c⁺T bet⁺ (c), and DN CD11c⁺T-bet⁺ (d) from HS and SLE. T-bet expression in non-atypical B cells (CXCR5+CD11c-): rNAV (e), SWM CXCR5+CD11c- (f), USM CXCR5+CD11c- (g), and DN1 (h). T-bet expression in aMBCs (CXCR5-CD11c+): aNAV (i), SWM CXCR5-CD11c+ (j), USM CXCR5-CD11c+ (k), DN2 (l). Statistical analysis was performed using the Mann-Whitney U test. All graphs represent scatter plots where each point represents an individual subject. Horizontal lines and error bars indicate the median and interquartile range, respectively. *p<0.05, **p<0.01. aMBCs: atypical memory B cells; NAV: naïve; USM: unswitched memory; SWM: switched memory; DN: double negative; rNAV: resting naïve; aNAV: activated naïve; DN1: double negative 1; DN2: double negative 2; T-bet: T-box transcription factor. T-bet MFI from non-atypical B cells and aMBCs T-bet+ cells. T-bet MFI from rNAV T-bet+ (a), SWM CXCR5+CD11c-T-bet+ (b), USM CXCR5+CD11c-T-bet+ (c), DN1 T-bet+ (d), aNAV T-bet+ (e), SWM CXCR5-CD11c+T-bet+ (f), USM CXCR5-CD11c+T-bet+ (g), and DN2 T-bet+ (h) from HS and SLE patients. Statistical analysis was performed using the Mann-Whitney U test. All graphs represent scatter plots where each point represents an individual subject. Horizontal lines and error bars indicate the median and interquartile range, respectively. *p<0.05, **p<0.01, ***p<0.001. rNAV: resting naïve; aNAV: activated naïve; USM: unswitched memory; SWM: switched memory; DN1: double negative 1; DN2: double negative 2; T-bet: T-box transcription factor.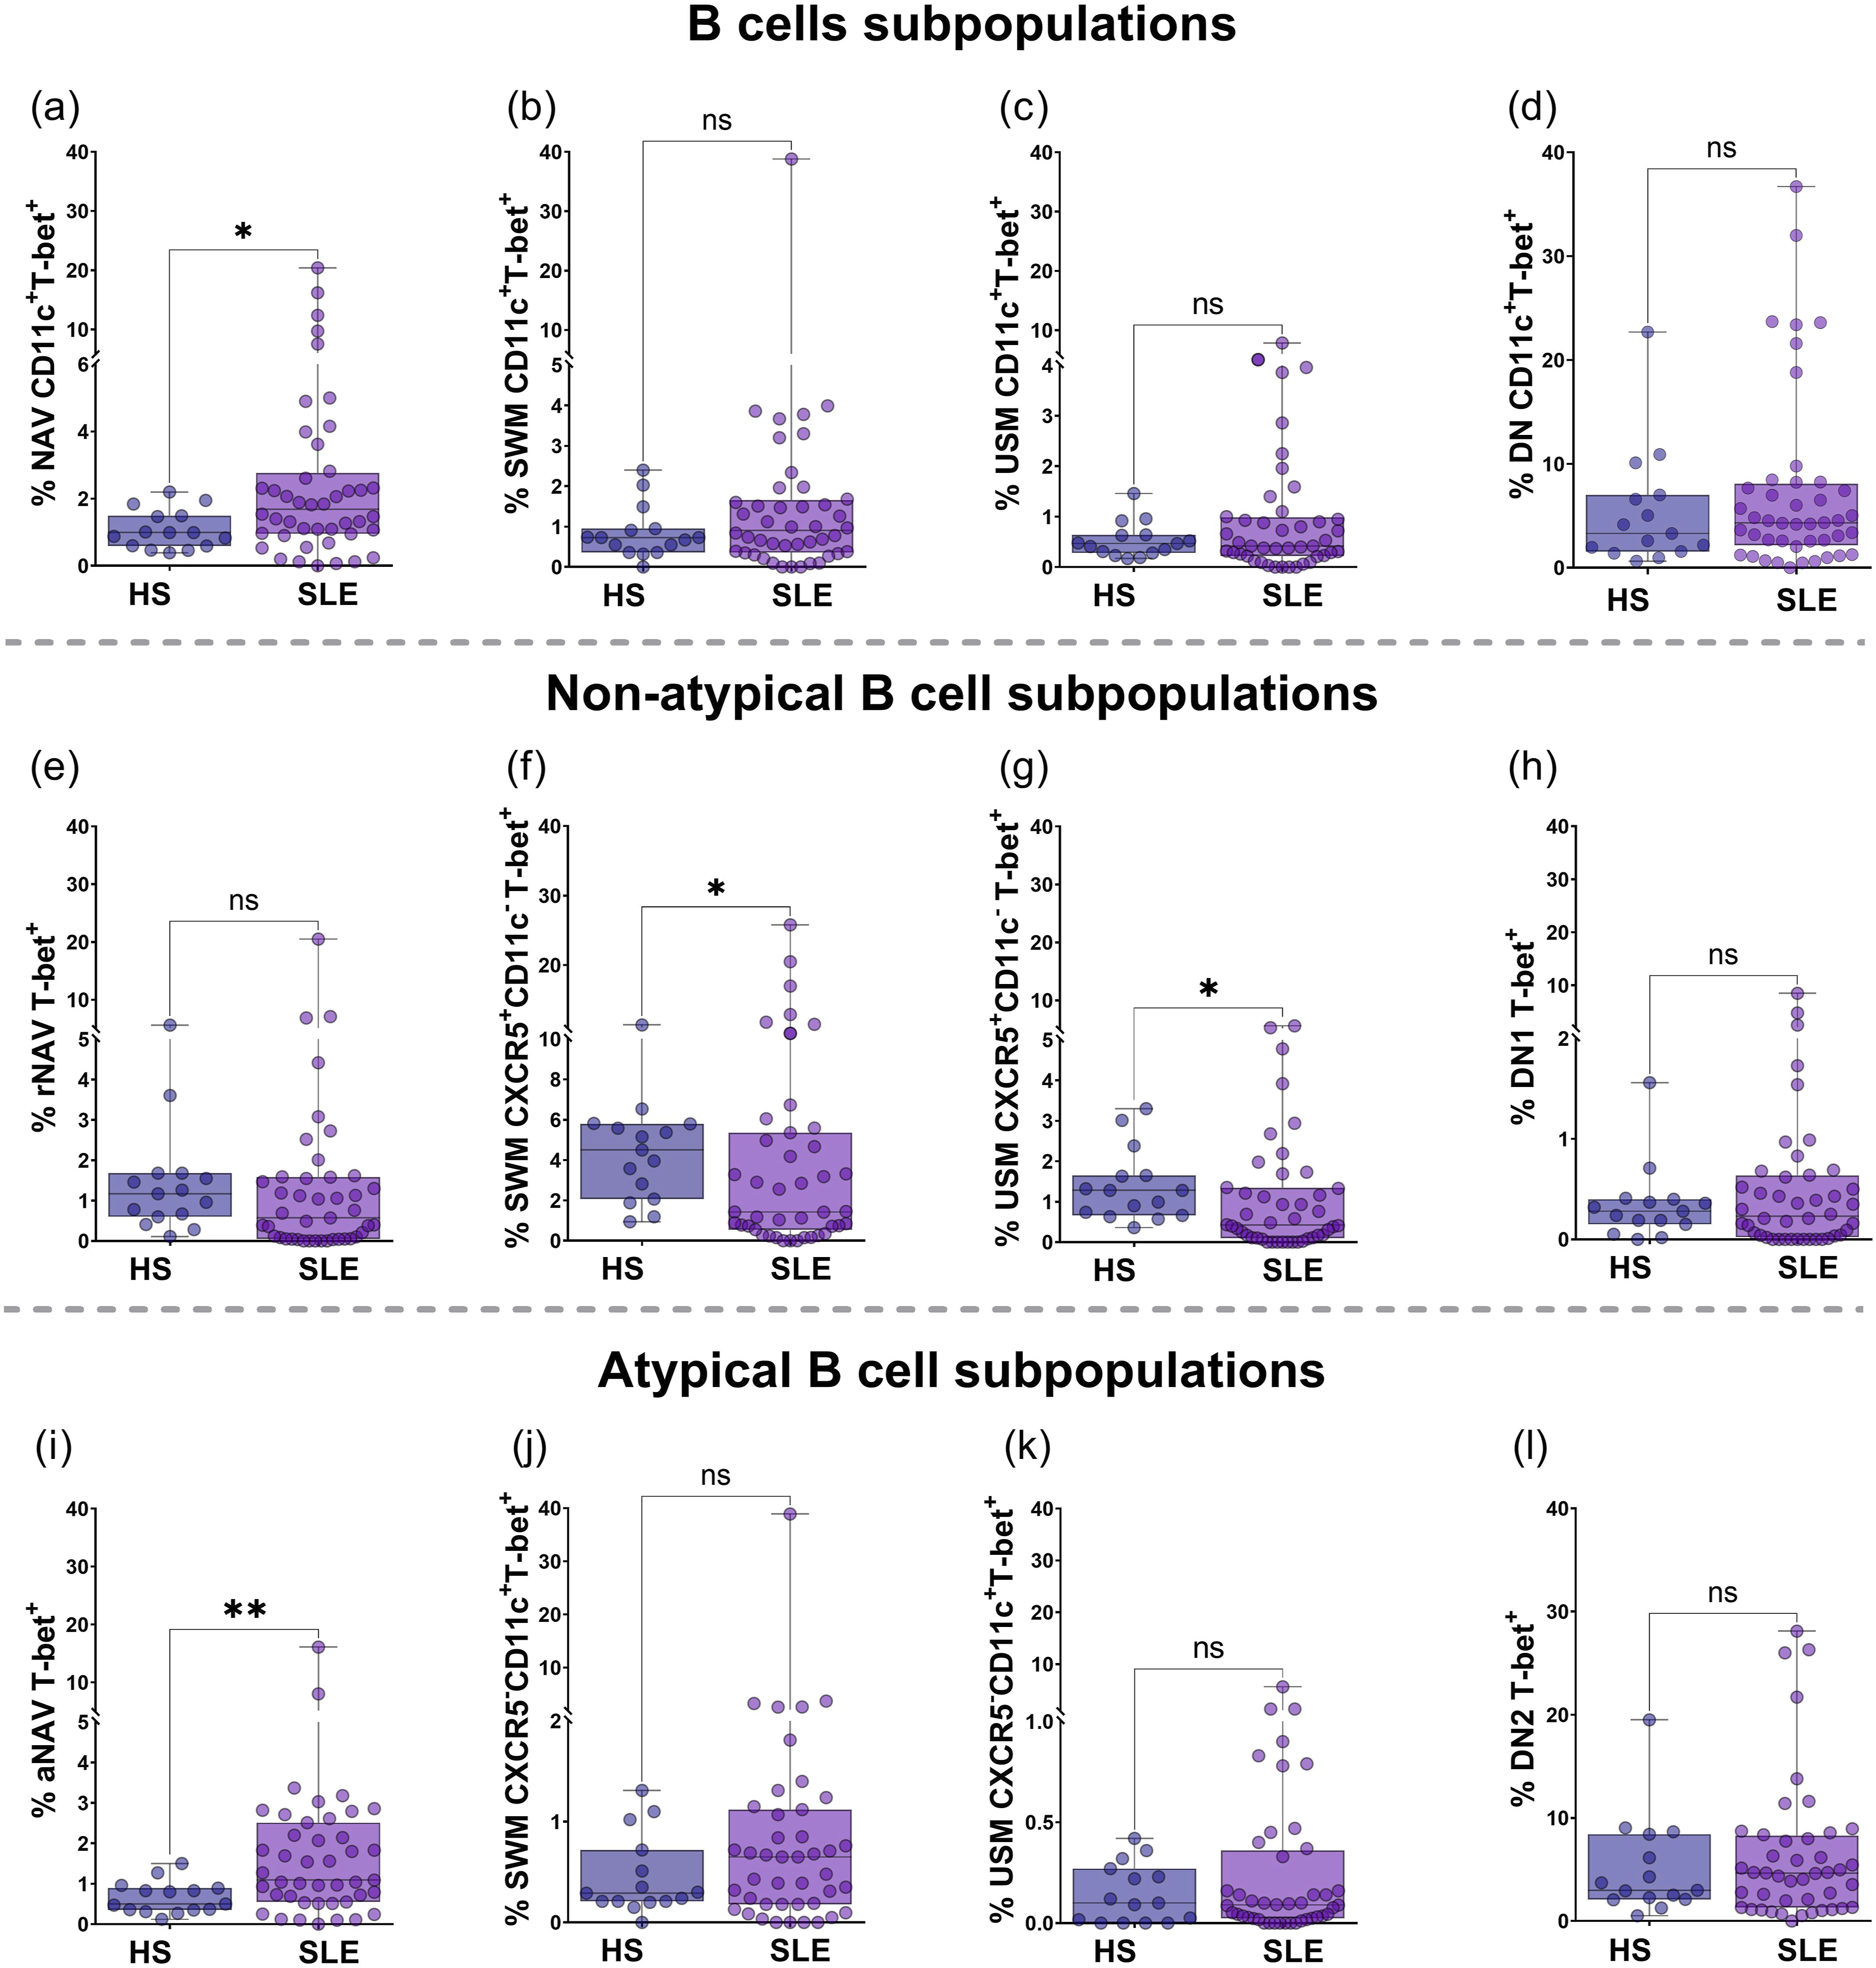
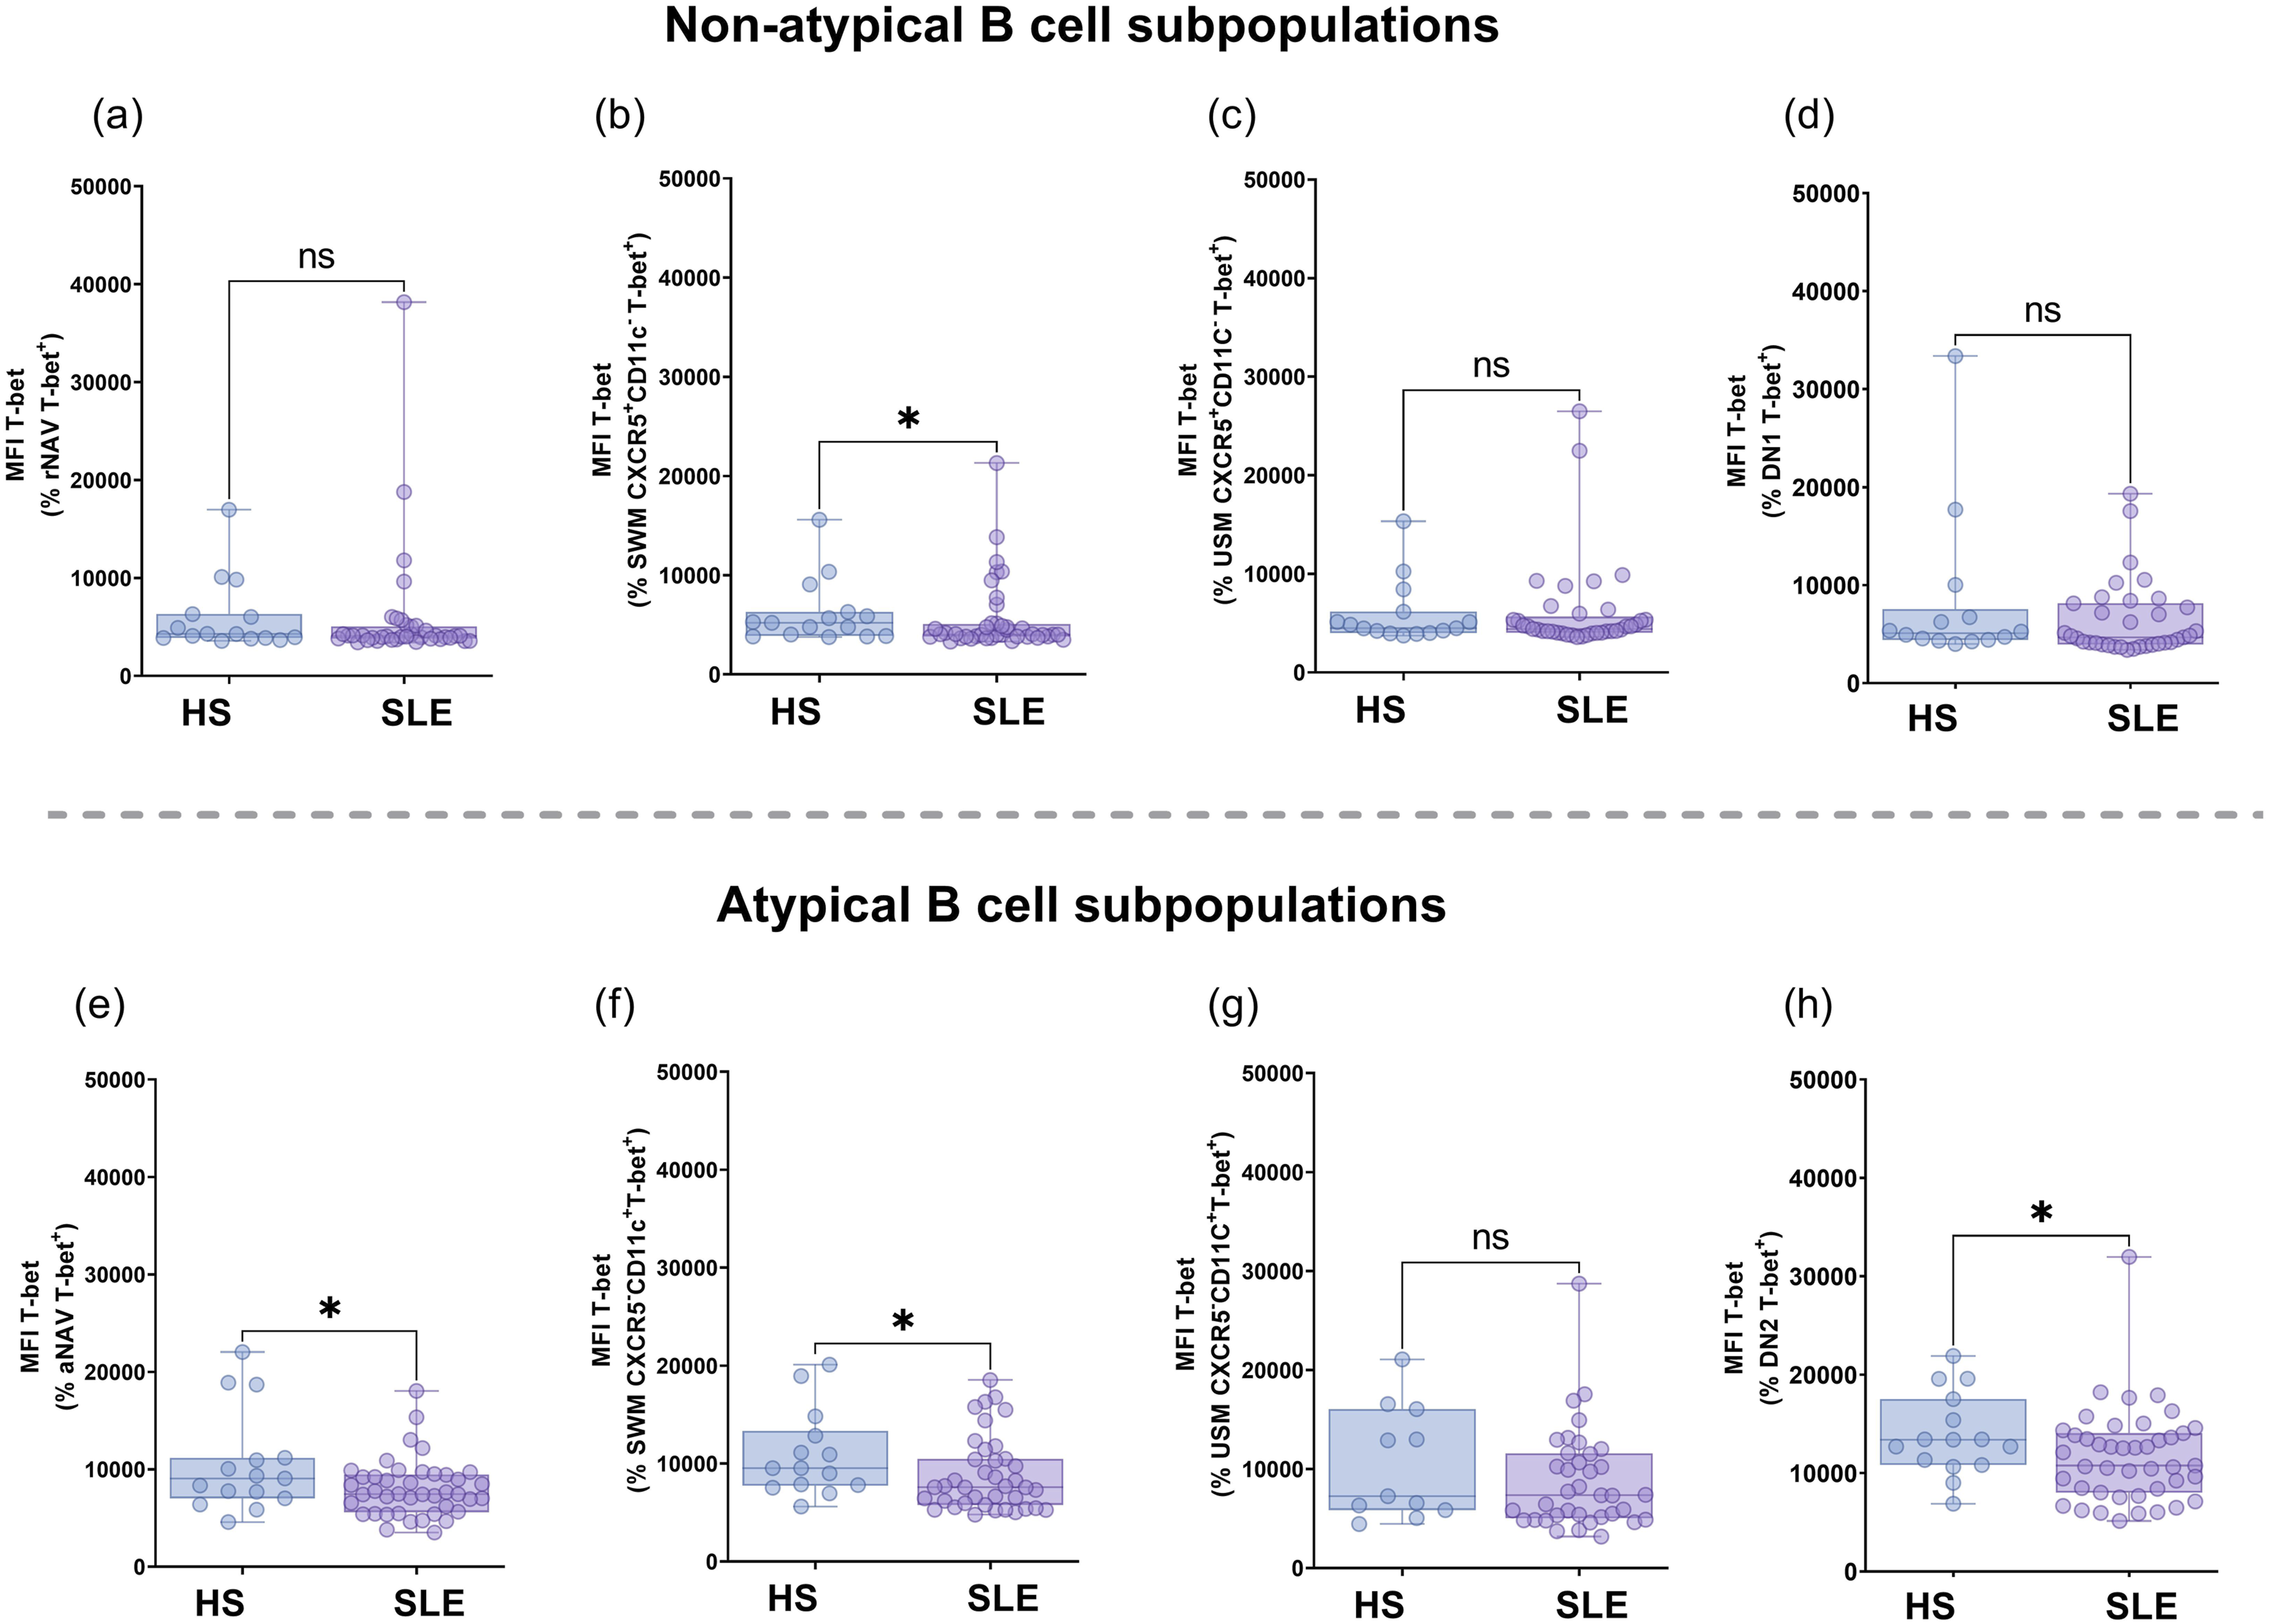
Within the aMBCs subsets, aNAV T-bet+ cells were higher in SLE patients compared to HS [1.09% (IQR 0.55-2.51%) versus 0.5% (IQR 0.35-0.89%), p = 0.0041; Figure 2(i)], while T-bet MFI was decreased in SLE patients versus HS [7462 (IQR 5606-9450) versus 9061 (IQR 7016-11182), p = 0.0452, Figure 3(e)]. A similar distribution was observed in SLE patients and HS for the frequency of SWM CXCR5-CD11c+T-bet+ (p = 0.1694; Figure 2(j)), USM CXCR5-CD11c+T-bet+ (p = 0.3346; Figure 2(k)), and DN2 T-bet+ cells (p = 0.3831; Figure 2(l)). However, T-bet MFI was significantly lower in SLE patients compared to HS in SWM CXCR5-CD11c+T-bet+ cells [7589 (IQR 5780-10488) versus 9532 (IQR 7742-13340), p = 0.0278, Figure 3(f)], and DN2 T-bet+ cells [10750 (IQR 8016-14054) versus 13383 (IQR 10815-17521), p = 0.0322, Figure 3(h)]. No differences were found in T-bet MFI from USM CXCR5-CD11c+T-bet+ cells (p = 0.1657, Figure 3(g)).
Correlation analysis: B subsets with cTfh/Tph activation profiles and SLEDAI-2K index
Subsequently, we interrogated the relationships between activated T helper subsets and the B subsets T-bet+ in SLE (Figure 4(a)). Activated helper T-cell states tended to track positive correlation with non-atypical B cells T-bet+ subsets and negatively with atypical T-bet+ B subsets. aNAV T-bet+ cells correlated negatively with cTfh cells (r = −0.324, p = 0.022), Tph PD-1vh cells (r = −0.284, p = 0.04) and Tph HLA-DR+ cells (r = −0.363, p = 0.012). DN2 T-bet+ cells correlated inversely with Tph IL-21R+ cells (r = −0.426, p = 0.003), Tph HLA-DR+ cells (r = −0.274, p = 0.043), and positively with cTfh HLA-DR+ cells (r = 0.280, p = 0.04). B cells CD11c+T-bet+ were negatively correlated with cTfh cells (r = −0.281, p = 0.04), cTfh IL-21R+ cells (r = −0.302, p = 0.029), Tph IL-21R+ cells (r = −0.535, p = 0.0001), and Tph HLA-DR+ cells (r = −0.475, p = 0.001). Correlation analysis between T and B cell subpopulations and disease activity in SLE. The heatmap shows the relationship between cTfh and Tph cell subpopulations expressing different markers (PD-1vh, iIL 21+, IL-21R+, HLA-DR+, and iIL-17+) with non-atypical B cells and aMBCs subsets T-bet+, and the total B cells CD11c+T-bet+ (gated from CD19+) (a). Correlation between the SLEDAI-2K index and the percentage of cTfh and Tph cells (b), cTfh HLA-DR+ (c), Tph HLA-DR+ (d), B cells CD11c+T-bet+ (e). Statistical analysis was performed using Spearman’s rank correlation test. *p<0.05, **p<0.01, ***p<0.001. cTfh: circulating T follicular helper; Tph: T peripheral helper; iIL-21: intracellular interleukin 21; IL-21R: interleukin 21 receptor; iIL-17A: intracellular interleukin 17A; HLA-DR: human leukocyte antigen class II; PD-1: programmed cell death protein 1; rNAV: resting naïve; aNAV: activated naïve; USM: unswitched memory; SWM: switched memory; DN1: double negative 1; DN2: double negative 2; T-bet: T-box transcription factor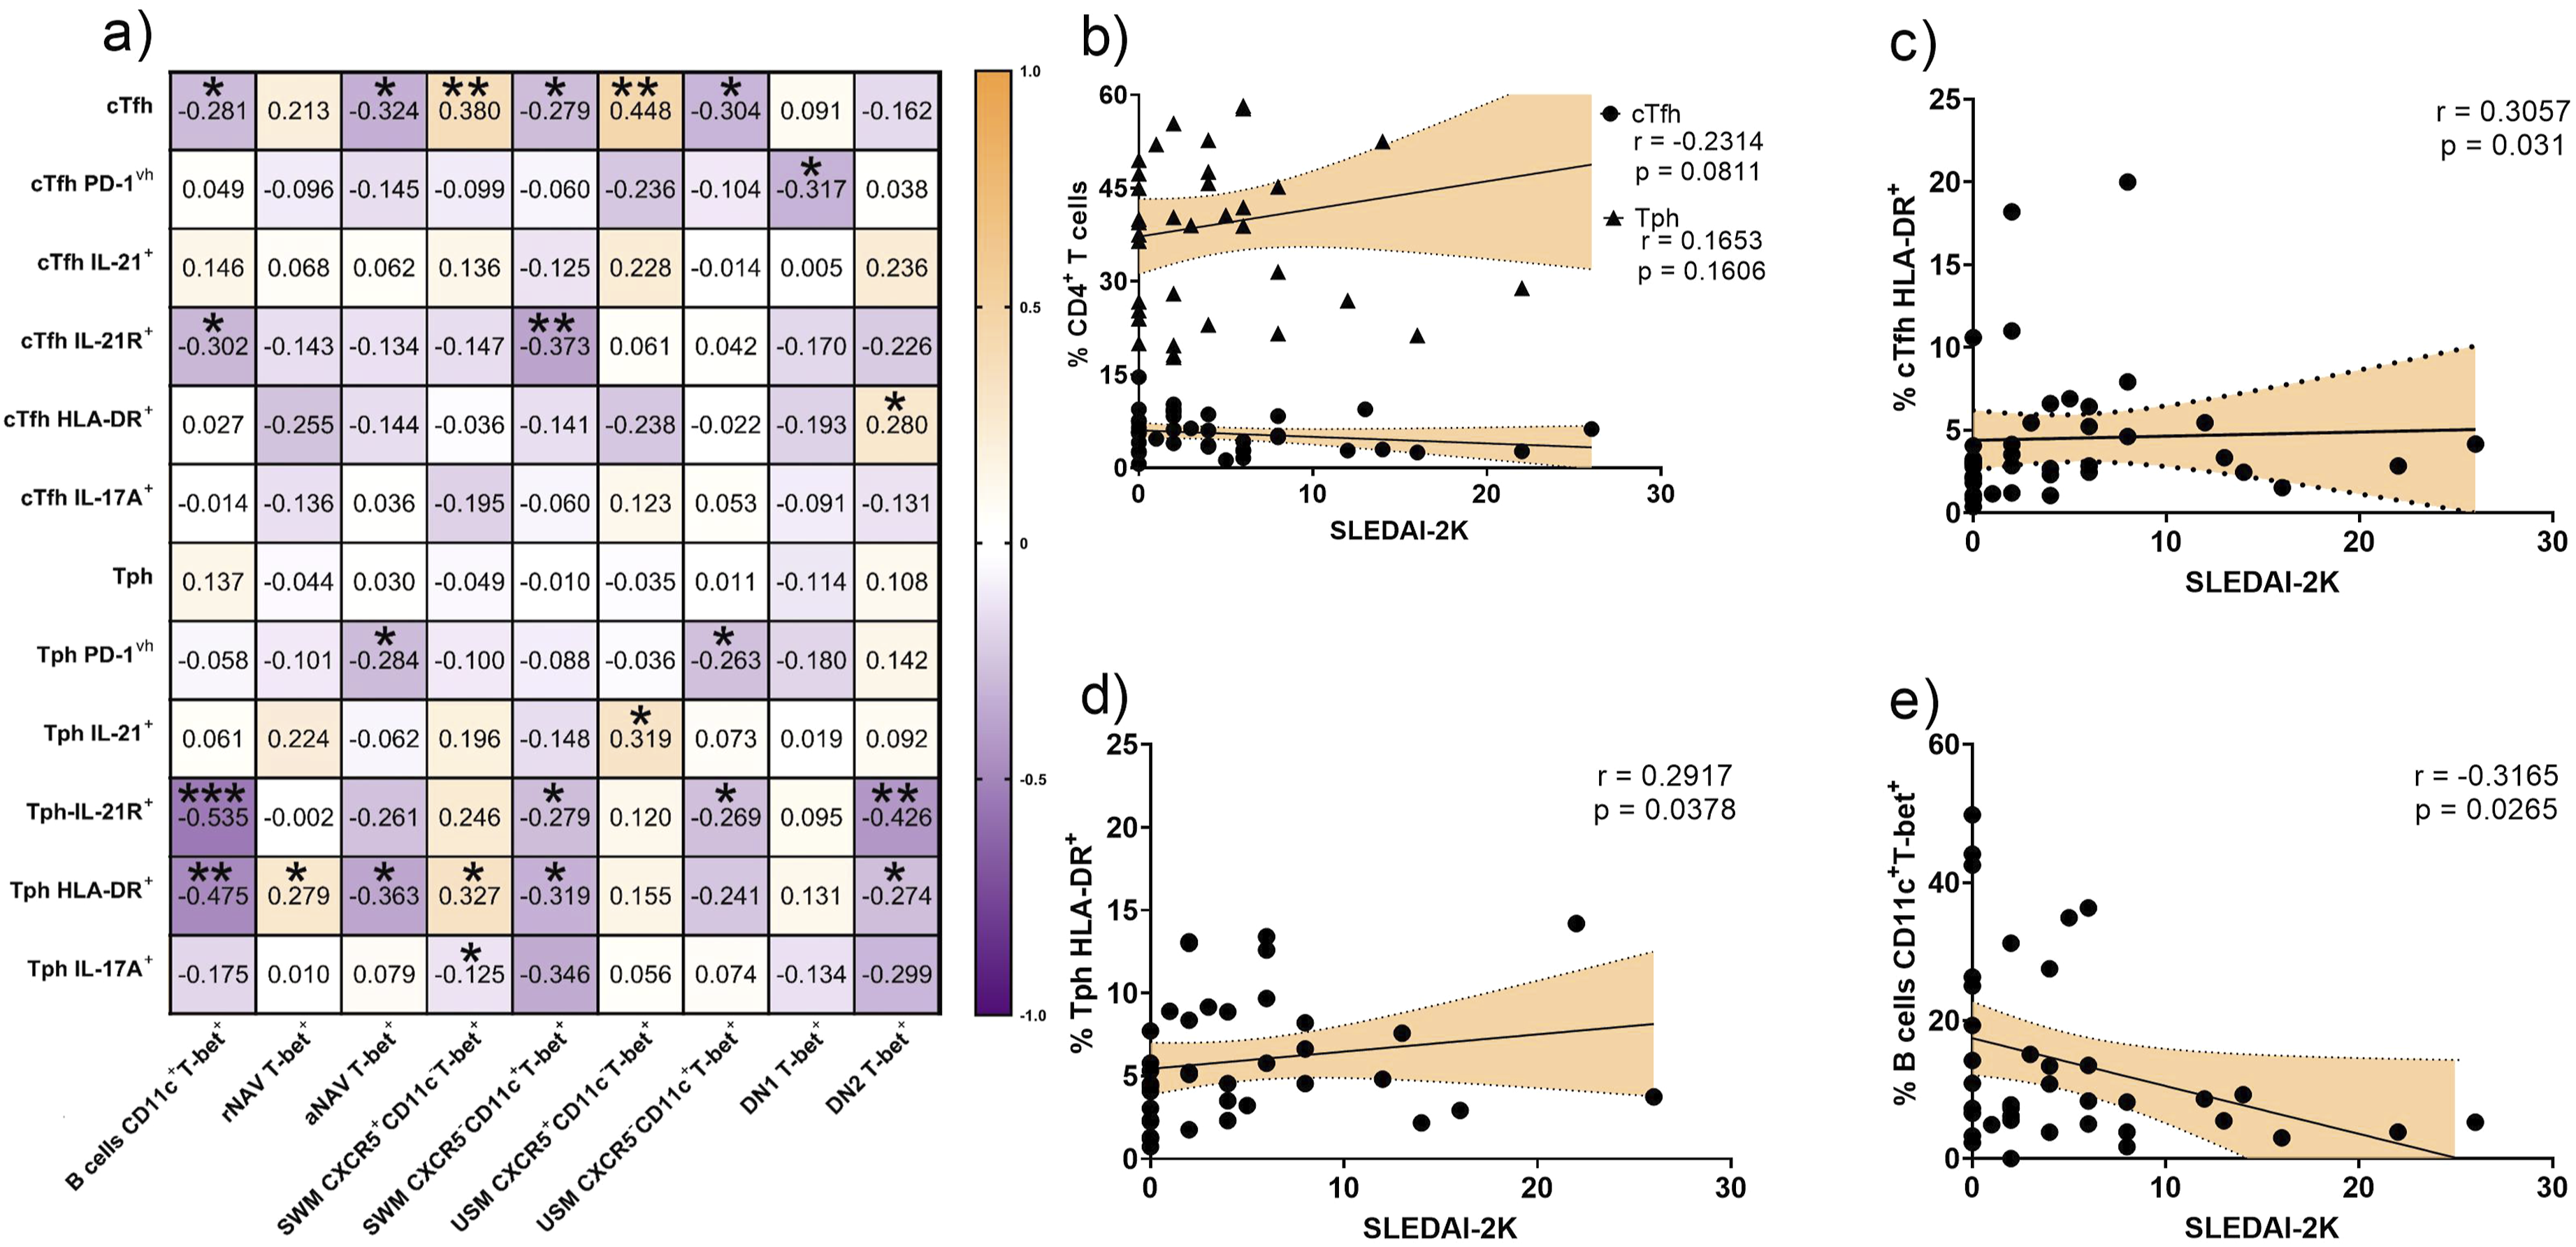
We next examined the correlation with SLEDAI-2K. Neither cTfh cells (r = −0.2314, p = 0.0811) nor Tph cells (r = 0.1653, p = 0.1606) were associated with SLEDAI-2K score (Figure 4(b)). However, the activated T profile, the cTfh HLA-DR+ and Tph HLA-DR+ correlated positively with the disease activity index (r = 0.3057, p = 0.031, Figure 4(c); and r = 0.2917, p = 0.0378, Figure 4(d), respectively). On the other hand, B cells CD11c+T-bet+ were inversely correlated with SELDAI-2K (r = −0.3165, p = 0.0265, Figure 4(e)).
Discussion
This study aims to evaluate the expression of T-bet and other activation markers in Tph, cTfh, and aMBCs and to explore the relationships with the IL21/IL21R axis and disease activity in SLE patients.
Firstly, we evaluated the molecules associated with an activation profile in cTfh and Tph lymphocytes. Both populations, cTfh and Tph, were expanded and showed increased PD-1 and HLA-DR expression in SLE patients, with the effect most pronounced in patients with clear disease activity. Concordantly, it has been reported that CD4+ cells with a phenotype labeled as “exhausted” (CD38+HLA-DR+PD-1+) and “activated” (CD38+HLA-DR+) are more frequent in SLE patients compared with healthy subjects, 29 and these cells share features with Tfh cells, including HLA-DR, ICOS, and TIGIT expression. 17 In the context of SLE, these cells are not functionally exhausted, as they produce elevated levels of cytokines, especially IL-21 and CXCL13, which are essential for B cell development.17,30 In addition, it has recently been reported that both cTfh and Tph can be stratified by PD-1 intensity (PD-1hi or PD-1very high). In relation to SLE, these cells are expanded and associated with the disease activity.17,27,31 In patients with rheumatoid arthritis (RA), Tph HLA-DR+ cells have been described as better markers of disease activity than Tph HLA-DR-. 32 Also, it has been suggested that HLA-DR identifies helper T cell states with greater effector potential toward B cell differentiation.31,32 In this study, we found a positive association between cTfh HLA-DR+ and Tph HLA-DR+ with the SLEDAI-2K index, which could support the association between T and B cells. Altogether, we considered that expanded cTfh/Tph PD-1vh/HLA-DR+ cells are associated with a process of chronic activation, maintaining the capacity to provide help to B cells rather than a state of exhaustion. It is possible that HLA-DR, in combination with PD-1, could allow immunological stratification of patients with potential utility as a biomarker.
Given the above, we addressed the expression of iIL-21/IL-21R as a central mediator in T lymphocyte cooperation. IL-21 plays a very important role in the differentiation and survival of B lymphocytes. 33 In our study, we observed an increased frequency of cTfh IL-21R+ and Tph iIL-21+ in SLE patients, indicating that the cTfh compartment is more sensitive to IL-21, as it expresses its receptor at a higher proportion than Tph in peripheral blood, while Tph iIL-21+ could play a major role in tissues. 34 It has been reported a global increase of iIL-21 from CD4+ T cells that tracked with disease activity. 35 Elevated iIL-21 within Tph cells is biologically coherent, because its role in B cell survival and differentiation toward atypical programs characterized by CD11c, T-bet, IL-21R, and FcRL5. 18 Previously, we evaluated the role of IL-21 in cTfh and Tph, showing a higher frequency of cTfh/Tph iIL21+ and increased IL-21 serum levels in SLE patients compared to HS, even stratified by SLEDAI-2K index. 27 However, no differences were observed between patients stratified by disease activity according to SLEDAI-2K or Mex-SLEDAI.27,28,36 Beyond circulation, IL-21 also acts paracrinally within inflamed tissues: in Sjögren’s Disease (SjD), cTfh/Tph ICOS+ that express IL-21 accumulate in salivary glands with ectopic GC, leading to local B cell activation 16 ; in RA, Tph PD-1hiCXCR5- within the synovium, promote B cell differentiation via IL-21 37 ; in SLE, Tph PD-1hiCXCR5- MAF-dependent IL-21 have been shown to enhance B cell responses.17,18 This finding may indicate that integrating tissue-level IL-21 biology with circulating readouts will be essential to define IL-21 as a possible biomarker versus a tractable therapeutic target in SLE patients.
It is well established that in autoimmune diseases and chronic infections, there is an increased frequency of B cell subsets with extrafollicular characteristics, particularly CD21lowCD11c+T-bet+. 38 Within the aMBCs, the most studied subsets are aNAV and DN2 cells, which in active SLE are expanded in parallel with plasmablast bursts,5,14,39 display overlapping phenotypic and transcriptional profiles characterized mainly by the expression of T-bet and other transcription factors like FcRL5, SLAMF7, IRF4, and PRDM1, driven by convergent TLR7/9–IFN-γ–IL-21 signaling pathways. 40 Similar CD21low/T-bet+ B cell expansions have been documented in RA, SjD, and severe viral infections, where they correlate with autoantibody production, elevated inflammatory cytokines such as IL-6 and CXCL10, and enhanced antigen-presentation capacity, highlighting their pathogenic role and potential as biomarkers.41,42 These aMBCs have received diverse nomenclatures, first described as age-associated B cells (ABCs) due to their accumulation with aging, 43 yet in SLE, they exhibit a distinct CD21lowCXCR5−T-bet+CD11c+ phenotype that associates with disease activity, autoantibody titers, and clinical manifestations, while maintaining transcriptional profiles similar to those found in other inflammatory conditions.5,44 In our study, we observed decreased frequencies of USM CXCR5−CD11c+ and rNAV subsets in SLE patients, whereas we observed increased frequencies of aNAV and SWM CXCR5−CD11c+ subsets. We did not find differences in the frequencies of the DN and DN2 subsets in SLE patients, contrasting with a previous report, which may be related to inherent cohort variations and clinical heterogeneity. 28 Notably, multiple studies have demonstrated that DN/DN2 expansion is closely dependent on disease activity, with significantly higher frequencies observed in patients with moderate-to-high SLEDAI-2K scores.45,46,47,48 In our cohort, 68.4% of patients had inactive or mildly active disease, and almost all received immunosuppressants and/or antimalarial drugs, which may limit our ability to detect significant expansion of these subsets through different mechanisms, including diminished B cell compartments, 49 inhibition of TLR7 signaling 50 and depletion of T-bet+ B cells. 51 In our cohort, we evaluated B cells subsets according to glucocorticoid and antimalarial treatment and no significant differences were observed (data not shown). Also, it has been suggested that there is a shift in B cell phenotype from a CXCR5+CD11c- profile to one more like aMBCs, supporting a remodeling of the memory pool from splenic-type USM cells to an extrafollicular phenotype.5,14
In our study, we observed a significant increase in T-bet expression within the aNAV cells in SLE patients, while a significant decrease in T-bet expression in SWM and USM CXCR5+CD11c- subsets. T-bet is a pivotal transcription factor that orchestrates the differentiation of B cells toward proinflammatory and extrafollicular phenotypes, integrating innate and adaptive cues. 52 Its expression is regulated by multiple signaling pathways, including TLR4, TLR7, TLR9, CD40, IFN-γ, and cytokines such as IL-21.53,54 Zumaquero et al. demonstrated experimentally that IFN-γ- driven T-bet expression reprograms naïve B cells into a hyperresponsive, IL-21–sensitive pre-plasma blast phenotype (T-bethiIRF4int), establishing T-bet as a central transcriptional regulator linking inflammation to extrafollicular autoantibody formation in SLE. 14 Consistently, T-bet expression in B cells marks an expanded IFN-responsive extrafollicular subset, mainly DN2 cells, associated with SLE activity and nephritis; its induction depends on TLR7 + IFNγ + IL-21 signaling, and its frequency is reduced by hydroxychloroquine, anifrolumab, and fasudil. 51
In contrast, DN and DN2 cells did not show significant differences, despite a tendency toward higher expression in SLE, as previously described,5,14,18,50,51 suggesting their role as possible post-switched B cells with antigen experience. 18 This distribution is compatible with an early extrafollicular imprinting model in which B cells expressing T-bet+ arise as part of a functional cooperation between B and Th1 cells, driven by self-peptide-mediated autoproliferation in the absence of exogenous TLR, despite SLO dynamics governed by Tfh–B cell interactions and coordinated instead by PD-1hi ICOShi. 55 Clinically, T-bet+ B cells (including ABCs and DN) are markedly expanded in SLE and correlate positively with SLEDAI and nephritis, supporting a link between the T-bet program and disease severity. 51 Furthermore, splenic T-bet+CD11c+ ABCs in a lupus model resist BLyS/CD20-targeted depletion, even in combination, whereas follicular/marginal zone B cells are reduced, suggesting that T-bet marks a treatment-refractory B cell population and highlighting the need for strategies beyond conventional anti-BLyS/anti-CD20 approaches. 56 Our results highlight T-bet relevance as a central regulator of pathogenic B cell activation in autoimmune disease.
Finally, to improve understanding of the functional coupling between helper T cell activation and atypical B cell differentiation, we analyzed correlations between activated cTfh/Tph and B subsets in SLE. In our study, cTfh HLA-DR+ positively correlated with DN2 T-bet+ B cells, while Tph correlated negatively with the aMBCs and T-bet expression in aNAV and USM CXCR5-CD11c+. Also, Tph IL-21+ and IL-21R+ cells showed distinct positive or negative associations across T-bet+ B cell compartments. These findings are consistent with reports that type 1 cTfh/Tph cells producing IL-21 and IFN-γ promote CD11c+T-bet+ B cell differentiation through Bcl-6 dependent mechanisms 57 and that PD-1hiCXCR5-Tph cells drive plasmablasts formation via IL-21. 17 The IL-21/IL-21R pathway establishes a positive loop that sustains T-bet induction and STAT3 activation 58 ; this mechanism could explain the preferential expansion of certain B subsets, such as DN2 and aNAV, in correlation with the cTfh/Tph activation profile, suggesting a role in extrafollicular responses. 13 Overall, when we classified by clinical activity, our data showed that T cells PD-1vh and HLA-DR+ are associated with more robust SLEDAI-2K activity than B cell frequencies, whereas aMBCs correlate inversely. Altogether, our results delineate a dual helper B cell circuit in which IL-21–T-bet signaling drives extrafollicular B cell programming and highlights the potential use for the Tph PD-1vh/HLA-DR+ and IL-21 as future biomarkers for disease monitoring in autoimmune settings.
Our work has some limitations. While few reports have specifically profiled IL-21R in cTfh/Tph cells in SLE, this finding requires external validation across different platforms. Our study did not evaluate protein-level signaling or transcriptomic reads (e.g., pSTAT3/pSTAT1, Western/ELISA for T-bet or IL-21/IL-21R, high-throughput/single-cell RNA sequencing) to define pathway activity, nor did it include subsequent bioinformatics analyses. Flow cytometry was conducted using separate panels for T and B cells, which prevented us from evaluating IL-21R in B cells, even though it is sensitive to IL-21. Switching to a unified panel or using spectral cytometry would enhance the resolution of faint or overlapping fluorophores. The sample size was moderate, with a modest activity range and a relatively small control group; a larger, age- and sex-matched sample that includes patients with higher disease activity and specific organ domains (renal, neuropsychiatric, cutaneous) is needed to increase power and allow domain-based stratification. Finally, the cross-sectional design cannot capture the dynamics surrounding flares; longitudinal follow-up should track temporal changes in cTfh/Tph and aMBCs frequencies, activation signatures during flare versus inactivity, and links to organ involvement and outcomes.
Conclusions
In summary, our findings provide new insights into the cooperative interplay between IL-21/IL-21R signaling and T-bet transcriptional programs in shaping B cell responses in SLE. cTfh and Tph cells exhibit distinct activation signatures, highlighting PD-1 and HLA-DR, consistent with an organized but non-redundant auxiliary function to aMBC subsets that support the coordinated extrafollicular pathway. This reflects clinical heterogeneity, with an increase in the atypical portion possibly indicating early hyperactivated extrafollicular pathways that could maintain persistent autoantibody production and chronic inflammation. Collectively, these results highlight the IL-21/T-bet axis as a potential avenue for biomarker development and targeted therapeutic intervention in systemic autoimmune diseases such as SLE.
Supplemental material
Supplemental material - T-bet expression in B cell subsets: Association with T peripheral helper cells and clinical activity in systemic lupus erythematosus
Supplemental material for T-bet expression in B cell subsets: Association with T peripheral helper cells and clinical activity in systemic lupus erythematosus by Ramón Chavez-Mireles, Itzel María Borunda-Calderón, Miguel Marín Rosalez, Pablo C Ortiz-Lazareno, Noemí Espinoza-García, Diana Celeste Salazar-Camarena, Aaron Gonzalez-Palacios, Héctor Giancarlo Torres-Nuño and Claudia Azucena Palafox-Sánchez in Lupus.
Footnotes
Acknowledgments
We thank all subjects who participated in our study and the COECYTJAL for the funds provided.
ORCID iDs

Ethical considerations
The protocol was approved by institutional ethics and research committees under registration numbers (CEI-146/21; CI-146/21) and the Universidad de Guadalajara (CI-02123); all participants provided written informed consent in accordance with the Mexican General Health Law and the Declaration of Helsinki.
Authors contributions
Conceptualization, RCM and CAPS; methodology, IMBC, MMR and PCOL; investigation, NEG, DCSC and AGP; writing—original draft preparation, RCM and CAPS; supervision, CAPS, GTN and MMR. All authors have read and agreed to the published version of the manuscript.
Funding
The authors disclosed receipt of the following financial support for the research, authorship, and/or publication of this article: This research was supported by the Fondo de Desarrollo Científico de Jalisco para atender retos sociales “FODECIJAL 2023” grant 10586-2023 to CAPS from Consejo Estatal de Ciencia y Tecnología de Jalisco (COECYTJAL).
Declaration of conflicting interests
The authors declared the following potential conflicts of interest with respect to the research, authorship, and/or publication of this article: The authors declare that the research was conducted in the absence of any commercial or financial relationships that could be construed as a potential conflict of interest.
Data Availability Statement
The data used to support the findings of this study will be available upon request to the corresponding author.
Supplemental material
Supplemental material for this article is available online.
References
Supplementary Material
Please find the following supplemental material available below.
For Open Access articles published under a Creative Commons License, all supplemental material carries the same license as the article it is associated with.
For non-Open Access articles published, all supplemental material carries a non-exclusive license, and permission requests for re-use of supplemental material or any part of supplemental material shall be sent directly to the copyright owner as specified in the copyright notice associated with the article.
