
Abstract
Motivated by a study exploring spatiotemporal trends in emergency department use, we develop a class of two-part hurdle models for the analysis of zero-inflated areal count data. The models consist of two components—one for the probability of any emergency department use and one for the number of emergency department visits given use. Through a hierarchical structure, the models incorporate both patient- and region-level predictors, as well as spatially and temporally correlated random effects for each model component. The random effects are assigned multivariate conditionally autoregressive priors, which induce dependence between the components and provide spatial and temporal smoothing across adjacent spatial units and time periods, resulting in improved inferences. To accommodate potential overdispersion, we consider a range of parametric specifications for the positive counts, including truncated negative binomial and generalized Poisson distributions. We adopt a Bayesian inferential approach, and posterior computation is handled conveniently within standard Bayesian software. Our results indicate that the negative binomial and generalized Poisson hurdle models vastly outperform the Poisson hurdle model, demonstrating that overdispersed hurdle models provide a useful approach to analyzing zero-inflated spatiotemporal data.
Keywords
1 Introduction
Emergency department (ED) visits have been rising steadily in the United States for more than a decade. Between 1999 and 2009, ED visits increased 32%, to about 136 million per year. 1 Many of these visits were for nonurgent care and could have been managed in outpatient settings, saving an estimated $4.4 billion in health care costs annually. 2 Patient wait times in EDs also increased during this time, from an average of 47 min in 2003 to 58 min in 2009. 1 The use of EDs for routine care places undue strain on the health system, increasing health costs, limiting access to services, and reducing patient satisfaction. 3
As with other health services, there is considerable geographic and temporal variation in ED use. This variability is due in part to differences in population demographics such as age and overall health status. Characteristics of neighborhoods themselves, such as lack of reliable public transportation to primary care facilities, also contribute to increased ED use. 4 In addition, availability of outpatient clinics varies at a local level, although the findings regarding the relationship between access to outpatient care and ED use are mixed.5,6 While some policy makers have advocated measures such as neighborhood health centers to promote access to care, it is not possible to identify areas in need of such services without an effective approach to tracking ED trends spatially and over time. Methods for assessing spatiotemporal patterns in ED use are therefore needed as a first step toward optimal design and targeting of community-level interventions to reduce costly nonurgent ED care.
With these goals in mind, investigators at Duke University in Durham, North Carolina, recently reviewed annual ED records from the Duke University Decision Support Repository (DSR), a database containing demographic, diagnostic, and treatment information on over four million patients seen within the Duke University Health System. The review was part of an ongoing study examining patient- and neighborhood-level factors associated with ED use. By tracking spatial trends over time, the investigators sought to identify areas where ED use remained persistently high, fluctuated from year to year, or increased systematically over time.
From an analytic perspective, the DSR data posed a number of unique challenges. First, there was an abundance of zeros: in any given year, over 70% of the patients made no ED visits, while others made multiple visits ranging upward of 90 per year in extreme cases. Thus, one of our chief aims was to develop a set of spatiotemporal models that could account for zero inflation. Second, given the wide range of positive counts, the models needed to address potential overdispersion in the data. Third, in a previous cross-sectional study, 7 we found that the probability of ED use was correlated with the expected number of ED visits among users after adjusting for covariates; we therefore sought to develop models to accommodate this source of dependence. And finally, to improve small-area estimation, the models needed to provide adequate spatial and temporal smoothing.
This article describes a class of two-part hurdle models specifically designed to address these multiple aims. The models consist of two components: a binary component that models the probability of any ED use (i.e., at least one ED visit annually) and a truncated count component that models the number of visits among users. Together, these components accommodate both the high proportion of zeros and the right-skewness observed among the nonzero counts. To accurately model the dispersion in the positive counts, we consider three distributions for the nonzero observations: a truncated Poisson, a truncated negative binomial, and a truncated generalized Poisson distribution. Taking advantage of the unique hierarchical structure of the DSR data, our models incorporate both patient- and region-level predictors, as well as spatially and temporally correlated random effects for each model component. The random effects are assigned multivariate conditionally autoregressive priors that induce dependence between the components and provide smoothing across adjacent spatial units and time periods.
Our approach builds on recent developments in spatial modeling of zero-inflated data. Agarwal et al. 8 developed a spatial zero-inflated Poisson (ZIP) model that introduced spatially correlated random effects into the Poisson component. Rathbun and Fei 9 proposed a similar model in which the “extra-Poisson” zeros were fitted using a spatial probit model. Gschlößl and Czado 10 developed a spatial zero-inflated generalized Poisson model to study the incidence of meningococcal disease. More recently, Recta et al. 11 proposed a correlated spatial Poisson hurdle model for point-referenced zero-inflated data. In the spatiotemporal setting, Fuentes et al. 12 developed a noninflated generalized Poisson model for fine particulate risk assessment, while Ver Hoef and Jansen 13 introduced spatiotemporal ZIP and Poisson hurdle models to investigate haulout patterns among harbor seals.
The approach taken here extends this prior work in several ways. First, we propose dynamic space-time models that provide temporal smoothing of each spatial unit through a set of autoregressive interactions, thereby improving small-area estimation. Second, we include multivariate space-time random effects linking the model components, which have been shown to improve inferences. 7 Third, we incorporate individual- and region-level information through a hierarchical structure to better explain spatiotemporal trends. And finally, we consider a range of distributional specifications designed to address overdispersion. The models have the additional advantage of being easy to implement in standard Bayesian software packages, such as WinBUGS. 14
The remainder of the paper is organized into five sections: the following section describes the DSR data, Section 3 outlines the proposed models, Section 4 details the Bayesian model-fitting approach, Section 5 applies the models to the DSR data, and Section 6 provides a discussion and points to areas for future research.
2 The DSR data
The Duke University DSR has been in existence for over a decade. Originally built as an administrative and financial database, the DSR holds 17 years of demographic, diagnostic, and billing data on over four million patients seen in the Duke University Health System. The data have been deployed for secondary use in numerous research studies and quality improvement initiatives.15,7
As part of an ongoing study exploring contributors to ED use, university researchers recently reviewed patient records for Durham County residents who were seen at either an ED or non-ED clinic at least once between 2007 and 2011, the most recent year for which records were available. The records were georeferenced by residential address and subsequently linked at the Census block group level to data from the 2005–2009 American Community Survey. 16 Block groups are collections of residential blocks, and as such, form the second-smallest geographic level set forth by the US Census Bureau.
The final dataset contained over 122,000 records for approximately 40,000 patients and included information on the annual number of ED visits for each patient; patient demographics, such as age, race, gender, and insurance status; and median household income of each of the 129 Census block groups in Durham County. Because patients could appear in the database in multiple years, the number of records per subject ranged from one to five, with most patients having three or fewer records over the course of the five-year study period.
Summary of DSR patient records
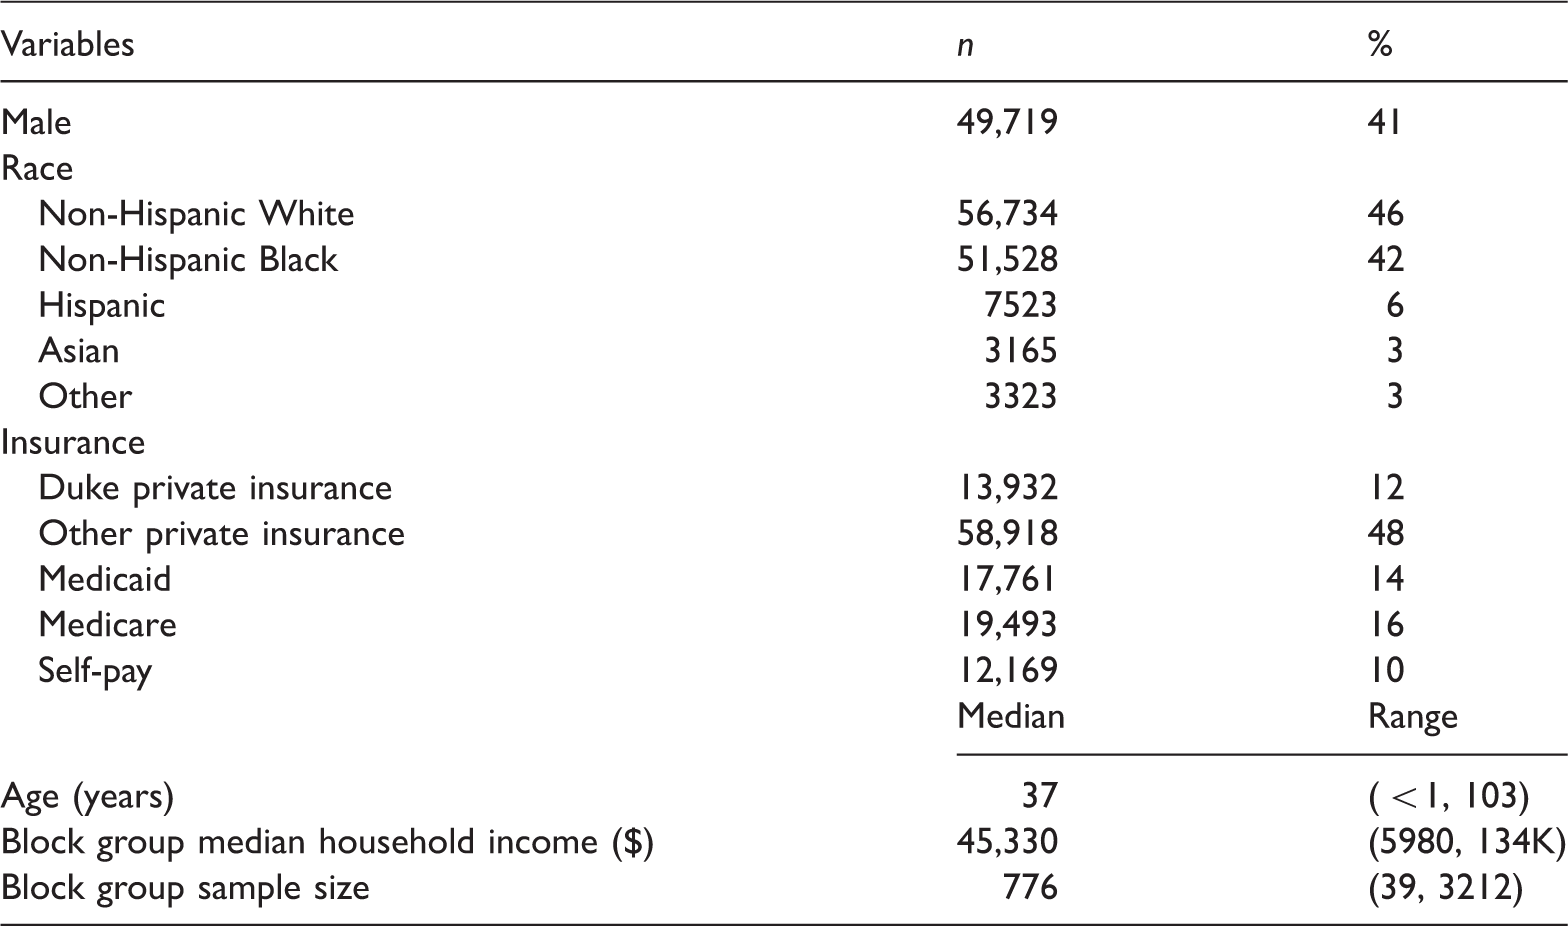
Figure 1 presents a partial histogram of the annual number of ED visits up to 10 visits. Over 70% of the patient-year records were zero, meaning that a patient made no ED visits in a given year. The number of nonzero visits ranged from one to 91, with 5% of the patients having greater than six visits in any one year. Using Vuong’s procedure,
18
we tested for zero inflation relative to standard Poisson and negative binomial regression models that included gender, race, insurance, age, and block group median income as predictors. The tests indicated significant zero inflation relative to both count distributions ( Partial histogram of annual ED visits, 2007–2011.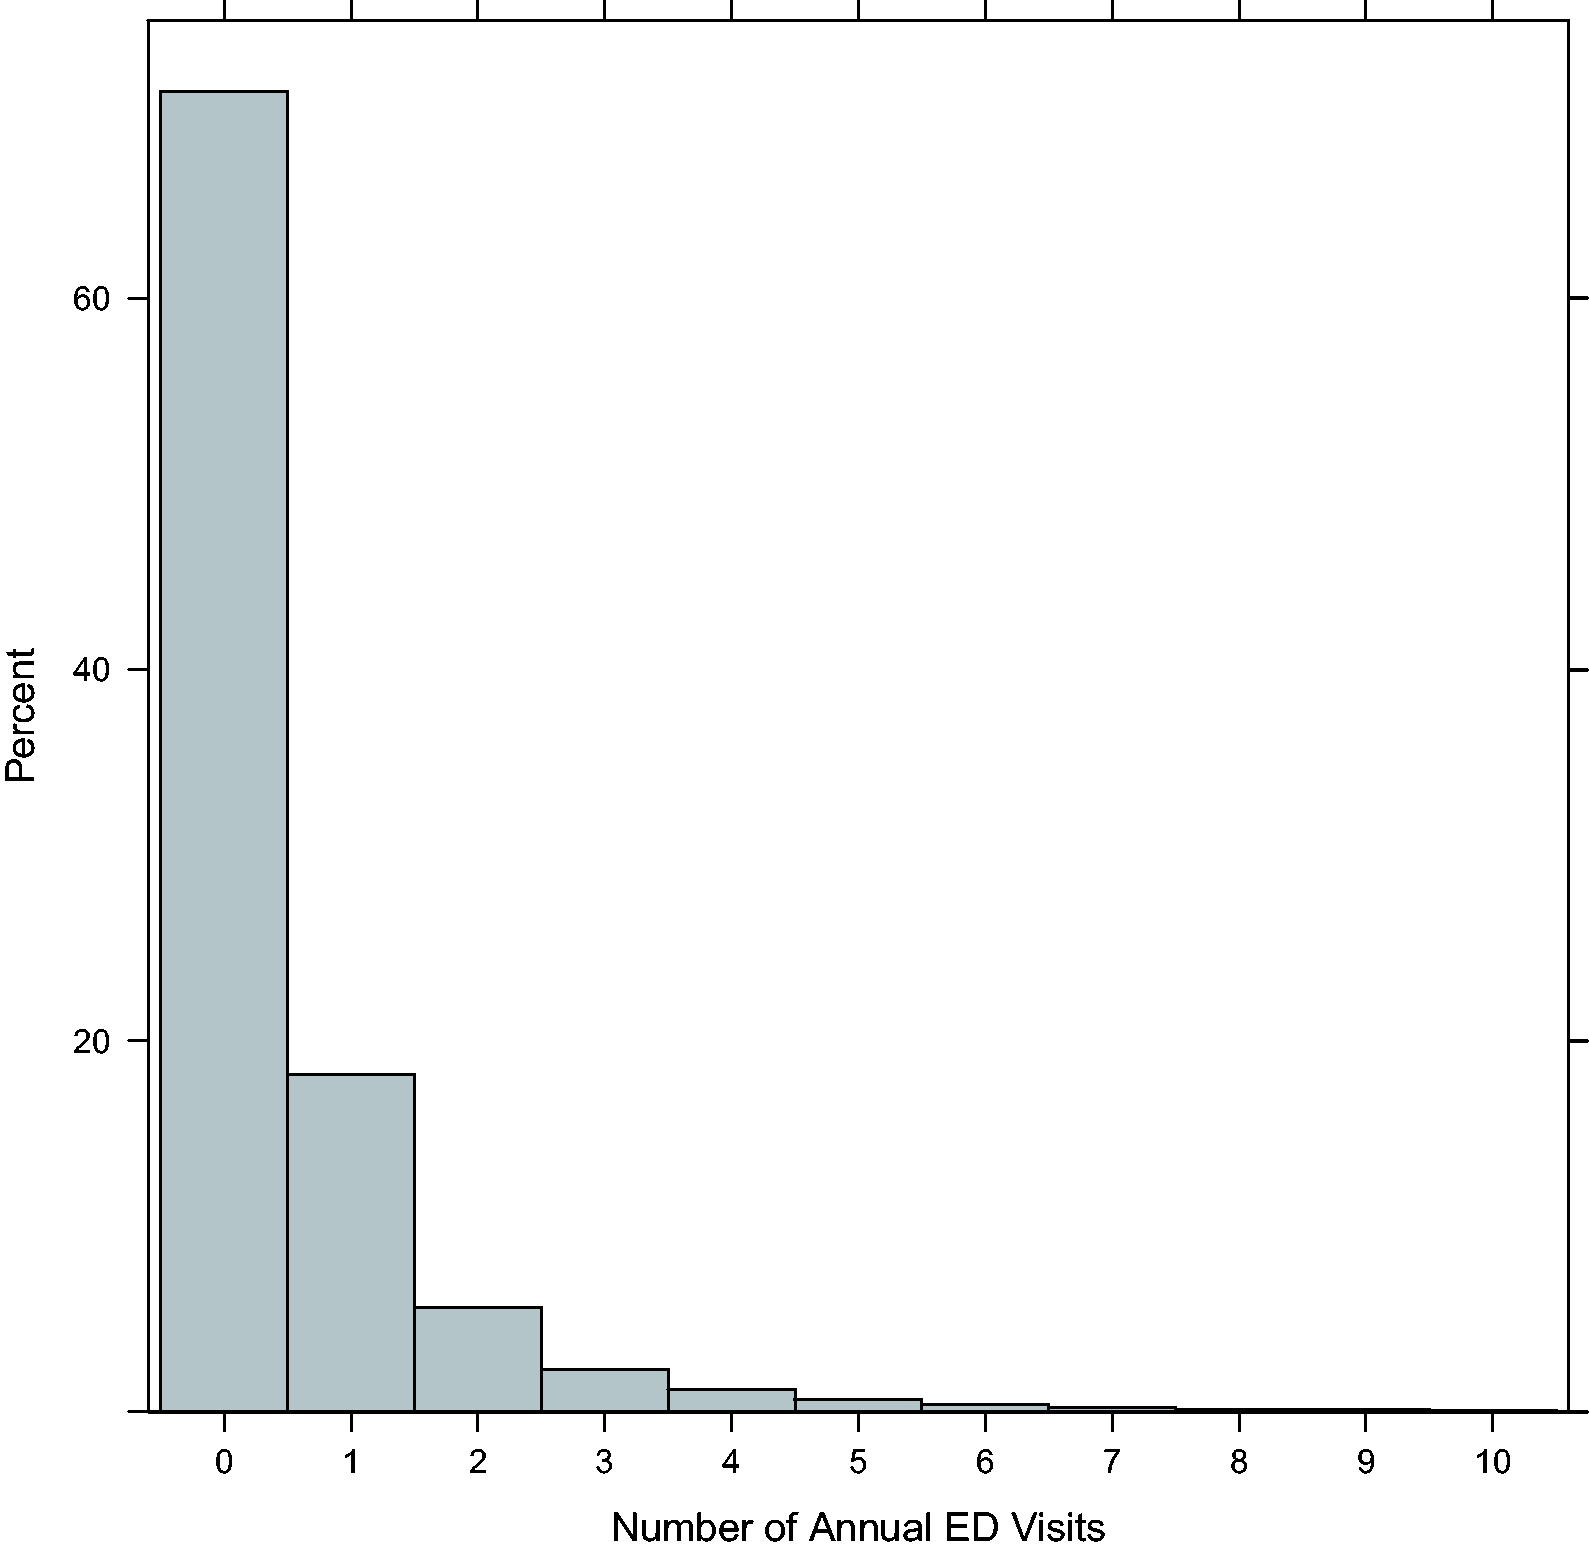
Figure 2 displays the percent of ED users (upper panel) and the mean number of ED visits among users (lower panel) by block group and year. Patients were considered ED users if they had at least one ED visit during the year. In each year, the percent of ED users within block groups ranged from under 10% to over 60%, with the highest rates occurring in the central part of the county. The spatial pattern in ED use was fairly stable across years. There was considerably more variability in the mean number of visits among users, although generally speaking there was an increase over time, particularly along the county’s eastern border. The temporal variation seen here may be due in part to small sample sizes in certain block groups. We therefore expect the proposed models to induce a measure of spatial and temporal smoothing among these smaller areal units.
Percentage of ED users (upper panel) and mean number of ED visits among those with at least one ED visit (lower panel) for each of the 129 Durham County block groups from 2007 to 2011.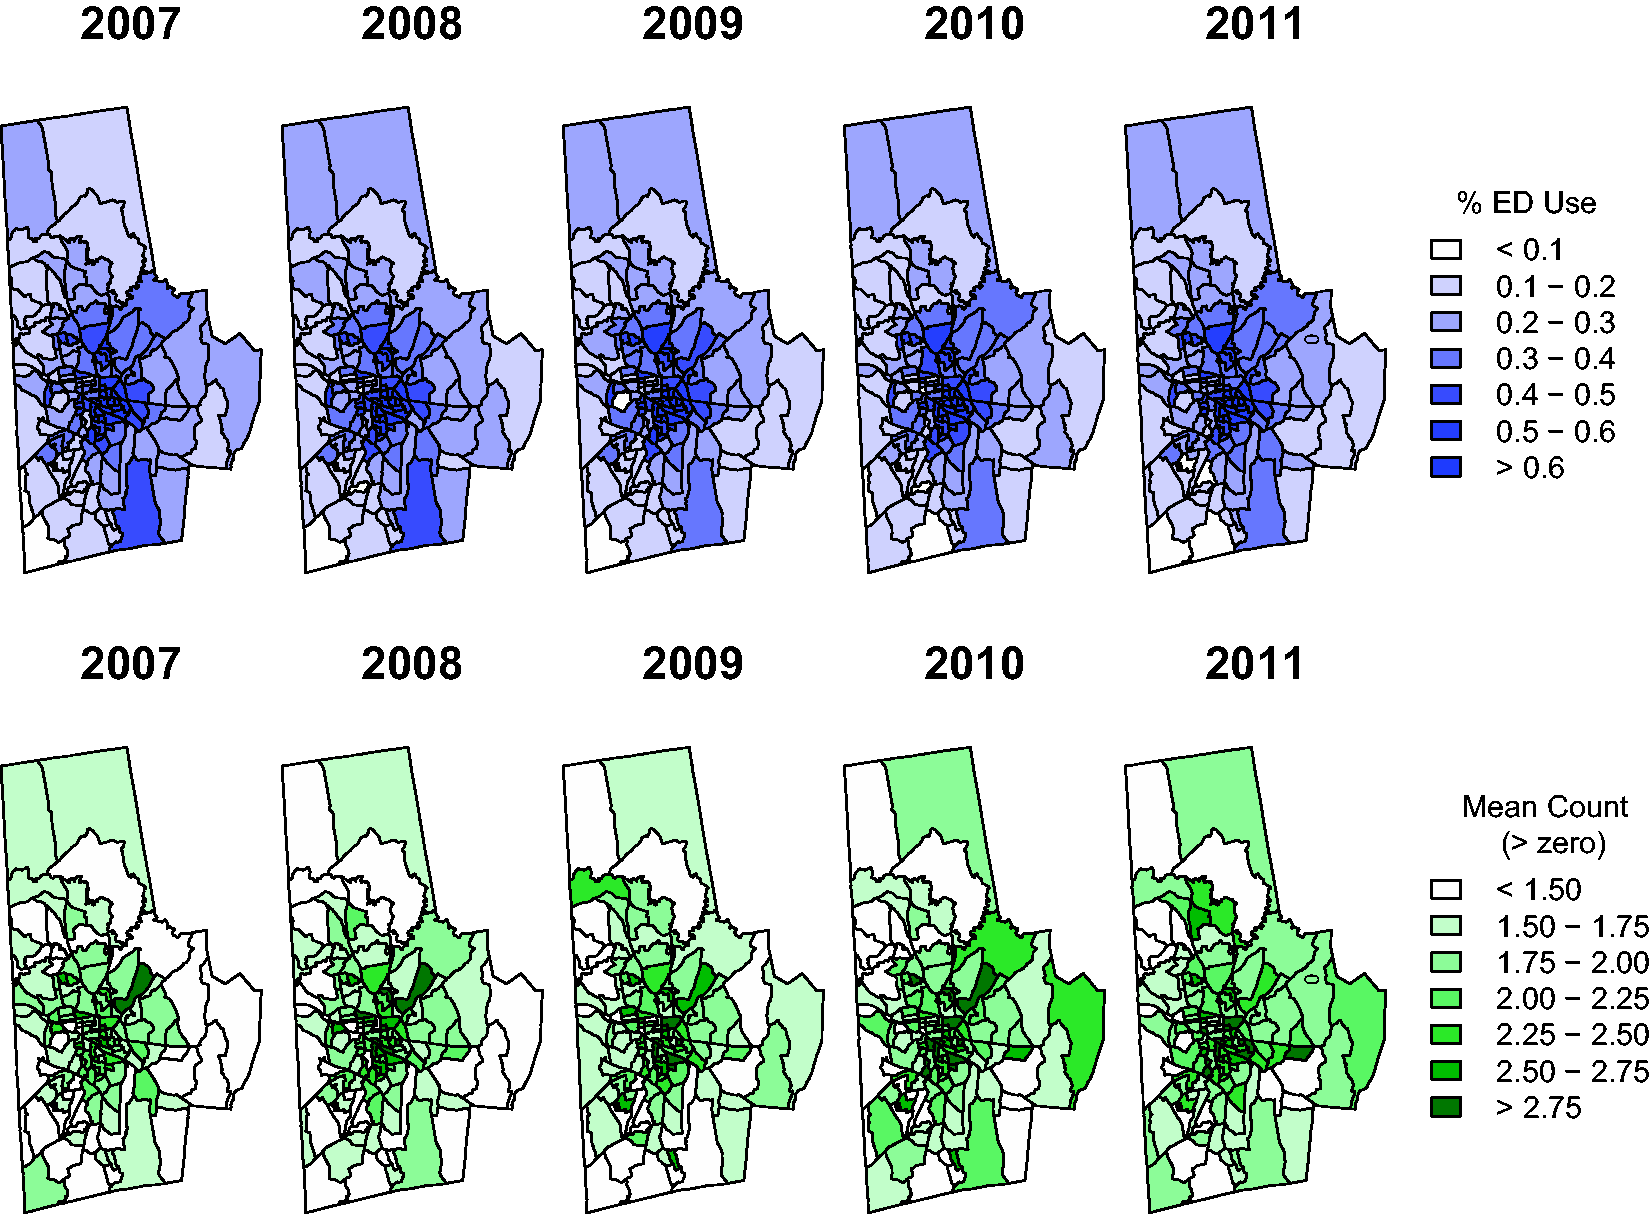
3 Proposed model
3.1 The hurdle model
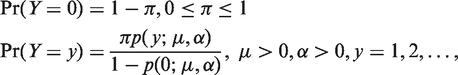
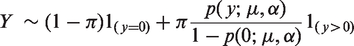
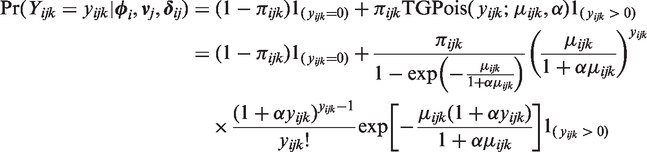
For the analysis of the DSR data, we consider a broad class of two-part hurdle models to address both zero inflation and potential overdispersion of the nonzero counts. Hurdle models are two-part mixtures consisting of a point mass at zero followed by a zero-truncated count distribution for the positive observations.19,20 Letting Y denote a count-valued response, the generic structure of the hurdle model is given by
Zero-inflated models 21 offer an alternative to hurdle models for the analysis of zero-adjusted count data. Unlike hurdle models, zero-inflated models partition zeros into two types: “structural” zeros (e.g., those that occur because a patient is ineligible for health services) and “chance” zeros (those that occur by chance among eligible patients). Zero-inflated models are thus an ideal choice when one hypothesizes the existence of a latent population of individuals with structural zeros. For the DSR analysis, we relied on hurdle rather than zero-inflated models because we regarded all patients as eligible for ED care, and hence there was no need to separately model the structural zeros.
3.2 Spatiotemporal hurdle model
To extend model (1) to the spatiotemporal setting, we propose the following space-time hurdle model
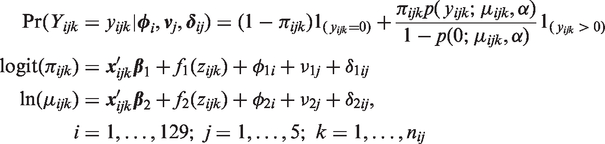
Thus, we partition the spatiotemporal effects into three parts: a purely spatial component, represented by
3.3 Choice of base distribution
To accurately capture the variability in the positive counts, we consider three choices for the base distribution: the Poisson, negative binomial, and generalized Poisson distribution.
22
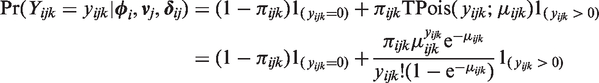
The spatiotemporal Poisson hurdle model is expressed as
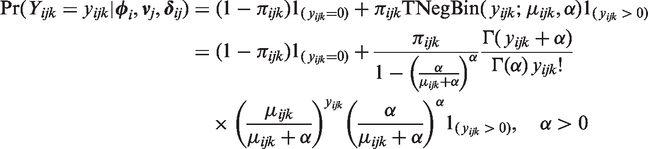
An alternative is to select a negative binomial base distribution, giving rise to the spatiotemporal negative binomial hurdle model
Lastly, we consider the spatiotemporal generalized Poisson hurdle model
As in the negative binomial case, α functions as a heterogeneity parameter accommodating departures from equidispersion. In particular, if
4 Bayesian inference
We adopt a Bayesian modeling approach and assign prior distributions to all model parameters. In previous work, we found that the probability of ED use was positively associated with the expected number of visits given use (i.e., the model components were correlated) after accounting for both individual- and cluster-level covariates. We showed that explicitly modeling this between-component correlation improved inferences. To accommodate this association in the current study, and to provide adequate spatial and temporal smoothing, we assume bivariate intrinsic conditional autoregressive model (BICAR) priors for the spatiotemporal random effects.
24
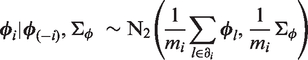
For example, for the spatial main effects, we assume the following BICAR prior
For the temporal main effects, we consider two specifications. First, we assign a BICAR prior to
For the space-time interactions, we assume a first-order dynamic BICAR prior,
25
whereby
To complete the prior specification, we assign improper priors to the fixed-effect intercepts, diffuse normal priors to the remaining fixed effects and spline coefficients, inverse-Wishart (IW) priors to covariance matrices, and a uniform U
Posterior computation proceeds via Markov chain Monte Carlo (MCMC), which can be implemented easily within WinBUGS. Although WinBUGS does not have a pre-designated function for truncated count distributions, one can apply the “zeros trick” to explicitly define the hurdle likelihood. 26 The BICAR prior can be specified with the mv.car function, and the remaining MCMC steps are readily coded using standard WinBUGS syntax.
We monitor MCMC convergence using trace plots and Geweke’s z-test,
27
which assesses the compatibility of disjoint portions of the sampler. For model comparison, we adopt the deviance information criterion (DIC) proposed by Spiegelhalter et al.
28
DIC is defined as DIC
To further evaluate model fit, we propose a series of posterior predictive assessments, whereby the observed data are compared to data replicated from the posterior predictive distribution. 29 If the model fits well, the replicated data should resemble the observed data. To quantify the degree of similarity, one typically chooses a “discrepancy statistic,” such as a sample moment or quantile that captures some important aspect of the data. For the DSR analysis, we adopt three discrepancy measures: the sample proportion of zeros and the sample mean and variance among the positive observations. For each measure, we compute the posterior predictive mean and 95% credible interval (CrI). A 95% CrI that includes the observed sample value suggests adequate model fit. In addition to the above measures, for the final model we also produce a histogram comparing the observed and posterior-predictive counts of ED visits.
5 Analysis of the DSR data
We fit the Poisson, negative binomial, and generalized Poisson versions of the spatiotemporal hurdle model to the DSR data, with a logit link for the binary component. For each choice of base distribution, we considered two sub-models: a model with fixed temporal main effects and one with BICAR temporal effects. The models also included patient race, gender, age, and insurance, and block group median income as predictors. Since previous studies have suggested a nonlinear effect for patient age, 30 we modeled age using cubic B-splines with interior knots at the first, second, and third quartiles of the age distribution (20, 37, and 55 years, respectively).
For the model with fixed annual effects, we assumed independent
The models were fit in WinBUGS 1.4.3 and called into R 31 using the function R2WinBUGS. 32 We ran the sampler for 15,000 iterations, discarding the first 5000 as burn-in. Trace plots and Geweke diagnostics indicated rapid convergence and efficient mixing of the chains.
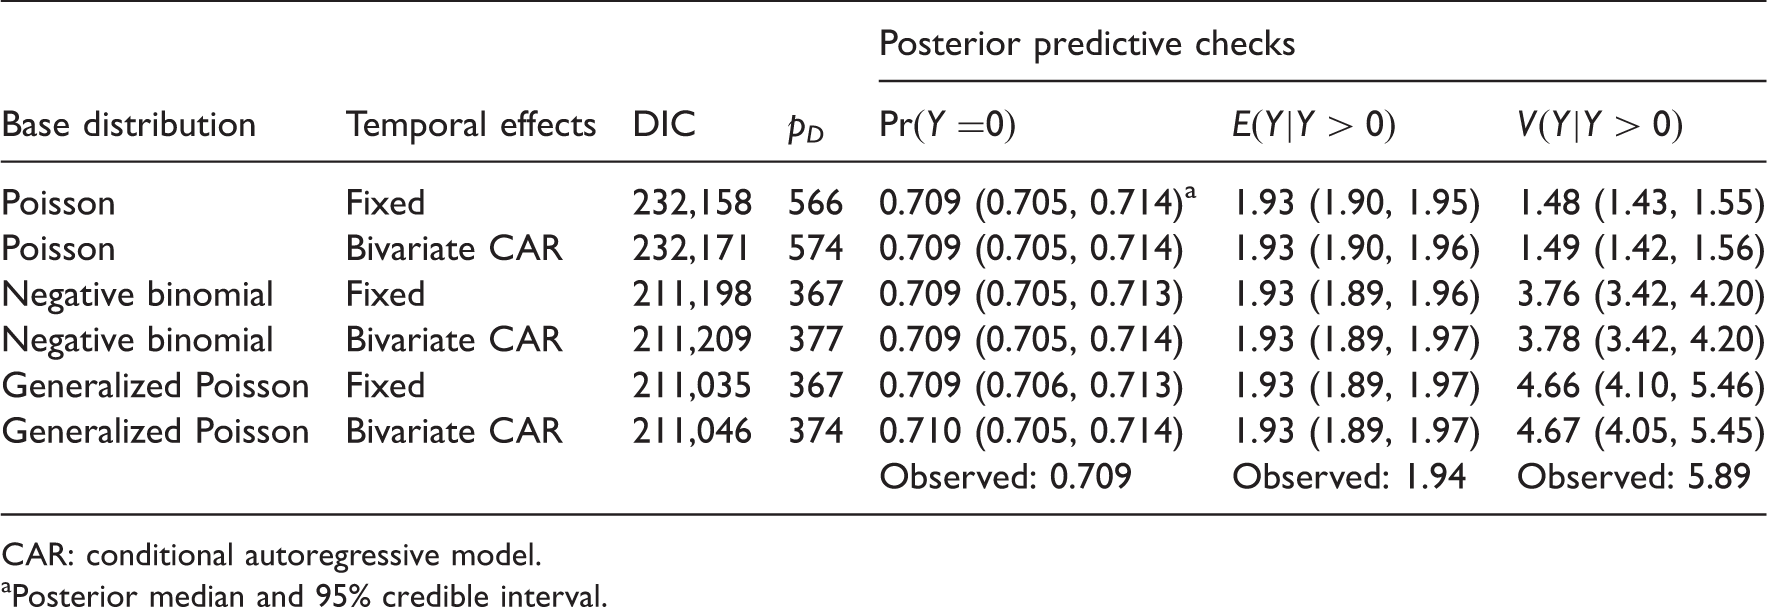
Model comparison results.
CAR: conditional autoregressive model.
Posterior median and 95% credible interval.
Posterior summaries for the Poisson, negative binomial, and generalized Poisson hurdle models.

CAR: conditional autoregressive model.
Reference: Calendar Year 2007.
Reference: Non-Hispanic White.
Reference: Other Private Insurance.
In contrast to the binary component, the parameter estimates in the count component varied substantially across the models, indicating that the choice of base distribution had a significant impact on covariate effects. For example, non-Hispanic Black race showed a much stronger effect for the negative binomial and generalized Poisson models than for the ordinary Poisson models. A similar—albeit less transparent—phenomenon occurred for the federal and self-pay insurance categories: while all models showed a positive effect, the effect was most pronounced in the two overdispersed models.
Interestingly, for all models, the adjusted estimates for male gender and Hispanic race reversed direction between the binary and count components. Hispanics, for example, were more likely than non-Hispanic Whites to visit the ED at least once; however, among ED users, they tended to make fewer visits than Whites. This points to a potential difference between the way Hispanics and non-Hispanic Whites use ED services. In particular, although modest ED use seems to be more ubiquitous among Hispanics, they are less inclined than Whites to use EDs repeatedly.
And finally, there was moderate positive correlation between spatial main effects for the two components, with
Using the above parameter estimates, it is straightforward to make clinically meaningful inferences of interest. For example, suppose one wishes to compute the incidence density ratio (IDR) comparing the mean number of visits over five years for self-pay patients to those with non-Duke private insurance. The IDR in this case is defined as
Figure 3 displays the age trends on the linear-predictor scale for the two components of the generalized Poisson hurdle model. The figure shows a multimodal effect for age, with ED use decreasing during the first decade of life, increasing steadily until around age 30, and then declining until age 75 before a final upswing to its peak level late in life. A similar pattern is observed for the number of visits among users, but here the mode occurs during infancy rather than among the elderly.
Age effect on linear-predictor scale for the binary component (left panel) and count component (right panel) for the generalized Poisson hurdle model. Horizontal lines denote effect at age = 0. Dashed lines denote 95% posterior intervals.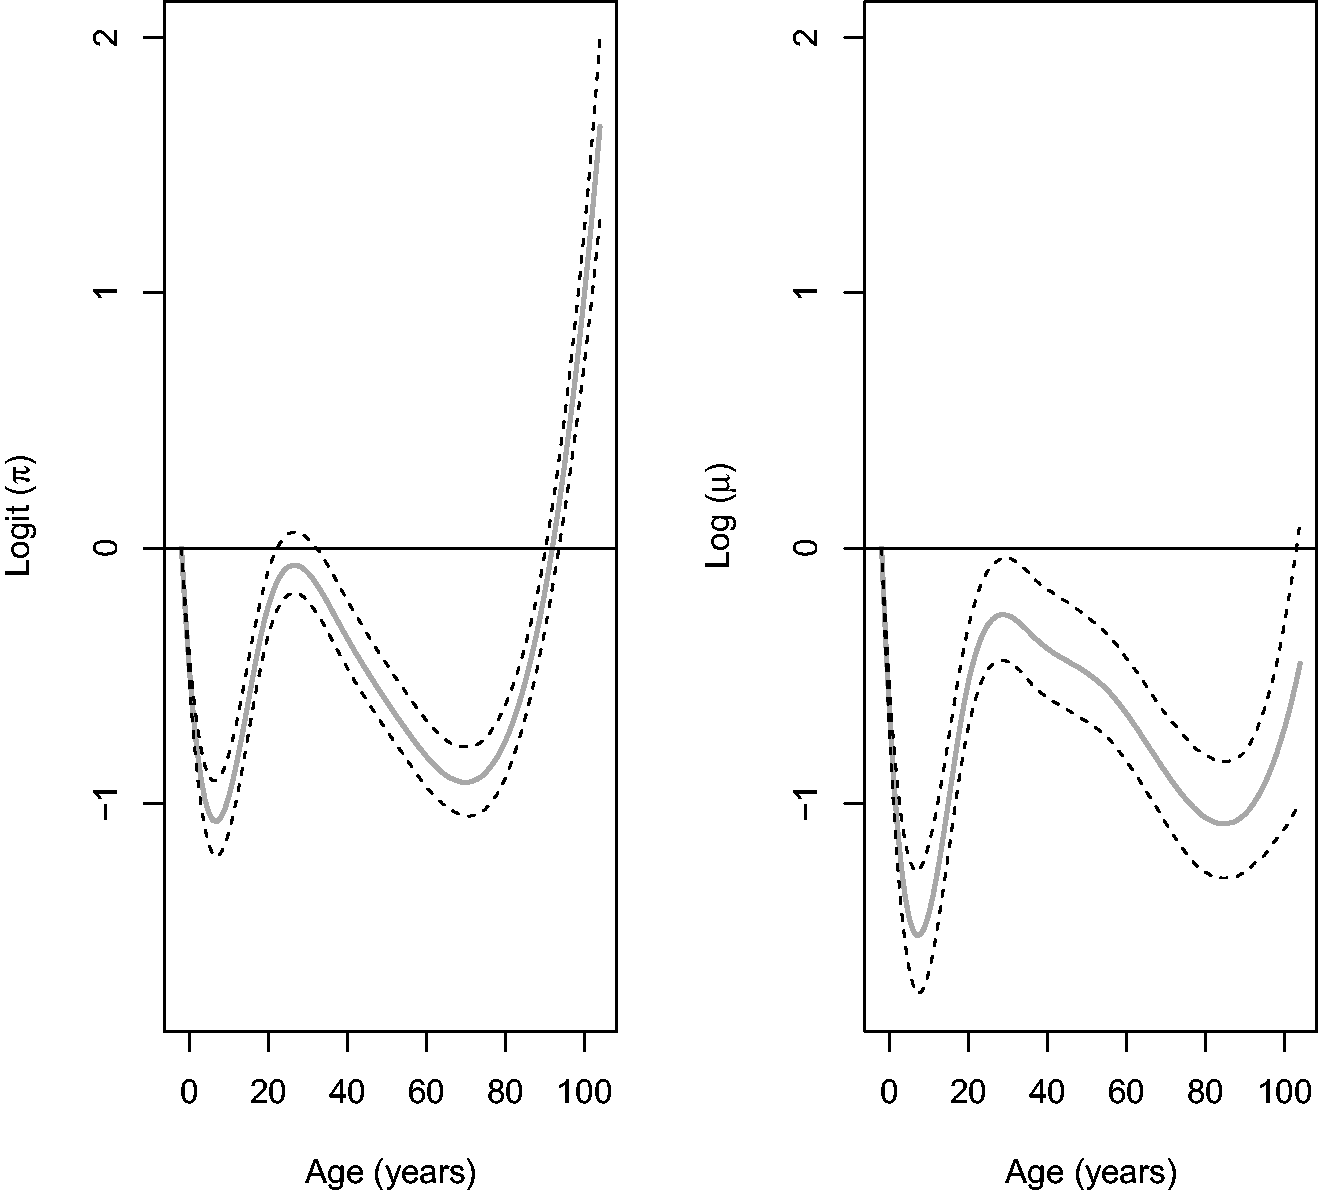
Figure 4 presents yearly maps of the predicted spatiotemporal effects, Spatiotemporal random effects for the binary (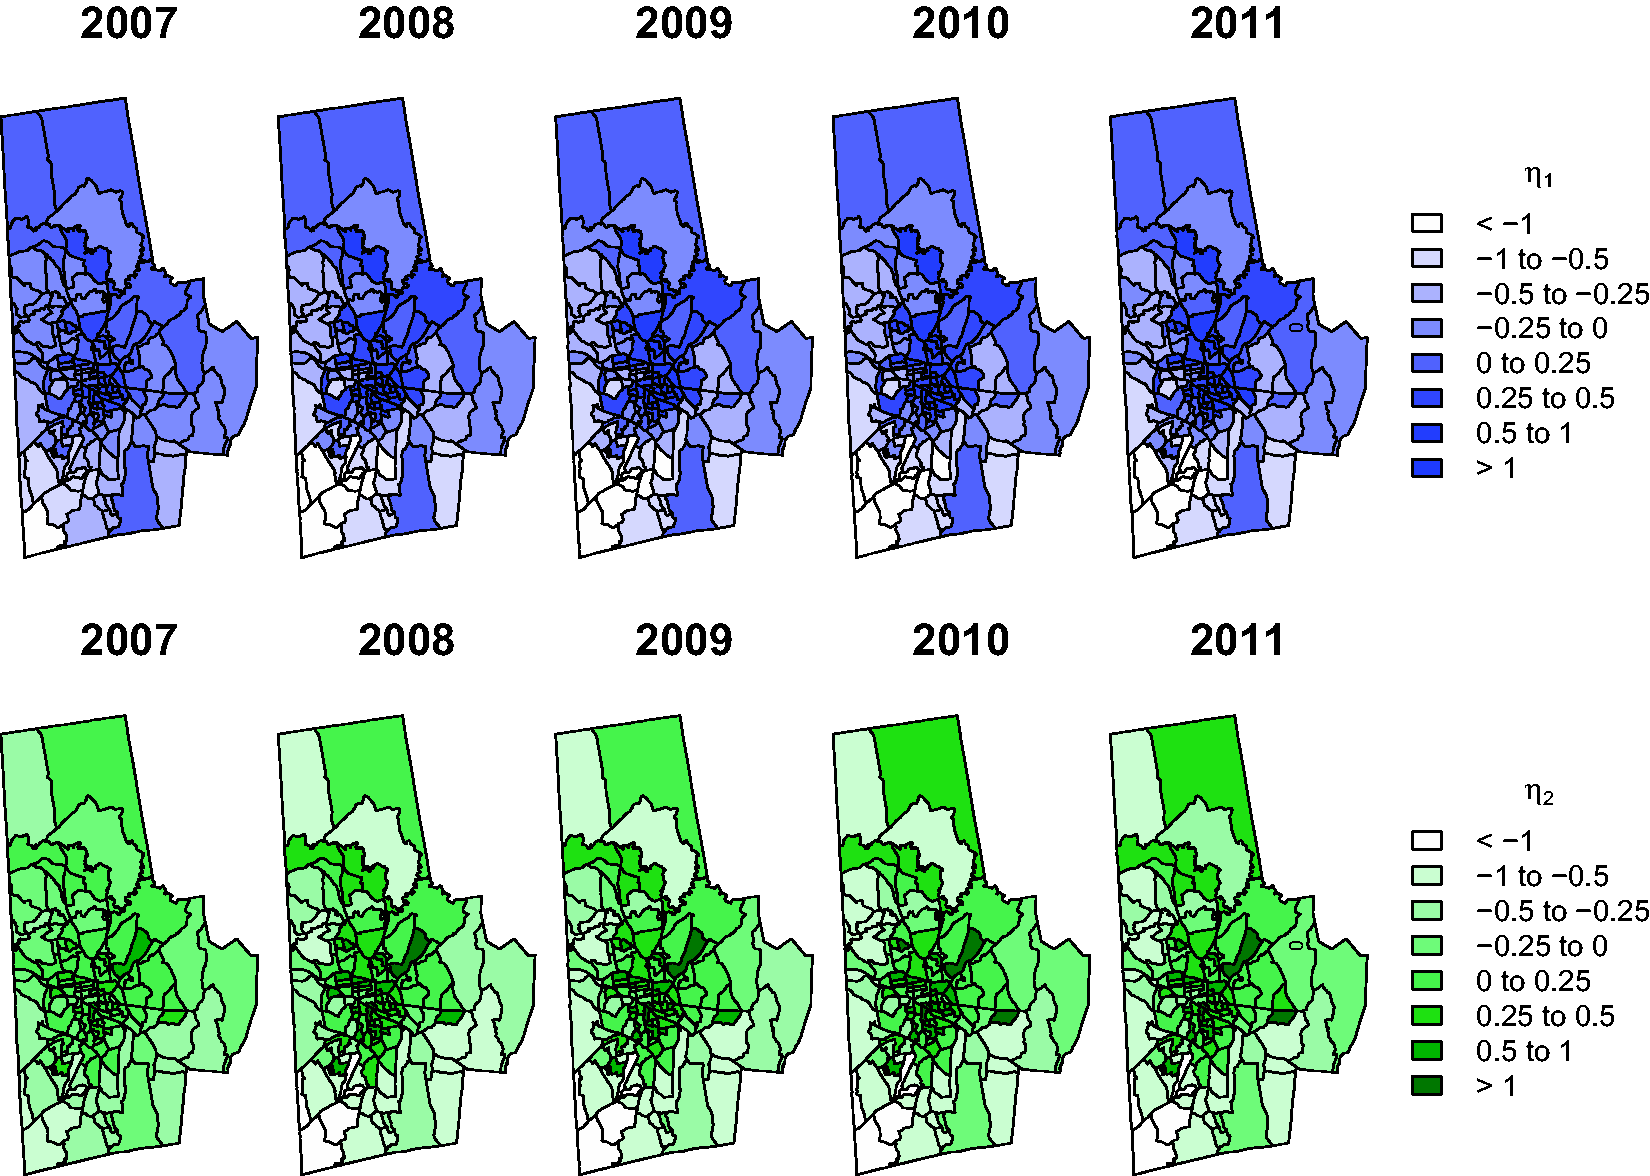
The shift in spatial pattern from 2007 to 2008 is even more evident in Figure 5, which presents caterpillar plots of the spatiotemporal effects for years 2007–2011 ranked in decreasing order on the log-odds scale. Positive (negative) effects indicate above (below) average ED activity, adjusting for other factors. Error bars denote 95% CrIs; intervals that exclude zero indicate significant effects. Overall, there was a noticeable change in the magnitude of the effects following 2007, although the direction of the effects generally remained the same. The change in magnitude was not uniform across block groups, however, with several block groups showing large increases and others showing little or no change. This highlights the importance of modeling the space-time interactions in order to capture block-group–specific temporal trends.
Spatiotemporal random effects for the binary (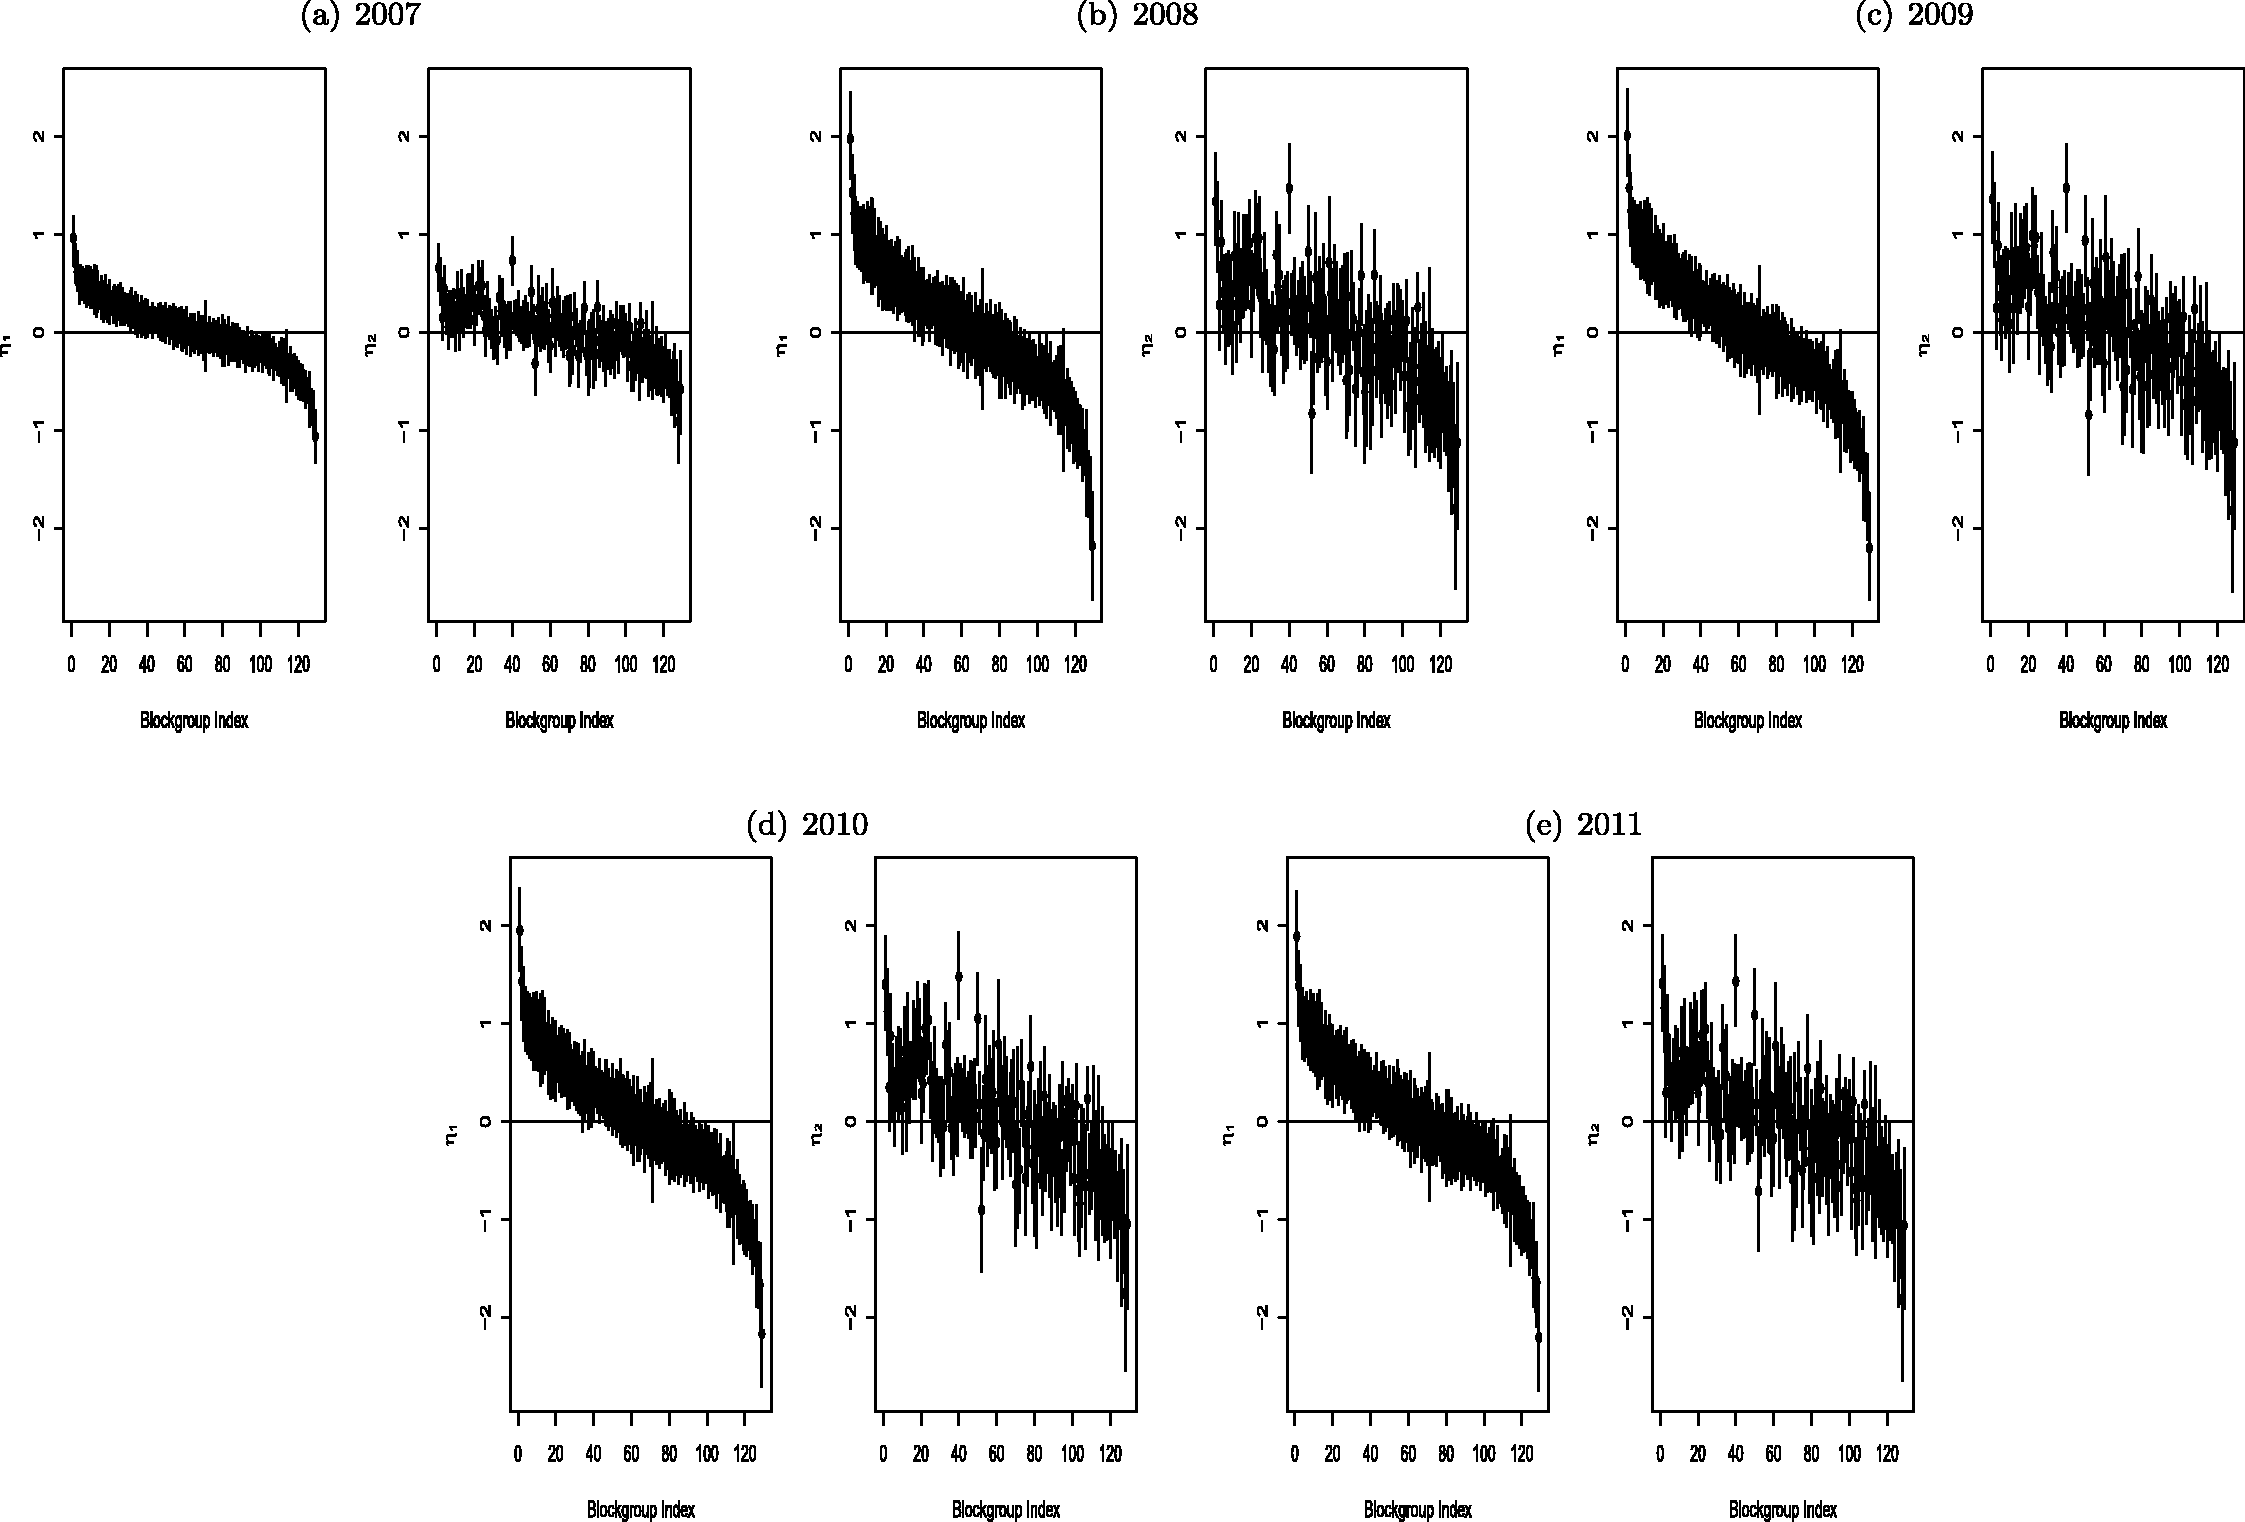
Consistent with Figure 4, the “high-ED” block groups (e.g., those indexed 1–20) were generally situated in the center of the county, whereas the “low-ED” block groups (110 and above) tended to be located on the outskirts of the county, particularly along the southwest border. The patterns for 2009–2011 are generally similar to the 2008 plot, suggesting that the main change in ED visits occurred between the end of 2007 and the end of 2008, remaining relatively stable thereafter. This is again consistent with the results from Figure 4.
As a final check of model fit, we compared histograms of the observed and posterior-predictive counts generated from the generalized Poisson hurdle model (Figure 6). The generalized Poisson model showed excellent fit, reproducing almost exactly the observed distribution of counts.
Partial histograms of observed and posterior-predicted (“fitted”) counts from the generalized Poisson hurdle model.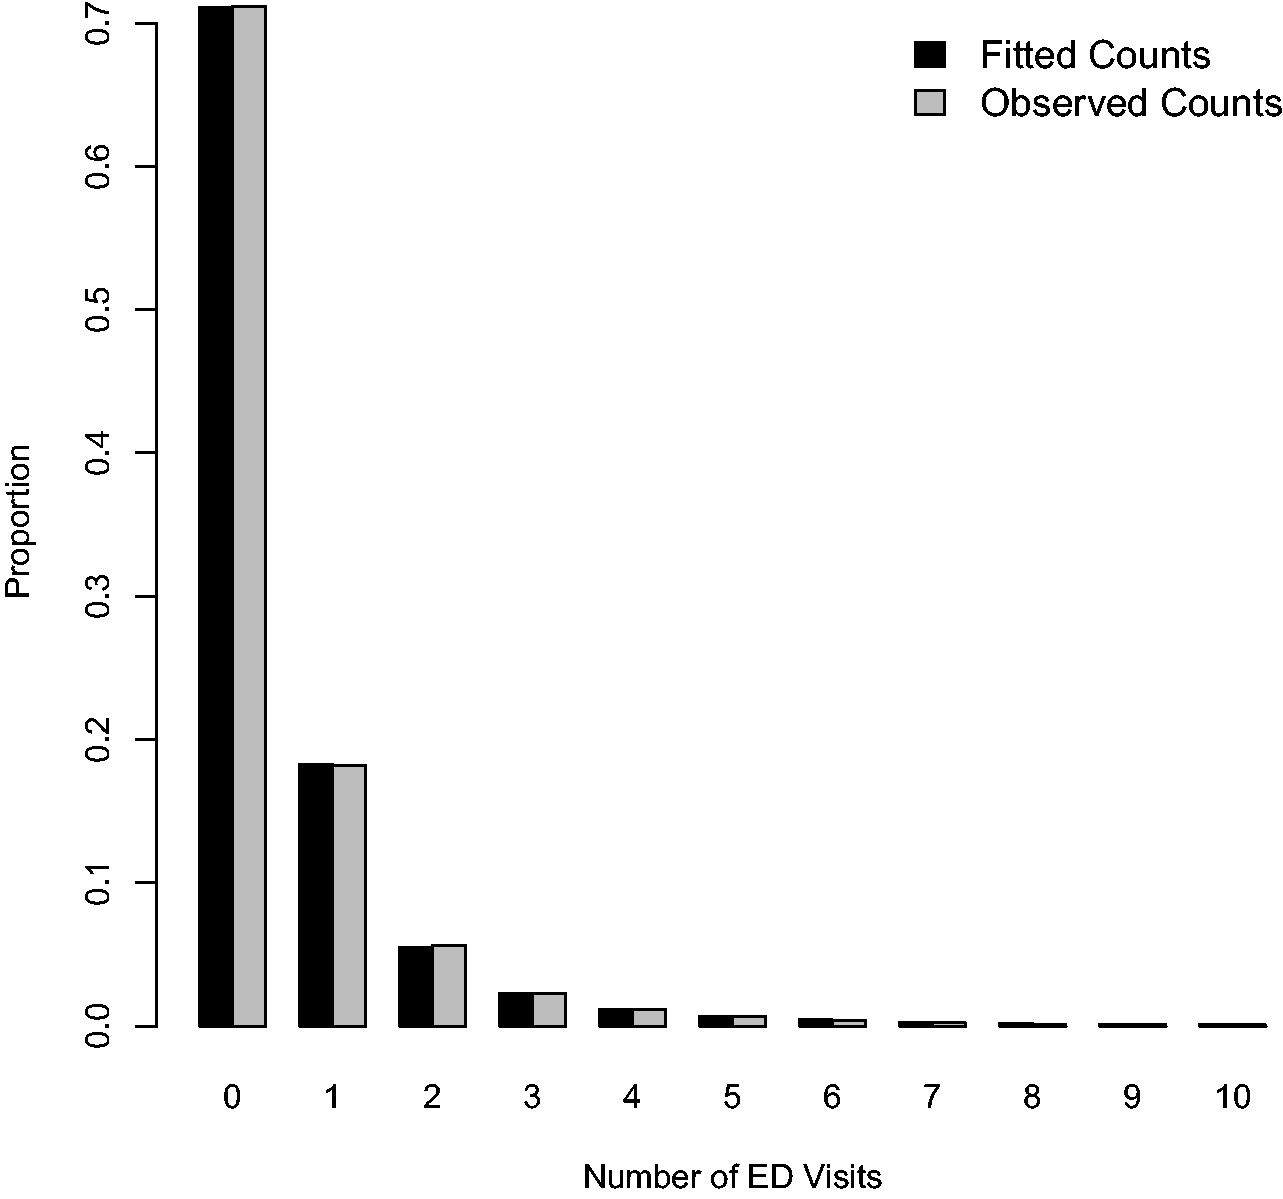
6 Discussion
We have introduced a series of two-part hurdle models for the spatiotemporal analysis of zero-inflated count data. The proposed models have several attractive features: they provide spatial and temporal smoothing to improve small-area estimation; they use multivariate space-time random effects to link model components; they incorporate individual- and region-level information to help explain spatiotemporal trends; and, depending on the choice of base distribution, they address potential over- or underdispersion in the counts. In addition, the models can be conveniently implemented in freely available packages such as WinBUGS.
In our application, models accommodating overdispersion, and in particular the generalized Poisson hurdle model, substantially outperformed the ordinary Poisson hurdle model. Because the negative binomial and generalized Poisson base distributions include the Poisson as either a limiting distribution (in the case of the negative binomial) or as a specific sub-model (in the case of the generalized Poisson), their performance should be comparable to the Poisson for equidispersed data while providing a distinct advantage for overdispersed data. Indeed, since both distributions arise as mixtures of ordinary Poissons, 23 they reduce to the Poisson in the case of a degenerate mixture. In the overdispersed (or nondegenerate) setting, the choice between the negative binomial and generalized Poisson base distributions will depend on the structure of the data, with the generalized Poisson typically providing better fit for highly skewed data. 23
Our analysis of the DSR data yielded several relevant public health findings. Nonprivate insurance, male gender, and non-Hispanic Black race were associated with increased ED use. Compared to non-Hispanic Whites, Hispanics were more likely to use the ED at least once but less inclined to make repeat visits. We also found a multimodal effect for age, with peak ED use occurring just after birth, around age 30, and after age 75. This trend may be due in part to increased rates of fever, cough, and upper respiratory infections among infants; injuries and spinal disorders among young adults; and falls, strokes, and cardiac events among the elderly.30,34 In all years, block groups in the center of county had the highest rates of ED use while those in the southwest had the lowest. These geographic differences may reflect lack of community resources, such as outpatient clinics, in some areas. And finally, the spatial pattern across block groups changed most noticeably between 2007 and 2008 before stabilizing in the later years. The increased ED use observed in central Durham following 2007 may be a result of the recent economic downturn beginning in late 2007.35,36
These findings have important policy implications for the management of ED-related care. By monitoring spatial patterns in ED use over time, policy makers can target communities with continued need for services such as mobile clinics and community health centers to reduce nonurgent ED visits. To maximize benefit, these facilities should accommodate a variety of schedules through flexible evening and weekend hours in order to serve patients who require routine care during nonbusiness hours. 37 Local officials can also establish urgent care facilities that offer alternative outlets for primary medical, dental, and mental health care. 38 Community-based efforts such as these are essential to alleviating ED burden and reducing patient wait times.
As part of ongoing research, we are currently conducting an analysis of trends in ED-related costs by developing a related two-part spatiotemporal model for semicontinuous data. For more on semicontinuous models, see Olsen and Schafer 39 and Neelon et al. 40 Future work might also incorporate individual-level random effects into one or both components of the hurdle model to explicitly model between-subject heterogeneity. This would lead to a three-level model providing an additional, though computationally more intensive, approach to modeling overdispersion in the ED counts.
In general, the models developed here, particularly those accommodating overdispersion, should prove useful for the spatiotemporal analysis of zero-inflated count data. The proposed Bayesian approach provides a practical framework for fitting such models.
Footnotes
Ethical approval
This work was conducted in accordance with a human subjects research protocol approved by Duke University’s Institutional Review Board.
Declaration of conflicting interests
The author(s) declared no potential conflicts of interest with respect to the research, authorship, and/or publication of this article.
Funding
The author(s) disclosed receipt of the following financial support for the research, authorship, and/or publication of this article: The work described in this manuscript is supported in part by Grant Number 1C1CMS331018-01-00 from the Department of Health and Human Services, Centers for Medicare & Medicaid Services, and in part by the Bristol Myers Squibb Foundation Together on Diabetes program, respectively. The contents of this manuscript are solely the responsibility of the authors and have not been approved by the Department of Health and Human Services, Centers for Medicare & Medicaid Services. This work was also supported in part by a methodology grant from the Duke University Department of Biostatistics and Bioinformatics, and in part by USEPA grant R834799. Its contents are solely the responsibility of the grantee and do not necessarily represent the official views of the USEPA. Further, USEPA does not endorse the purchase of any commercial products or services mentioned in the publication. The views expressed in this article are those of the authors and do not necessarily reflect the position or policy of the Department of Veterans Affairs or the United States government.