






Abstract
Multiple biomarkers on different biological pathways are often measured over time to investigate the complex mechanism of disease development and progression. Identification of informative subpopulation patterns of longitudinal biomarkers and clinical endpoint may assist in risk stratification and provide insights into new therapeutic targets. Motivated by a multicenter study to assess the inflammatory markers of sepsis in patients with community-acquired pneumonia, we propose a joint latent class analysis of multiple biomarkers and a time-to-event outcome while accounting for censored biomarker measurements due to detection limits. The interrelationship between biomarker trajectories and clinical endpoint is fully captured by a latent class structure, which reveals the subpopulation profiles of biomarkers and clinical outcome. The estimation of joint latent class models becomes more complicated when biomarkers are subject to detection limits. Based on a Metropolis–Hastings method, we develop a Monte Carlo Expectation–Maximization (MCEM) algorithm to estimate model parameters. We demonstrate the satisfactory performance of our MCEM algorithm using simulation studies, and apply our method to the motivating study to examine the heterogeneous patterns of cytokine responses to pneumonia and associated mortality risks.
1 Introduction
In biomedical and clinical research, multiple biomarkers are often measured over time to investigate the complex mechanism of disease development and progression. For example, CD4+ cell counts and plasma HIV RNA viral load have been studied as prognostic markers of HIV infection.1,2 Comprehensive neuropsychological tests were used to evaluate the underlying cognitive level in dementia study. 3 It is of great interest to determine the interrelationship between multiple biomarkers and their joint effects on the clinical outcomes. Our work was motivated by the Genetic and Inflammatory Markers of Sepsis (GenIMS) study, 4 a multicenter cohort study of patients admitted to the emergency departments with community acquired pneumonia (CAP). Multiple biomarkers were measured on the patients admitted to the hospital daily in the first week, and weekly thereafter while they were still in the hospital. One of the primary goals of GenIMS study is to examine the activation of pro- and anti-inflammatory biomarkers after pneumonia and their roles in predicting subsequent adverse events. The biomarker analysis of GenIMS study is challenging because some biomarkers are censored at detection limits due to the low sensitivity of the bioassays used in the study. In particular, two inflammatory biomarkers, interleukin-6 (IL-6) and interleukin-10 (IL-10), were censored at lower detection limits with moderate to heavy censoring rates that increase over time, necessitating the use of appropriate statistical methods to accommodate this level of censoring.
Joint models have been widely used to explore the association between biomarker trajectories and a clinical endpoint. The relationship between the longitudinal biomarkers and primary endpoint can be modeled through shared random effects 5 or latent classes. 6 The shared random effects approach assumes the population is homogeneous and links the two processes using a specific structure of random effects, while the joint latent class approach assumes a heterogeneous population and uses latent classes to fully capture the associations between two processes. For the GenIMS study, the investigators hypothesized that patients with CAP may have different patterns of cytokine responses to pneumonia that are associated with different mortality risks. In the previous report of GenIMS study, 4 the biomarker analysis was conducted in two stages. First, inflammatory biomarkers IL-6 and IL-10 were analyzed separately to identify the informative subgroups and then the two group memberships were used as covariates to predict the clinical outcome. This approach may not be efficient since the correlation between biomarkers was ignored in the subgroup identification. The results may also be biased because the group memberships are treated as if they are observed. Furthermore, the clinical outcome is not taken into account to determine the subgroups. In order to incorporate both longitudinal biomarkers and clinical outcome into subgroup identification while accounting for the correlation between biomarkers, we take a joint latent class modeling approach which allows exploring the heterogeneity of cytokine responses as well as the clinical outcome.
Several methods have been developed to account for the associations between multiple biomarkers in the joint modeling framework. In the joint models with shared random effects, the interrelationship between multiple biomarkers is often reflected by between-marker covariances of random effects in a multivariate mixed model.7–10 However, this approach has rarely been used for the joint latent class models to our best knowledge. To handle multiple cognitive tests in a joint latent class model, model, Proust-Lima et al. 3 considered a common longitudinal latent process, where each test was linked to this process through a flexible nonlinear measurement model. This idea is well suited to the study of cognitive decline and dementia when comprehensive tests were designed to estimate the underlying cognitive level, but it may not be very applicable for other studies such as GenIMS study when multiple biomarker profiles actually represent different pathways and may not share an underlying latent process. In this paper, we develop a joint latent class model to accommodate the correlations between biomarkers via a covariance structure of marker-specific random effects, similarly to the joint models with shared random effects.
As mentioned previously, the censored biomarker data in the GenIMS study requires appropriate handling. Statistical methods based on maximum likelihood estimation have been proposed to handle the censored longitudinal biomarkers in mixed models2,11–13 and joint models with shared random effects.10,14 Nevertheless, there is still no readily available algorithm and software to accommodate two censored biomarkers and a survival outcome in the shared random effects models. The common strategy to address censored data is to incorporate the contribution of left-censored observations by using a cumulative distribution function in the likelihood function. We adopt this strategy to handle left-censored biomarkers in joint latent class models. Since the random effects for longitudinal biomarkers are not shared between submodels, most computational methods for joint latent class models used simple Expectation–Maximization (EM) algorithm or direct optimization of the joint likelihood function. However, these methods cannot be readily applied to the case of censored data. Recently, we developed a Monte Carlo EM (MCEM) method based on Metropolis–Hastings algorithm for joint latent class analysis of a censored biomarker and a binary outcome. 15 We now extend this approach to multiple censored biomarkers and a time to event outcome.
The remainder of the paper is organized as follows. In Section 2, we lay out the framework of the joint latent class model and present the estimation procedure via the MCEM algorithm. A simulation study is presented in Section 3. In Section 4, we apply our proposed method to the GenIMS study and demonstrate the utility of joint latent class models for subgroup identification. We conclude the paper with discussions in Section 5.
2 Joint latent class modeling of longitudinal and survival outcomes
We consider a joint latent class model, with three submodels corresponding to latent class membership, survival outcome, and longitudinal biomarkers, respectively. Given the latent class, longitudinal biomarkers and survival outcome are assumed to be independent. In the following, we first specify the models for each component, and then provide the joint likelihood function to account for the censored data in biomarker measurements. Next, we present a MCEM algorithm to estimate the joint latent class model. In the end, we describe the posterior classification method, prediction of survival probability using biomarkers, and a score test to check the conditional independence assumption.
2.1 Model description
2.1.1 Class membership model
Suppose a study cohort of n subjects consists of K heterogeneous latent classes (subpopulations). Let
2.1.2 Class-specific survival model
Let Ti be the true survival time and Ui be the potential right censoring time for the ith subject. Define
2.1.3 Class-specific multivariate linear mixed model
Suppose we have R biomarkers in total and let
The fixed effect τrk is a common or class-specific vector of coefficients for biomarker r, associated with a covariate vector
The interrelationship among multiple biomarkers is characterized by the correlations of marker-specific random effects. Let
When there are detection limits due to the low sensitivity of the bioassay used, biomarker level
2.2 Joint likelihood function
Let
2.3 Estimation procedure
When there are no censored data in the biomarker measurements, the estimates of parameters in joint latent class models can be obtained using a standard EM procedure as shown in Lin et al. 16 However, the use of cumulative distribution function for the censored observations makes the calculation of conditional expectations in the E-step intractable. We recently developed an MCEM algorithm for joint latent class modeling of a binary outcome and one longitudinal biomarker with censored observations. 15 This approach can be extended to the case of multiple biomarkers and survival outcome as illustrated below.
Let θ represent all the parameters in the joint latent class model. The complete-data log-likelihood of θ based on the observed data Oi, unobserved random effects bi and latent class vector Ci is defined as
In order to calculate the conditional expectations in E-step given the observed data Oi, we generate posterior samples of bi and Ci using Metropolis–Hastings algorithm, as described in our previous work. 15
In the M-step of the
When there are no censored data in the biomarker measurements, the updates of
However, there are no closed form for
The choices of initial values are critical for joint latent class models. We first replace the censored biomarker measurements with half of the detection limits, and then obtain the initial values for longitudinal model and class membership model by using the R package (LCMM) developed by Proust-Lima et al. 17 The LCMM function fits a latent class linear mixed model using only biomarker information. The initial values of parameters in the survival model can be chosen by fitting a parametric survival model. As the mixture distribution under joint latent class models can have multiple local maxima, we fit our model with a set of values around the initials in order to find the global maxima. The MCEM algorithms are implemented with a given number of latent classes. In practice, Bayesian information criterion 18 (BIC) can be used to select the optimal number of classes. Additionally, clinical insights should be taken into account to ensure the latent classes are clinically meaningful.
As shown in Lin et al.,
16
the standard errors of parameters estimates can be obtained through the inverse of the observed information matrix. Under the EM algorithm, the observed information matrix can be approximated by the empirical information matrix
2.4 Posterior classification
Given the parameter estimates
We can classify subjects based on the derived posterior probabilities, with each subject being classified to the class which has the largest posterior probability.
2.5 Prediction of event probability using biomarkers
Let
and
which is the posterior probability of subject i belonging to class k given only longitudinal biomarkers up to time s,
2.6 Score test for conditional independence
The key assumption of a joint latent class model is the conditional independence between biomarkers and the survival outcome given latent classes and correct specification of covariates for biomarker and survival models. We evaluate this assumption by extending the score test in Jacqmin-Gadda et al.
19
to censored biomarker data. We test the null hypothesis of conditional independence given latent classes versus the alternative hypothesis that the survival outcome and the biomarkers are conditionally independent given both latent classes and random effects in the biomarker models. Therefore, the joint latent class model described in equations (1) to (3) is under null hypothesis H0. Under the alternative hypothesis
As shown in Jacqmin-Gadda et al.,
19
the score function under H0 can be expressed as
It has been shown that the robust variance has similar performance as the asymptotic variance.
19
Therefore, we use the robust variance to construct the score test. Under the null hypothesis,
3 Simulation study
In the simulation study, we generated a survival outcome and repeated measurements of two longitudinal biomarkers from the following joint latent class model with two latent classes (k = 1, 2).
Latent class model: Survival model: Bivariate mixed model:
where class-specific random intercept
The measurement errors
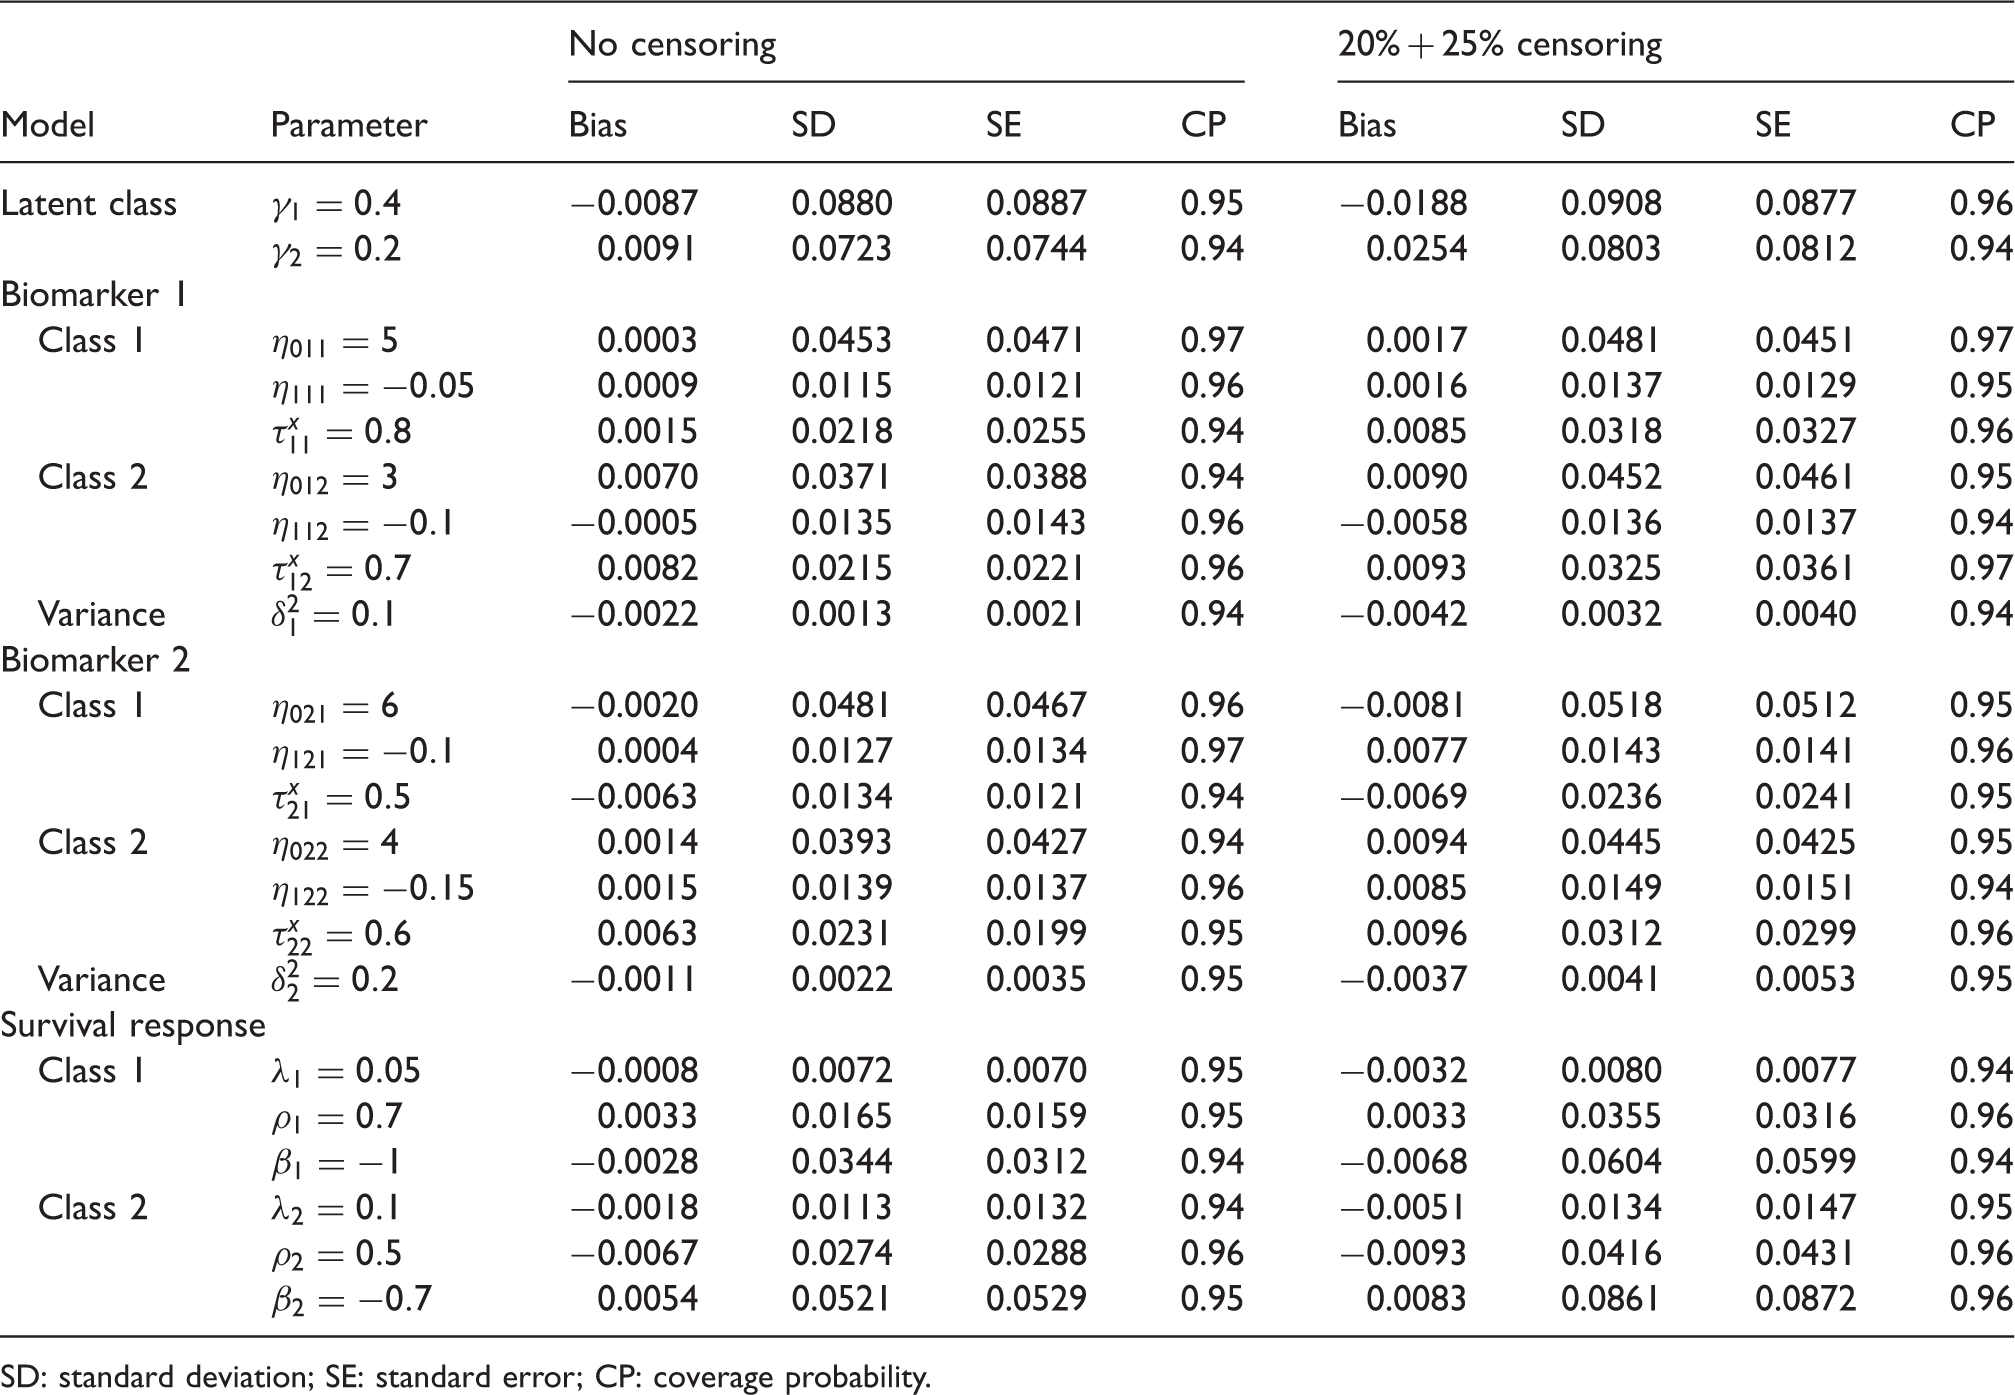
Simulation results for a joint latent class model with two biomarkers and two latent classes.
SD: standard deviation; SE: standard error; CP: coverage probability.
A total of 100 datasets with sample size n = 1000 are simulated. The model parameters are estimated by the proposed MCEM Algorithm. The estimating procedure was implemented in R and the source codes for simulation studies are provided in the Supplementary Material. The average computation time for a single simulated dataset was approximately 1 h when the R program was run on a computer with an Intel Core i7 7200 U @ 2.5 GHz processor and 8 GB of RAM. We summarize the bias, sample standard deviation (SD), mean standard error (SE), and empirical 95 % coverage probability (CP) for each parameter in Table 1. For comparison, we also provided the estimation results when the biomarkers are not censored at the detection limits. The estimates for all the parameters are approximately unbiased and the empirical coverage probabilities are close to 0.95 for both scenarios, with and without censoring. The means of the estimated standard errors are in good agreement with the empirical standard deviations of the estimates. As expected, the standard errors of regression parameter estimates are larger in general when the biomarkers are censored due to detection limits.
4 Application to GenIMS study
4.1 Data overview
The GenIMS study is a multicenter cohort study that enrolled 2320 subjects from the emergency department with CAP in 28 US academic and community hospitals between 2001 and 2003. 4 Multiple biomarkers on different biological pathways were measured on the patients admitted to the hospital daily in the first week, and weekly thereafter while they were still in the hospital. To illustrate our proposed methods, we focus on two cytokines, IL-6, a pro-inflammatory biomarker, and IL-10, an anti-inflammatory biomarker. Both IL-6 and IL-10 are subject to lower detection limits, with thresholds 2 or 5 pg/mL for IL-6 (depending on the bioassay used) and 5 pg/mL for IL-10, respectively.
The objective of our analysis is to determine the patterns of IL-6 and IL-10 profiles in the first week of hospitalization, and identify the subgroups of patients with different patterns of cytokine responses and associated risks of 90-day mortality. In the analysis cohort of 1882 subjects who had confirmed CAP and had at least one IL-6 measurement and one IL-10 measurement, the mean (SD) age was 67.3 (16.75), 52.1% were male, 80.8% were white, and 72.5% had Charlson Comorbidity Index (CCI) greater than zero. The overall 90-day mortality rate is 11.4%. The censoring percentage in biomarkers increased over time, ranging from 13.5% to 35.5% for IL-6, and from 46.9% to 78.9% for IL-10.
4.2 Model fitting
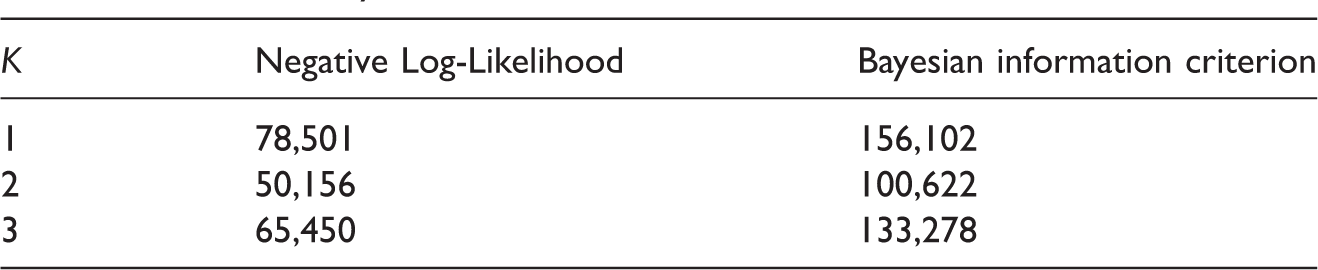
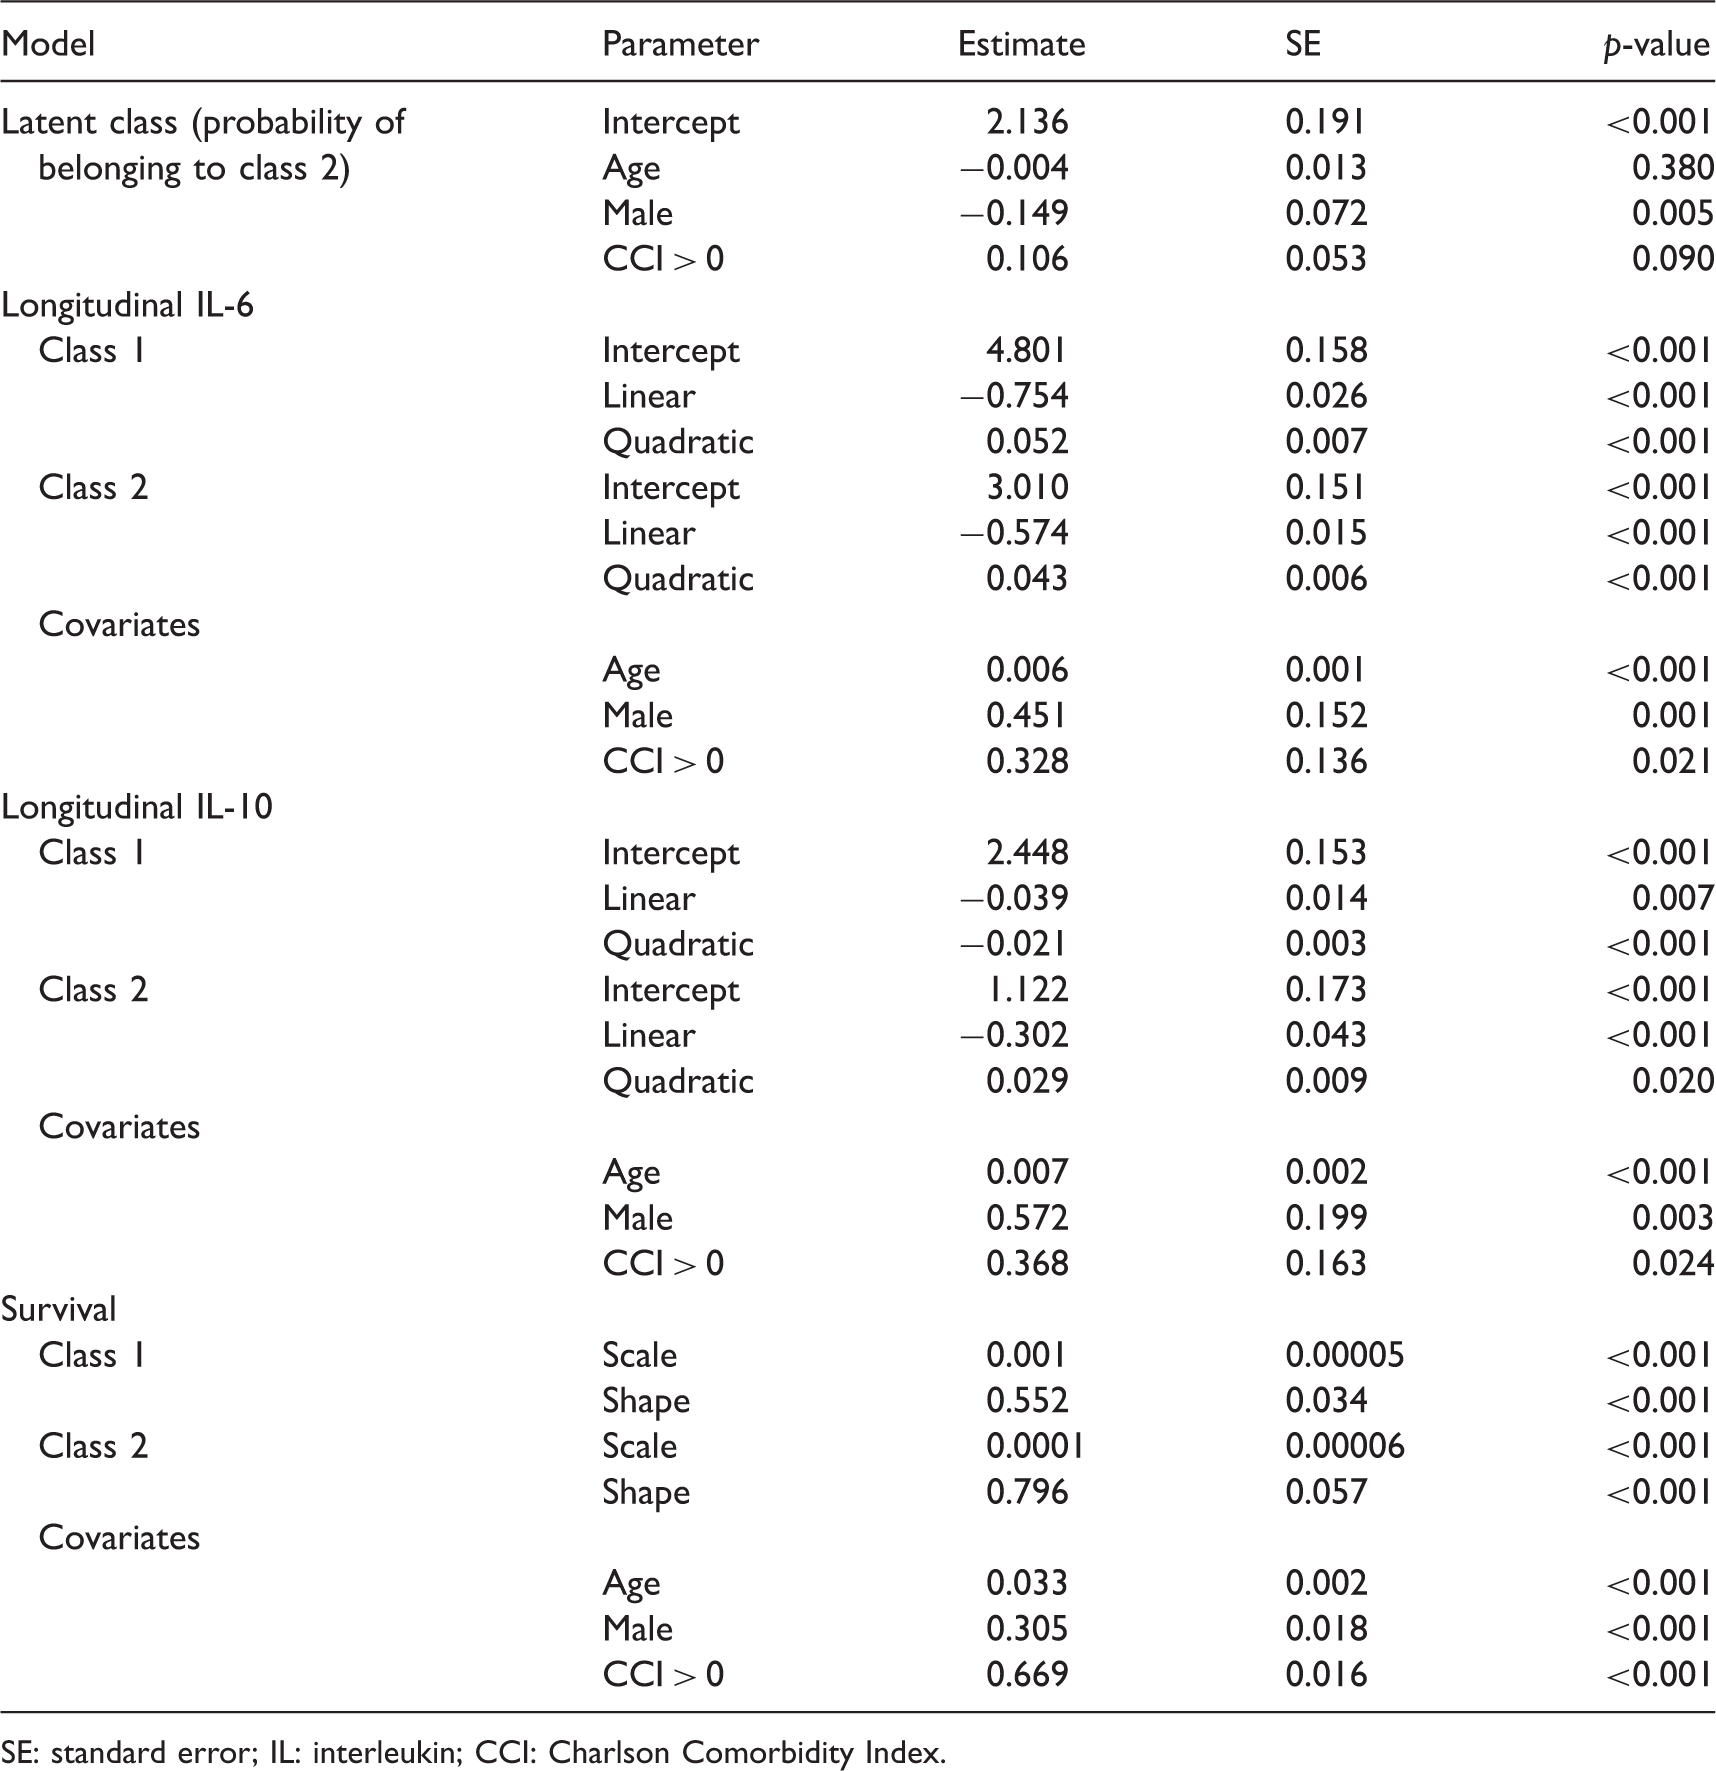
We fit a joint latent class model of survival time and two biomarkers: IL-6 and IL-10, with the number of latent classes varying from 1 to 3. The biomarker measurements were transformed to natural log scales in the analysis. Age, gender (1 for male, and 0 for female), and CCI (>0 vs. 0) are included as covariates in each component of the joint latent class model, and their effects on biomarkers’ trajectories and survival time are assumed to be common across the latent classes. Random intercept and slope are included in the mixed model for each biomarker. An unstructured covariance matrix is specified for the random effects to reflect the correlation between IL-6 and IL-10. The maximized log-likelihood values and BIC values are calculated for each of the three joint models and are listed in Table 2. The computation times are approximately 3, 10, and 28 h under K = 1, 2, and 3, respectively. A two-class joint model is optimal with the lowest BIC value, and the corresponding fitted model is summarized as follows. The standard errors and p-values based on Wald tests are also provided in Table 3.
Class membership model (k = 1, 2)
Survival model for 90-day mortality Bivariate mixed model for IL-6 and IL-10 in log scale GenIMS study: BIC for different numbers of latent classes. GenIMS study: Parameter estimates for the joint latent class model with two latent classes. SE: standard error; IL: interleukin; CCI: Charlson Comorbidity Index.
Mean IL-6:
Mean IL-10:
The variance estimates of measurement errors are 0.014 for IL-6 and 0.013 for IL-10. Denote the random intercept and slope by
The between-subject variations are larger in IL-6 than in IL-10, especially in the baseline level of IL-6. The correlation between random slope and random intercept are 0.14 and 0.15 for IL-6 and IL-10, respectively. The correlation between random intercepts of two biomarkers is −0.84, indicating a strong correlation between two biomarkers.
4.3 Latent classes characteristics
Figures 1 shows the class-specific estimated biomarker curves and survival functions for a male with age 67 and CCI score >0, respectively. We refer to class 1 with high IL-6 and high IL-10 values as “high cytokine” class and class 2 with low IL-6 and low IL-10 values as “low cytokine” class. The cytokine responses to pneumonia appear to be balanced between pro-inflammatory IL-6 and anti-inflammatory IL-10. After posterior classification, we found that about 89% of patients belong to “low cytokine” class. For patients with the same age, gender, and CCI status, those in “high cytokine” class have a consistently lower survival probability. On average, IL-6 decreases more rapidly in the first half of the week in “high cytokine” class compared to “low cytokine” class, while IL-10 declines relatively faster at the beginning in “low cytokine” class, but shows faster decline post day 4 in “high cytokine” class.
Fitted biomarker curves and survival functions. IL: interleukin.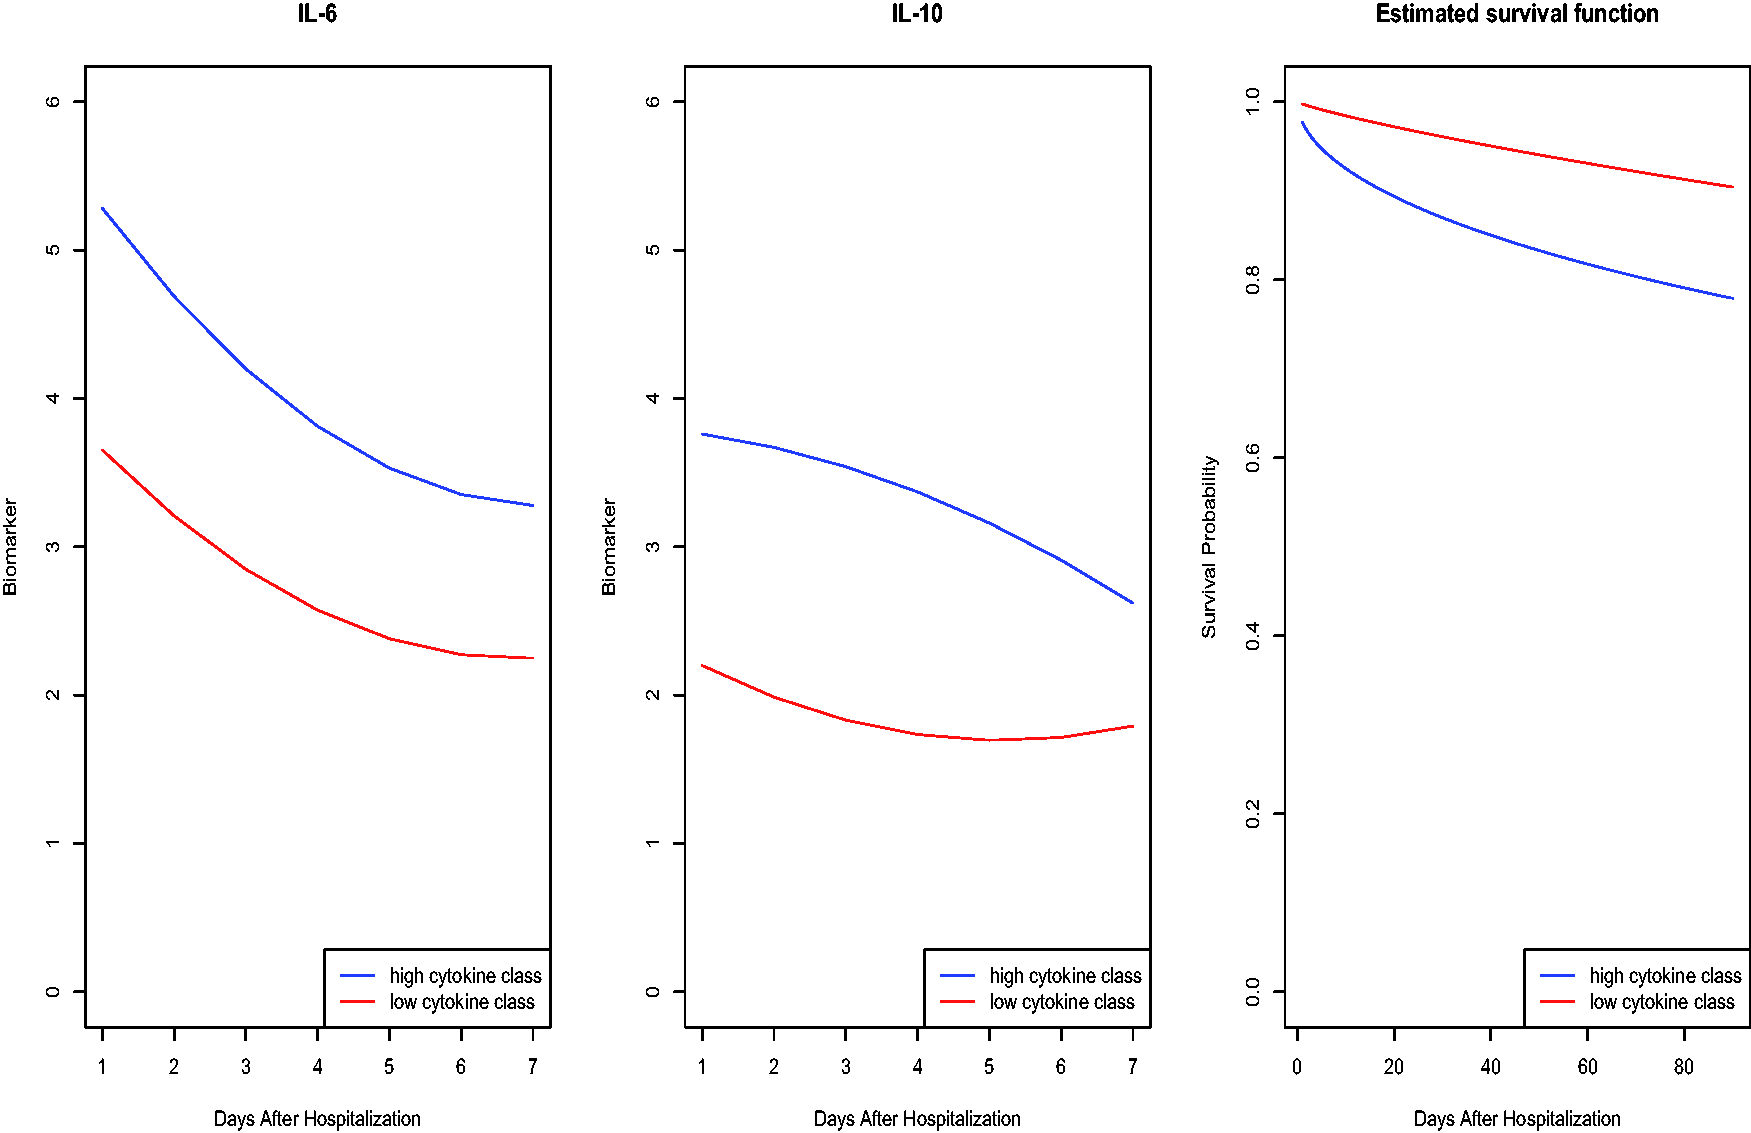
For subjects in the same latent class, being older, male, and having CCI score >0 are significantly associated with higher cytokine trajectories and increased risk of 90-day mortality. The results from latent class membership model indicate that gender is significantly associated with latent class membership. There are more males in “high cytokine” and low survival rate class.
4.4 Goodness of fit
We evaluate the goodness-of-fit of our joint model with respect to posterior classification, comparison of fitted values versus observed values, and the conditional independence assumption. In posterior classification, subjects were classified to the classes which have the highest posterior probabilities. Higher posterior probabilities close to 1 indicate better discriminatory power of the model. The mean maximal posterior probabilities of our model are 0.96 and 0.99 for class 1 and 2, respectively, indicating unambiguous classification.
Next, we compare the predicted values with observed values for both biomarker measurements and survival outcome. The predicted values for rth biomarker at time t can be calculated using class-specific predictions averaged over all subjects who had observations at time t, i.e., Comparison of predicted and observed biomarker trajectories. IL: interleukin. Comparison of predicted survival curves and Kaplan–Meier curves. KM: Kaplan–Meier.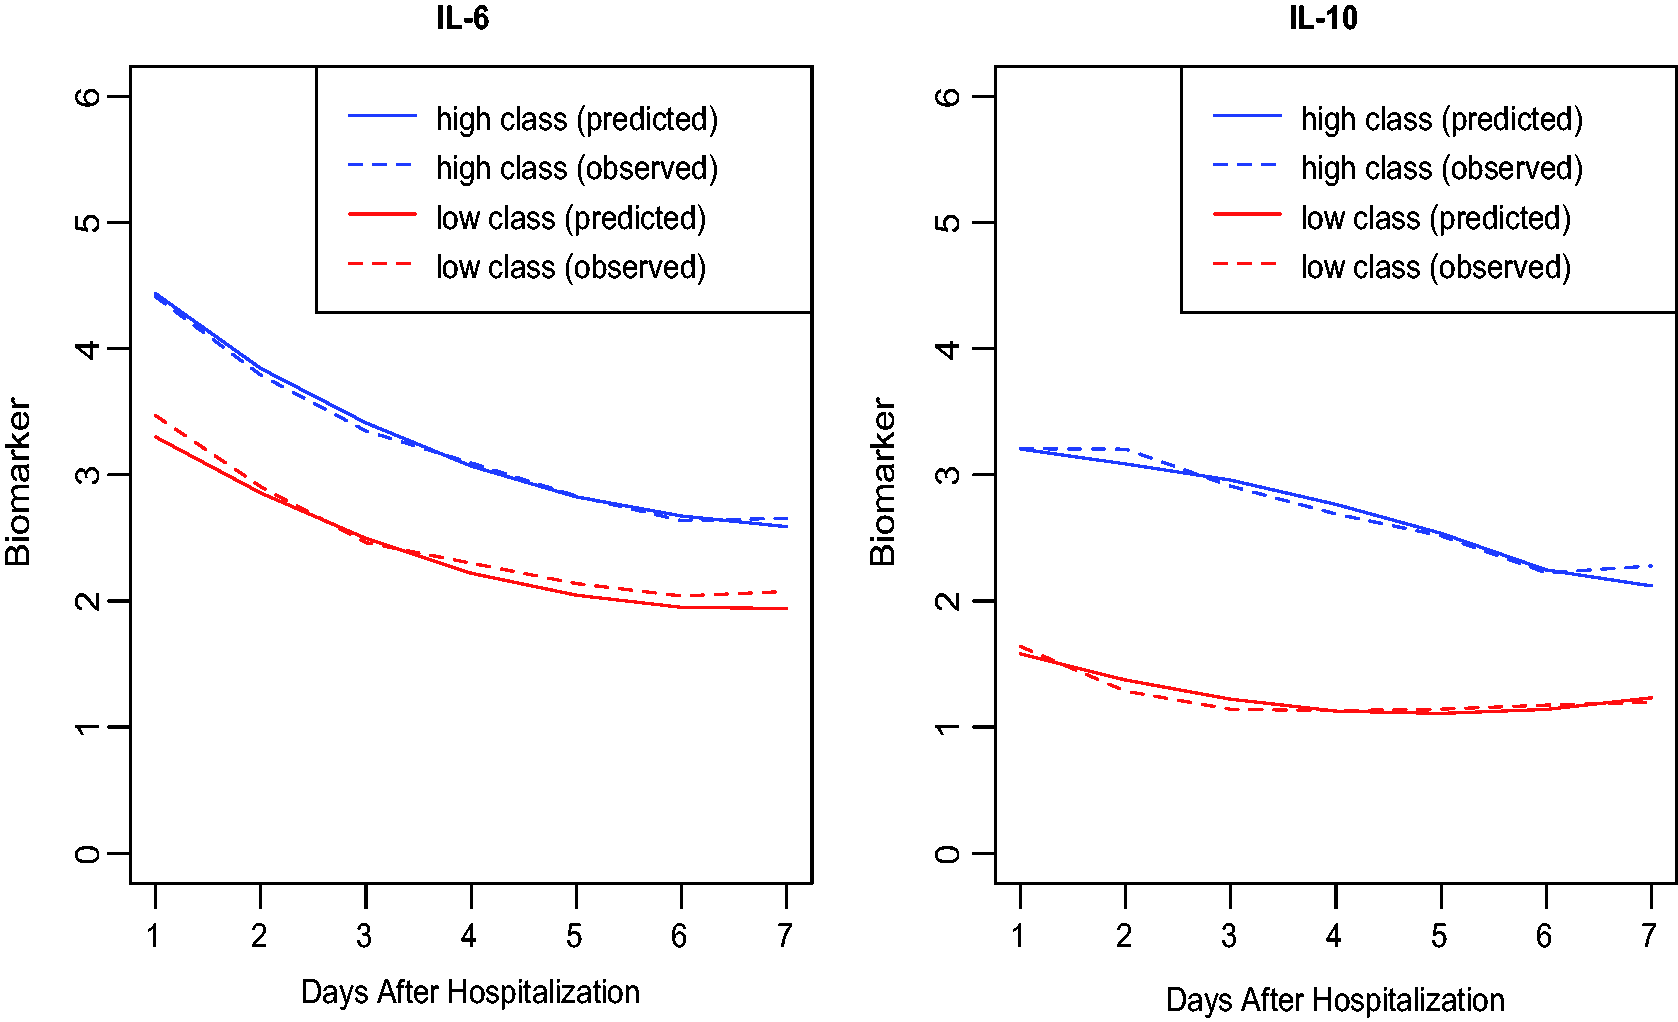
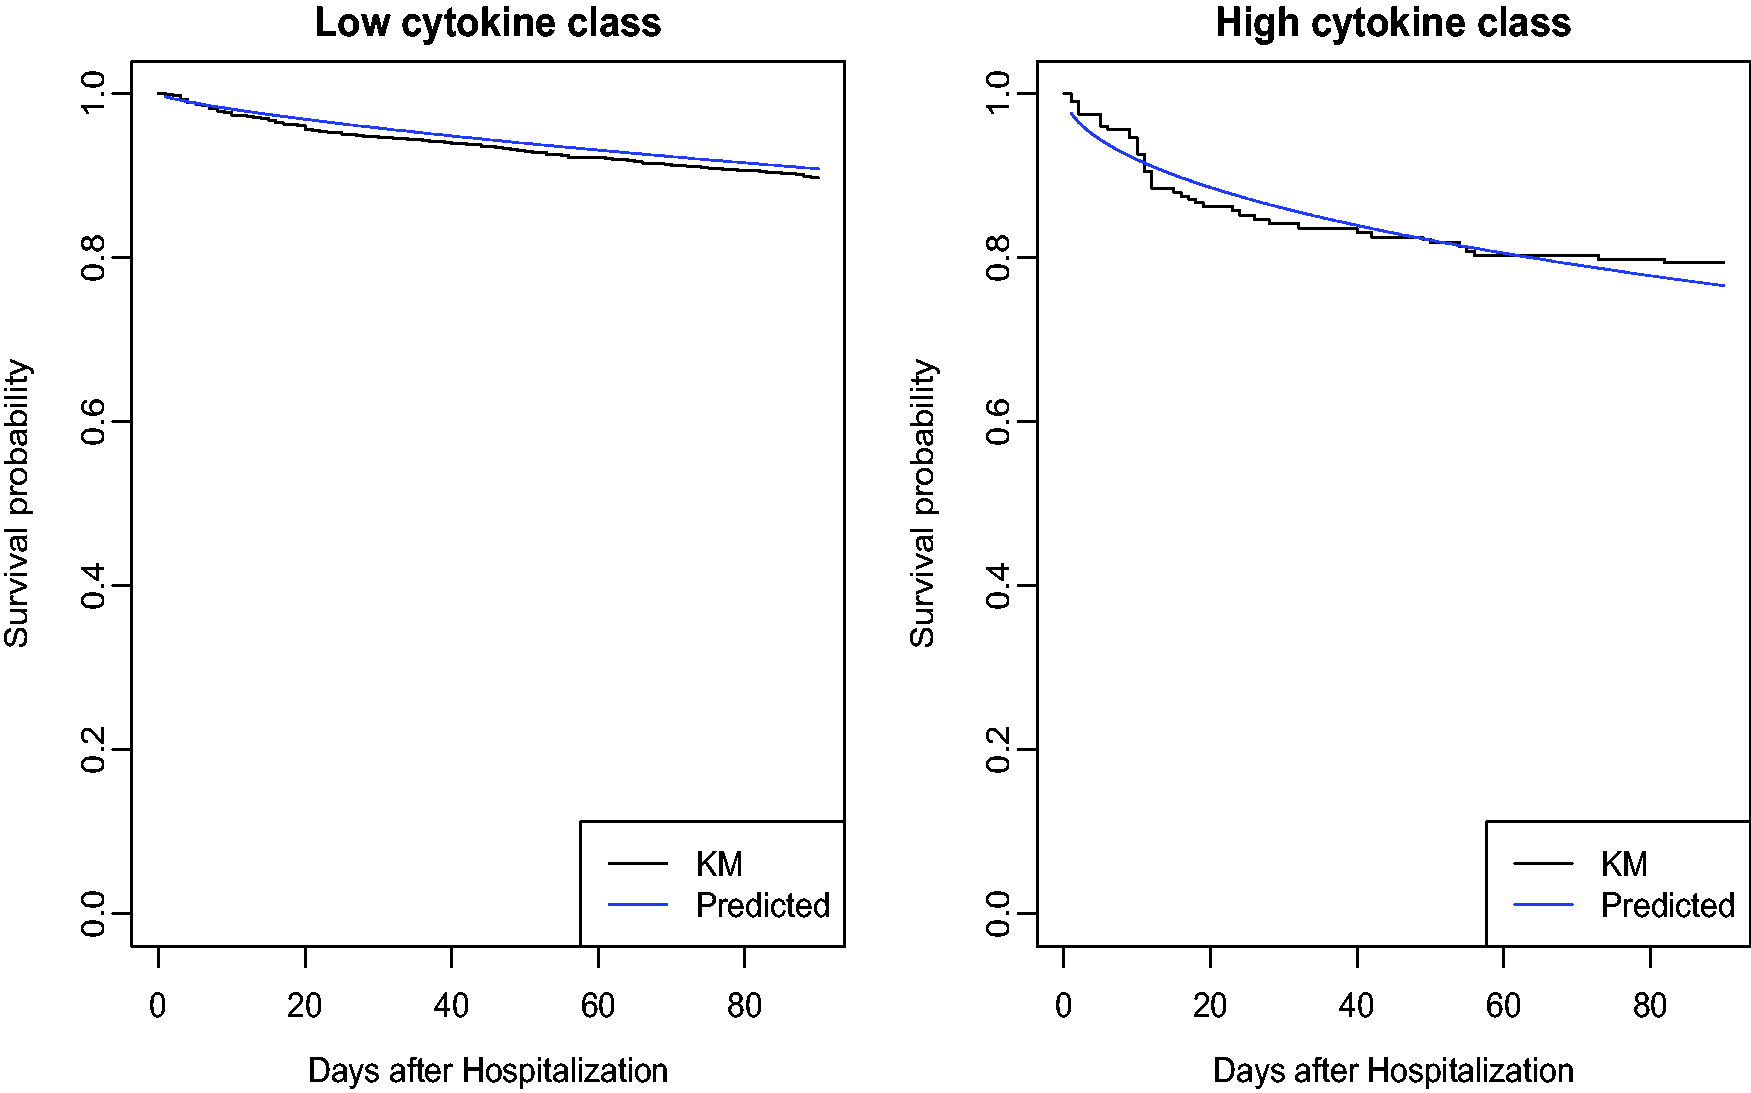
The key assumption for our joint latent class model is the conditional independence between biomarkers and the survival outcome given latent classes. We apply the score test described in Section 2.6 to evaluate the conditional independence assumption. We consider an alternative hypothesis that the survival outcome depends on two biomarkers through shared random intercepts and slopes in addition to the latent classes. Therefore, the score test statistic asymptotically follows a
4.5 Comparison with one biomarker model on posterior classification and prediction
For comparison, we fit joint latent class models with only IL-6 or IL-10 biomarker. The optimal number of classes is also two when fitting with only IL-6 or IL-10 biomarker based on BIC scores. In order to compare the discrimination ability between the two-marker model and one-marker models, we calculate the mean of maximal posterior probabilities for subjects classified in each latent class. One-marker model based on IL-6 yields mean values 0.86 for class 1, and 0.95 for class 2. The model based on IL-10 results in 0.94 and 0.98 for classes 1 and 2. Using a two-marker model, the values increase to 0.95 and 0.99 for two classes. Since higher posterior probabilities stand for more unambiguous classification, the model using both IL-6 and IL-10 biomarkers shows clear improvement over the single-marker models.
We also compare the prediction accuracy between the two-marker model and one-marker models. Mortality rates at 30 days and 90 days are estimated using equation (17) and the corresponding receiver operating characteristic (ROC) curves are provided in Figure 4. The two-marker model shows better discrimination power than single-marker models for both 30-day and 90-day mortality. The areas under the ROC curves (AUCs) for 30-day mortality are 0.66, 0.72, and 0.75, respectively, for the models based on IL-6 only, IL-10 only, and two biomarkers together. The corresponding AUCs for 90-day mortality are 0.70, 0.73, and 0.75. Incorporating the information of two biomarkers into the model improves prediction accuracy in terms of both specificity and sensitivity.
ROC curves based on the two-marker model and one-marker models for 30-day and 90-day mortality. ROC: receiver operating characteristic; IL: interleukin.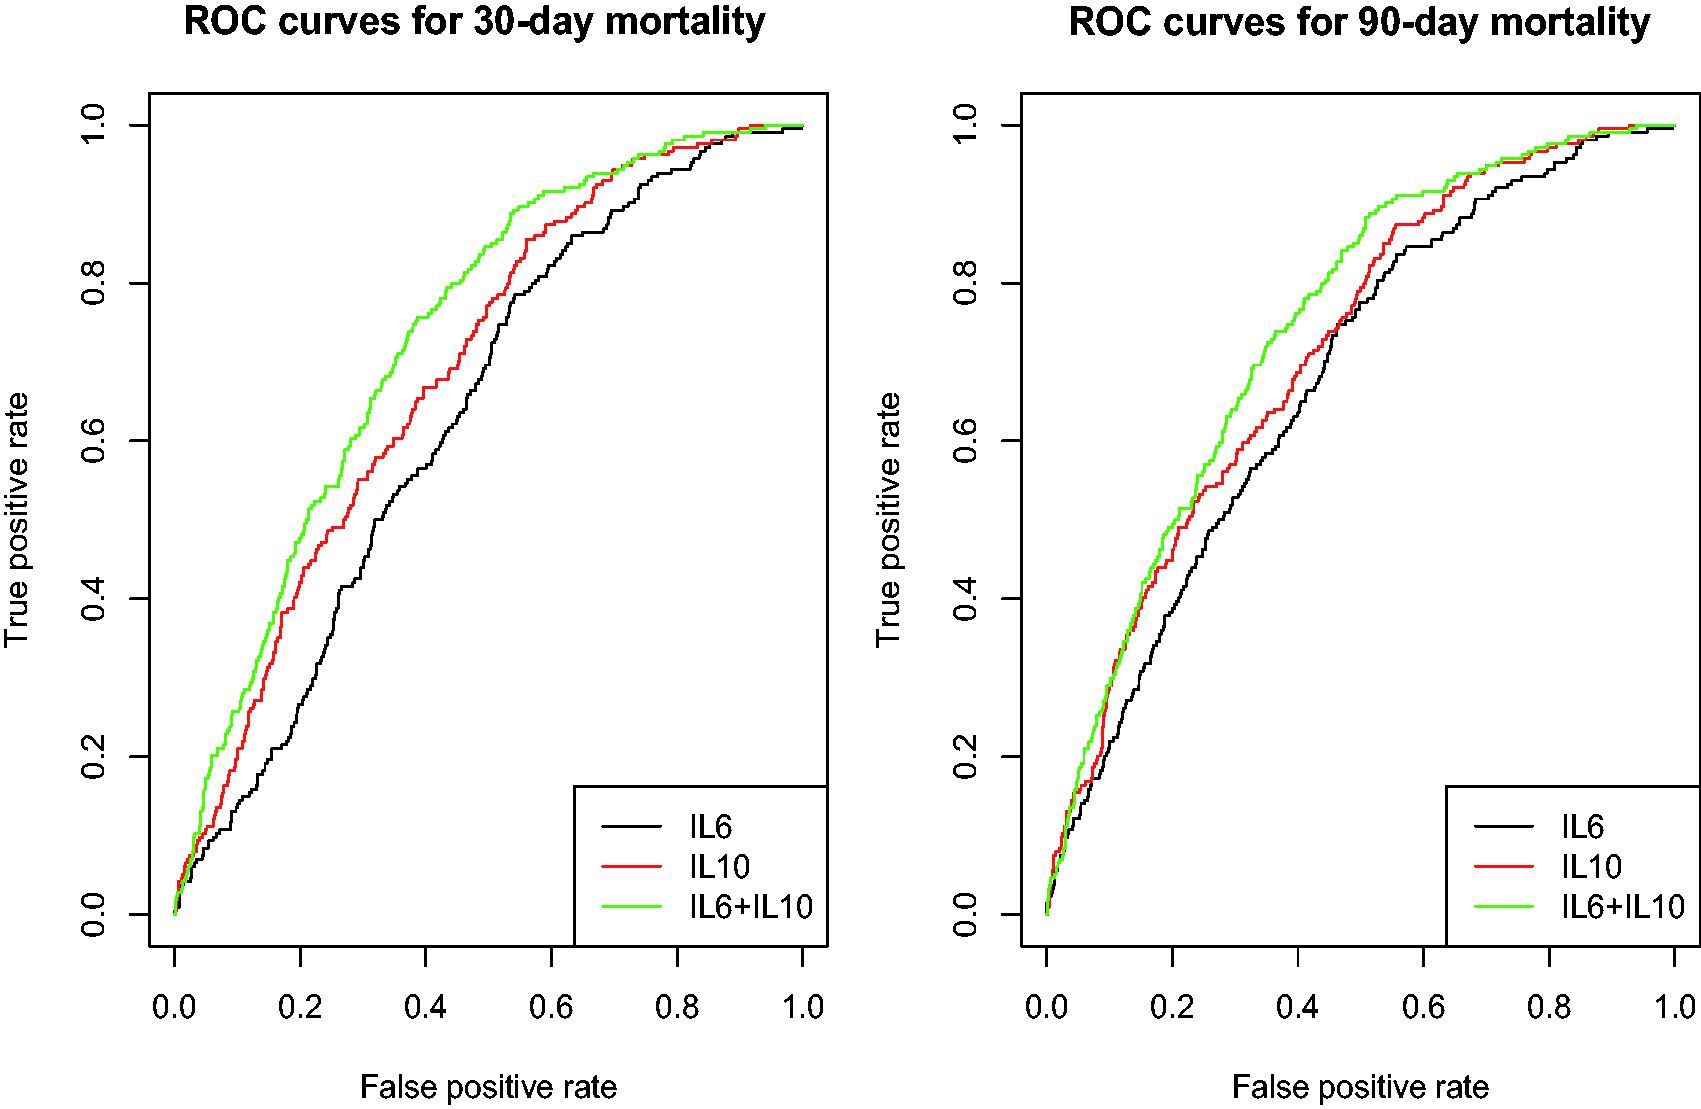
5 Discussion
Biomarker data are often collected over time to understand the development and progression of diseases. However, the presence of limits of detection in bioassays can hamper the statistical evaluation of biomarkers in biomedical and clinical studies. In this paper, we focused on addressing left-censoring issue in the biomarker measurements for joint latent class models. Our research work facilitates the utilization of this joint modeling approach to explore the heterogeneity of biomarker profiles and assist in risk stratification. We developed an estimation procedure based on likelihood methods to incorporate the censored biomarker measurements and correlations between multiple biomarkers. Simulation studies showed that the proposed MCEM algorithm for parameter estimation had satisfactory performance. As illustrated in the application to GenIMS study, cytokine biomarker responses to pneumonia were not homogeneous, indicating that different treatment strategies may be needed to effectively manipulate cytokine activation. The advantage of our model compared to the previous analysis of GenIMS cytokine data 4 is that we identified subgroups based on longitudinal biomarkers and survival outcome simultaneously instead of using a two-stage analysis. In addition, our model demonstrated better explanatory ability by considering subgroups associated with different risks. It is worth noting that the latent class modeling is a data-driven approach. The identified subgroups should be interpreted in an exploratory fashion and their utility for prediction and risk stratification should be validated in new data. There are several limitations with our proposed method. First, the MCEM algorithm has high computational cost. The required number of posterior samples increases exponentially as the number of biomarkers increases. In order to reduce the computational burden, Bernhardt et al. 10 proposed a fast, approximate EM algorithm to reduce the dimension in the E-step of the algorithm. Also, Chen et al. 21 developed a fully Bayesian method for joint modeling of longitudinal and survival data with censored covariates, where censored values were treated as extra parameters in the Markov chain Monte Carlo algorithm. These methods were both developed under the framework of shared random-effects models. Adoption of these methods to joint latent class models in the presence of censored biomarkers requires further consideration. Second, we assumed conditional independence between biomarkers and clinical outcomes given latent classes. In some scenarios, this assumption may not be adequate to capture the correlation between the two processes. A more general setting to let the biomarkers and clinical outcomes depend on both latent classes and shared random effects may be considered. 22 Finally, the parametric distribution assumption for the survival outcome can be restrictive. For semiparametric survival models such as Cox models, a Breslow-type estimator or piecewise constant estimator can be considered for baseline hazard functions. Recently, joint latent class models have been increasingly used as a prognostic tool for dynamic prediction of a clinical outcome based on the biomarker profiles. Several prediction accuracy measures have been developed for joint latent class models. 23 Extension of these methods to censored biomarkers warrants further study.
Supplemental Material
Supplemental material for A latent class approach for joint modeling of a time-to-event outcome and multiple longitudinal biomarkers subject to limits of detection
Supplemental Material for A latent class approach for joint modeling of a time-to-event outcome and multiple longitudinal biomarkers subject to limits of detection by Menghan Li, Ching-Wen Lee and Lan Kong in Statistical Methods in Medical Research
Footnotes
Acknowledgements
We thank Dr. Derek Angus and the Clinical Research, Investigation, and Systems Modeling of Acute Illness (CRISMA) Center at the Department of Critical Care Medicine, University of Pittsburgh, for access to the GenIMS data. GenIMS was funded by NIGMS R01 GM61992 with additional support from GlaxoSmithKline for enrolment and clinical data collection, and Diagnostic Products Corporation for the cytokine assays. The authors thank all the investigators who contributed to the generation of the data, a full list of whom was published in Critical Care Medicine 2007; 35: 1061–1067.
Declaration of conflicting interests
The author(s) declared no potential conflicts of interest with respect to the research, authorship, and/or publication of this article.
Funding
The author(s) received no financial support for the research, authorship, and/or publication of this article.
Supplemental material
Supplemental material for this article is available online.
References
Supplementary Material
Please find the following supplemental material available below.
For Open Access articles published under a Creative Commons License, all supplemental material carries the same license as the article it is associated with.
For non-Open Access articles published, all supplemental material carries a non-exclusive license, and permission requests for re-use of supplemental material or any part of supplemental material shall be sent directly to the copyright owner as specified in the copyright notice associated with the article.
