
Abstract
Complex survey designs are widely used in medical cohort studies. Developing risk score models that adequately account for the sampling design is essential to minimize selection bias and obtain representative population estimates. This work addresses three complementary objectives. First, we propose a general predictive framework for regression and classification tasks that utilizes neural networks to incorporate survey weights into the model estimation process. Second, we introduce a procedure for quantifying prediction uncertainty based on conformal inference, adapted to the characteristics of complex survey data. Third, we demonstrate the application of the proposed methodology in a case study assessing the risk of diabetes mellitus in the US population, using the NHANES 2011–2014 cohort. The empirical results show that models of varying complexity, each using different sets of predictors, achieve different trade-offs between predictive performance and economic cost while maintaining generalizability at the population level. Although the case study focuses on diabetes, the proposed framework is directly applicable to the development of clinical prediction models for other diseases and complex survey datasets. All software and data used in this study are publicly available on GitHub.
Introduction
Scientific experimental design has been identified as a key factor in the biomedical reproducibility crisis, as highlighted by several studies.1–3 Although some practitioners emphasize the importance of study design, its influence is often underestimated. The significance of robust experimental design dates back to Ronald Fisher’s pioneering work in statistics 4 and remains a central topic in modern statistical science, particularly in the context of dynamic and adaptive designs. In medical research, a sound experimental design is essential for developing and validating new drugs and clinical treatments, especially within randomized clinical trials. 5
In addition, the survey sampling methods used in nationally representative studies, such as the National Health and Nutrition Examination Survey (NHANES), greatly influence the generalizability of clinical predictive models.6–8 NHANES, renowned for its reliability and comprehensive data collection, employs a multistage complex sampling design to select a representative sample of the US civilian non-institutionalized population. This approach incorporates hierarchical selection stages—from states to cities—and applies post-stratification techniques to mitigate non-response bias and improve population representativeness, thereby enhancing the efficiency of statistical estimators.
In contrast, other clinical datasets, such as the UK Biobank, often suffer from selection bias due to the voluntary nature of participant recruitment.9,10 However, the sophisticated experimental protocol of the NHANES supports more reliable conclusions, serves as a benchmark for monitoring health behaviors in the US population, and is routinely used in policy-making and clinical surveillance. The success of statistical analyses in such studies depends heavily on adopting methods that adequately account for the underlying sampling design.
Developing risk scores is critical for healthcare planning, particularly in public health, as these scores estimate the likelihood of disease onset and help identify individuals at elevated risk.11–14 Based on disease score assessments, healthcare strategies can be implemented, such as customized follow-up, routine checks, and non-invasive interventions, to reduce healthcare costs and improve population health outcomes.15–17
However, constructing disease-specific risk scores from observational data is inherently vulnerable to selection bias, limiting the generalizability of the findings. 9 This issue is especially prominent in diabetes research, where the predictive performance of risk scores can vary substantially across studies due to differences in genetic background, demographic factors, and study design. Practical limitations, including high costs and technical constraints, often hinder the implementation of efficient random sampling designs.
Despite their widespread use, the integration of such survey designs with modern machine learning techniques and survey-weighted inference remains limited. Furthermore, the inferential properties of these models continue to pose significant challenges. To bridge this gap and potentially improve clinical conclusions in biomedical research (see Table 1 for the NHANES case), we propose a neural network-based prediction framework that incorporates uncertainty quantification via conformal prediction techniques. We apply this methodology to develop reliable risk scores for detecting diabetes in the US population.
Impacts of not using survey weights in NHANES data analysis.
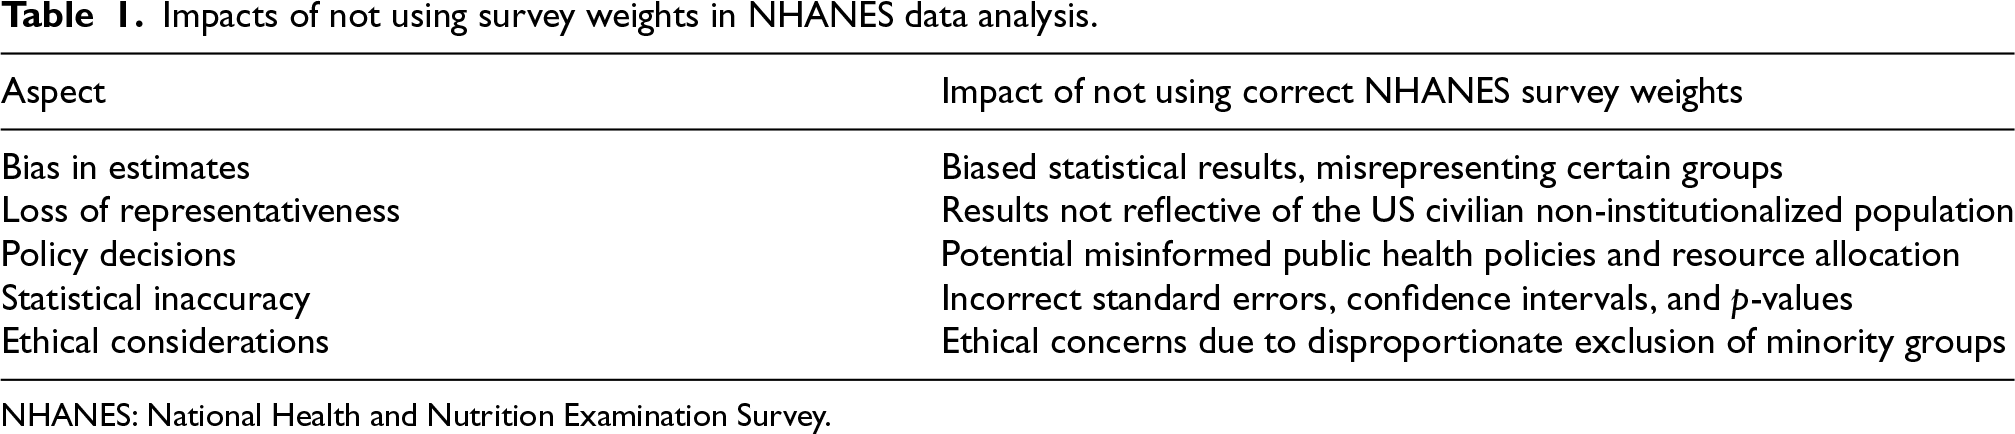
Impacts of not using survey weights in NHANES data analysis.
NHANES: National Health and Nutrition Examination Survey.
Diabetes mellitus represents a significant public health challenge, currently affecting approximately
The prevalence of sedentary lifestyles, especially in developed countries, contributes to a worrying projected increase in diabetes cases. Currently affecting approximately
The economic impact of diabetes is substantial. For example, in 2022, the total cost in the United States was estimated at $412.9 billion, including $306.6 billion in direct medical expenses and $106.3 billion in indirect costs. 16 The burden of diabetes extends beyond financial costs, profoundly affecting life expectancy and quality of life, largely due to delayed diagnoses and inadequate glycemic control, which frequently result in severe complications such as cardiovascular diseases. Addressing these challenges requires advancing precision medicine by implementing data-intensive frameworks that enable the systematic development of diagnostic tools and therapeutic strategies, informed by continuous, high-resolution data from wearable biosensors and electronic health records.
In the case of diabetes mellitus, the diagnosis typically involves biomarkers such as glycosylated hemoglobin (HbA1c) and fasting plasma glucose (FPG). While FPG tests are cost-effective, HbA1c testing, a primary biomarker for diabetes, is more expensive and complex. Despite its widespread use, particularly in non-risk groups, HbA1c testing presents significant challenges. Medical guidelines, including those from the American Diabetes Association (ADA), recommend using both HbA1c and FPG, along with oral glucose tolerance tests, especially in cases of gestational diabetes, 20 for a comprehensive assessment.
In disease diagnosis and screening, statistical and machine learning models that leverage clinical variables show promise for identifying high-risk individuals. These predictive models can effectively stratify patients, allowing personalized clinical approaches in accordance with precision medicine. However, their predictive power can vary across patient demographics and in real-world applications with limited sample sizes, posing challenges for accurately determining a patient’s glucose status.
In this paper, we address these challenges using data from the NHANES from 2011 to 2014. Given the analytical challenges of properly analyzing complex survey designs and the relative scarcity of non-parametric models in this domain, we propose a neural network predictive framework. The related estimators are designed to ensure universal approximation capabilities in predictive tasks. Furthermore, we introduce an uncertainty quantification framework based on conformal inference for survey data, thereby enhancing our ability to quantify the predictive limits of these models. This holistic approach aims to improve the precision and applicability of predictive models to detect diabetes mellitus.
Machine learning models for survey data
The application of non-parametric regression models in survey data analysis remains a relatively unexplored area. 21 Traditional approaches, such as the Nadaraya–Watson estimator 22 and local polynomial regression, have been proposed. However, their statistical performance tends to deteriorate rapidly as the number of predictors increases, even when considering as few as three covariates. 23
Recently, machine learning algorithms—such as neural networks and random forests—have been recommended in the literature as non-parametric alternatives to classical regression models. However, their generalization to inferential and predictive tasks in complex survey designs has not yet been adequately addressed. To the best of our knowledge, the closest related work is the kernel ridge regression models proposed in Matabuena and Petersen 7 for functional and distributional data analysis applications. 6
The goal of this paper is to address this gap in the literature by proposing a neural network framework for classification and regression models, equipped with automated uncertainty quantification for model predictions.
Given the common prevalence of non-linear biological data, the universal approximation properties of neural networks, combined with their competitive performance in high-dimensional settings, make them excellent candidates for modeling tasks across various domains. In particular, for biomedical applications, the proposed predictive framework offers a novel opportunity to develop accurate and reliable risk scores for specific diseases.
Summary of contributions
Building on the motivation outlined in the Introduction, this study seeks to address the methodological and practical challenges of applying modern machine learning techniques to complex survey data, ensuring both statistical efficiency and population-level generalizability. The purpose of this paper is to construct disease risk scores for predictive modeling using nationally representative health datasets, with the NHANES serving as a case study to estimate disease risk. The specific objectives are as follows.
Develop a neural network modeling strategy for complex survey data. This includes the explicit incorporation of survey weights in model training and evaluation, tailored to the construction of disease risk scores for nationally representative cohorts such as the NHANES. Predictive uncertainty quantification for survey designs. We adapt conformal inference techniques to complex survey settings, acknowledging that assumptions such as exchangeability and finite-sample properties may be violated. However, algorithms can retain asymptotic consistency, provided that the underlying deep learning models exhibit this property for each estimator. Extend the framework to both regression and classification tasks. In particular, we introduce a novel neural network-based quantile regression approach that enables survey-weighted conformal prediction, addressing a gap in the literature on non-linear quantile regression for survey data.
24
Apply the framework to type-2 diabetes risk prediction. We compare models of varying complexity and economic cost of implementation and analyze trade-offs between predictive precision and resource requirements between subgroups of the population. Ensure reproducibility and accessibility. The complete Python implementation of all proposed methods is openly available at https://github.com/juancarlosvidal/survey_data_diabetes.
Outline of the paper
The structure of the paper is as follows. Section 4 introduces the proposed neural network methodology designed specifically for survey data, together with the proposed approach for quantification of uncertainty in model prediction. In Section 5, we present a simulation study in a binary classification setting. Section 6 applies the models to a case study on diabetes using the NHANES data. Section 7 discusses the methodological contributions, broader applications in biomedical research, and the practical implications of our findings in the case study.
Methodology
Model estimation
Suppose that we observe a random sample
We assume that each predictor
The deep neural network model
25
is a parametric function 
We denote the intermediate activations (also called hidden representations) as
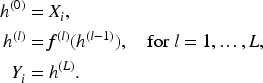
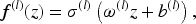
Given the final output of the hidden layer 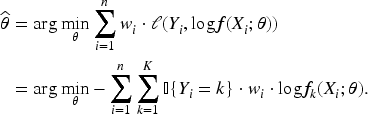
Computational details
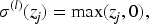
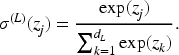
For the
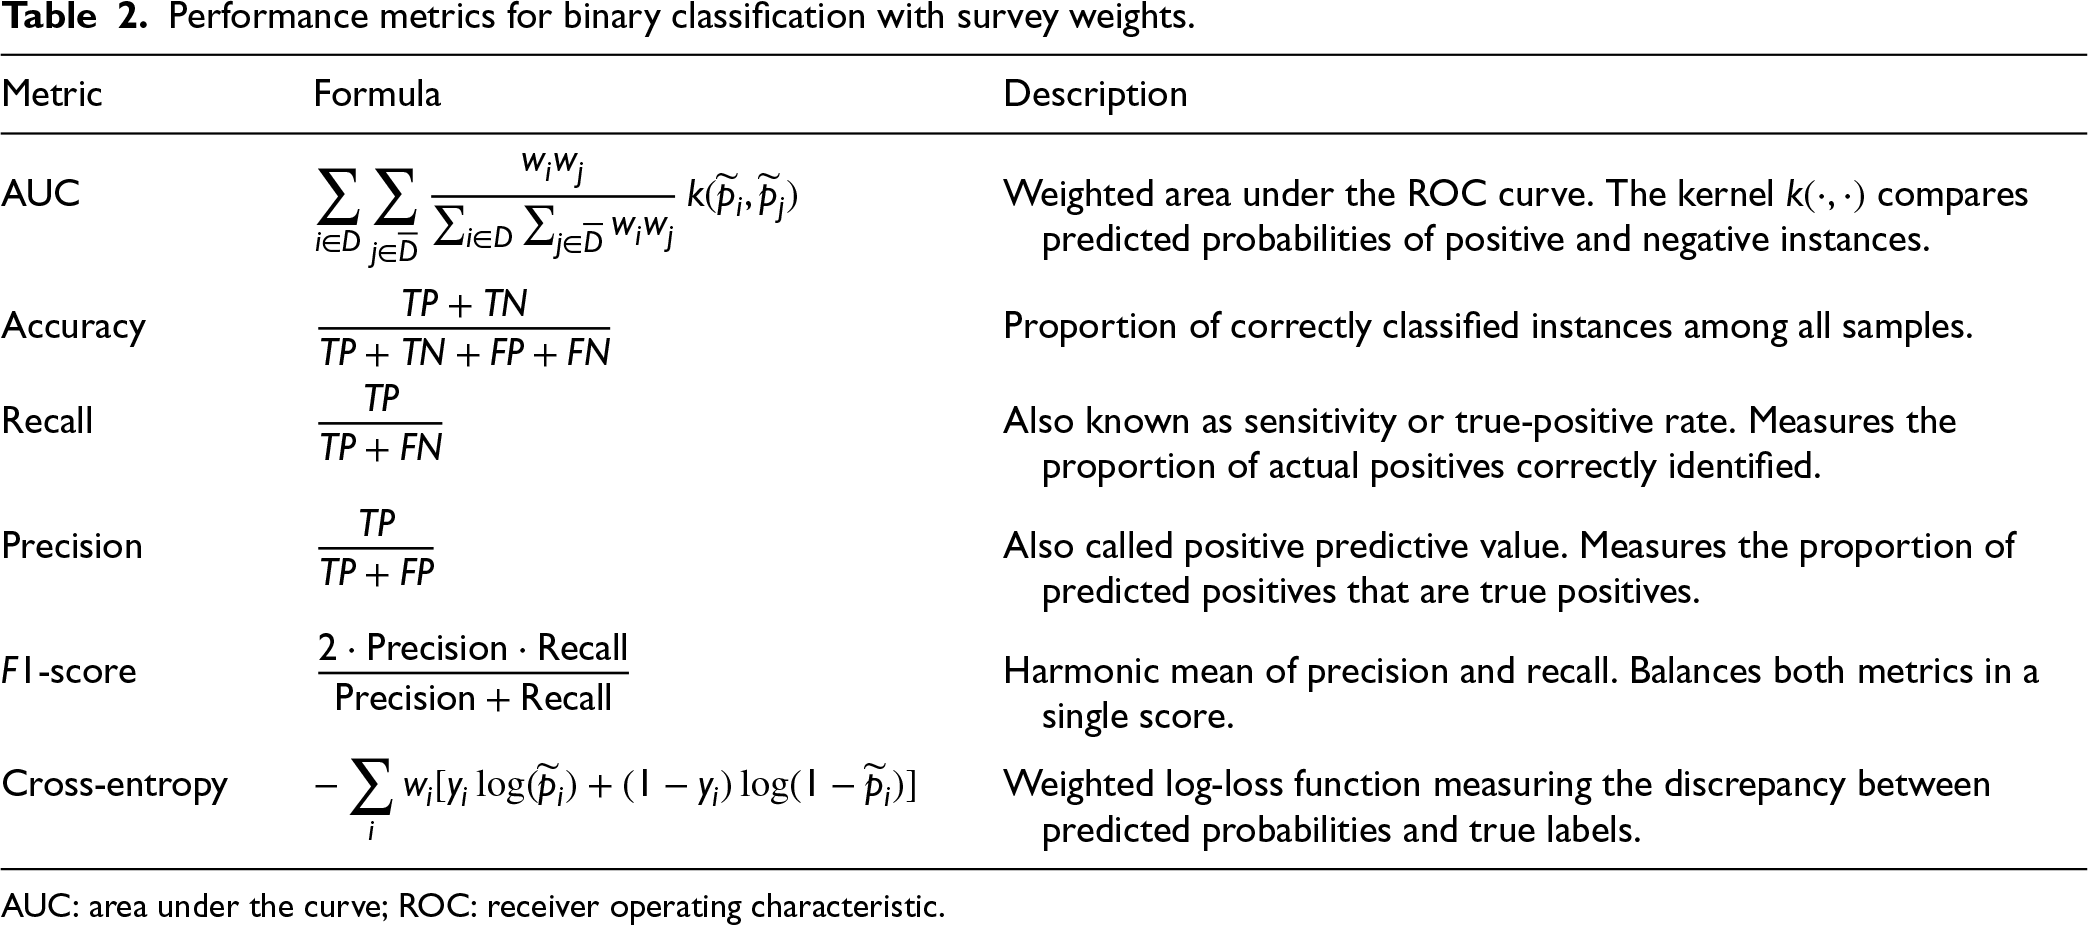
Performance metrics for binary classification with survey weights.
Performance metrics for binary classification with survey weights.
AUC: area under the curve; ROC: receiver operating characteristic.
Model parameters are optimized using stochastic gradient descent in conjunction with the Adam optimizer, 26 which provides adaptive learning rates for efficient convergence. The optimization process is implemented using PyTorch’s automatic differentiation capabilities.
As a parametric benchmark, we employed survey-weighted logistic regression models. All baseline metrics were computed using survey weights that matched those used in the neural-network evaluation.
Background on conformal prediction and uncertainty quantification
In predictive medical models, considerable uncertainty is common. Patient responses often vary over time and can show individualized patterns.15,27 Although uncertainty is often perceived negatively, it can provide valuable information for clinical decision-making. 15
First, it helps clarify the limitations of predictive models. Second, high uncertainty in patient outcomes can stimulate the development of novel pharmacological treatments or interventions. Third, uncertainty supports healthcare planning: patients with unpredictable clinical courses may require more frequent follow-up. Ultimately, estimating individual-level uncertainty is crucial to identifying atypical cases and to effectively allocating healthcare resources. Each of these factors underscores the value of uncertainty quantification in clinical practice. We now introduce conformal prediction models. To keep the explanation simple and clear, we begin with the case of continuous scalar outcomes.
Let
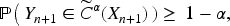
In modern prediction inference theory, one often seeks a finite-sample guarantee of the form
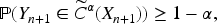
However, in complex survey data, this finite-sample validity guarantee typically does not hold even if survey weights are directly incorporated into the conformal construction. In such cases, the marginal coverage may deviate substantially from the nominal level. However, the predictive algorithm we propose for split data retains statistical consistency: as
Let

Assume a regression algorithm
The algorithm 

Define the conformity scores as

Then, the conformal prediction interval for 
The full conformal method provides distribution-free coverage guarantees:
If the data points 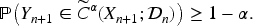
Conformal inference (both split and full) is often described in terms of conformity scores 
The NHANES cohorts use a sophisticated multistage probability sampling design to represent the US civilian non-institutionalized population. Sampling begins with Primary Sampling Units (PSUs), typically counties or groups of counties, selected using a probability proportional to size. PSUs are subdivided, households are sampled, and individuals are chosen using stratification criteria such as age, sex, and race/ethnicity.
However, demographic and geographic heterogeneity between states, as well as differences in ethnic makeup, socioeconomic status, and health outcomes, may violate the exchangeability assumption. This poses challenges for applying conformal prediction algorithms that rely on exchangeability or i.i.d. assumptions for finite-sample validity.
Conformal prediction under covariate shift for survey data
We depart from exchangeability and assume a covariate-shift framework in which the conditional outcome law is stable between the observed (sample) and target (population) domains, while the covariate distribution may change. Formally,
To capture this discrepancy, we define the weighting function
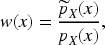
This function
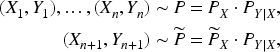
In the context of complex surveys, such as the NHANES, this weighting function is known by design. The person responsible for the experimental design derived the survey weights
To construct weighted conformal sets, let 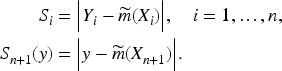
Let 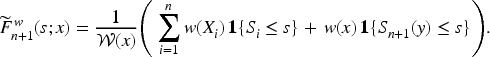


Tibshirani et al. 30
Consider the data-generating scheme with a common conditional law 
Then,
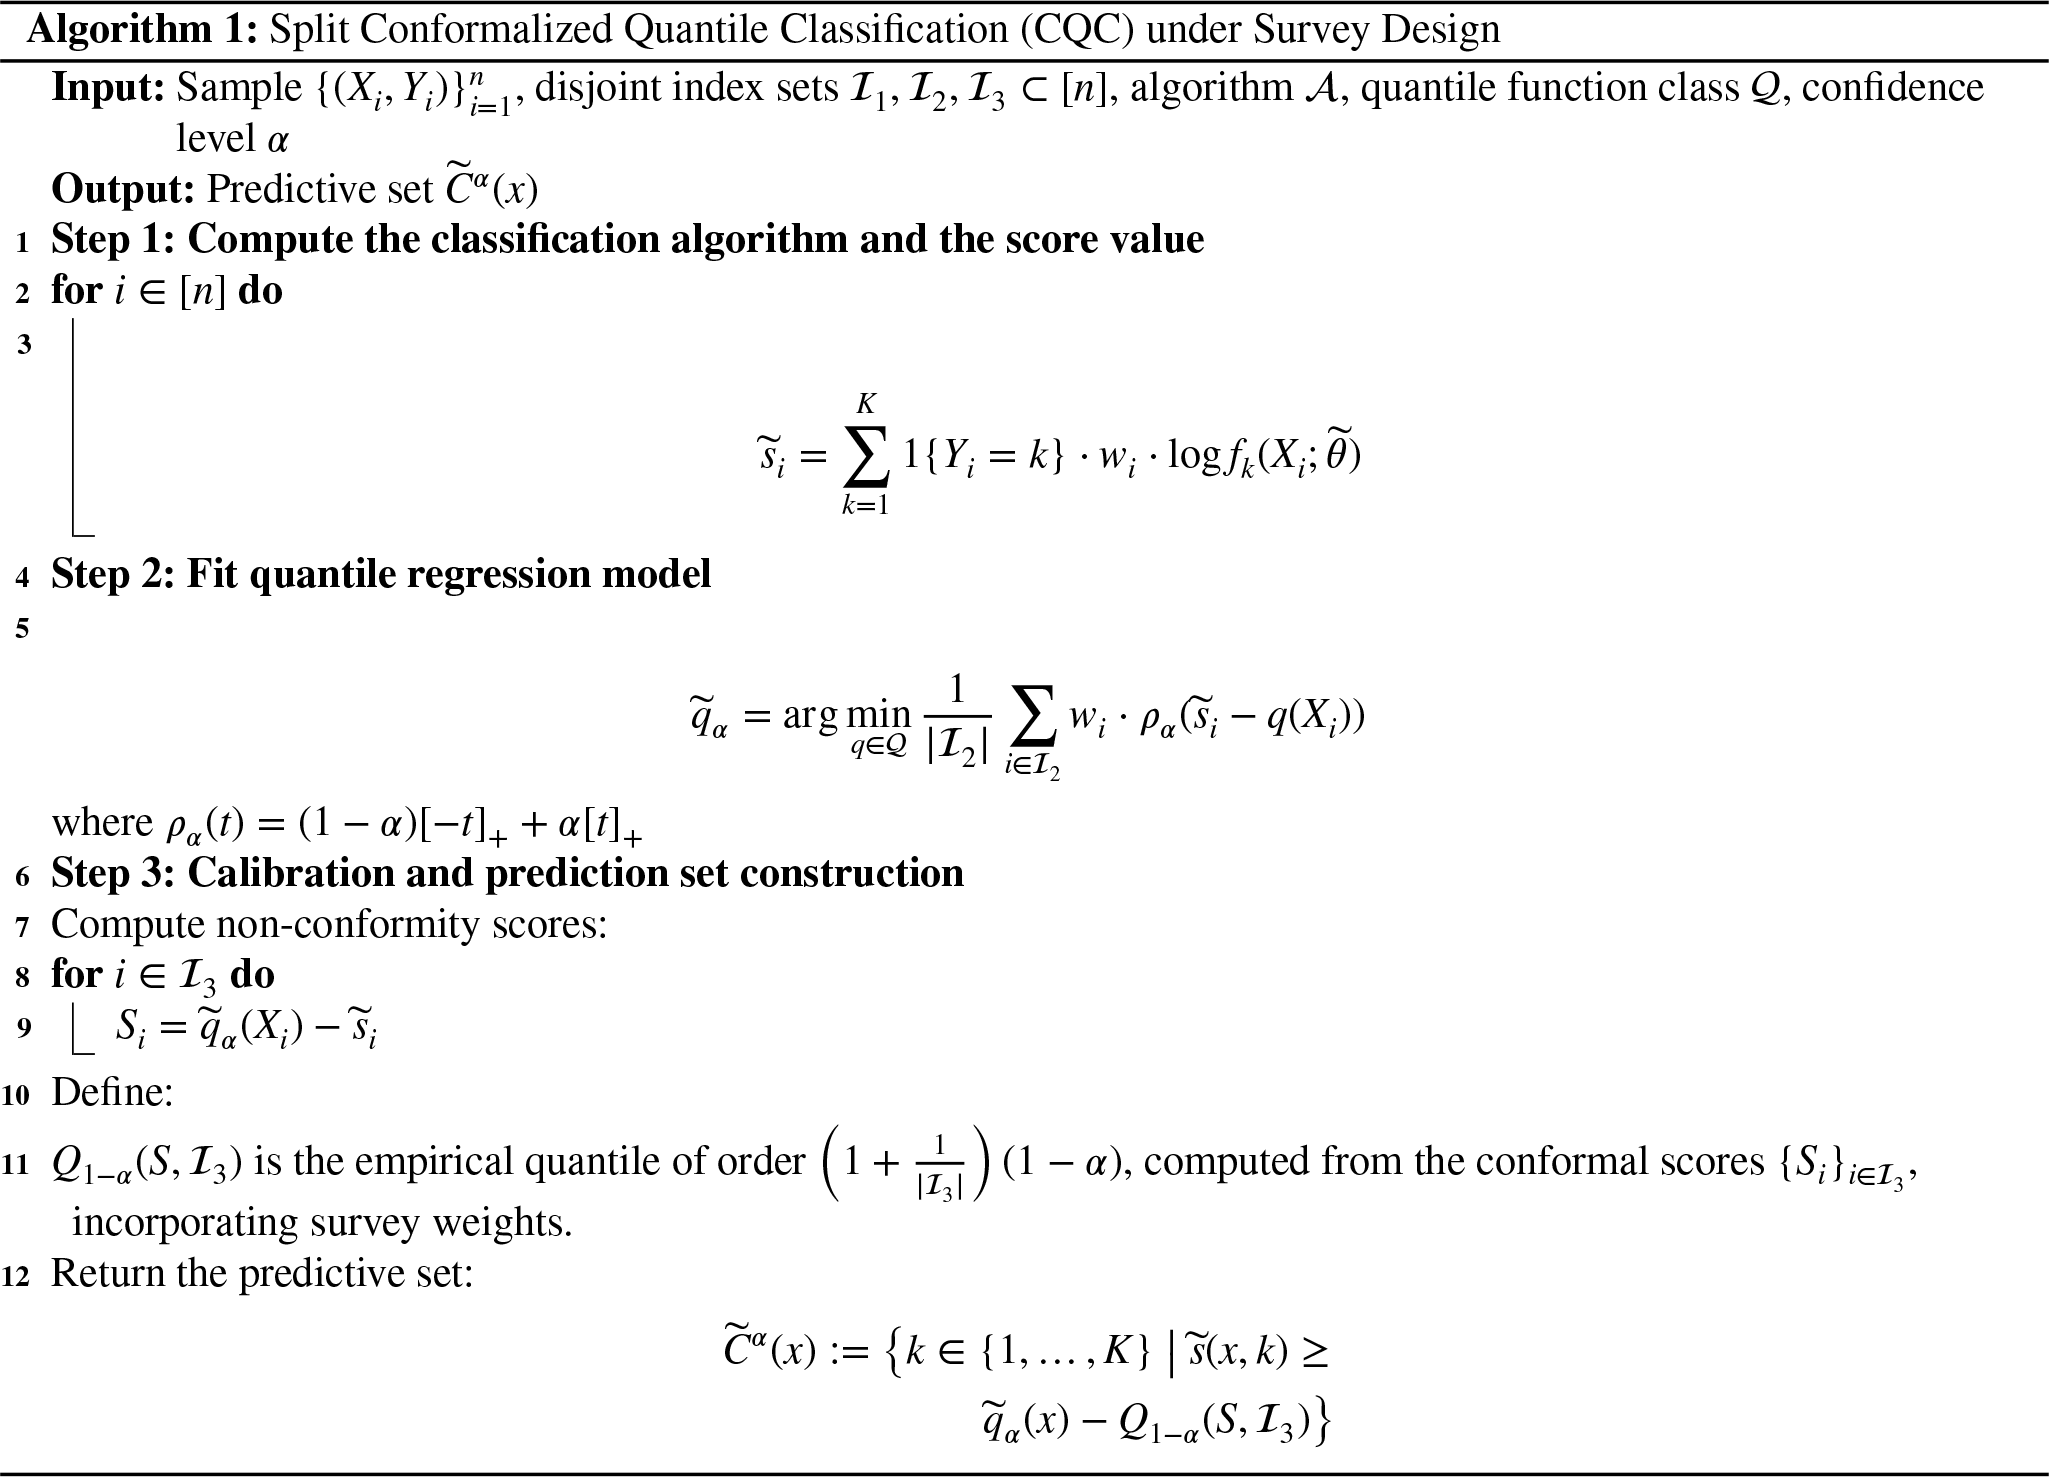
For the classification prediction case, in the setting of the case study, we adapt the quantile classification algorithm of Cauchois et al. 31 to handle survey weights and covariate drift (see Algorithm 1 for further details).
Conformal prediction beyond exchangeability
More generally, Barber et al.
28
introduced conformal methods for non-exchangeable data. A key concept is the coverage gap, which quantifies the deviation from the nominal level:

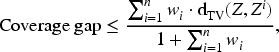
In practice, this gap quantifies the extent to which complex survey sampling deviates from the ideal assumption of exchangeability. To formalize inference, it is common to adopt a super-population framework, where the finite population (such as the US residents captured by the NHANES at a given time) is viewed as one realization from a much larger, conceptual population distribution. Intuitively, we imagine that the observed sample comes from a very large population generated by the same underlying process. Within this framework, if the estimators are statistically consistent, the empirical coverage gap decreases with increasing sample size, and under asymptotic consistency, it converges to zero as the finite-sample population increases to zero,
Simulation study
The objective of this section is to verify and validate the implementation of the neural network and to compare its performance against a baseline linear logistic regression method. This comparison aims to highlight the flexibility of NNs when the logistic model is misspecified, particularly in settings where the true interaction structure between variables is unknown and the relationships are not merely additive and linear. The survey sampling scenarios considered here should not be interpreted as an attempt to exactly reproduce the NHANES design. Rather, they serve as a structured, transparent framework for assessing the robustness of the neural network approach under complex survey sampling conditions.
To this end, we conducted a simulation study employing a two-stage cluster sampling design, based on two distinct generative models for binary regression, where
The conditional distribution of the response variable is given by
The experimental design is based on a hierarchical cluster structure. In the first stage, the groups correspond to states, each of which is independently selected with probability 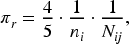
For each generative model (a and b), we replicated the experimental design 500 times (
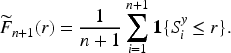
The results, reported as mean standard deviation
Summary of simulation results across scenarios (a) and (b) with varied sample sizes
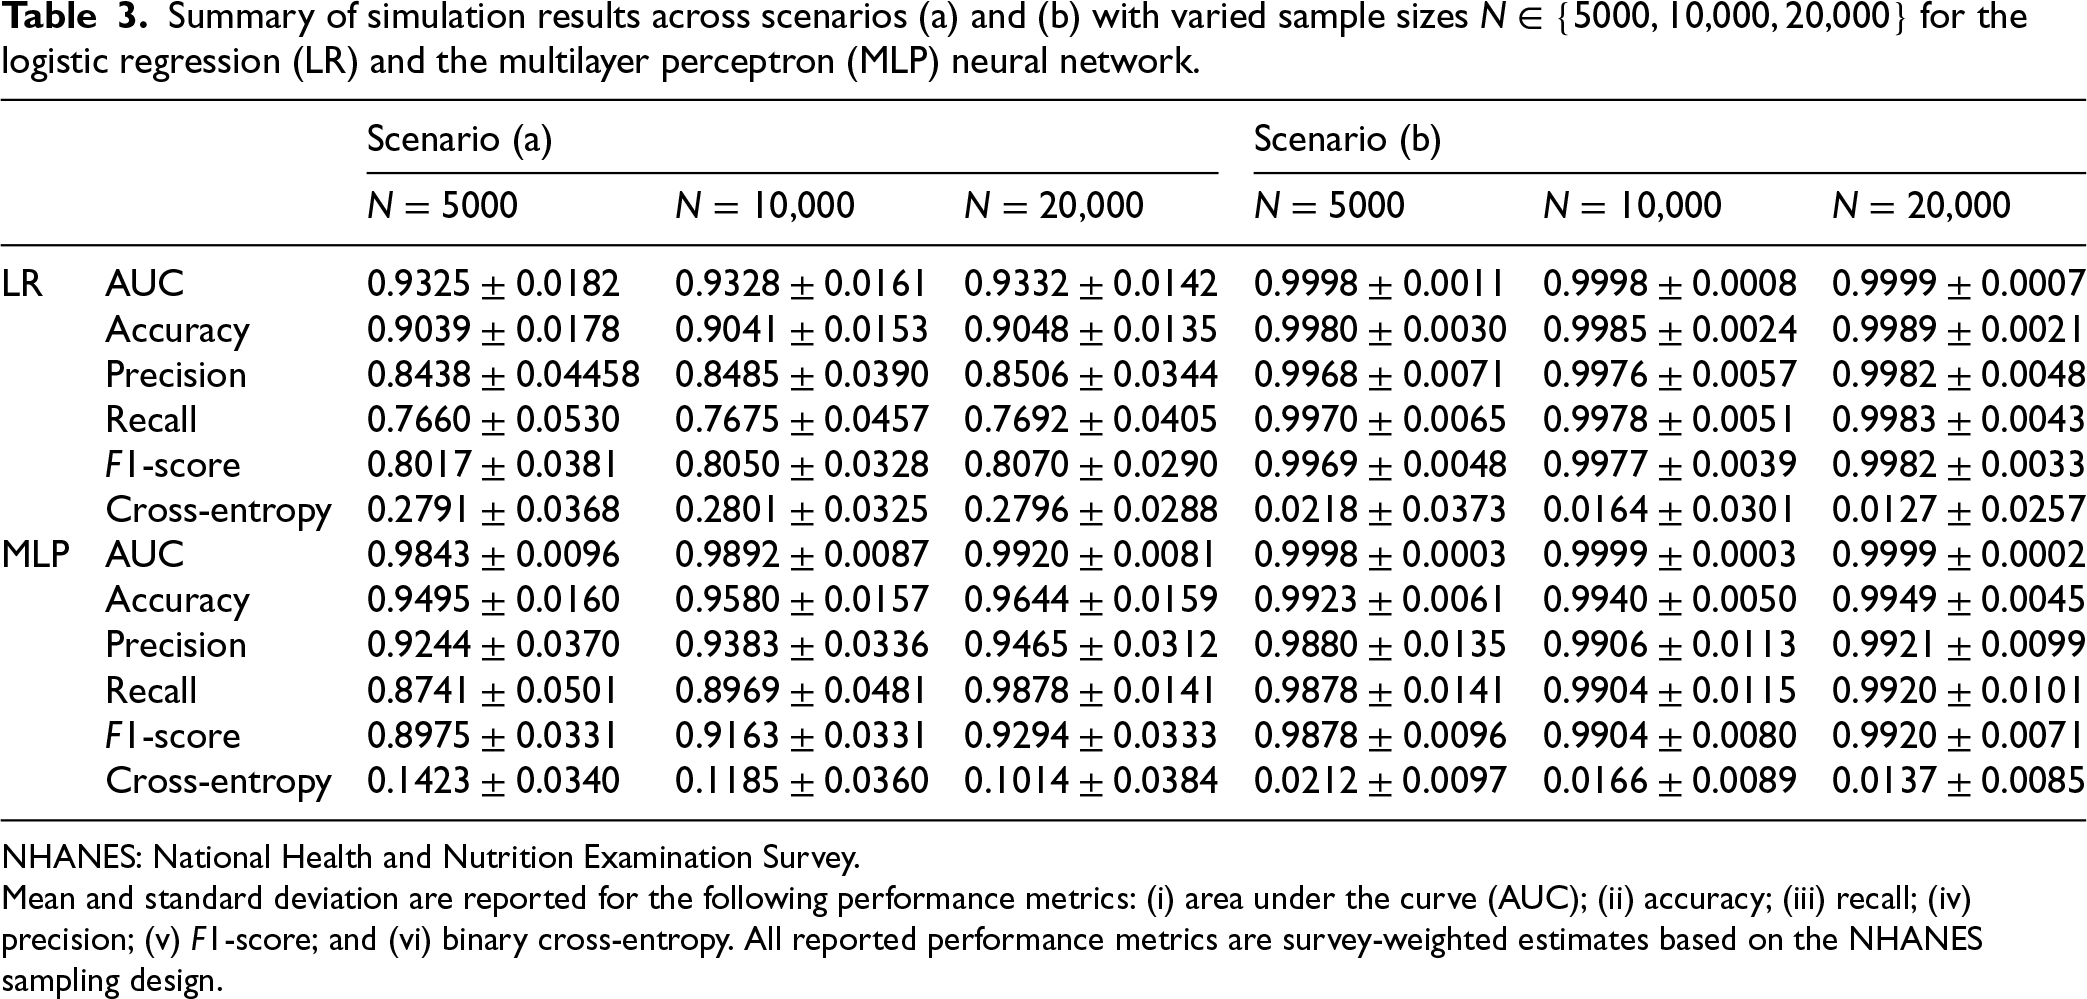
NHANES: National Health and Nutrition Examination Survey.
Mean and standard deviation are reported for the following performance metrics: (i) area under the curve (AUC); (ii) accuracy; (iii) recall; (iv) precision; (v)
Consistency is observed across performance metrics for fixed sample sizes. Generally, increasing the sample size
In the context of conformal prediction for survey data, we focus again on generative models from simulation scenarios (a) and (b). However, the emphasis here is on evaluating model performance using empirical marginal coverage at different confidence levels,
In each simulation run 
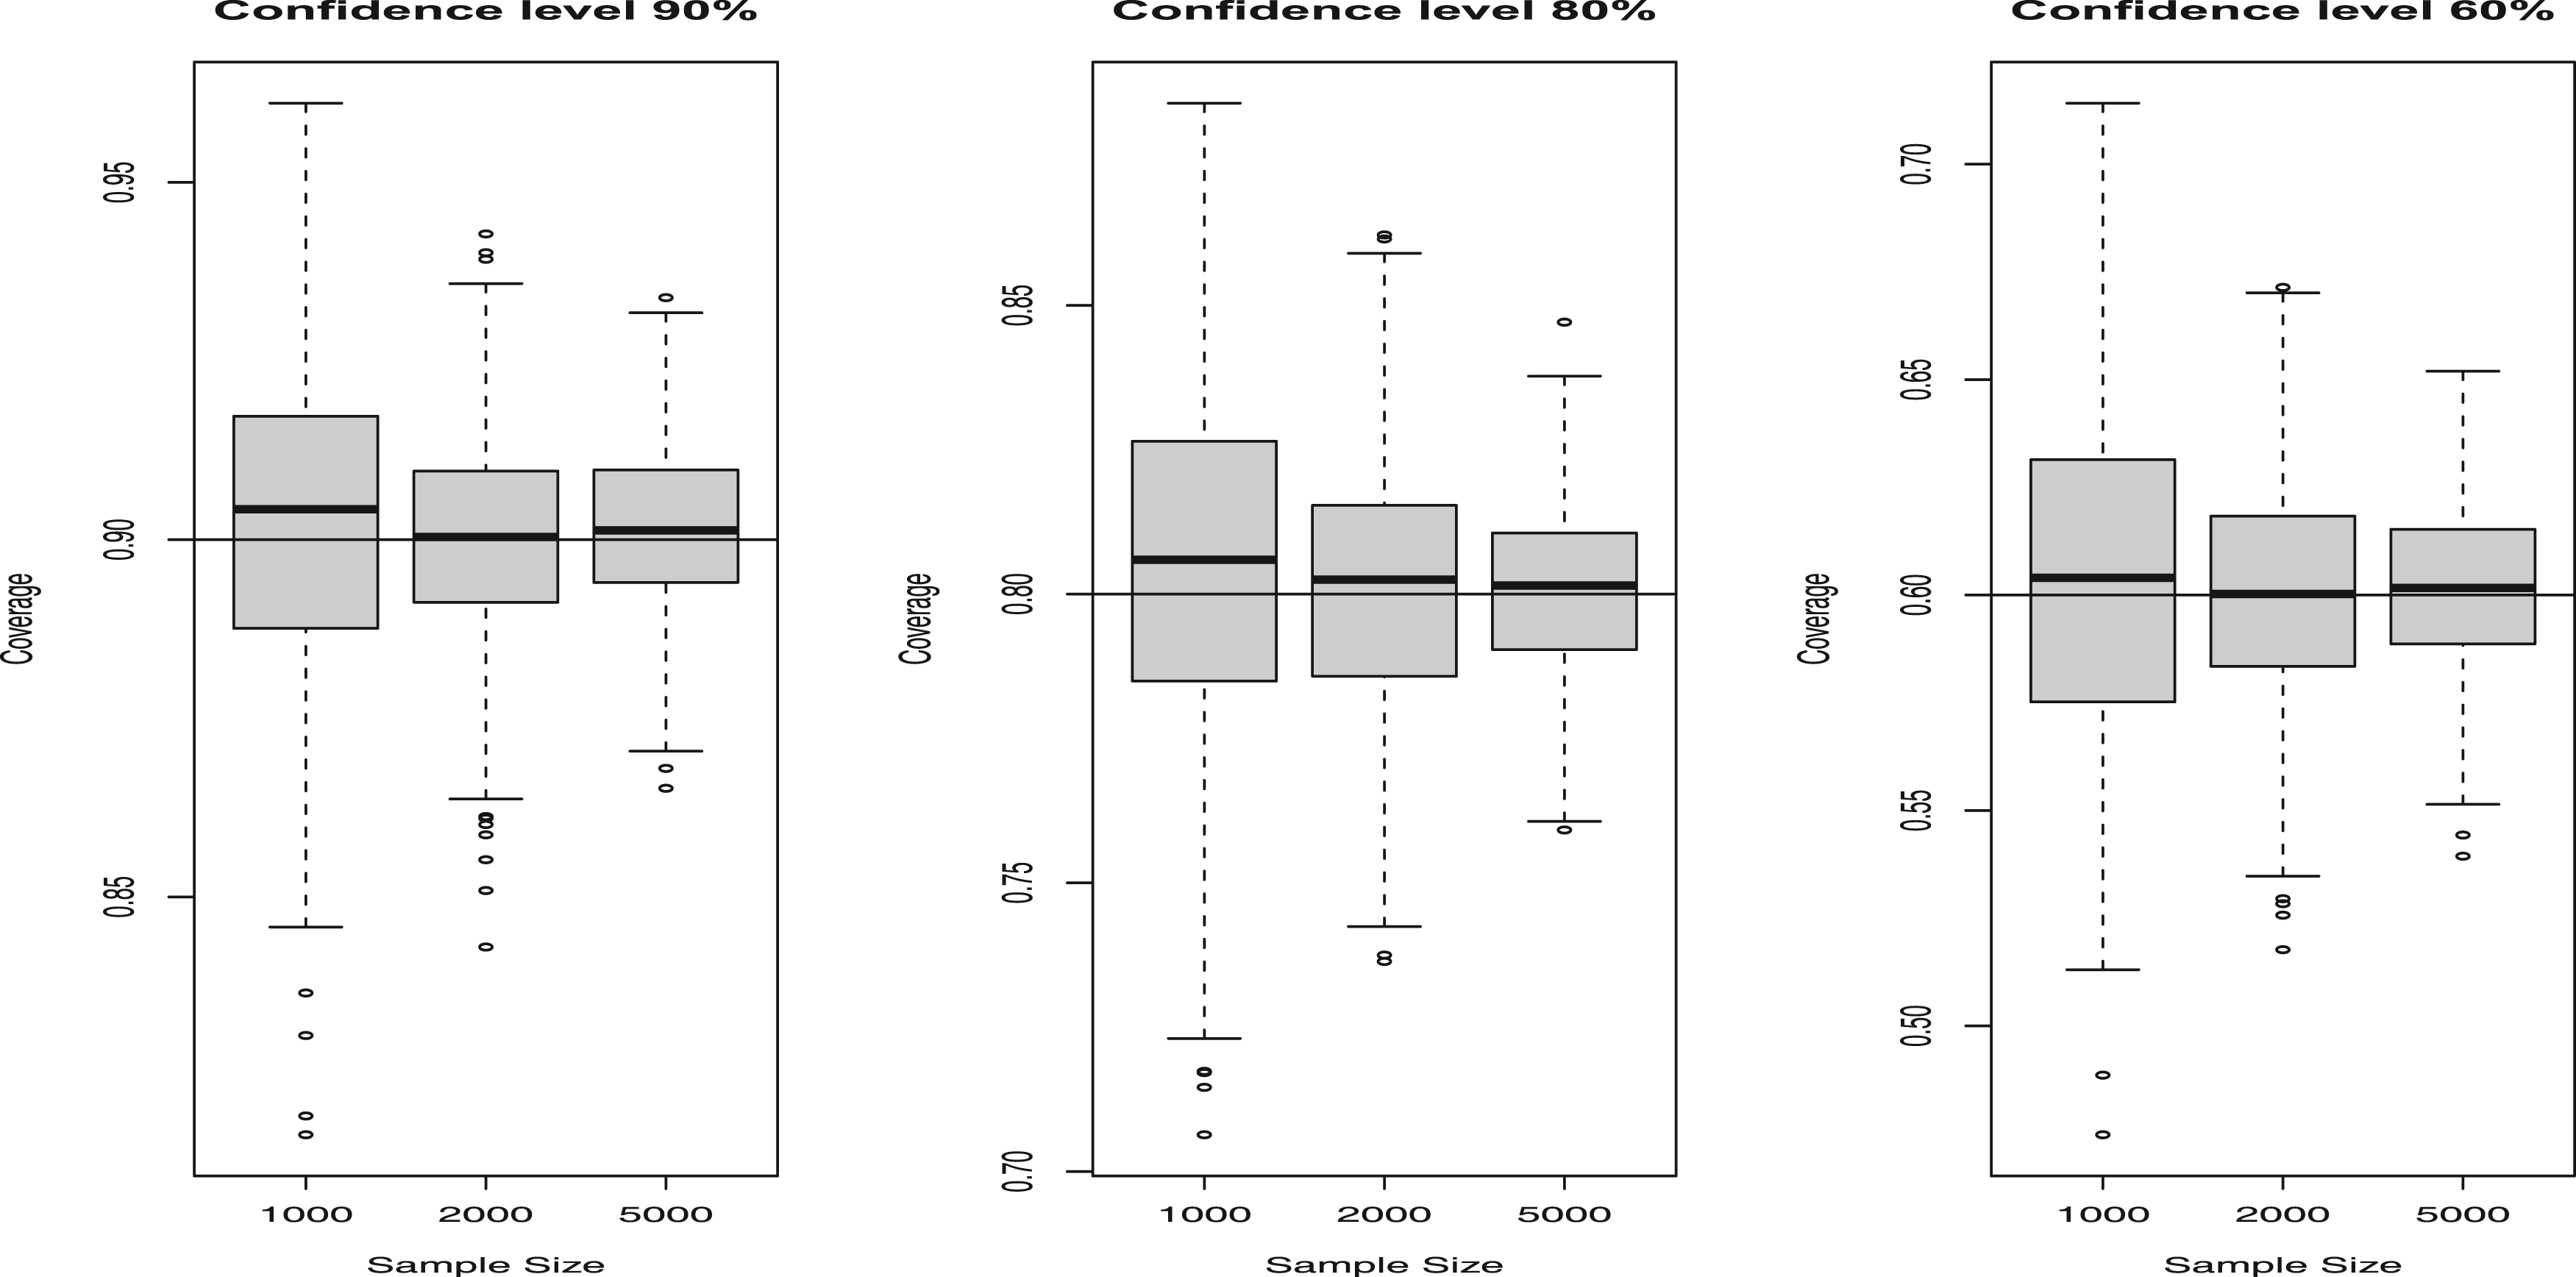
Results of conformal simulation exercise for the generative model (a).
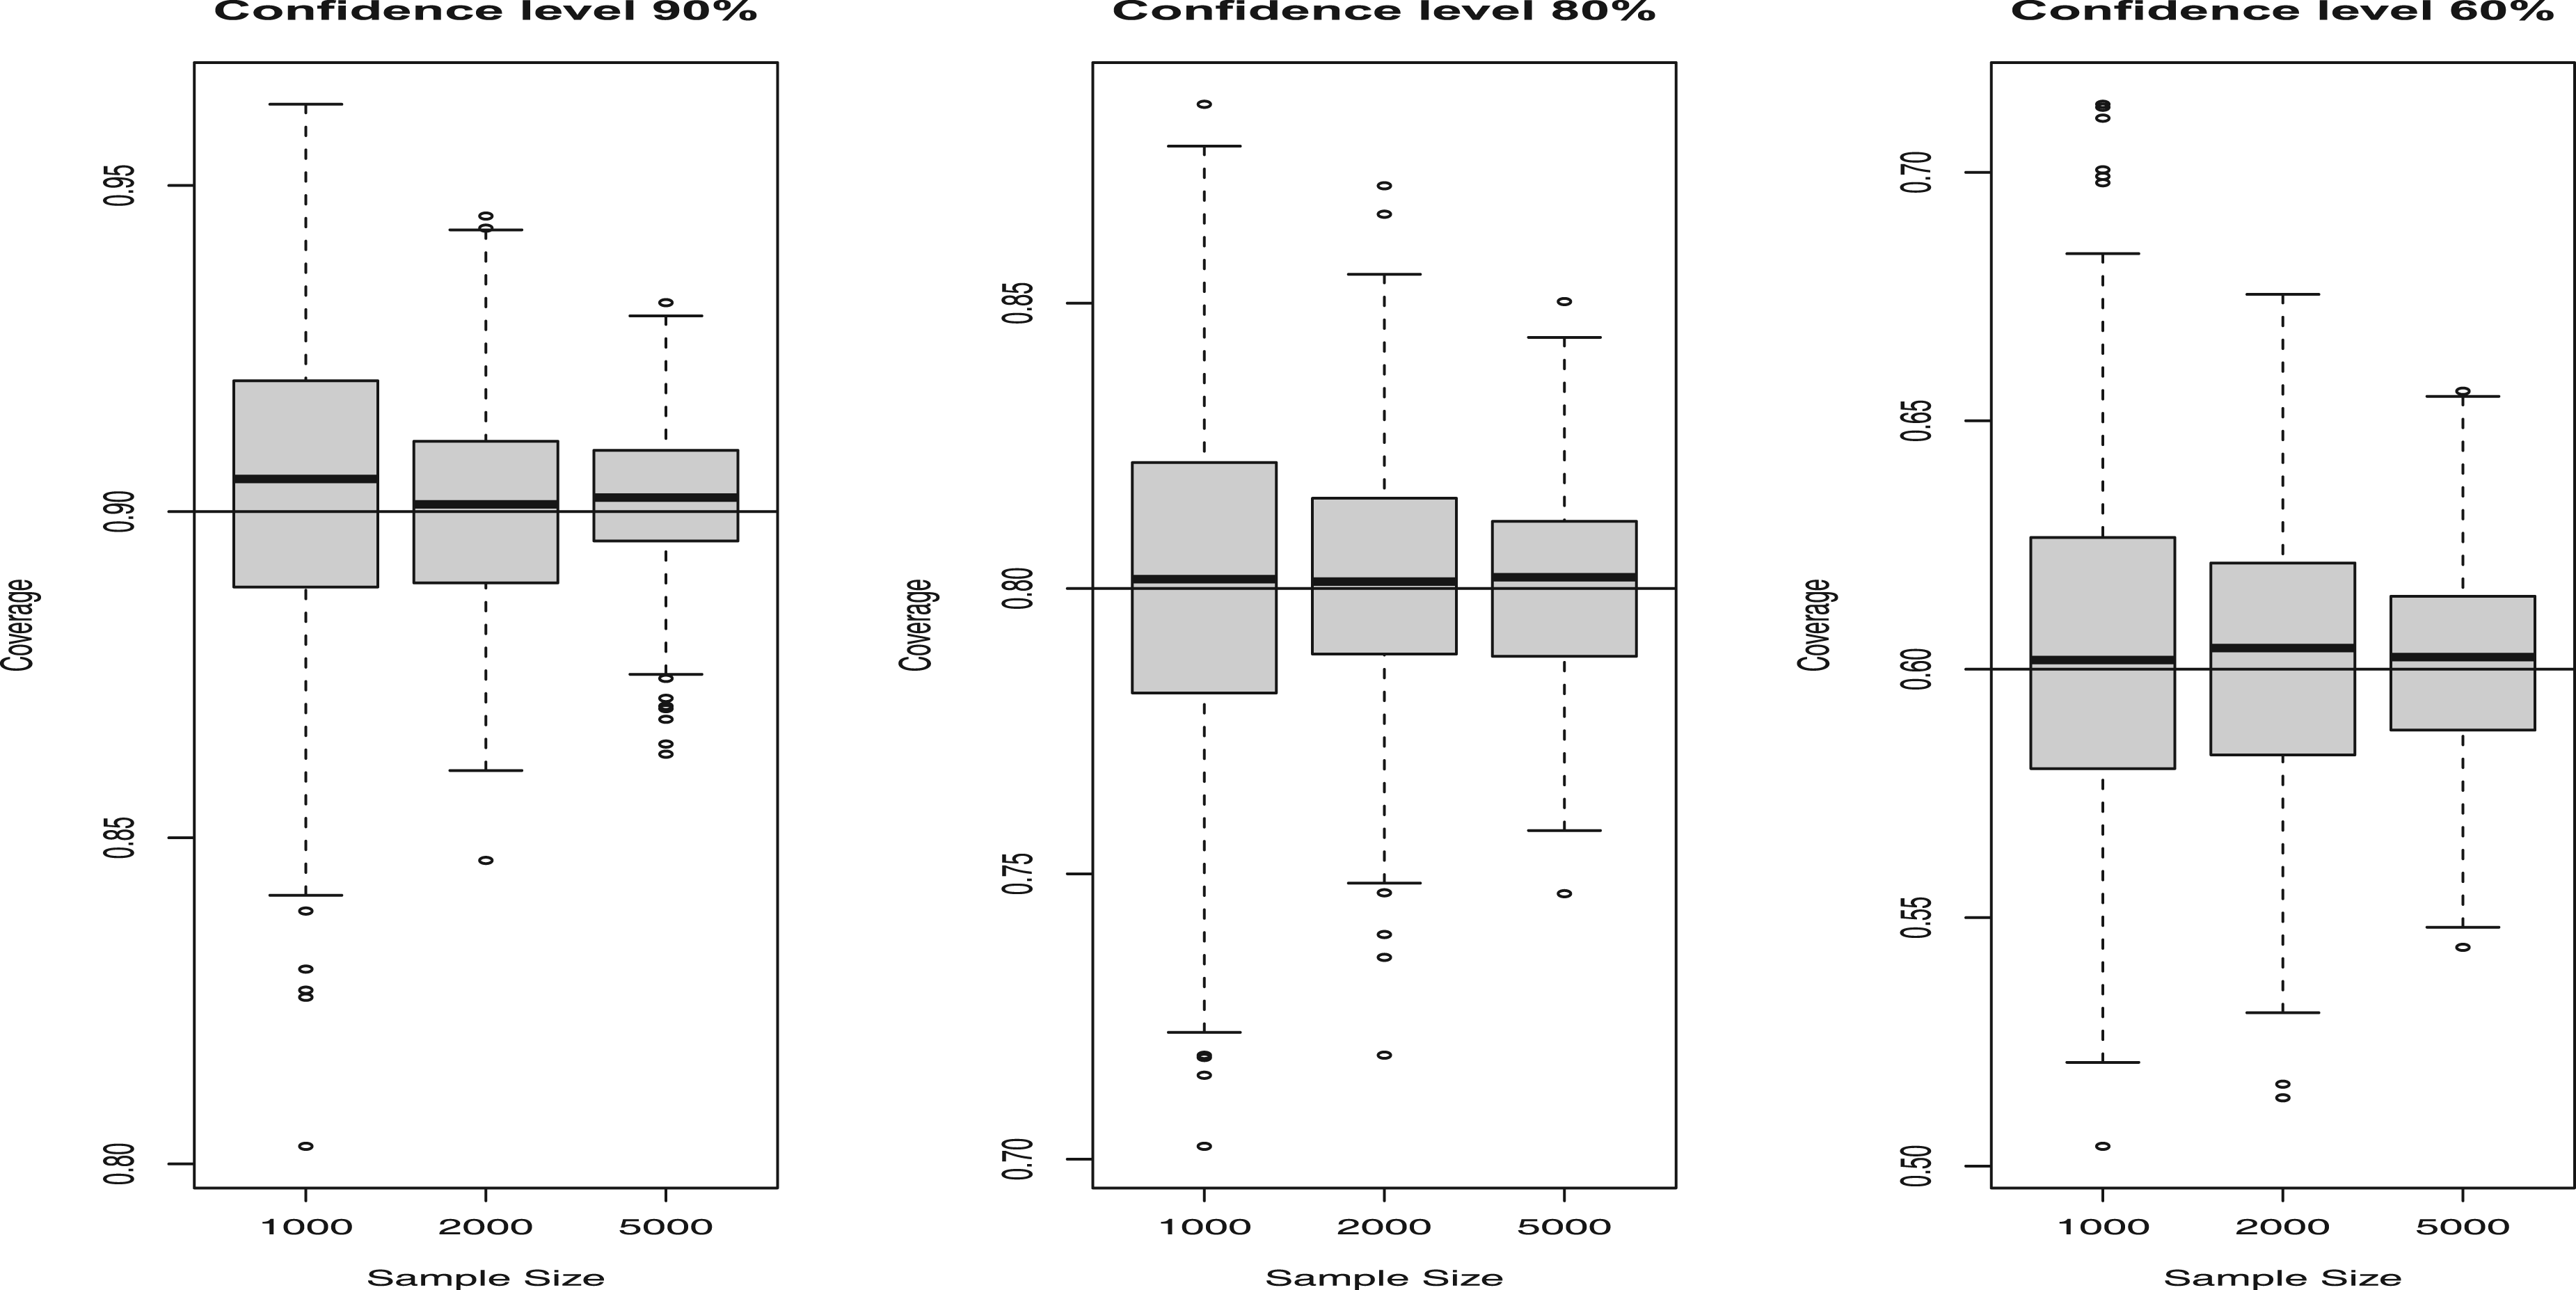
Results of conformal simulation exercise for the generative model (b).
Our findings highlight the finite-sample validity of conformal prediction, which confirms that
Literature review: Predictive models for diabetes risk stratification
Various predictive models have been developed to stratify diabetes risk, including the Finnish (FINDRISC) 32 and German (GDRS) 33 diabetes scores, formulated over a decade ago. These scores use logistic regression to predict the 10-year risk of diabetes or employ survival analysis techniques, such as Cox regression, to estimate the time to diabetes onset. They are based on easily accessible variables, such as age, sex, anthropometric measures, lifestyle, family medical history, and medication use.
Recent approaches have employed machine learning (ML) methodologies to predict the progression of diabetes in individuals with healthy or pre-diabetic states, yielding promising results.34,35 However, these studies are primarily based on observational data, often exclude subjects with incomplete data, and thus warrant caution when applying these results clinically.
Our approach differs in that it focuses on predicting diabetes status at a specific point in time using current patient characteristics. This approach offers statistical advantages, increases case numbers, and mitigates the imbalance issues commonly encountered in longitudinal prediction models. Additionally, we employ a survey sampling design, enabling robust, generalizable predictions for the US population.
NHANES 2011–2014 data
To train and validate the neural network diabetes prediction model for the first time, we used data from the 2011–2014 NHANES waves, 36 a comprehensive survey targeting the civilian, non-institutionalized US population.
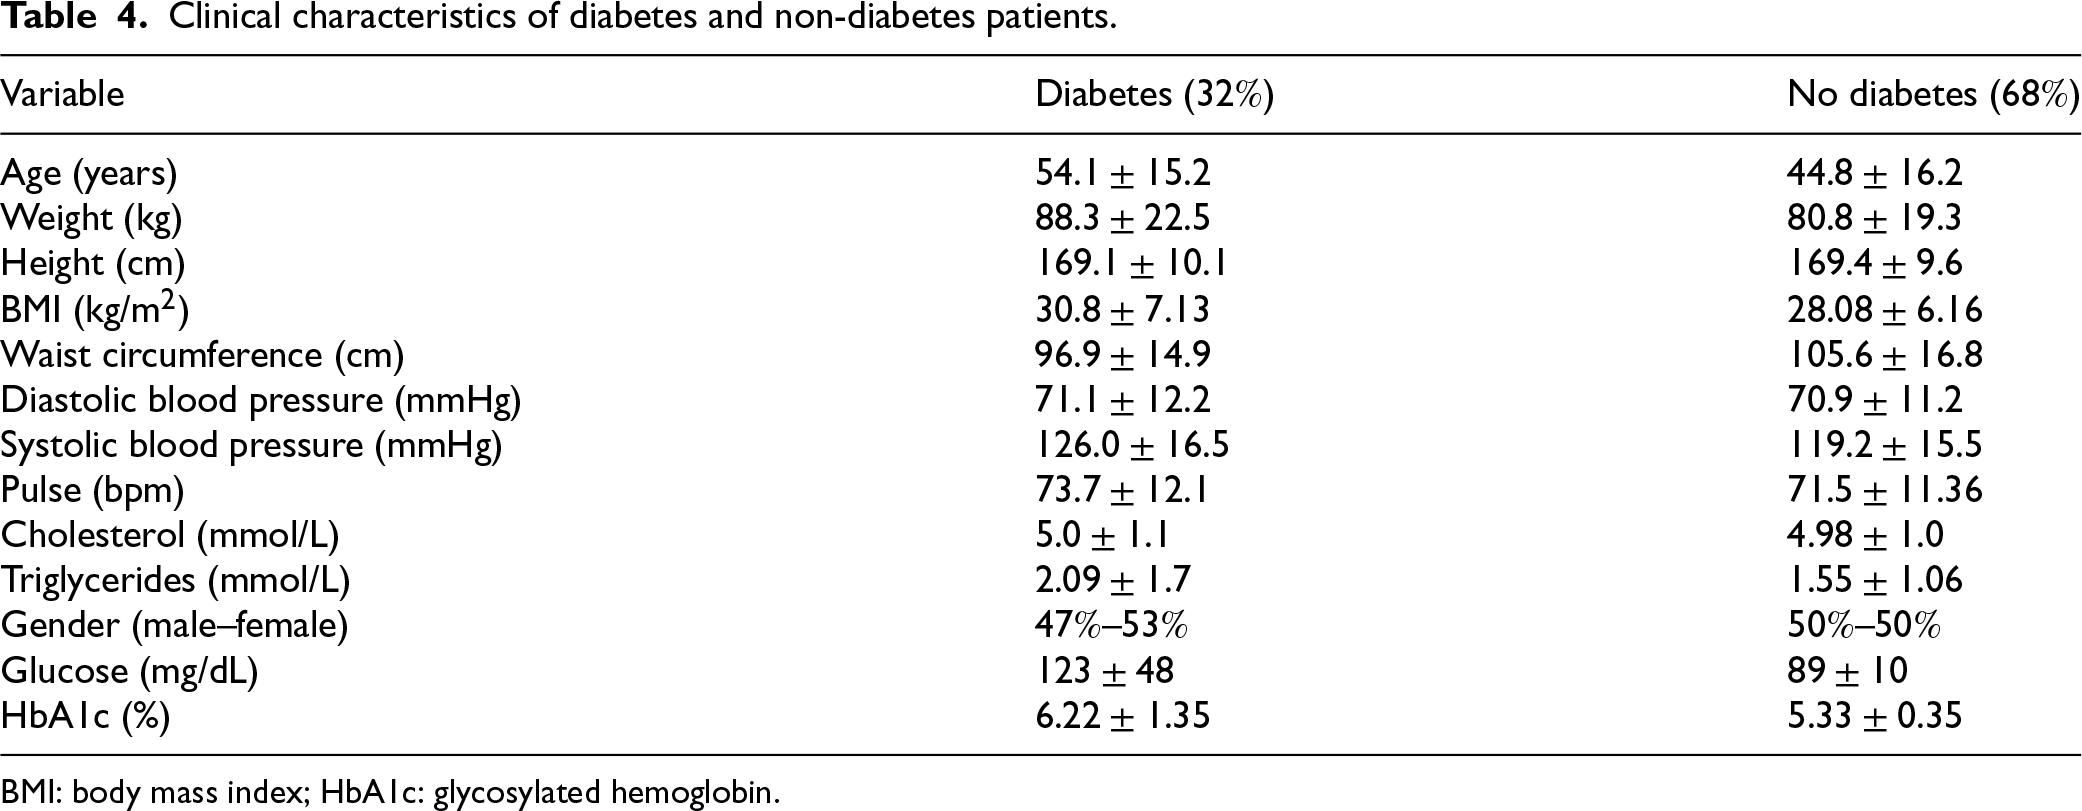
Data collection involved both interviews and clinical examinations. The interviews collected demographic, health, and nutritional information, while clinical examinations included physical measurements, blood pressure assessment, dental exams, and collection of blood and urine samples for laboratory analysis. The dataset analyzed comprises 5011 individuals aged 20 to 80 years (see Table 4 for more details on the demographic, anthropometric, and biochemical characteristics of the cohort).
Clinical characteristics of diabetes and non-diabetes patients.
Clinical characteristics of diabetes and non-diabetes patients.
BMI: body mass index; HbA1c: glycosylated hemoglobin.
The key variables considered in our study include age (categorical and continuous), race, gender, cancer or diabetes diagnoses (categorical), blood pressure, grip strength, body mass index (BMI), and biochemical biomarkers such as cholesterol and triglycerides (continuous).
Race categories were encoded as follows: 1
We used the NHANES 2011–2014 because these adjacent 2-year cycles provide: (i) comprehensive availability of key diagnostic biomarkers—FPG and HbA1c—measured under stable, well-documented laboratory protocols; (ii) the ability to pool cycles using standard analytic weights to increase precision, as recommended by the NHANES analytic guidelines; and (iii) a pre-pandemic, methodologically homogeneous window. Later data collections were interrupted by the COVID-19 suspension (2019–2020) and subsequently combined with 2017–2018 into a special file “2017-March 2020 pre-pandemic” with custom weighting, complicating direct comparability. This design choice maximizes internal consistency while maintaining population representativeness.36–38
We also selected this cohort because it includes the measures of physical activity in addition to other variables examined related to functional status, allowing the development of more complex predictive models. This breadth of information makes the 2011–2014 cycles preferable to others that lack comparable medical examination.
Our analysis involved 5011 participants, each assigned survey weights
Diagnostic criteria for type-2 diabetes, according to the ADA guidelines,
39
include: FPG HbA1c previous medical diagnosis of diabetes.
Although our models incorporate FPG and HbA1c, perfect predictive precision remains unattainable due to individuals previously diagnosed with diabetes who currently exhibit measurements in the non-diabetic range.
Experimental setup
The dataset was restricted to participants aged 20 to 80 years from the NHANES 2011–2014 survey. The dataset was randomly partitioned into
Continuous predictors were evaluated both on the raw scale and after standardization (using the mean and standard deviation from the training split only). As no practical differences in predictive performance were observed between the two approaches, the reported experiments use the raw (non-standardized) values.
Categorical predictors were encoded as one-hot vectors, and this encoding was consistently applied across the training, validation, and test sets to ensure alignment of reference categories.
The NHANES survey weights were incorporated throughout the workflow: in model training via a weighted binary cross-entropy loss and in evaluation via survey-weighted performance metrics (AUC, accuracy, precision, recall,
To ensure robust evaluation and reduce estimation bias,
Model optimization was performed using the Adam algorithm, 26 a stochastic gradient-based optimizer that adaptively estimates first- and second-order moments of the gradients, providing robust convergence across a wide range of learning rates and network architectures. Because the loss function of the neural network is non-convex, the fitted model may depend on the choice of optimizer and the random initialization of the weights. To ensure reproducibility, all random seeds were fixed, and the same optimizer was used consistently throughout the experiments.
The neural network was trained using a grid search over multiple hyperparameter configurations for each scenario. Three architectures for hidden layers were evaluated, with layer sizes set at [
Multilayer perceptron (MLP) neural network performance metrics and variable sets for Models 1 to 4.
Multilayer perceptron (MLP) neural network performance metrics and variable sets for Models 1 to 4.
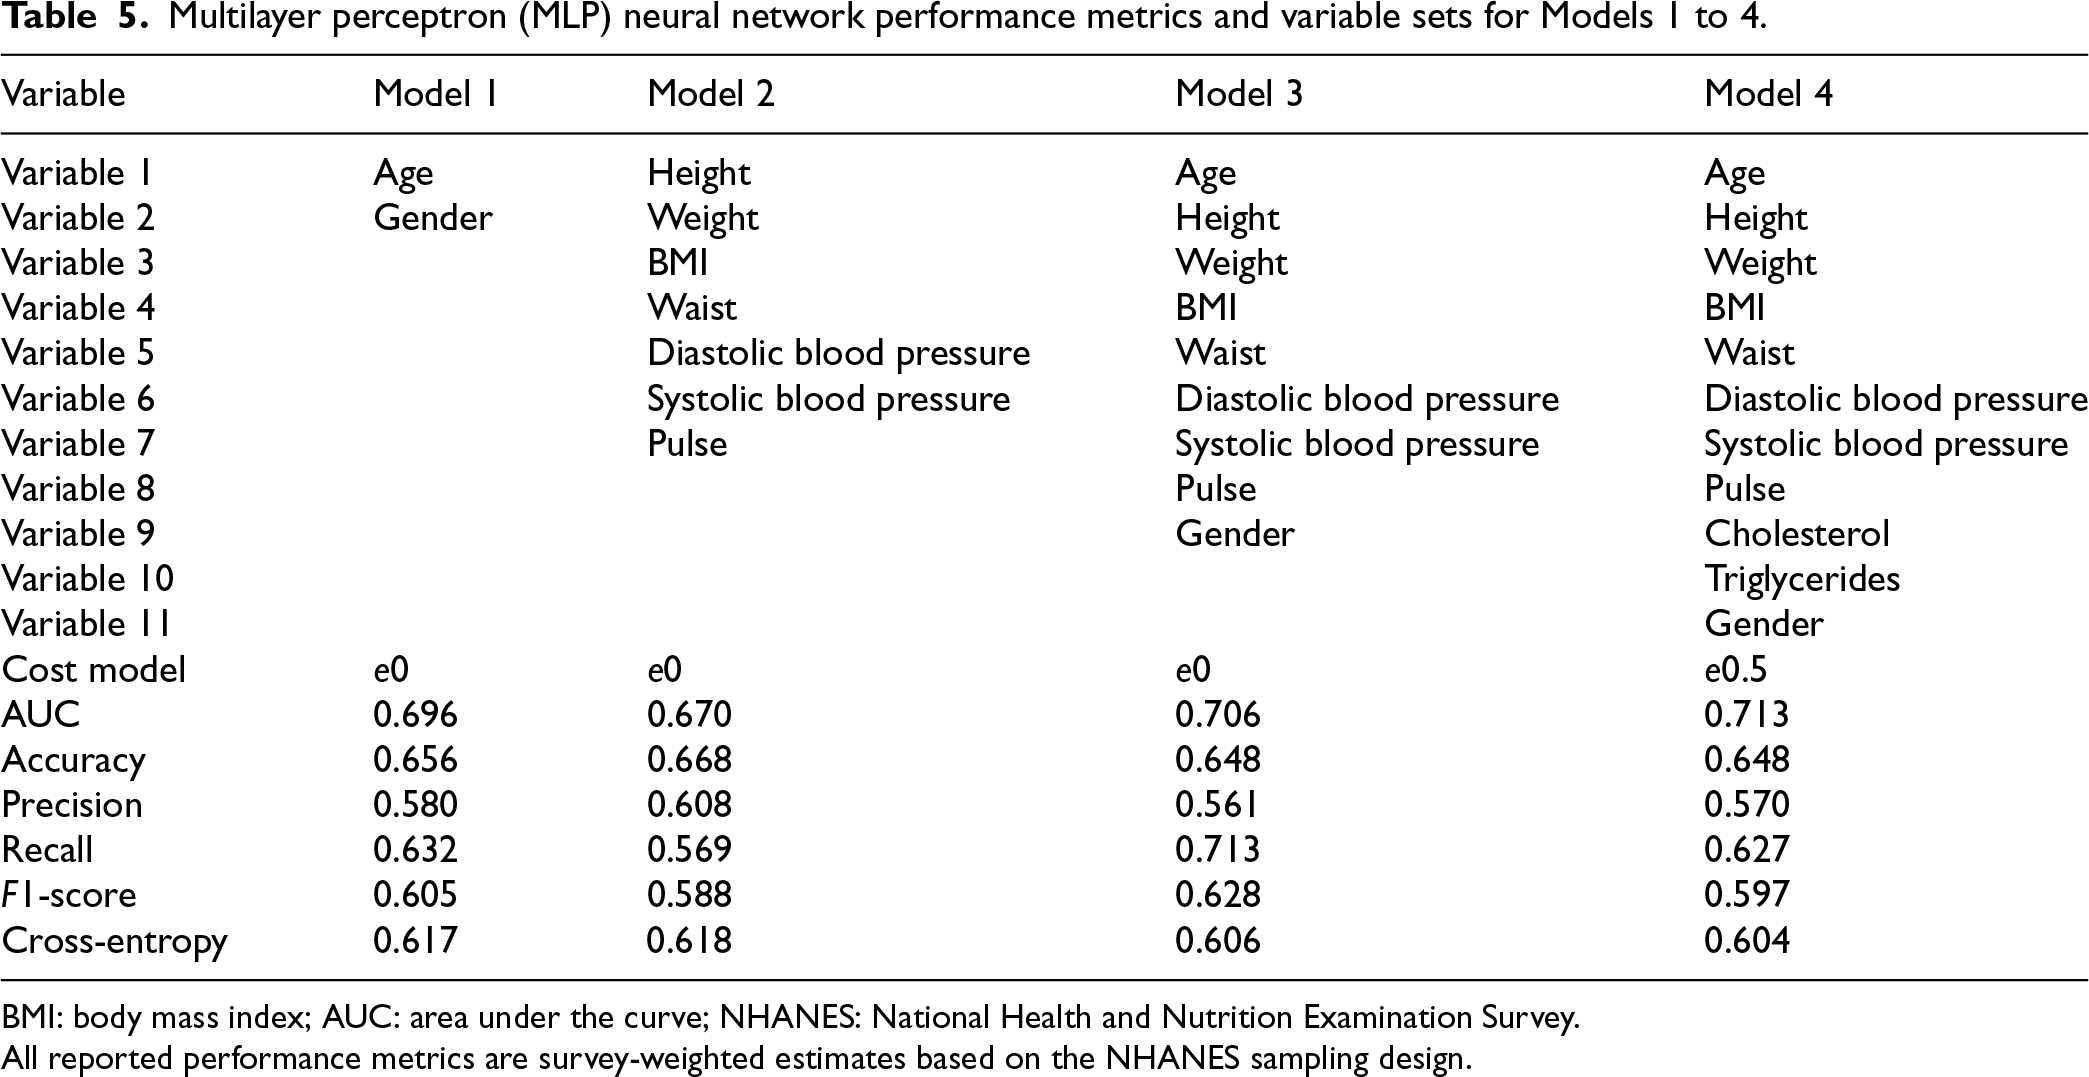
BMI: body mass index; AUC: area under the curve; NHANES: National Health and Nutrition Examination Survey.
All reported performance metrics are survey-weighted estimates based on the NHANES sampling design.
Multilayer perceptron (MLP) neural network performance metrics and variable sets for Models 5 to 7.
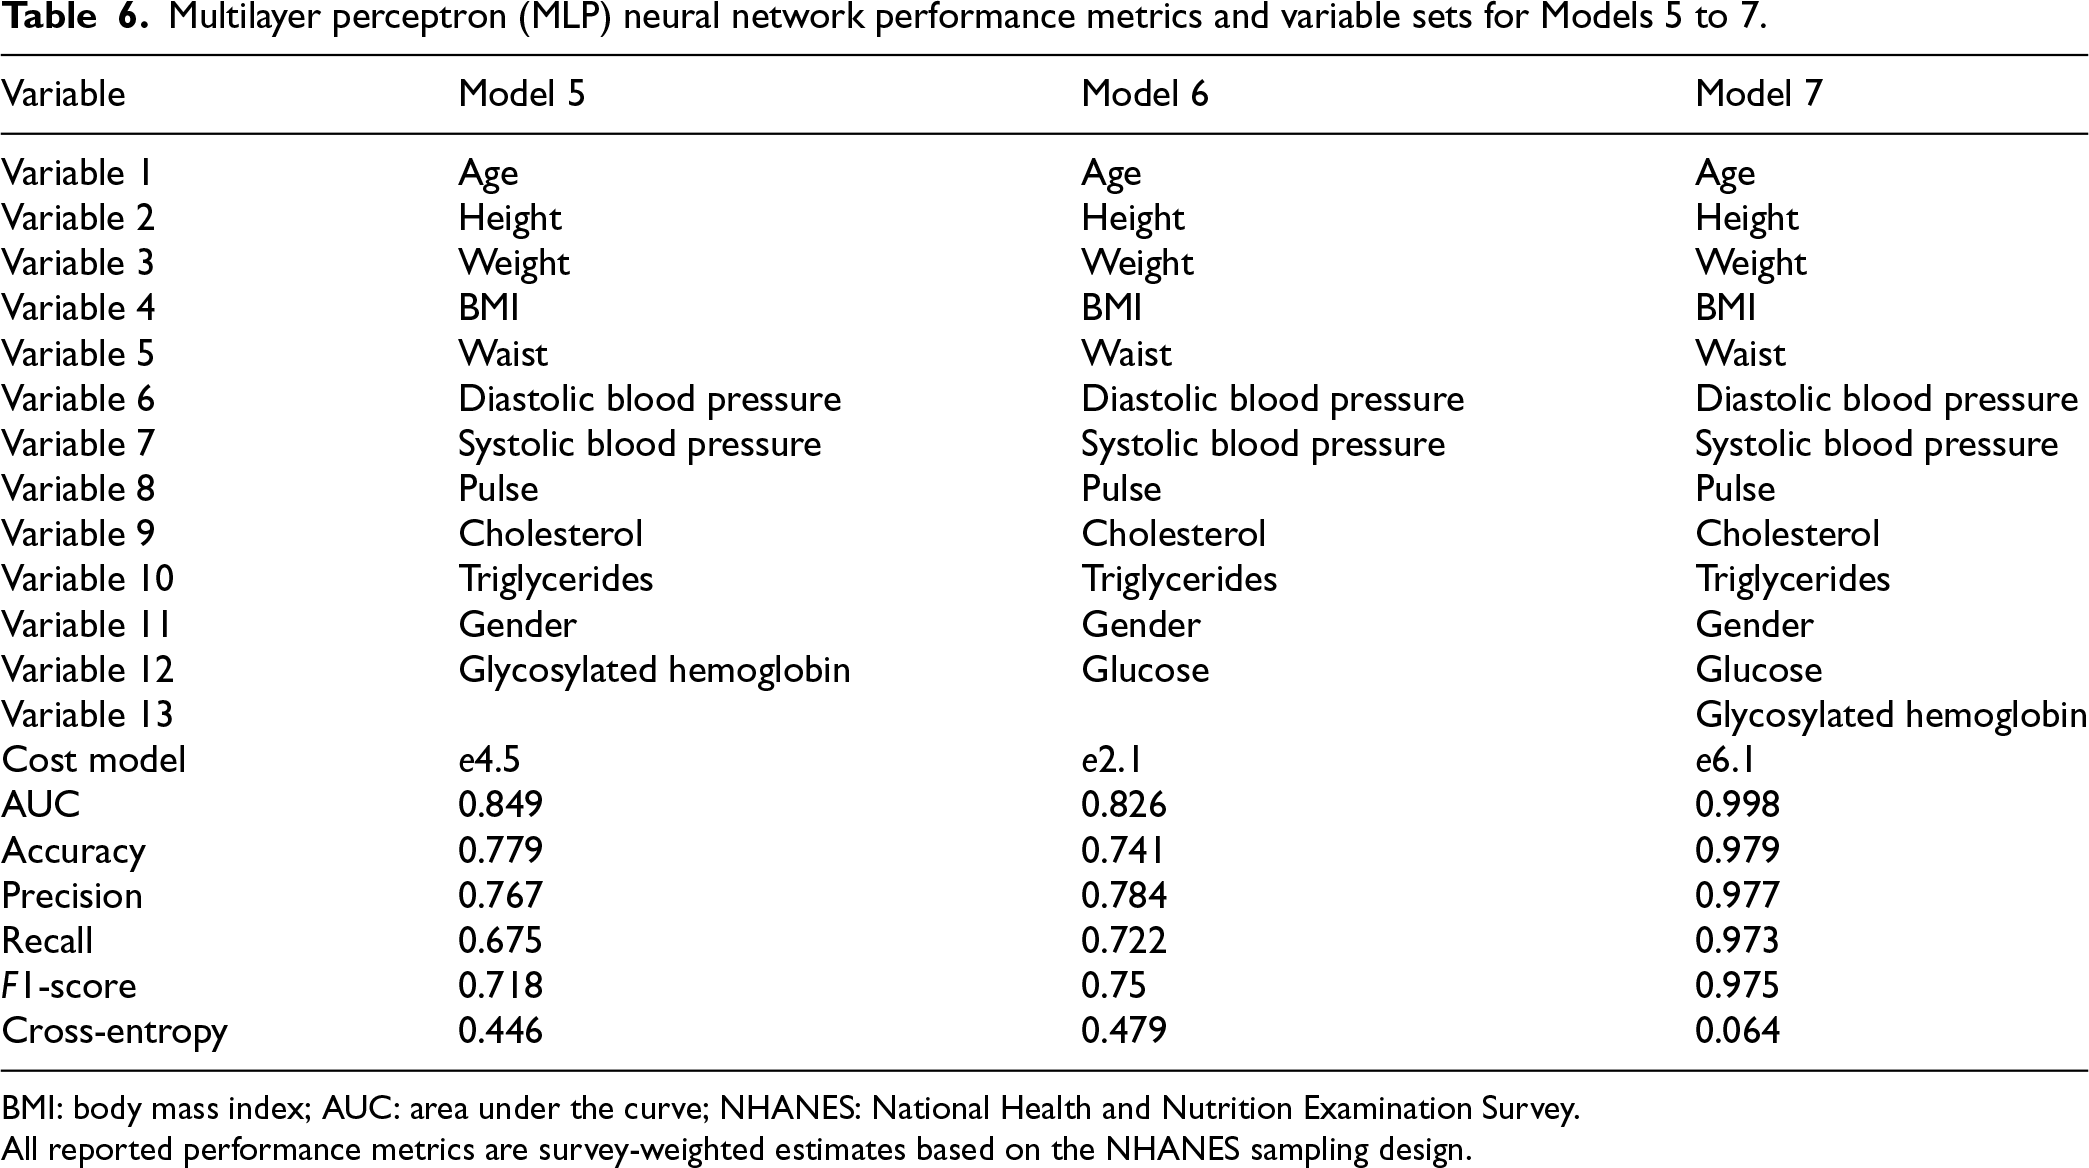
BMI: body mass index; AUC: area under the curve; NHANES: National Health and Nutrition Examination Survey.
All reported performance metrics are survey-weighted estimates based on the NHANES sampling design.
We systematically evaluated seven predictive models of different complexity (in terms of measurement and economic cost to perform the corresponding clinical tests) in a holdout test sample to detect diabetes, which was not used for model training or hyperparameter tuning (see Tables 5 and 6). For this purpose, we considered discriminative metrics such as AUC, accuracy, recall, precision,
Models 1 to 4 gradually included more clinical variables, starting with basic demographics and extending to physiological and metabolic markers such as cholesterol and triglycerides. Model 4 significantly improved performance (
Our analysis reveals a clear relationship between model complexity, accuracy, and operational costs. The significant performance gains observed from Model 1 to Model 7 underscore the importance of careful variable selection, highlighting the need to balance improved predictive accuracy with practical considerations of cost and feasibility in clinical settings when performing screening for diabetes mellitus. To facilitate comparison with batchwise matching, the Supplemental materials include results from a linear logistic regression model from the NHANES 2011–2014 that used the described seven models. Across cross-validation folds—especially for Models 5–7—the non-linear neural network models demonstrate better predictive discrimination than logistic regression. In particular, the AUC improves, reflecting performance across all decision thresholds, whereas other metrics, such as accuracy, are less informative because they depend on a single cutoff (often 0.5).
Model 6 (model measurement cost of
These metrics indicate that the probability of a diabetic individual not being identified is reduced to
External validation: Comparing neural networks and logistic regression using NHANES Survey Data (2009–2010, 2015–2016)
To assess whether the added complexity of the model is justified for detecting diabetes, we externally validated a neural network model against a competing survey-weighted logistic regression (LR) model. To minimize the distribution shift relative to the development data—and to account for potential changes in diabetes prevalence and covariate distributions throughout the survey years—we selected temporally proximate NHANES cycles for external validation. The NHANES 2009–2010 and 2015–2016 survey cycles were strictly excluded from all training, hyperparameter tuning, and cross-validation. The resulting dataset comprised a total of 11,761 individuals.
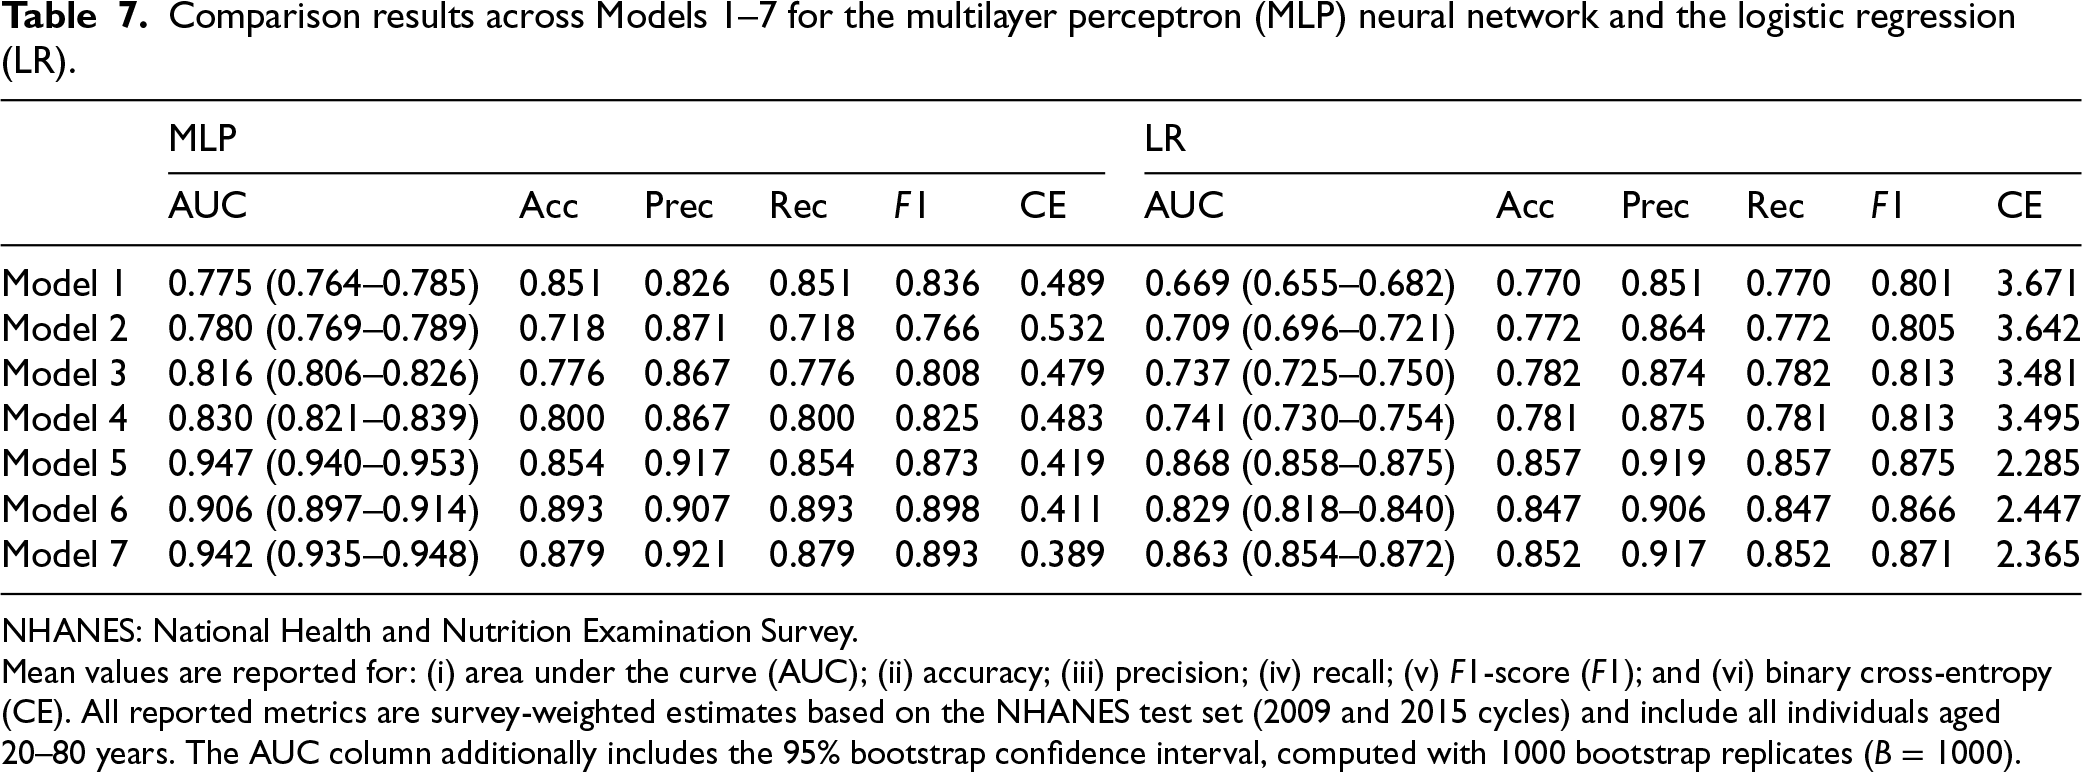
Comparison results across Models 1–7 for the multilayer perceptron (MLP) neural network and the logistic regression (LR).
Comparison results across Models 1–7 for the multilayer perceptron (MLP) neural network and the logistic regression (LR).
NHANES: National Health and Nutrition Examination Survey.
Mean values are reported for: (i) area under the curve (AUC); (ii) accuracy; (iii) precision; (iv) recall; (v)
Although Table 7 reports multiple performance metrics for seven model specifications (Models 1–7), we emphasize the AUC metric in our detailed analysis because it provides a threshold-independent measure of discrimination.
Across the NHANES 2009–2010 and 2015–2016 samples, neural network models achieved higher AUC than logistic regression baselines, suggesting that flexible, non-linear architectures can adapt in a data-driven manner to complex functional relationships between predictors and diabetes risk. While logistic regression can accommodate non-linearities through pre-specified interaction terms, polynomial expansions, or spline transformations, such structures must be specified a priori. In contrast, neural networks can automatically learn these representations from the data, which may explain their improved discrimination in this setting.
From a clinical perspective, improved discrimination can support better identification and reclassification of at-risk individuals; however, these gains must be weighed against the risk of overfitting and the need for population-level generalizability. In general, neural network models with lower clinical complexity (Models 1–4) improved AUC by approximately 10% relative to logistic regression. When diabetes-specific biomarkers were included (Models 5–7), the incremental benefit of NN was smaller. Both approaches generalized well, but neural networks’ performance remained closer to that observed in the NHANES 2011–2014, while logistic regression showed a greater decline in external cycles. Taken together, these findings support the use of flexible non-linear models to improve diabetes risk prediction when only basic predictors are available, while the advantage narrows when more direct biomarkers (e.g. HbA1c or FPG) are included.
Table 7 also reports 95% confidence intervals for the AUC, based on
A central challenge in predictive modeling is not only to provide an outcome label (e.g. diabetes = 1 vs. 0), but also to communicate how reliable this prediction is for a specific individual. In clinical decision-making, physicians rarely act on a binary prediction alone: they also need to understand the degree of uncertainty surrounding it. Two patients may both be classified as “at-risk for diabetes,” yet the confidence of the model in these predictions can differ substantially, with implications for follow-up testing or treatment decisions. Capturing and quantifying this confidence variability at the individual level is therefore essential to transition from population-wide models to personalized, clinically actionable tools.
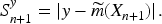
Formally, conformal prediction provides individual-specific prediction sets. For each individual and each confidence level 
Following Algorithm 1, for observation 
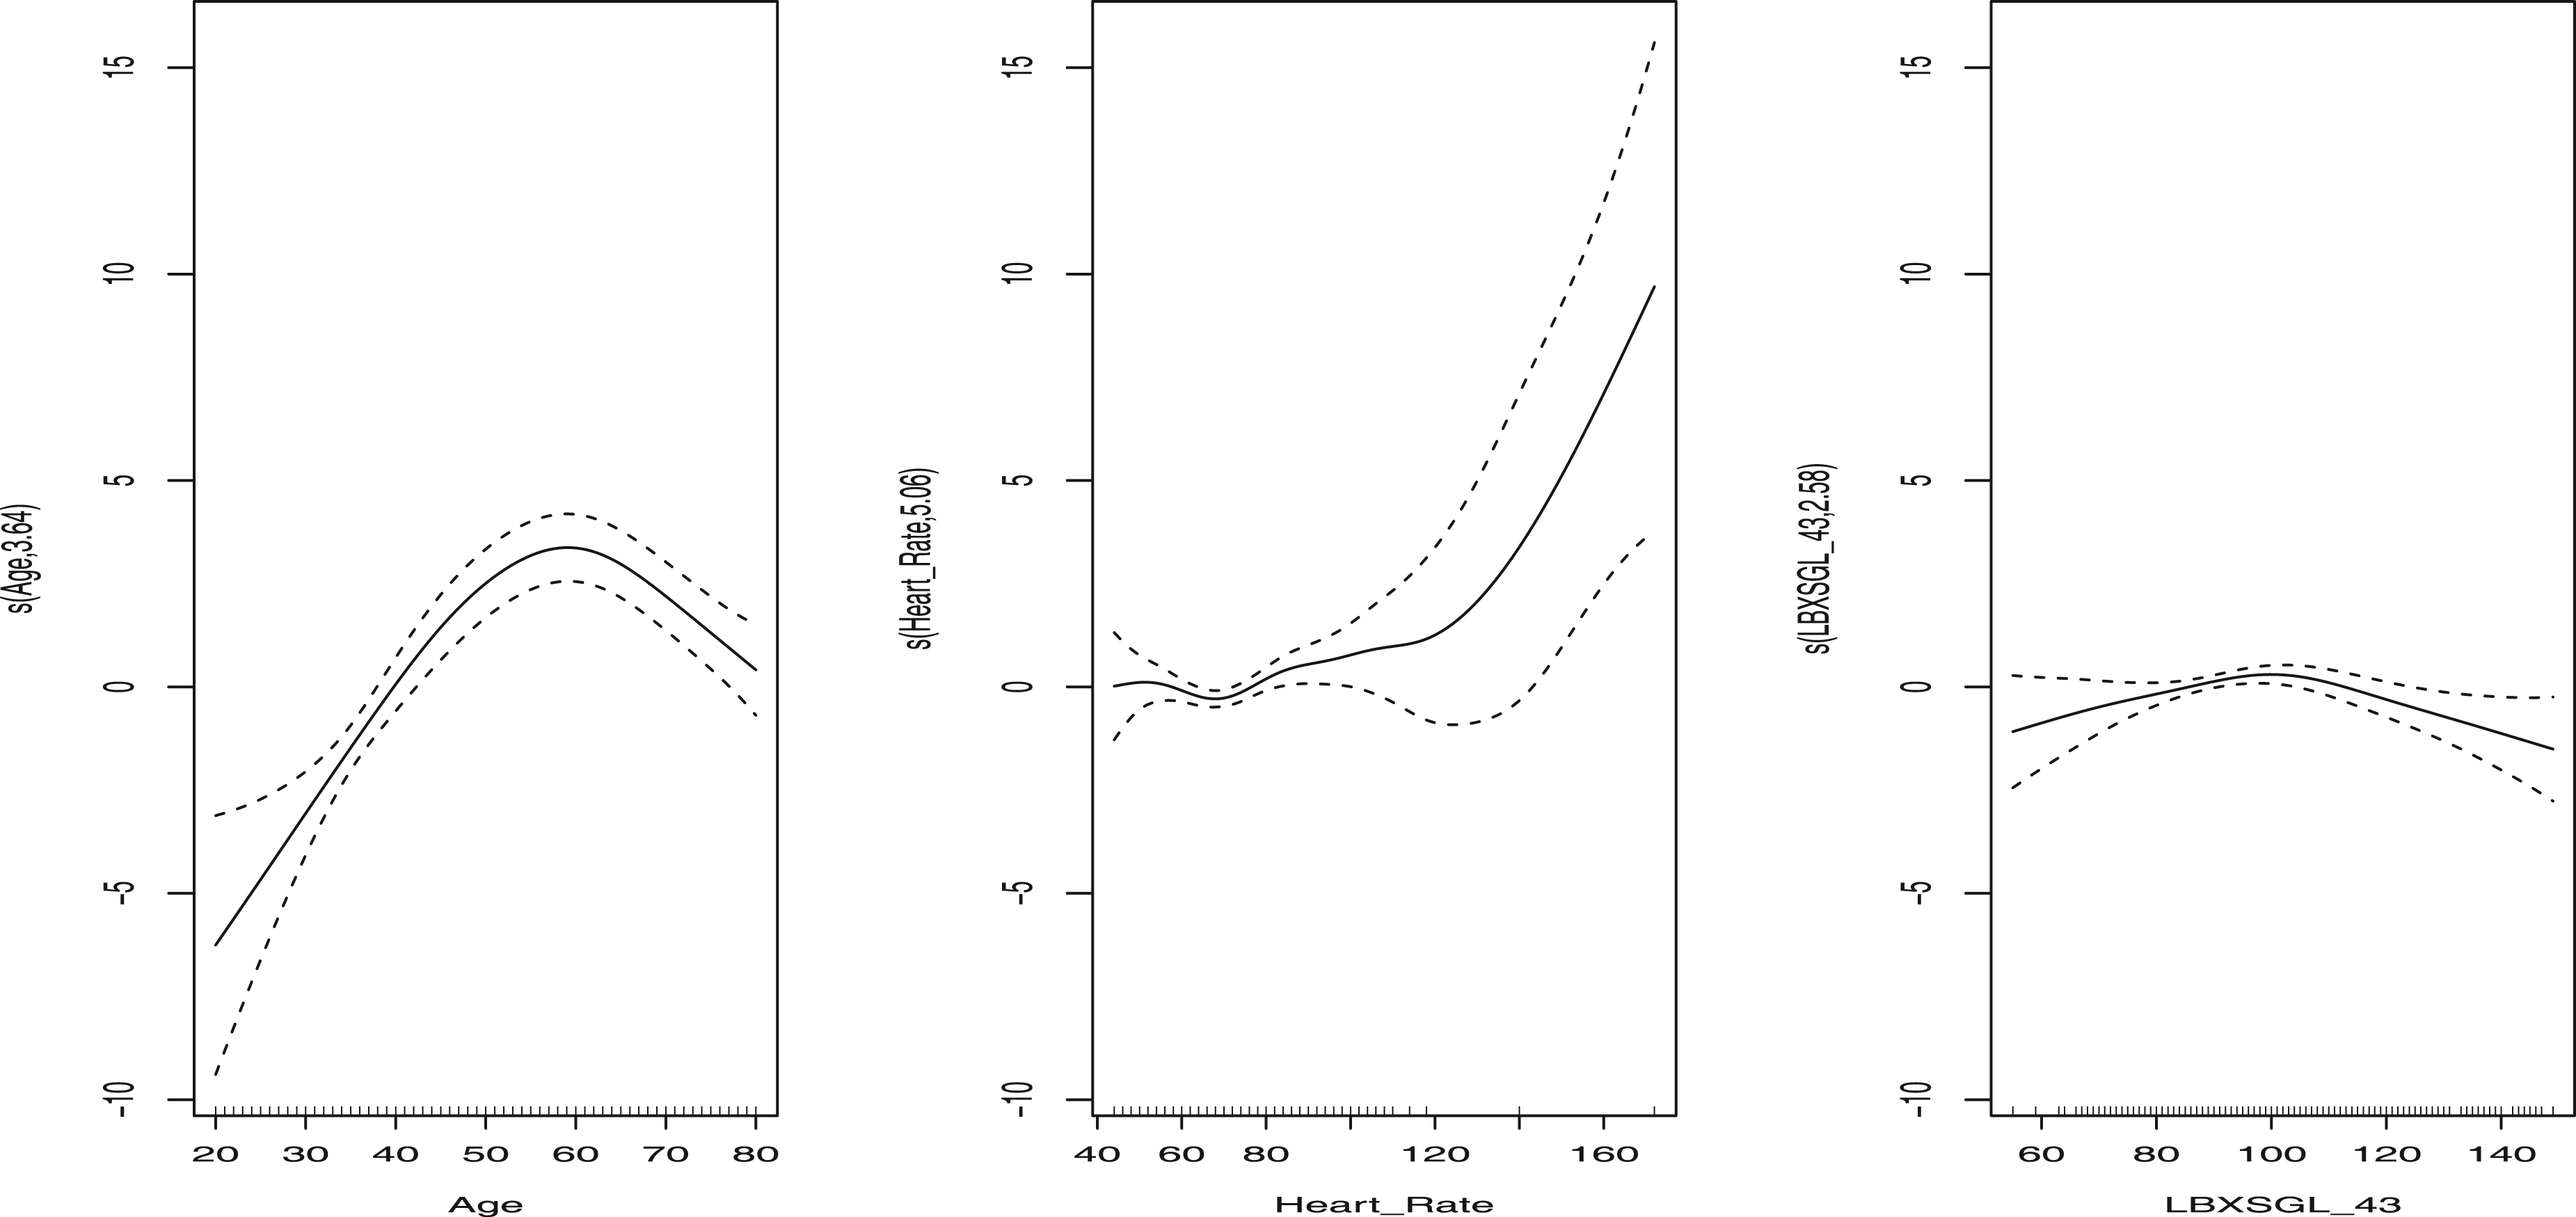
To explore which patient characteristics are most strongly associated with predictive uncertainty, we modeled the individual uncertainty score 
The results of the splines adjustment (Figure 3) reveal several key epidemiological patterns: Highest uncertainty was observed among adults (50–70 years) with elevated heart rate and FPG values in the pre-diabetic range (100–125 mg/dL). Lower uncertainty occurred in clearly normoglycemic or diabetic older adults, as well as in younger individuals with low HR and low FPG, where the model predictions were more reliable. Clinical relevance: Conformal scores can therefore indicate subgroups where predictions are fragile and variable, such as older adults in the pre-diabetic range with elevated HR. For these individuals, additional diagnostic testing or closer monitoring may be warranted.
Covariate effect to predict the score function
This work introduces a novel predictive framework based on neural network models that can accommodate a range of complex sampling designs, including stratified sampling, Bernoulli sampling, and maximum entropy sampling. A theoretical analysis introduced in Appendix A demonstrates that the proposed regression methods achieve universal consistency under certain regularity conditions related to survey designs, analogous to the consistency obtained with i.i.d. data, leveraging recent advances in empirical process theory for survey data.
In the simpler models in the case study NHANES 2011–2014, Models 1–4, the gains of information in terms of statistical association are modest; however, as model complexity increases (Models 5–7), the non-linear capabilities of the neural networks yield more pronounced advantages. In particular, in external validation data (NHANES 2009–2010 and 2015–2016), the magnitude of the improvement is greater than that of the linear logistic regression model, particularly for the AUC prediction metric.
Accordingly, these findings should not be interpreted as a blanket endorsement of neural networks over traditional methods. Instead, our results indicate that the observed performance gains are most pronounced in the presence of non-linear associations and higher-order interaction effects. Neural networks can adaptively learn such structures from the data, while logistic regression generally relies on explicit pre-specification of non-linear transformations and interaction terms, which can be challenging to choose and may require prior substantive knowledge.
In clinical applications focused on predicting diabetes risk using the NHANES 2011–2014 data, we evaluated models of varying complexity and their associated economic costs. From a public health perspective, our findings are significant as they quantify the risk of diabetes using models that differ in complexity, resource requirements, and predictive efficacy. In particular, simpler models demonstrated sufficient effectiveness in certain subgroups of patients, facilitating diabetes risk screening. Quantification of uncertainty revealed that age, elevated heart rate, and baseline glucose levels in the pre-diabetic range significantly contribute to the uncertainty of predictions. Despite utilizing the main diagnostic criteria, perfect predictive performance is unattainable due to people who have normal glucose levels, but were previously diagnosed as diabetic.
Beyond methodological relevance, the uncertainty quantification step has direct clinical implications. GAM-based analysis of conformal uncertainty scores highlights patient subgroups where predictions are less reliable, such as older adults with elevated heart rate and fasting glucose values in the pre-diabetic range. In practice, these individualized uncertainty estimates can be used to identify patients who may benefit from more frequent follow-up schedules or additional diagnostic tests, thus supporting risk-stratified decision-making and more efficient allocation of healthcare resources.
A model excluding laboratory measurements achieved an AUC of 0.71, comparable to traditional diabetes risk scores, which incorporate anthropometric and cardiac variables alongside basic demographic characteristics. A recent comment 42 highlighted the inconsistency of diabetes scores in observational cohorts and limited experimental designs, a concern that aligned with our introduction and underscores the reproducibility crisis. Our proposed models offer improved population-level reproducibility. Future analyses may include creating patient phenotypes based on prediction uncertainty or identifying clinically interpretable subphenotypes where models demonstrate high discriminative capacity. For patients with high prediction uncertainty or poor predictive performance, personalized monitoring strategies, alternative measurements, or the integration of longitudinal data could be essential.
From a methodological perspective, despite extensive research on classical regression models in survey contexts, the application of machine learning remains limited. We introduce the first general NN-based framework that integrates regression and classification methods, along with a conformal-prediction-based uncertainty quantification algorithm. Although comparisons between machine learning methods and logistic regression are well established in the literature, the novelty of this work lies in extending neural network modeling to properly account for survey weighting, a capability that has long been available for logistic regression. The relative performance of the two approaches depends on how well the logistic form matches the true data-generating process. When the logistic model is correctly specified, it can outperform the neural network; however, when the model is misspecified, the greater flexibility of the neural network may yield improved predictive performance. All code and analytical scripts are publicly available on GitHub, facilitating the adoption of these methods to improve outcomes in precision public health and epidemiology. To highlight the relevance of this study, it is essential to note that more than 50,000 articles have been published to date using the NHANES data, all of which require the use of reliable statistical methods.
For future developments, several methodological extensions are recommended for the neural network framework. First, expanding the approach to handle time-to-event analyses could significantly improve predictions for censored outcomes. Second, developing novel diagnostic tools using conditional receiver operating characteristic analyses would enhance the model’s applicability. Third, incorporating functional data analysis techniques to manage random predictors in functional spaces could substantially benefit digital health applications, particularly when analyzing accelerometer data, minute-level measurements, or continuous glucose monitoring data.7,43
Footnotes
Funding
The authors disclosed receipt of the following financial support for the research, authorship, and/or publication of this article: This work has received financial support from Spanish Ministry of Science, Innovation and Universities (grants PID2023-149549NB-I00 and PDC2025-166312-I00).
Declaration of conflicting interests
The authors declared no potential conflicts of interest with respect to the research, authorship, and/or publication of this article.
Appendix A
The primary goal of this paper is to model empirical diabetes data. However, the methods introduced here are asymptotically consistent, leveraging recent progress in empirical process theory for survey sampling. In this appendix, we sketch the essential ideas behind these developments, referring in particular to Han and Wellner. 44
Moreover, we connect these survey-based empirical-process techniques to established characterizations for i.i.d. data in the neural network literature. Specifically, existing results on metric bracketing and Vapnik–Chervonenkis-dimension arguments—which often assume i.i.d. samples—can be extended to the survey setting by substituting the Horvitz–Thompson measure in place of the usual empirical measure. This substitution preserves key properties of the empirical-process framework, ensuring the validity of asymptotic consistency and normality results for a neural network trained on survey data.