
Abstract
Current status data are frequently encountered in many real life cross-sectional epidemiological, demographic, and medical studies, where each subject is examined only once, and the failure time of interest is never exactly observed but known to be either smaller or larger than the examination time for each subject by evaluating the failure status. Consequently, current status data are a mixture of left-censored and right-censored observations for the failure times of all subjects with or without covariates. In some real life studies, the test or diagnosis that is used to determine the failure status may be error-prone, and this leads to misclassified failure status for some or all subjects. The resulting data are referred to as misclassified current status data in the literature. In this paper, we study regression analysis of misclassified current status data and propose a novel estimation approach under the proportional odds model. Specifically, monotone splines are adopted to approximate the baseline odds function, and an efficient expectation-maximization algorithm is developed based on a data augmentation involving exponential and Poisson latent variables. An extension of the proposed method is also developed to account for the unknown test accuracy. The proposed method is shown to have excellent estimation performance in our simulation studies and is illustrated by an application to uterine fibroid data.
Introduction
Current status data frequently arise in cross-sectional studies in many fields such as epidemiology, demography, and clinical trials. In such studies, subjects are observed only once due to the limitation of resource or the study design, and the failure time of interest is never exactly observed but known to be smaller or larger than the examination time depending on the failure status for each subject. Thus, the failure time is either left-censored or right-censored for each subject, and this type of data, a mixture of left-censored or right-censored observations for the failure times, are referred to as current status data or case I interval-censored data in the literature. 1
In addition, in many of such studies, the test used for checking failure status (e.g. disease diagnosis) is imperfect and subject to error, which leads to inaccurate or misclassified failure (e.g. disease) status. For example, the Iowa Hygienic Laboratory collected urine specimens and screened for chlamydia and reported a sensitivity of 0.947 and a specificity of 0.989 for the Aptima Combo 2 Assay. 2 Similarly, viral disease antibody tests, such as those for HIV or HPV, may yield false-negative results if conducted shortly after infection. 3 In our motivating data from the study of Right from the Start (RFTS), pregnant women were given an ultrasound examination for testing the existence of fibroids. In a substudy of RFTS, the sonographers did not receive enough training and missed some fibroids due to inaccurate measuring.4,5 In all these situations, the failure status is misclassified and inaccurate, leading to misclassified current status data.3,6,7 This type data contribute additional ambiguity and complication to the conventional current status data and are thus more challenging to analyze. In this article, we study regression analysis of misclassified current status data, with the goal of estimating the covariate effects on the failure time as well as the survival functions for different subgroups.
There are numerous research works on regression analysis of current status data in the literature. Examples of existing works on univariate current status data include Huang 8 and McMahan et al. 9 based on the proportional hazards (PH) model, Rossini and Tsiatis 10 and Wang and Dunson 5 using the proportional odds (PO) model, Lin et al. 11 and Martinussen and Scheike 12 under the additive hazards (AH) model, Tian and Cai 13 under the accelerated failure time model, and Sun and Sun 14 and Lu et al. 15 under the linear transformation models, among many others. There are also many approaches developed for current status data with additional complications, including Lam and Xue 16 and Ma 17 considering a cured subgroup, Zhang et al. 18 and Ma et al. 19 on informative censoring, and Dunson and Dinse 20 and Chen et al. 21 on multiple failure times, among others. More recently, Yu et al. 22 proposed a sieve maximum likelihood approach based on Bernstein polynomials for informatively censored current status data, where the failure time and the correlated censoring time are assumed to follow jointly a Copula model and marginally linear transformation models, and Zhang et al. 23 proposed a graphical proportional hazards model with undirected Markov Random Field for left-truncated current status data subject to informative censoring. It is worth noting that most existing approaches for analyzing interval-censored data can be also used to analyze current status data since current status data are just a special case of general interval-censored data.
The research on misclassified current status data is relatively limited. McKeown and Jewell 3 was the first to study such data by proposing an adjusted pool-adjacent-violators algorithm for the nonparametric maximum likelihood estimate (NPMLE) in the case of known sensitivity and specificity and further extending their method to handle time-dependent sensitivity and specificity and regression analysis in the presence of covariates. Sal y Rosas and Hughes 24 proposed a modified iterative convex minorant (MICM) algorithm for the NPMLE in the one-sample problem, established a hypothesis test based on the MICM estimators for a two-sample problem, and developed an estimation approach for regression analysis of such data under the PH model. Wang and Dunson 5 developed a fully Bayesian approach for analyzing such data under the PO model and extended their approach to allow an unknown misclassification rate. More recently, Li et al. 6 studied regression analysis of such data with the linear transformation models, Fang et al. 25 under probit model, and Wang et al. 7 under the AH model, all producing some efficient expectation-maximization (EM) algorithms based on well-calibrated data augmentations. Under the AH model with time-dependent covariates, Li et al. 26 introduced a simulation-extrapolation (SIMEX) approach, in which they estimated parameters using simulated data with progressively amplified misclassification levels and then extrapolated the estimated results back to the case without misclassification. Except Wang and Dunson, 5 all the approaches in the aforementioned papers were developed under the assumption that the test accuracy is known.
In this article, we develop a computationally efficient estimation approach under the PO model. Although the work Li et al. 6 studied the same topic with the linear transformation model, which takes the PO model as a special case, their work approximates the unspecified baseline odds function with a piecewise constant function, which involves a large number of parameters and thus limits the computational efficiency. In contrast, we adopt monotone splines to approximate the baseline odds function with many fewer parameters, while providing adequate modeling flexibility. Our proposed method via an EM algorithm has great computational advantages, such as being robust to the initial values, fast to converge, easy to implement, and allowing simple and direct calculation of the variance estimate. Moreover, the proposed approach is extended to handle the cases where the test accuracy, such as the sensitivity and specificity, may be unknown. Both versions of the proposed method show excellent performance in our simulation studies, and they are further illustrated in a real application to uterine fibroid data, which motivated our study.
The rest of the paper is organized as follows. Section 2 introduces the data structure, observed likelihood, PO model, and monotone splines. Section 3 presents a data augmentation and the detailed derivation of our EM algorithm when the sensitivity and specificity of the test are known. Section 4 generalizes our method to the case of unknown sensitivity and specificity of the test. Section 5 evaluates and compares the proposed method with some existing methods in a simulation study, and Section 6 provides an illustration with fibroid data analysis. Section 7 gives some discussions.
Data, model, and likelihood
The observed data and likelihood
Consider a cross-sectional study, where each subject is only examined once. Let
In this article, we consider a general situation where neither the failure time
Suppose that there are

PO model and monotone splines
In this paper, we assume that the failure time follows the PO model motivated by its appealing properties. First, the PO model is a popular and flexible semiparametric model in the survival literature. It allows the baseline odds function to be completely unspecified. Second, the covariates have a proportional effect on the odds of failure at any specific time, and each regression parameter can be interpreted as the log odds ratio of failure due to 1 unit increase in the corresponding covariate while holding all others at fixed levels. This nice interpretation is well accepted by practitioners who are not familiar with survival analysis. Under the PO model, the survival function is
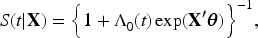
The baseline odds function
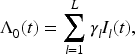
To construct the basis functions, one needs to specify the knots and the degree. The degree controls the overall smoothness of the basis functions, with 1 for linear, 2 for quadratic, and 3 for cubic functions. The knots and their placement largely determine the shapes of the basis functions. These basis functions are obtained based on an iterative algorithm once the knots and degree are specified.
27
The number of basis functions
It is well documented in the literature that the estimation performance of existing works based on monotone splines is generally robust to the number of knots and degree specified for the monotone splines, and such works include Ramsay, 27 Lin and Wang, 29 McMahan et al., 9 Wang et al., 30 and Wang and Wang 28 among others. Based on this phenomenon, one can simply use a small or moderate number of knots if an estimation procedure is time-consuming. In particular, Ramsay 27 recommended to use only a few knots, for example, use just one knot at the median or three knots at the three quartiles. We recommend to use degree 2 or 3 to ensure adequate smoothness of the target function. Following the recommended strategy in the literature9,31 among others, we suggest to implement our method multiple times with different spline specifications and then use some model selection criteria such as Akaike information criterion (AIC) or Bayesian information criterion (BIC) to determine the optimal specification for a particular data analysis. This strategy is illustrated in our data analysis in Section 6.
The proposed approach
Data augmentation
In this section, we focus on the situation where the sensitivity (

The first stage of our data augmentation takes advantage of the relationship between the observed status


In the second stage of our data augmentation, we introduce a latent variable
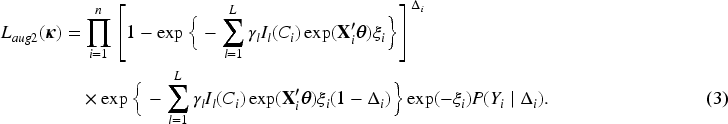
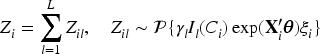
In the third stage, we introduce Poisson latent variables to further simplify the augmented likelihood (3). For subject

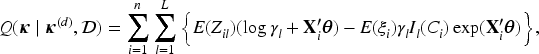
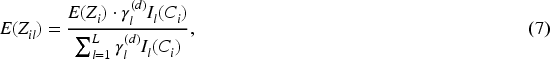
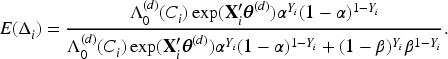
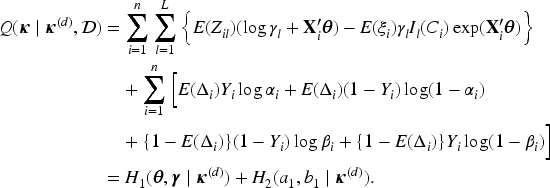
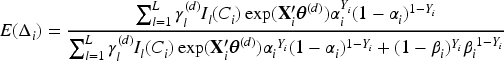
We now describe the detailed derivation of our EM algorithm. The E-step involves taking the expectation of


In the M-step, we obtain


Here is a summary of our proposed EM algorithm.
This EM algorithm has great computational features. First, this algorithm is easy to implement because it involves only solving a low-dimensional system of equations for the regression parameters, which can be done by using the Newton–Ralphson algorithm or an existing statistics package, and updating the spline coefficients in simple explicit forms at each iteration. Second, the EM algorithm is robust to the initial values and converges fast, resulting from the following facts: (a) the conditional expectations have simple closed forms, (b)
Let
In the section, we consider the regression problem in the case that the sensitivity and specificity of the imperfect test are unknown. Estimating these quantities is needed and possible when there are validation data or retesting data available.
Motivated by the motivating fibroid data, here we consider a general situation that involves two parts of data, one validation subset using a test with known sensitivity
Keeping the same notations as in Section 3, we further let
Let
Since

It is straightforward to show that
Let
Extensive simulations were conducted to evaluate the proposed method for misclassified current status data with known and unknown test accuracy. In the first simulation study, we evaluated our method when the sensitivity and specificity of the test are known. The survival time

In this simulation study, we implemented our method with known accuracy described in Section 3. For the monotone spline specifications, we took the order to be 3 and used 4 equally spaced knots within the minimum and maximum of the censoring times for each data set. The initial values of the regression parameters
For comparison purpose, we also implemented the approach of Li et al.
6
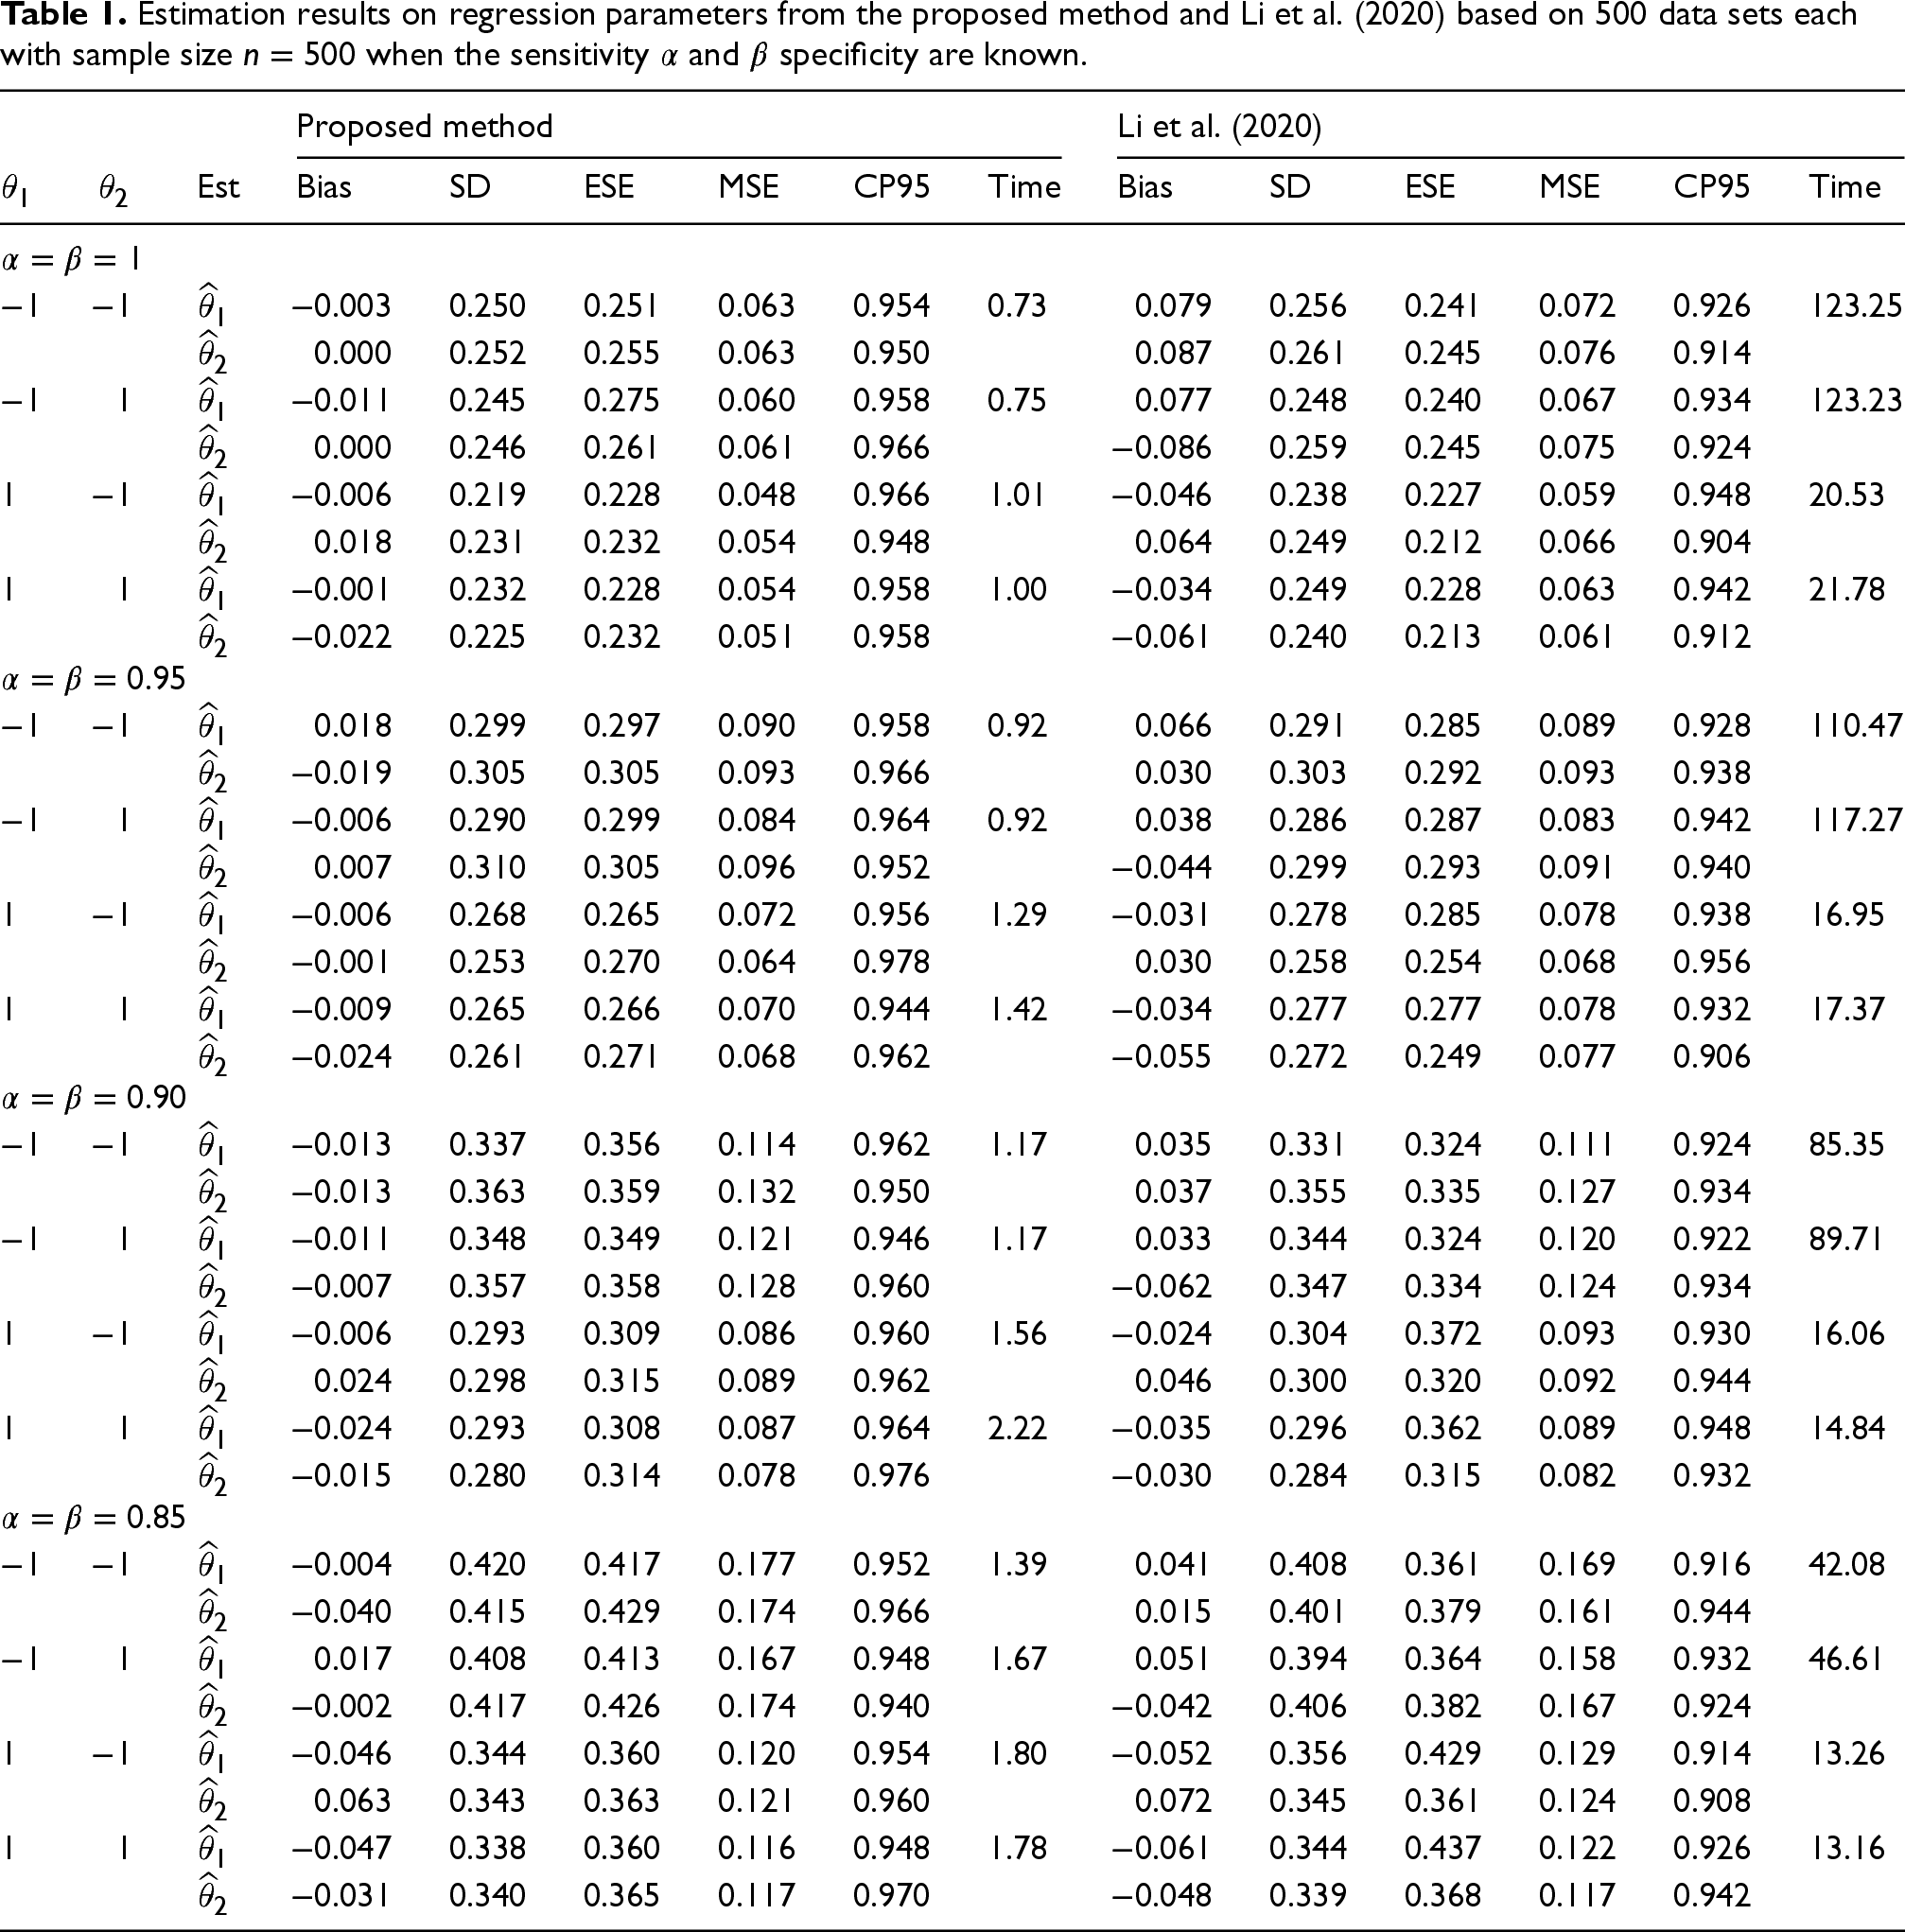
by running their R code on our simulated data. This comparison is reasonable as their approach is based on a general transformation model, which takes the PO model as a special case. Table 1 presents the simulation results from the two competing methods in the cases of
Estimation results on regression parameters from the proposed method and Li et al. (2020) based on 500 data sets each with sample size
when the sensitivity
and
specificity are known.
Estimation results on regression parameters from the proposed method and Li et al. (2020) based on 500 data sets each with sample size
As seen in Table 1, our proposed method yields substantially smaller bias than the approach of Li et al.
6
in all parameter configurations, while the latter produces a smaller MSE than the former in most configurations. However, careful investigation suggests that the ESEs from the approach of Li et al.
6
may actually underestimate the true standard errors because their ESEs are often smaller than their corresponding SDs and their resulting CP95s are substantially smaller than the nominal value 0.95, especially in the cases of
Our method is also producing good estimation results for the baseline cumulative distribution function (CDF)
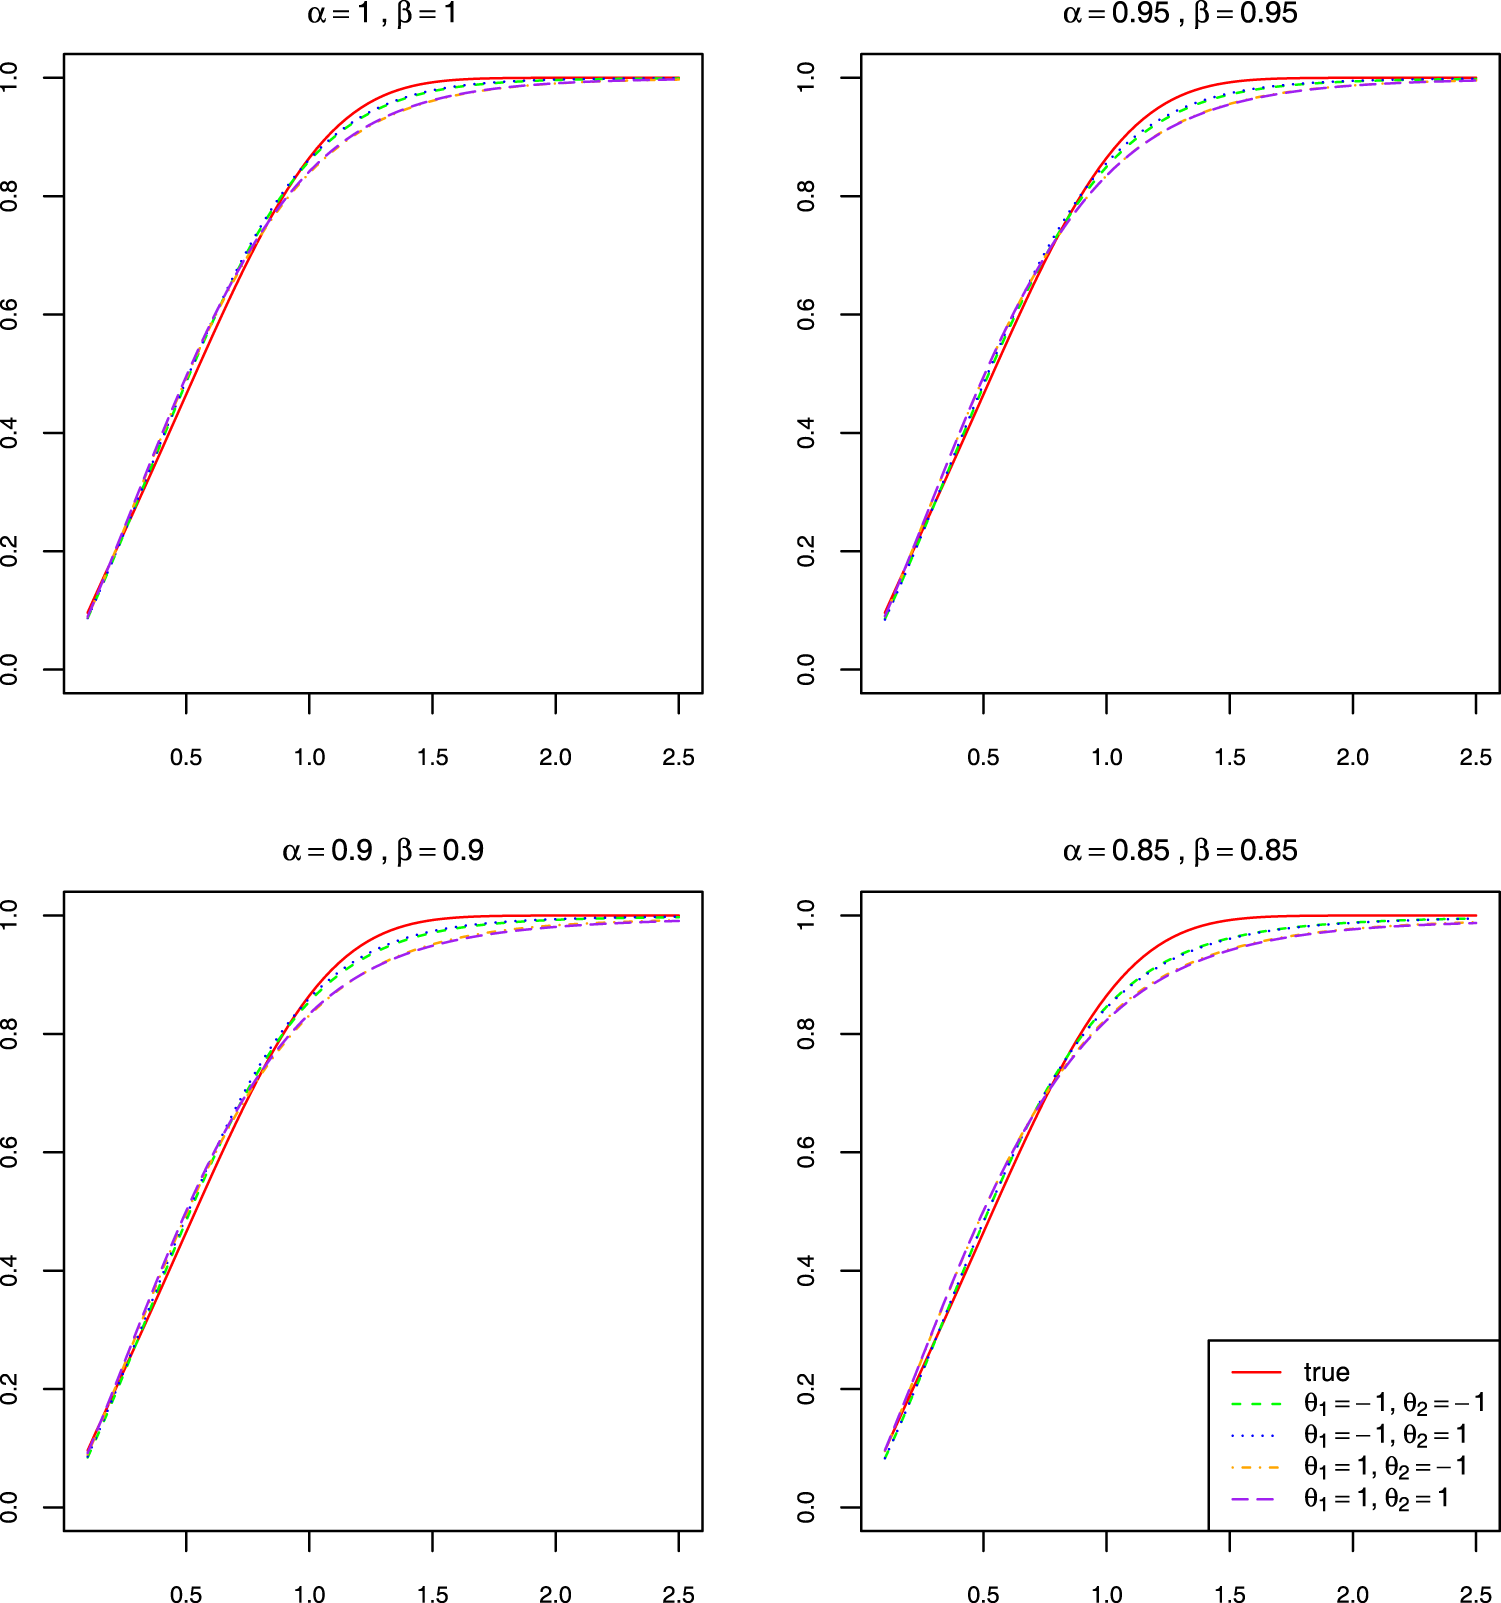
True and four estimated baseline cumulative distribution functions across different parameter configurations of
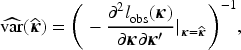
An additional simulation study was conducted to compare the adopted variance estimation method with Louis’ method
32
and a method based on outer product gradients,
33
and the comparison results presented in Section C.1 of the Supplementary file justify the validity and the efficiency the proposed method in obtaining the variance estimate of
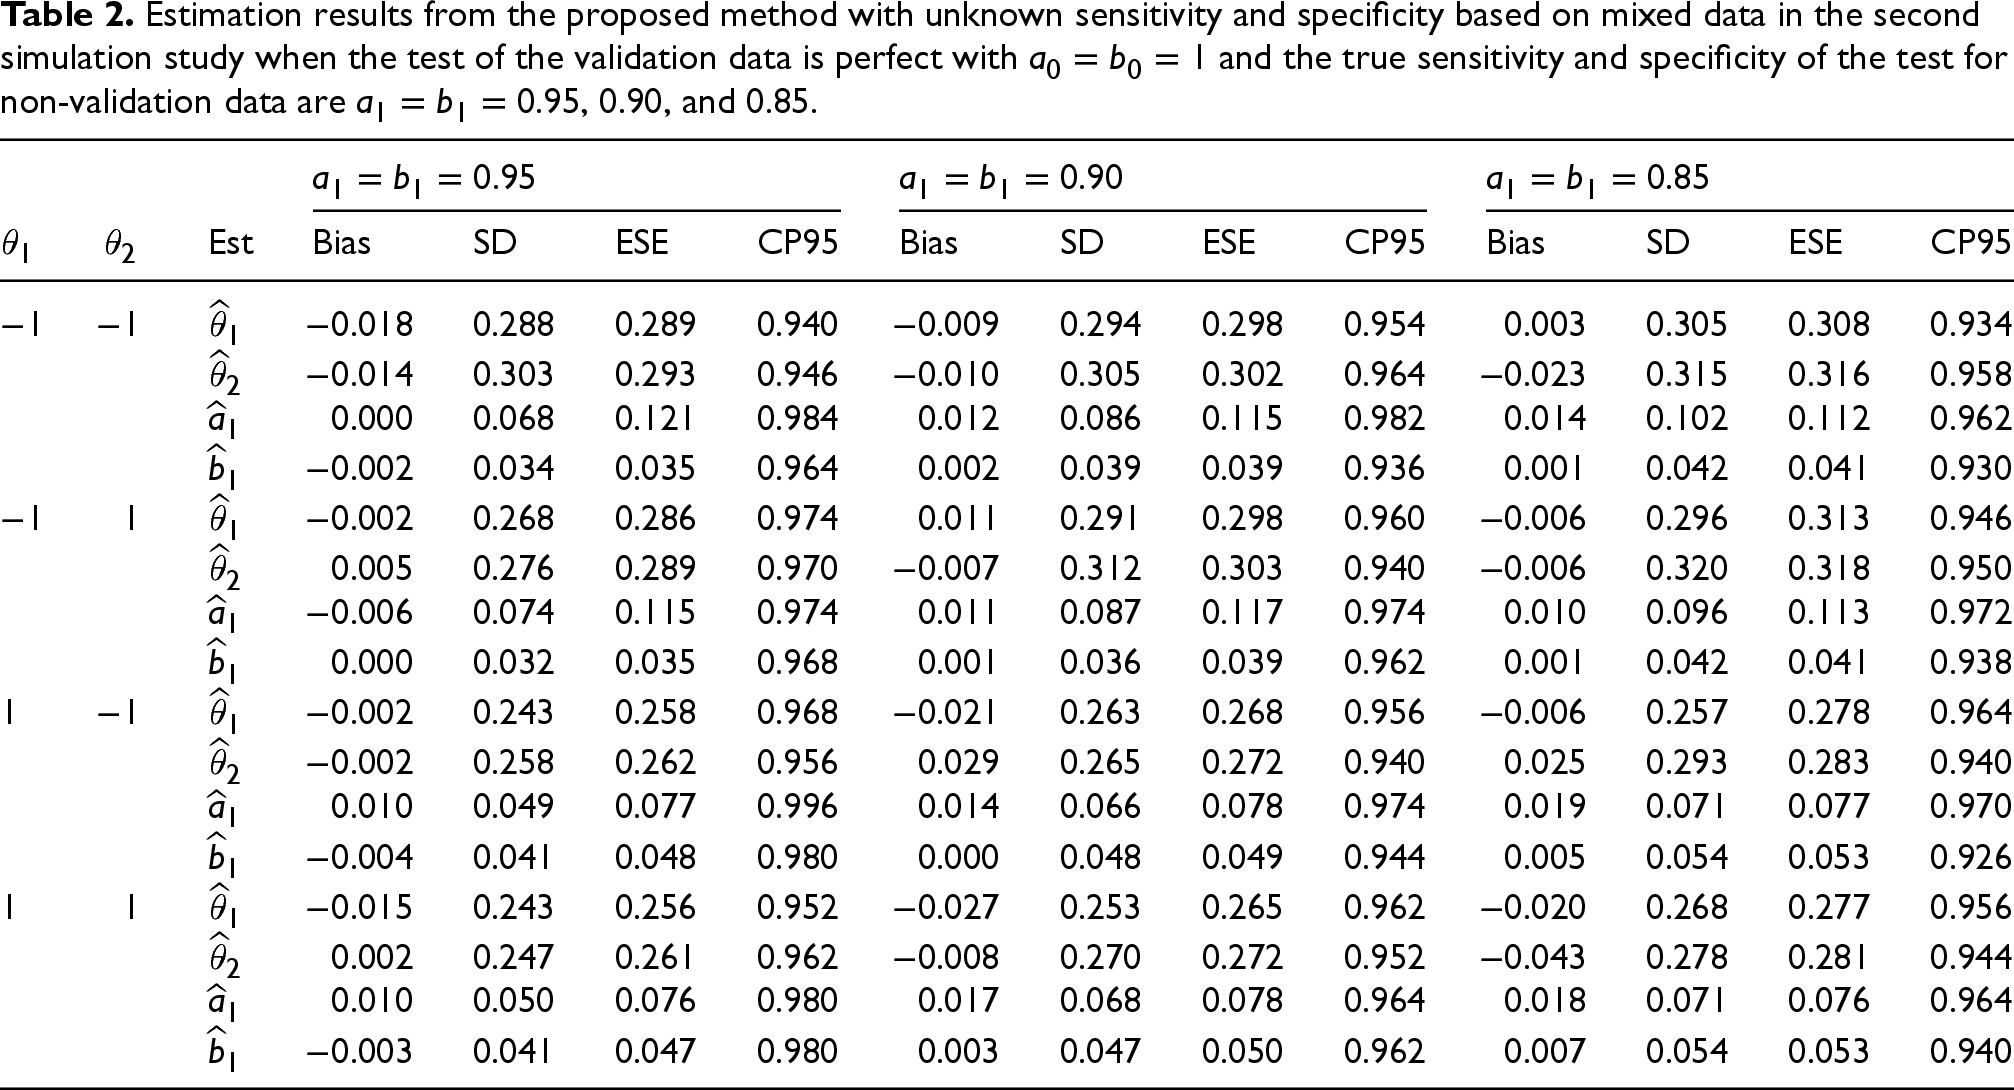
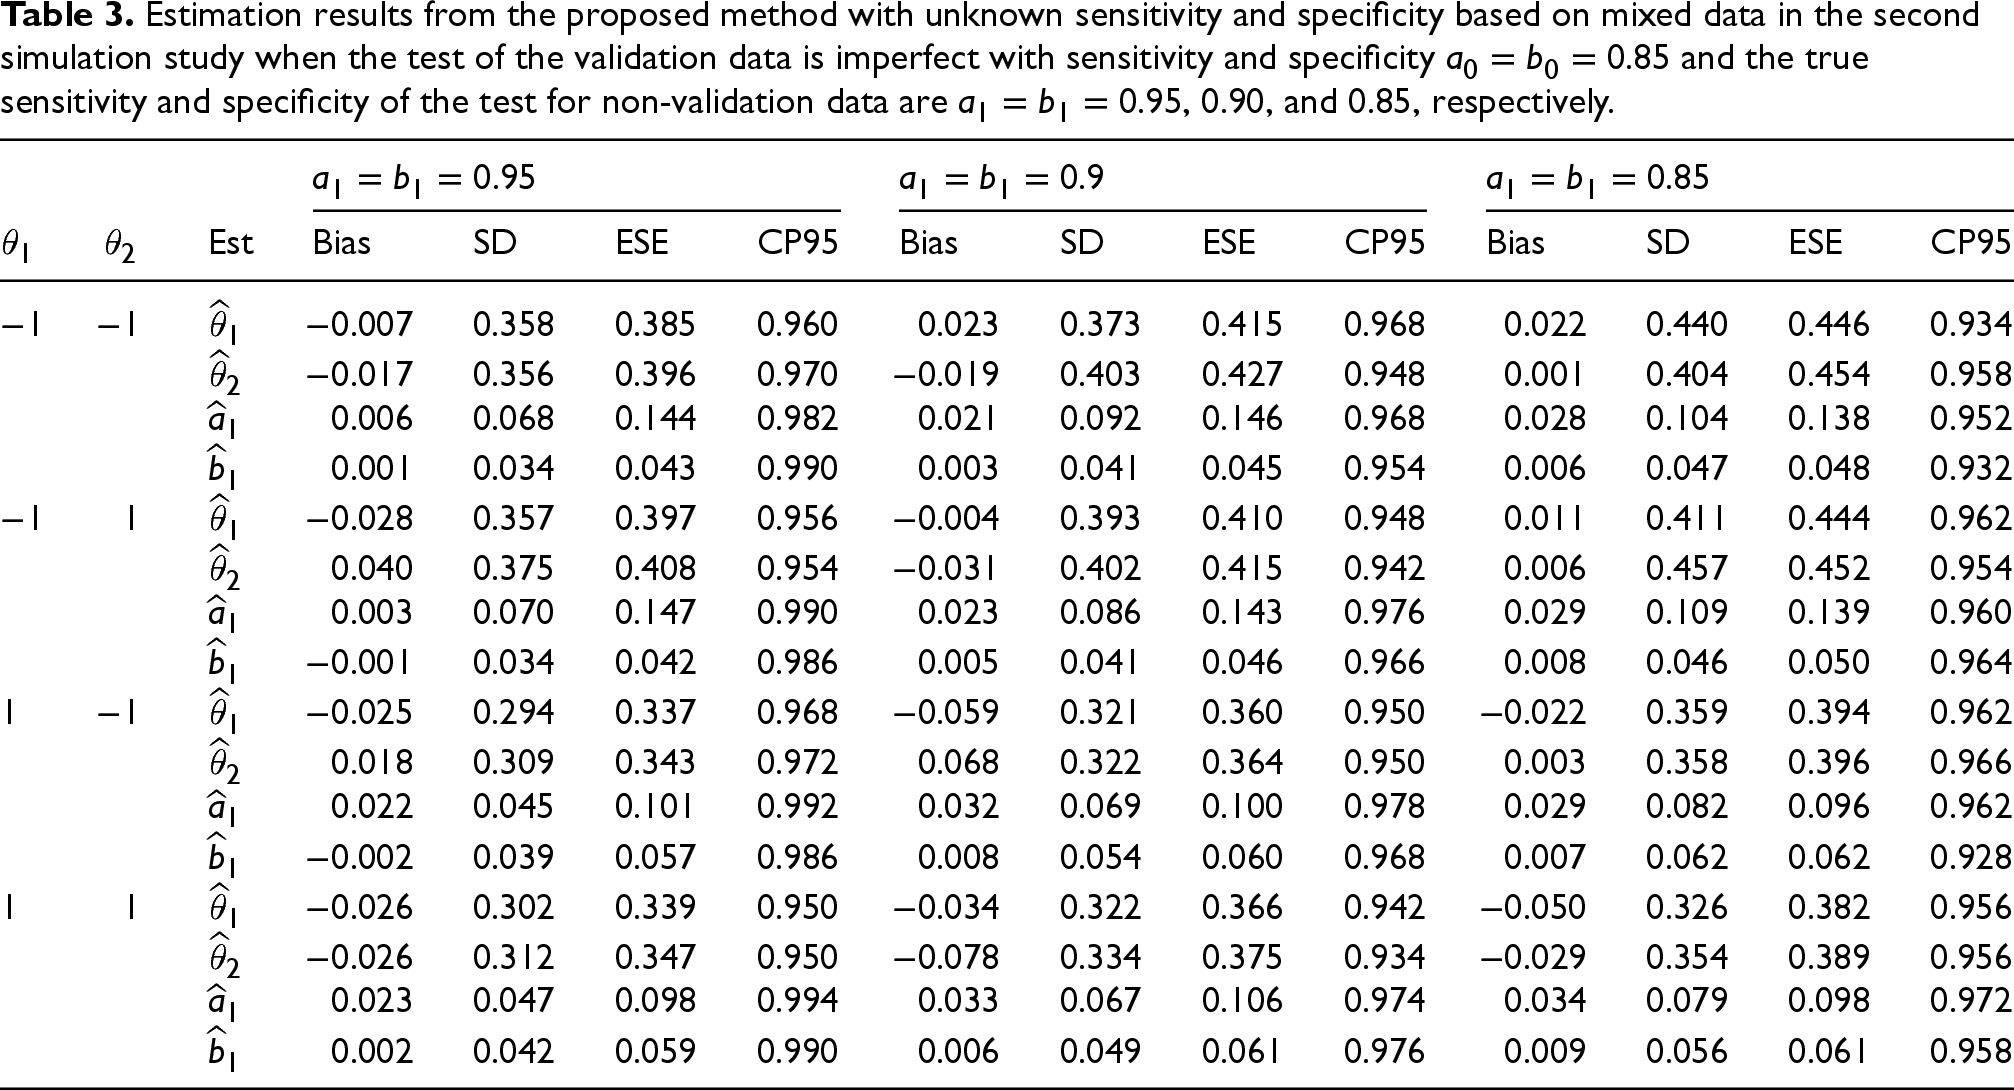
In the second simulation study, we evaluated the estimation performance of the proposed method when the test accuracy parameters were unknown. For this simulation, we considered mixed data, with one subset of validation data and the other set of non-validation data, for each dataset. Specifically, the validation data contained of 250 observations from a test with known sensitivity
Tables 2 and 3 present the estimation results based on the mixed data in the cases of
Estimation results from the proposed method with unknown sensitivity and specificity based on mixed data in the second simulation study when the test of the validation data is perfect with
Estimation results from the proposed method with unknown sensitivity and specificity based on mixed data in the second simulation study when the test of the validation data is imperfect with sensitivity and specificity
An additional simulation study was conducted to assess the importance of the validation data when estimating the test accuracy parameters. Tables C.3 and C.4 in the supplementary file show the estimation results when the test is perfect for the validation data and the proportion of validation data is 30% and 0% of the whole data, respectively. It is found that the estimation performance deteriorates as the proportion of the validation data decreases. In particular, when there are no validation data available, the estimation results are not satisfactory, with substantial bias, misaligned SD and ESE, and/or low coverage probability, for the regression parameters and the test accuracy parameters in some configurations of Table C.4. This suggests that one cannot estimate the test accuracy parameters accurately without the validation data, especially when the test accuracy is low. This makes sense as the test accuracy usually depends only on the used technology or the features of the test itself.
RFTS was a multi-center cohort study of early pregnancy conducted in North Carolina, Tennessee, and Texas initiated in 2001. Enrollment criteria required young women participants to be at least 18 years, enroll by 12 6/7 weeks of gestation based on the last menstrual period, not use assisted reproductive technology, intend to carry the pregnancy to term, speak English or Spanish, and not plan to move for the next 18 months in the literature. 4 Our data contain 4496 women during the period 2001−2007, and they all completed an endovaginal ultrasound examination during their pregnancy. In the ultrasound examination, each identified leiomyoma was measured three times, and its maximum size was recorded. 4 A woman was classified as fibroid positive if she had any detected leiomyoma greater than 5 millimeters. This study involved 3 separately funded sub-studies, RFTS 1, 2, and 3. It was reported that the ultrasonographers in RFTS 1 did not receive adequate training and likely missed some fibroids, leading to an under-reporting problem.4,5 The under-reporting problem only occurred in RFTS 1 and not in the other two sub-studies.
In our analysis, the response variable is taken to be the onset time of fibroid, and we are interested in estimating the covariate effects on the onset time as well as the survival functions of the onset times for different subgroups. Four covariates are considered in this analysis: race (White or Black), parity status (whether a participant has given birth before), age of menarche (when a participant had her first period), and obesity status (measured by body mass index greater than 30). In the data, the onset time of fibroid was never observed for any participant. However, the fibroid status, whether there was at least one fibroid detected at the ultrasound examination, was recorded, and this indicates that the fibroid onset time is either left- or right-censored at the examination time. Due to the under-reporting problem, the fibroid status was subject to mis-specification in the first sub-study, leading to misclassified current status data for the fibroid onset time. The accuracy of the test/diagnosis is unknown and needs to be estimated in this analysis.
Let
Let 
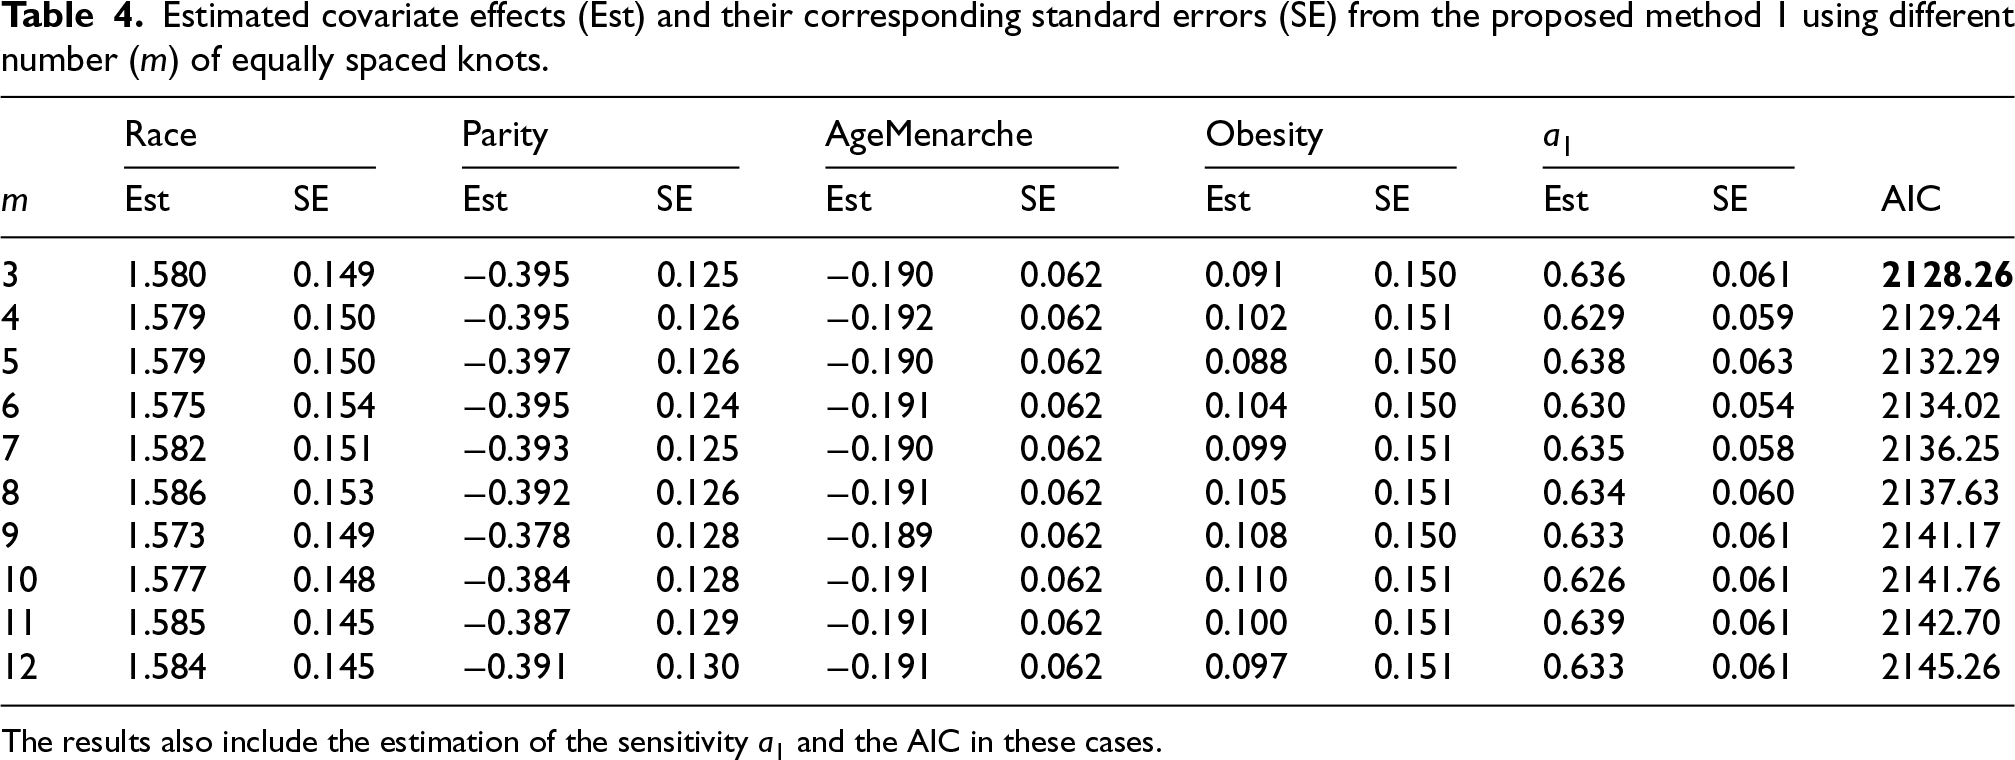
Table 4 presents the estimated regression and sensitivity parameters (Est) and their corresponding standard errors (SE) as well as the AIC from the proposed method using different number
Estimated covariate effects (Est) and their corresponding standard errors (SE) from the proposed method 1 using different number (m) of equally spaced knots.
Estimated covariate effects (Est) and their corresponding standard errors (SE) from the proposed method 1 using different number (m) of equally spaced knots.
The results also include the estimation of the sensitivity
Table 5 presents the estimation results from the proposed method with the optimal spline specification together with the results from two competing approaches: Wang and Dunson
5
and McMahan et al.,
9
using the same spline specification under the PO model. Wang and Dunson
5
accounted for the under-reporting problem in the data analysis but from a Bayesian perspective. The approach of McMahan et al.
9
is based on an EM algorithm for analyzing conventional current status data under the PO model but cannot be used to analyze misclassified current status data. Here the results from McMahan et al.
9
were actually obtained based on the data in RFTS 2 only, where there were no misclassifications. That approach is equivalent to the proposed method with both sensitivity and specificity equal to
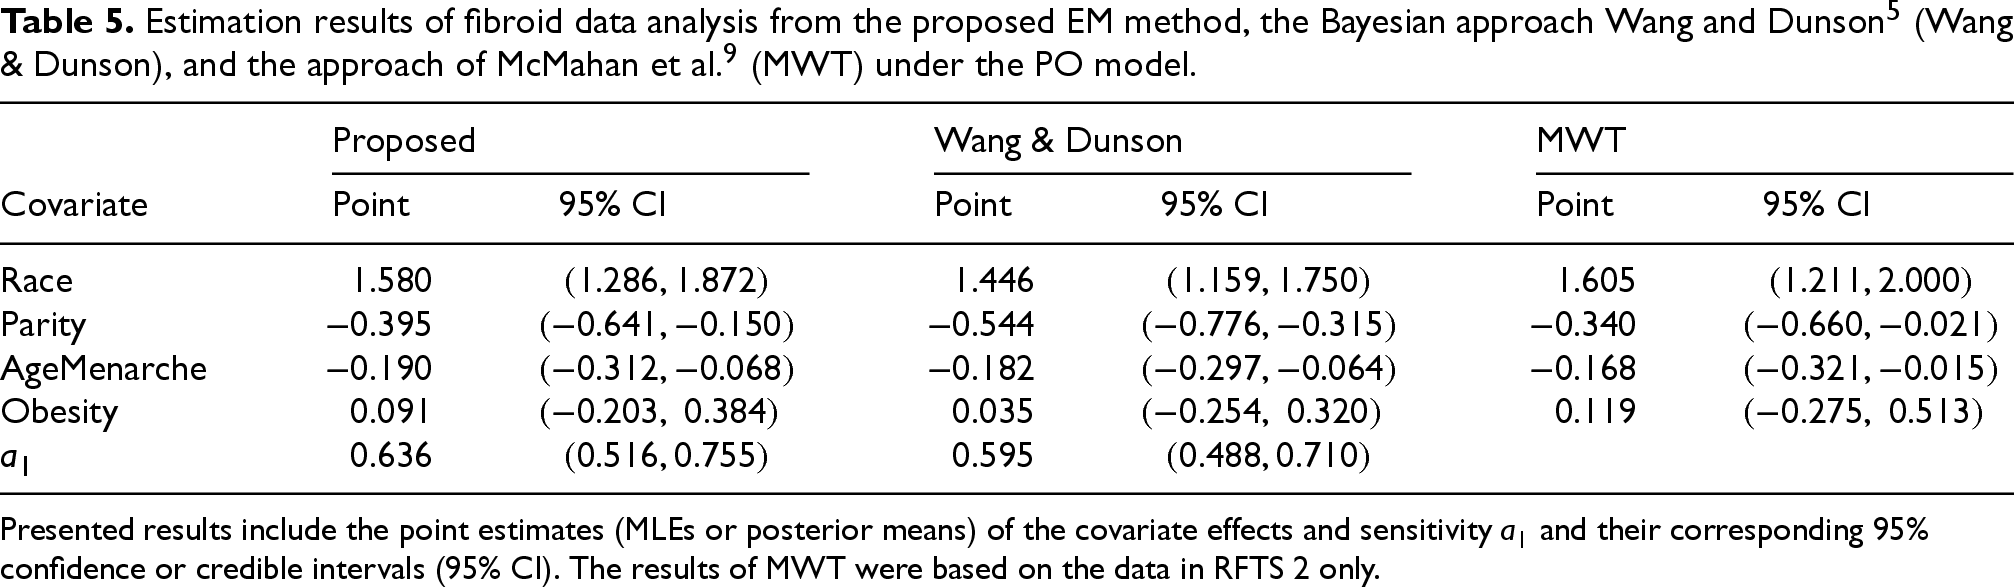
Presented results include the point estimates (MLEs or posterior means) of the covariate effects and sensitivity
As seen in Table 5, these three competing methods yield comparable estimation results and lead to the same conclusions. Three covariates, race, parity, and age of menarche, have a significant effect on the development of fibroids, while obesity does not. To be specific, black women have a higher risk of developing uterine fibroids than white women races, and the odds of developing fibroids for black women is about
Figure 2 plots the estimated cumulative incidence functions together with their 95% pointwise confidence bands for black and white women who had their menarche at 12.6 years old, never gave birth before, and were non-obese (i.e. with
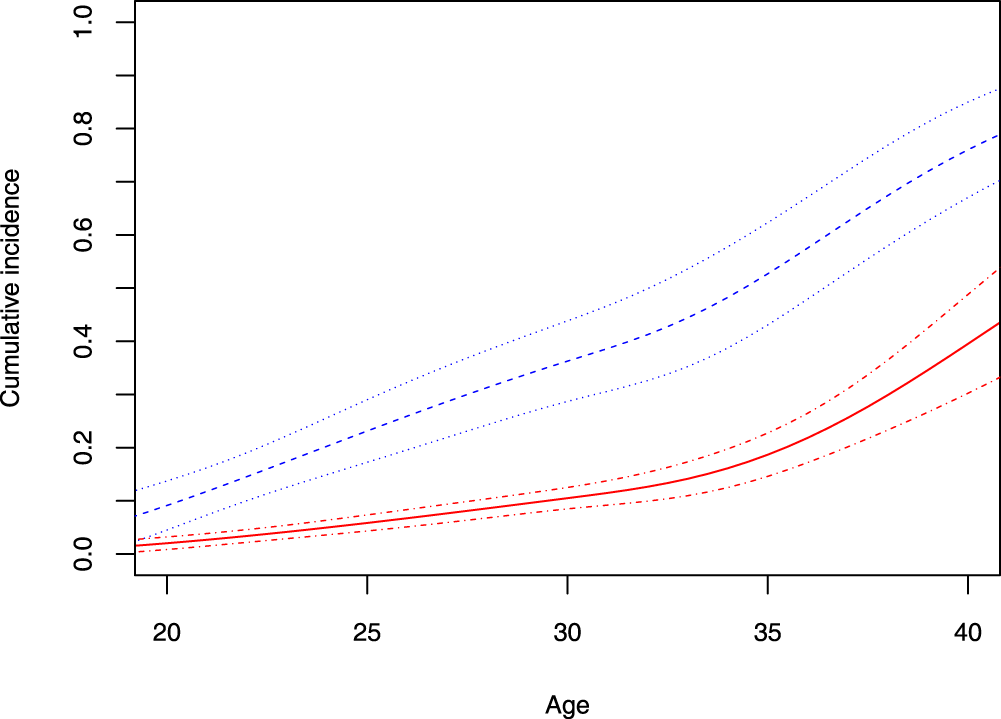
Estimates of the cumulative incidence of fibroids as well as their 95% Wald confidence interval bands for African American women (dashed) and for white women (solid) who had their menarche at 12.6 years old, never gave birth before, and were non-obese.
This paper proposes a new estimation approach for analyzing misclassified current status data under the popular PO model. Specifically, the adoption of monotone splines for the baseline odds function significantly reduces the number of parameters while maintaining adequate flexibility. A computationally efficient EM algorithm is developed based on a novel data augmentation with Exponential and Poisson latent variables. Our EM algorithm is shown to be robust to the initial values, easy to implement, and converges fast. Our method is further extended to allow unknown sensitivity and specificity of the test or diagnosis when there are additional validation data available, for which the associated test accuracy is known. The proposed method can accommodate the scenarios that the test for the validation data is either perfect or imperfect, making it more practical for real life testing data. The proposed method has demonstrated excellent estimation performance in the both cases of known and unknown test accuracy in our simulation. A real application to uterine fibroid data is used to illustrate the proposed method in different scenarios. The R code for the proposed method is available upon request.
One potential limitation of our method is to require the existence of validation data when the test accuracy is unknown. When there are no validation data, as reported in Table C.4 of the Supplementary file, the estimation performance is not good, especially when the test accuracy is low. Another potential limitation is that the method may rely heavily on the PO model assumption, and developing an appropriate model diagnosis based on our method is an important and much needed work in order to further promote the proposed method.
Future research effort will be devoted to extending the proposed method to more flexible semiparametric survival models, such as the generalized odds rate hazards model 34 and the linear transformation models, for analyzing misclassified current status data, with known or unknown test accuracy. Another direction of our future research is to extend our approach to regression analysis of misclassified multivariate current status data.
Supplemental Material
sj-pdf-1-smm-10.1177_09622802261456076 - Supplemental material for Regression analysis of misclassified current status data with potentially unknown test accuracy
Supplemental material, sj-pdf-1-smm-10.1177_09622802261456076 for Regression analysis of misclassified current status data with potentially unknown test accuracy by Zhixin Chen and Lianming Wang in Statistical Methods in Medical Research
Footnotes
Acknowledgments
The authors would like to thank the Associate Editor and three anonymous reviewers for their insightful and constructive comments that have greatly improved the quality of the manuscript.
Funding
The authors received no financial support for the research, authorship, and/or publication of this article.
Declaration of conflicting interests
The authors declared no potential conflicts of interest with respect to the research, authorship, and/or publication of this article.
Supplemental material
Supplemental material for this article is available online.
References
Supplementary Material
Please find the following supplemental material available below.
For Open Access articles published under a Creative Commons License, all supplemental material carries the same license as the article it is associated with.
For non-Open Access articles published, all supplemental material carries a non-exclusive license, and permission requests for re-use of supplemental material or any part of supplemental material shall be sent directly to the copyright owner as specified in the copyright notice associated with the article.