
Abstract
Near infrared spectra of honeys are affected by sample temperature variation, mainly due to a change in hydrogen bonding of water. The aim of this study was to develop robust and powerful calibration models which can compensate for a variation of sample temperature for the determination of moisture and reducing sugar content in honey using near infrared spectroscopy. Partial least squares regression with the aid of standard normal variate transformation was used to develop three calibration models at constant temperature (25, 35 and 45℃) and a robust calibration model with temperature compensation. All the developed models for moisture and reducing sugar content showed high performance of prediction with coefficient of determination (r2) and residual prediction deviation values greater than 0.95 and 3.8, respectively. The results show that the temperature compensation model can be considered as a robust calibration model for near infrared determination of moisture and reducing sugar in the honey when sample temperature is varied.
Keywords
Introduction
Honey is a viscous, aromatic, sweet food that consists mainly of sugars (80–85%), water (15–21%), and other substances such as proteins, organic acids, vitamins, minerals, pigments, phenolic compounds, a large variety of volatile compounds, and solid particles derived from honey harvesting. Monosaccharides represent about 75% of the sugars found in honey, along with 10–15% disaccharides and small amounts of other sugars. 1 Generally, the sugars and water content present in honeys depend mainly on the botanical origin of the honey, the level of maturity achieved in the hive, the processing techniques and storage conditions. 2 The purpose of laws regarding honey is to ensure the identity and minimum quality requirements for honey. The amount of sugars and water are very important indicators in evaluating the maturity of honey. Moisture content of honey is a limiting factor in the determination of its physical properties (viscosity and crystallisation, specific gravity, solubility and conservation), sensory properties (colour, flavour and taste) and spoilage resistance against yeast fermentation. 3 The higher the moisture content, the higher is the probability of undesirable honey fermentation during storage caused by the action of osmotolerant yeasts. 4
Almost all standard analytical techniques for determining the chemical constituents of honey are time consuming, expensive, and they require specialised knowledge and expertise and involve laborious counting procedure. To achieve a high quality standard for honey, it is necessary to develop an alternative method that is simple, fast and reliable. Near infrared (NIR) spectroscopy, a type of vibrational spectroscopy, is a useful analytical technique for measuring quality parameters in various food, agricultural products, pharmaceutical tablets, a variety of chemicals and polymers. The principal advantages of NIR spectroscopy include its speed of analysis, little or no sample preparation, nondestructive analysis and in-line and online applications.
Several studies have been carried out using NIR spectroscopy in combination with chemometric techniques (such as partial least square (PLS) regression) to identify and evaluate honey samples from different continents worldwide. These studies reported the prediction of chemical and physical parameters, such as sugars, moisture, hydroxymethylfurfural (HMF), electrical conductivity, pH, free acidity or proline,5,6 and discriminated honey samples based on the geographical origin, 7 floral origin 8 and adulteration. 9
Nevertheless, little has been known about the effect of temperature variation on NIR spectra of honey and the performance of NIR calibration models. It is well known that NIR spectra are affected by sample temperature, especially in the case of aqueous samples. Vibrational spectra are concerned not only with primary molecular features such as molecular structure, but also with intermolecular features such as hydrogen bonding. These weaker forces influence chemical bonds, and therefore, their vibration modes, themselves, are affected by conditions such as temperature and liquid pressure. 10 The effect of sample temperature variation on NIR spectra of pure compounds has been studied well,11,12 whereas for complex matrices, such as wine and apple, only few studies have been reported.13–15
For example, Cozzolino et al. 15 investigated the effect of temperature on NIR spectra of red wine. They found that the main changes in the NIR spectra of the wine samples relating to temperature were observed in the vicinity of 970 and 1400 nm (H–O–H vibrations due to water). Furthermore, several research groups proposed methods for compensating for temperature-induced effects.13,14 For example, Kawano and Abe 13 developed a multiple linear regression (MLR) model with temperature compensation using samples in a temperature range from 21 to 31℃ for determining the brix value in intact peaches. They reported that water was an important factor causing a bias when the sample temperature varied. The temperature compensation calibration models showed a high accuracy in prediction (R2 = 0.92, SEC = 0.41°Brix, SEP = 0.42 °Brix), even if the sample temperature changed in the above range. Liang et al. 16 developed a temperature compensation model based on back propagation neural network (BPNN) for the determination of moisture content in soil. They found that the temperature compensation model was less influenced by the temperature of the sample and had an RMSEP of 0.27%. Peries et al. 14 presented temperature compensation for NIR reflectance measurements of apple fruit soluble solids contents. They reported that when comparing the temperature-specific PLS calibration models, the compensation PLS models based on all temperatures yielded more accurate results. In addition, Watari and Ozaki 17 proposed a new temperature compensation method for prediction of ethylene content in melt-state random and block polypropylene by NIR spectroscopy that uses the difference spectra between two spectra sets measured at different temperatures. They found that multiplicative signal correction (MSC) method is effective for the compensation model using PLS regression.
In routine use, the main drawback of a calibration model of honey using the NIR method is the lack of robustness due to sample temperature variation. From a practical point of view, there is a strong need to develop a calibration model of honey whose accuracy is affected little by sample temperature since in practice it is not easy to maintain honey at a constant temperature. Therefore, the main objectives of this study were (1) to investigate the effect of sample temperature variation on the NIR spectra of longan honeys, and (2) to evaluate the performance of NIR calibration models with and without temperature compensation for the measurement of moisture and reducing sugar content in the longan honeys.
Materials and methods
Sample preparation
A total of 35 authentic longan honey samples produced between 2011 and 2012 were purchased from local grocery stores in Chiang Mai, Thailand. Five of these authentic honey samples were randomly selected and adulterated with each of the sugar syrups (fructose, glucose and sucrose syrups) at five levels i.e. 5, 10, 15, 20 and 25%w/w, and thus we obtained 75 adulterated honey samples. The samples (n = 105) were stored in the dark at 25℃ in plastic jars. Prior to chemical analysis and spectroscopic analyses, the honeys were incubated at 50℃ for 1 h in a water bath and then allowed to cool to room temperature. This heat treatment was necessary to dissolve sugar crystals which might be present in honey. 18
NIR spectral acquisition
All honey samples were divided into three groups and subsequently incubated in a water bath at three different temperatures (25, 35 and 45℃). Samples from each group were scanned using a NIR spectrometer (Spectra Star™ 2500, Unity Scientific, Milford, MA, USA) and a 0.2 mm Dutch cup. Approximately 1.0 g of liquefied honey was poured into the centre area of Dutch cup and excess honey was then removed before the spectral analysis. Thirty-two scans with a resolution of 1 nm were recorded in a transflection mode for each spectrum in the wavelength region of 1100–2500 nm. The spectral acquisition and instrument control were performed using the Info star software (version 3.10.0: Unity Scientific, USA). Between measurements, this cell was washed with detergent, rinsed thoroughly with tepid water and dried using lens tissue.
Chemical analysis
After NIR spectroscopy analysis, moisture content and apparent reducing sugars of honey samples were determined following AOAC Official Method. 19 Briefly, moisture content was determined with a refractometer (RX-5000a, ATAGO CO., Ltd., Tokyo, Japan), reading at 20℃, using the Wedmore table. The content of apparent reducing sugars was determined by Lane-Eynon method. All analyses were performed in triplicate.
Spectral data analysis
To investigate the influence of temperature on the quantitative analysis models, three calibration models without temperature compensation developed separately using NIR spectra measured at 25, 35 and 45℃ were compared with a temperature compensation model (full data containing all temperatures). For developing the calibration models without temperature compensation, samples of each temperature were randomly selected and divided into a calibration set (85 samples) and a prediction set (20 samples). In addition, the temperature compensation calibration models were constructed with 85 samples of each temperature, whereas their prediction set consisted of the remaining 60 samples (20 samples of each temperature).
The calibration models were developed using the Unscrambler software (version 9.2: CAMO AS, Trondheim, Norway) by PLS regression. A full cross-validation was performed to test calibrations and select the number of PLS factors to included, while avoiding over-fitting. 20 To improve the calibration models, it was necessary to remove scattering effects from the raw spectra caused by the diversity of the particle size in the samples. In this study, standard normal variate (SNV) transformation was used to process the raw spectral data prior to developing calibration models. SNV is one of spectral pretreatment methods applied for removing baseline shifts, slope changes and curvilinearity of spectra, reducing the influence of particle size and scattering. 21 The SNV transformation centres each spectrum and then scales it by its own standard deviation, correcting shifts in the y-axis. 22
The quality of the calibration models was quantified by root mean square error of cross-validation (RMSECV), root mean square error of prediction (RMSEP), residual prediction deviation (RPD) and prediction coefficient determination (r2) between the predicted and measured parameters. The RPD shows the ratio between the standard deviation of the original reference data to the root mean square error of prediction (RPD = SD/RMSEP). This ratio is desired to be larger than 2 for a good calibration. A RPD ratio less than 1.5 indicates poor predictions and the model cannot be used for further prediction. 23 A good model should have a low RMSECV, a low RMSEP, a high correlation coefficient but also a small difference between RMSECV and RMSEP.
Results and discussion
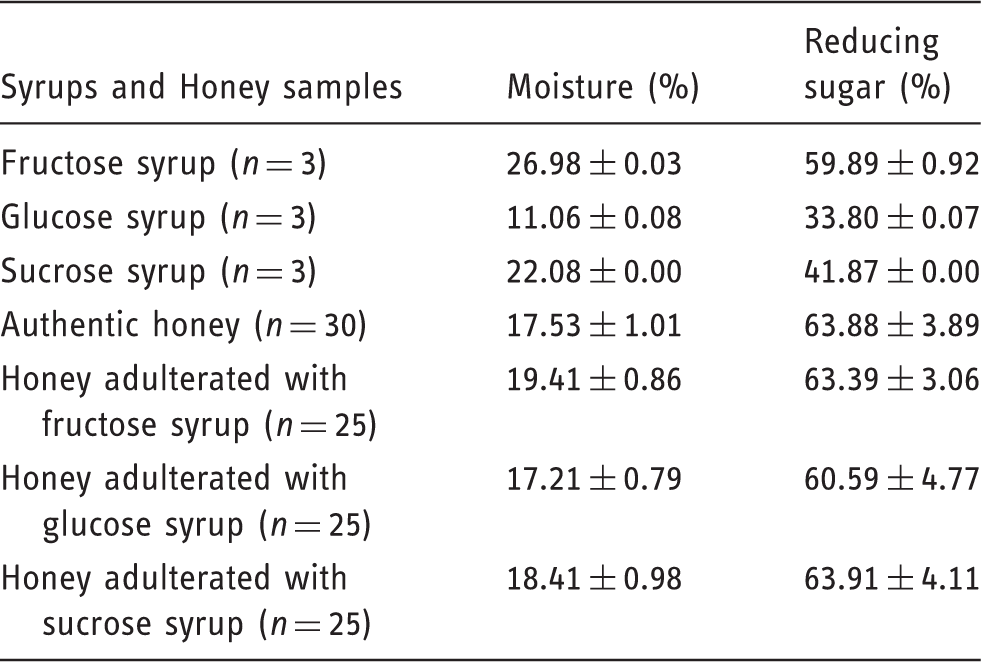
Moisture and reducing sugar content
Average contents of moisture and reducing sugar in syrups used to adulterate honey samples, authentic honeys, and adulterated honeys.
Effect of sample temperature variation on the NIR spectra
Figure 1 shows NIR spectra of the same honey sample measured at different temperatures of 25, 35 and 45℃. The trend of the spectral curves is quite similar. Due to light scattering or a concentration variation, small baseline offsets and bias are presented. The NIR spectra of the honey sample are dominated by water absorption bands at 1460 (combination of the symmetric and antisymmetric stretching modes of H2O) and 1940 nm (combination of stretching mode and deformation mode of H2O).
15
The band at 1770 nm is assigned to first overtones of stretching modes of CH3 and CH2 groups, whereas a band at 2100 nm is the combination of O–H deformation mode and C–O stretching mode.
26
Bands in the region of 2200–2300 nm are due to C–H combination mode characteristic of sugar. A band at 2460 nm is assigned to the combination of the C–H and C–C stretchings of starch and sugar.
22
Downey et al.
27
reported that NIR transflectance spectra of fructose and glucose aqueous solutions show absorbance peaks around 1460, 1935, 2095 and 2280 nm which coincide roughly with the peaks observed in the NIR spectra of honey in this study. The characteristics of absorption peaks are similar to those of honey reported by others.23,26,28 The band assignments for the spectra of honey are summarised in Table 2.
NIR spectra of the same honey sample at different temperatures of 25, 35 and 45℃. Wavelength and assignments of band in the NIR spectra of honey samples.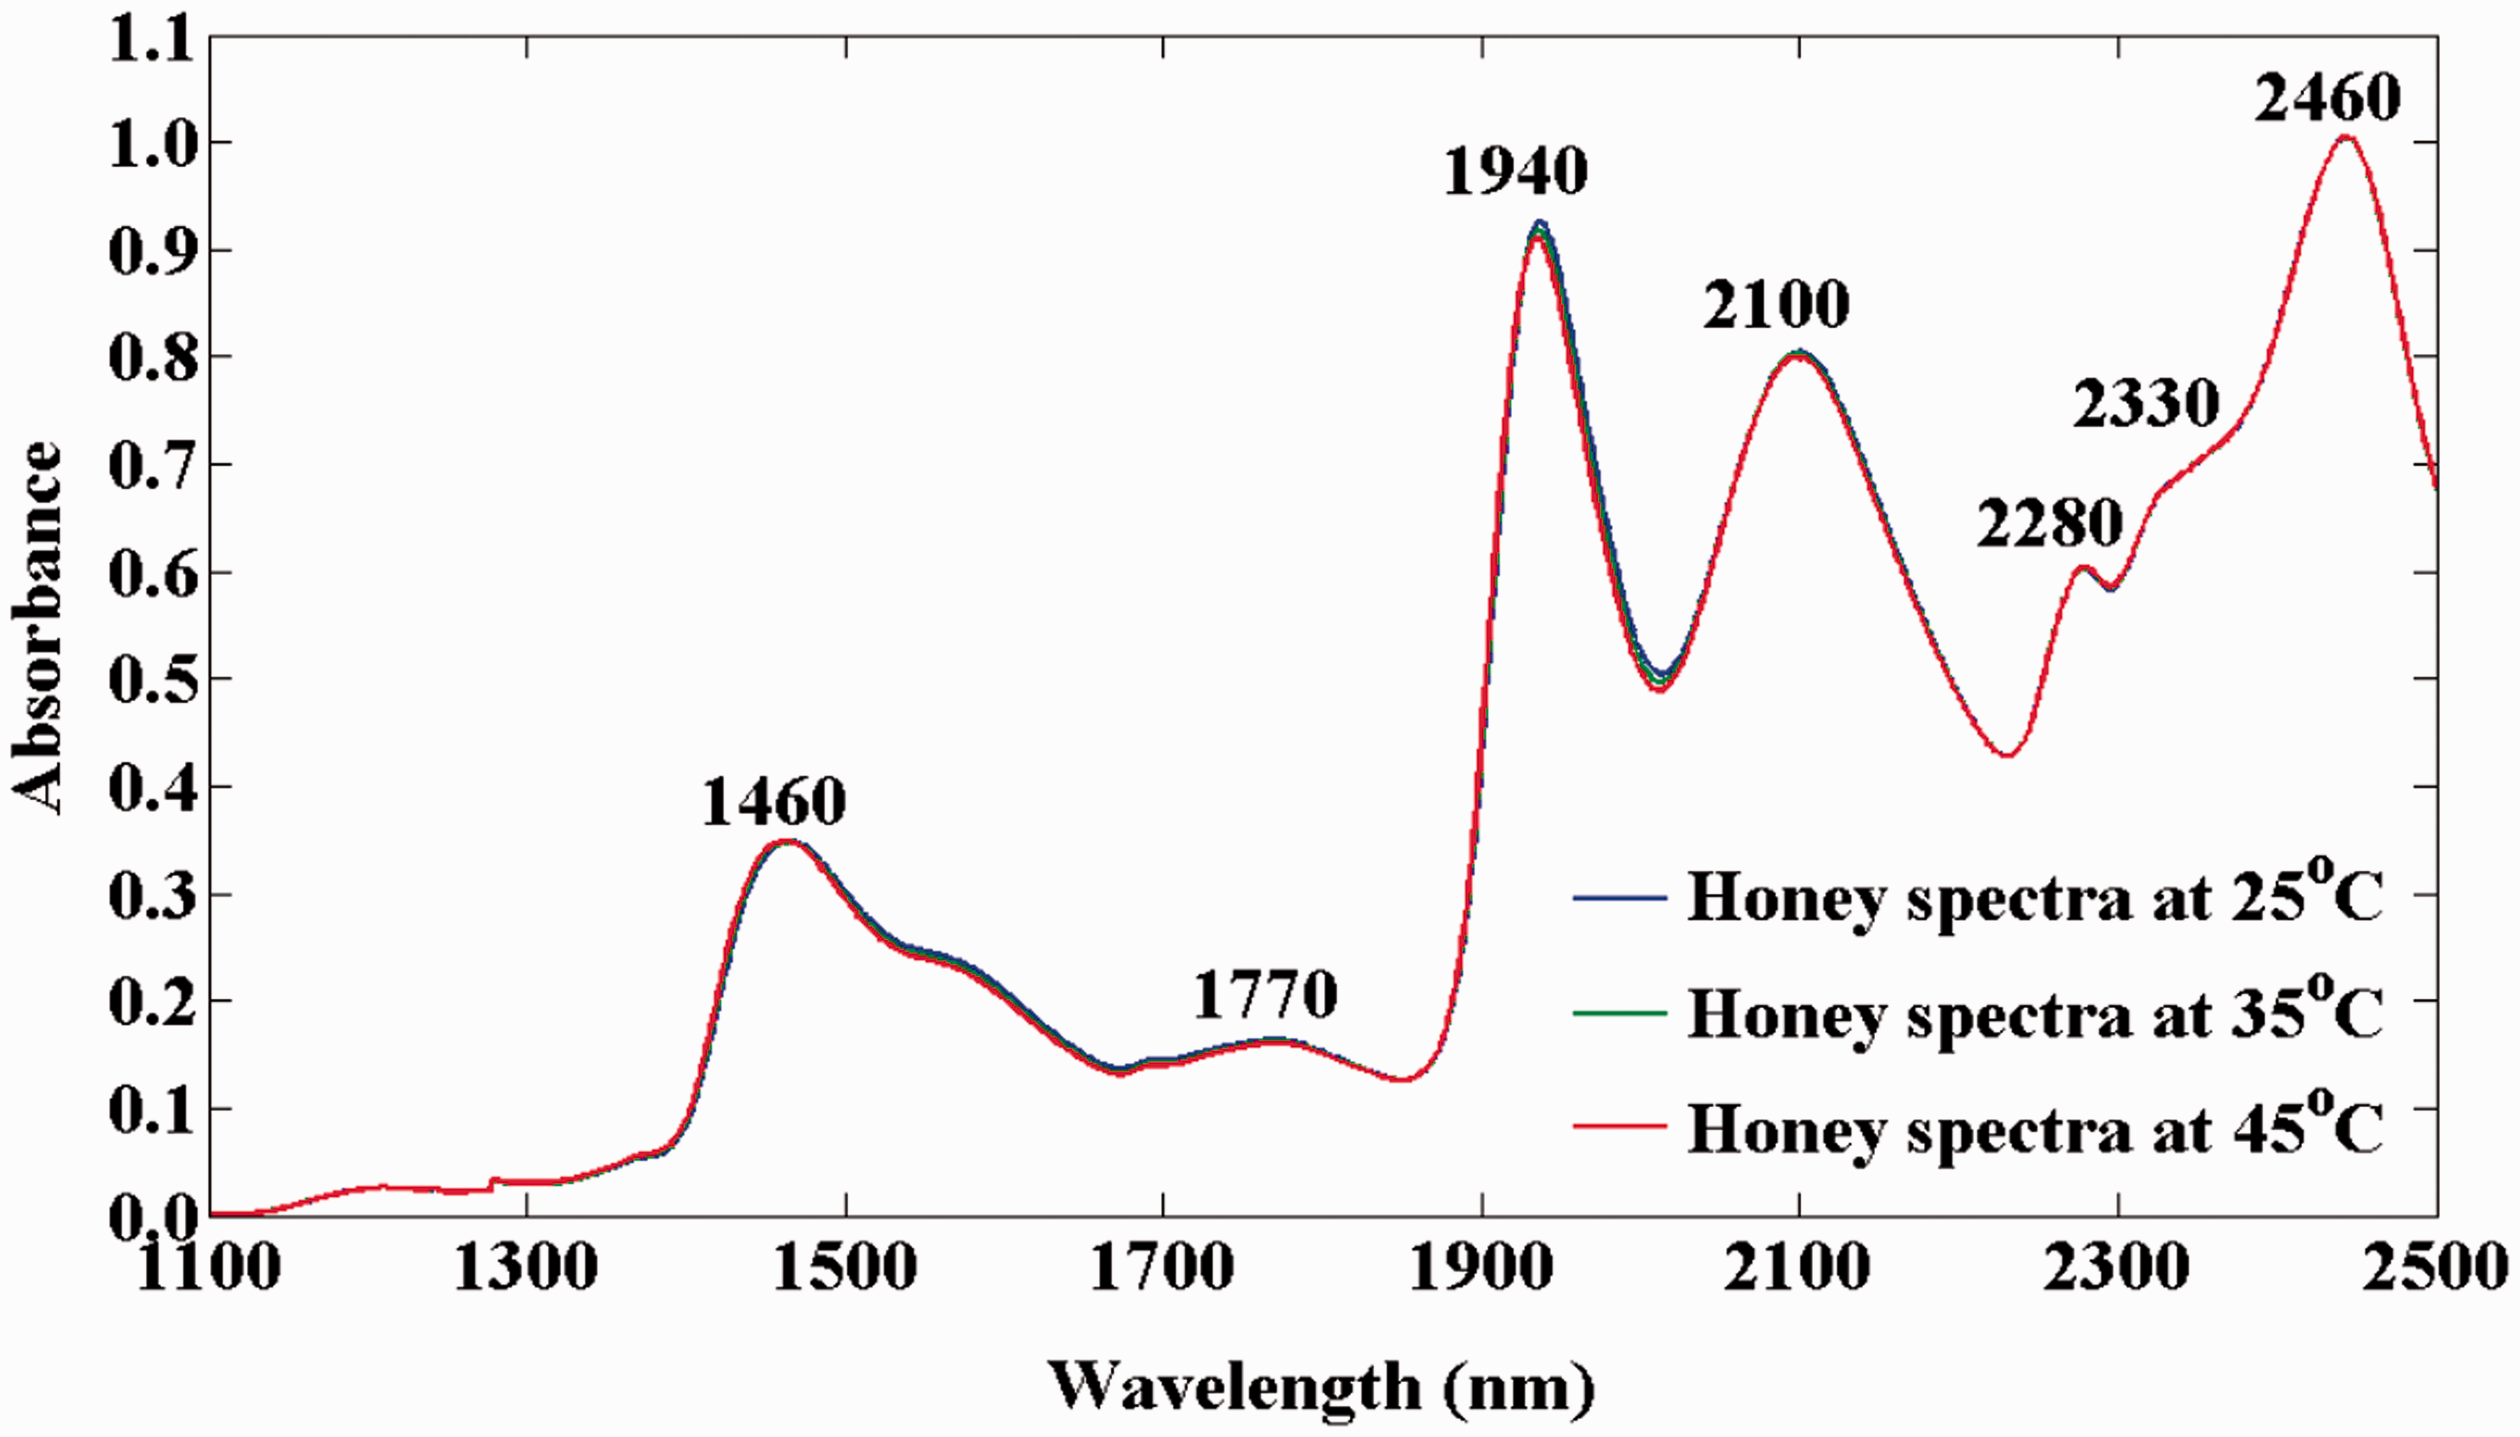

The spectral variations due to sample temperature changes are not immediately evident upon visual examination of the spectra. Peinado et al.
29
reported that the most significant change due to temperature variation can be seen around 1440 nm, the region where the combination of anti-symmetric and symmetric O–H stretching modes is observed. Therefore, in order to spectrally investigate the effect of sample temperature on the NIR spectra of honey, a wavelength region of 1420–1520 nm is presented in Figure 2. It can be seen from Figure 2(a) that the absorption bands of water shifted from 1466 nm at 25℃ to 1460 nm at 45℃. This shift is in agreement with the results of Segtnan et al.,
12
who studied NIR spectra of water in the temperature range of 6–80℃ using two-dimensional NIR correlation spectroscopy. They found that the band shifted from 1460 to 1424 nm as the temperature was increased from 6 to 80℃. The apparent peak shift is due to the fact that water species with weaker intermolecular H-bonds increases while those with stronger intermolecular H-bonds decrease with temperature.
(a) Original and (b) second derivative NIR spectra of the same honey sample in the wavelength region of 1420 to1520 nm measured at different temperatures of 25, 35 and 45℃.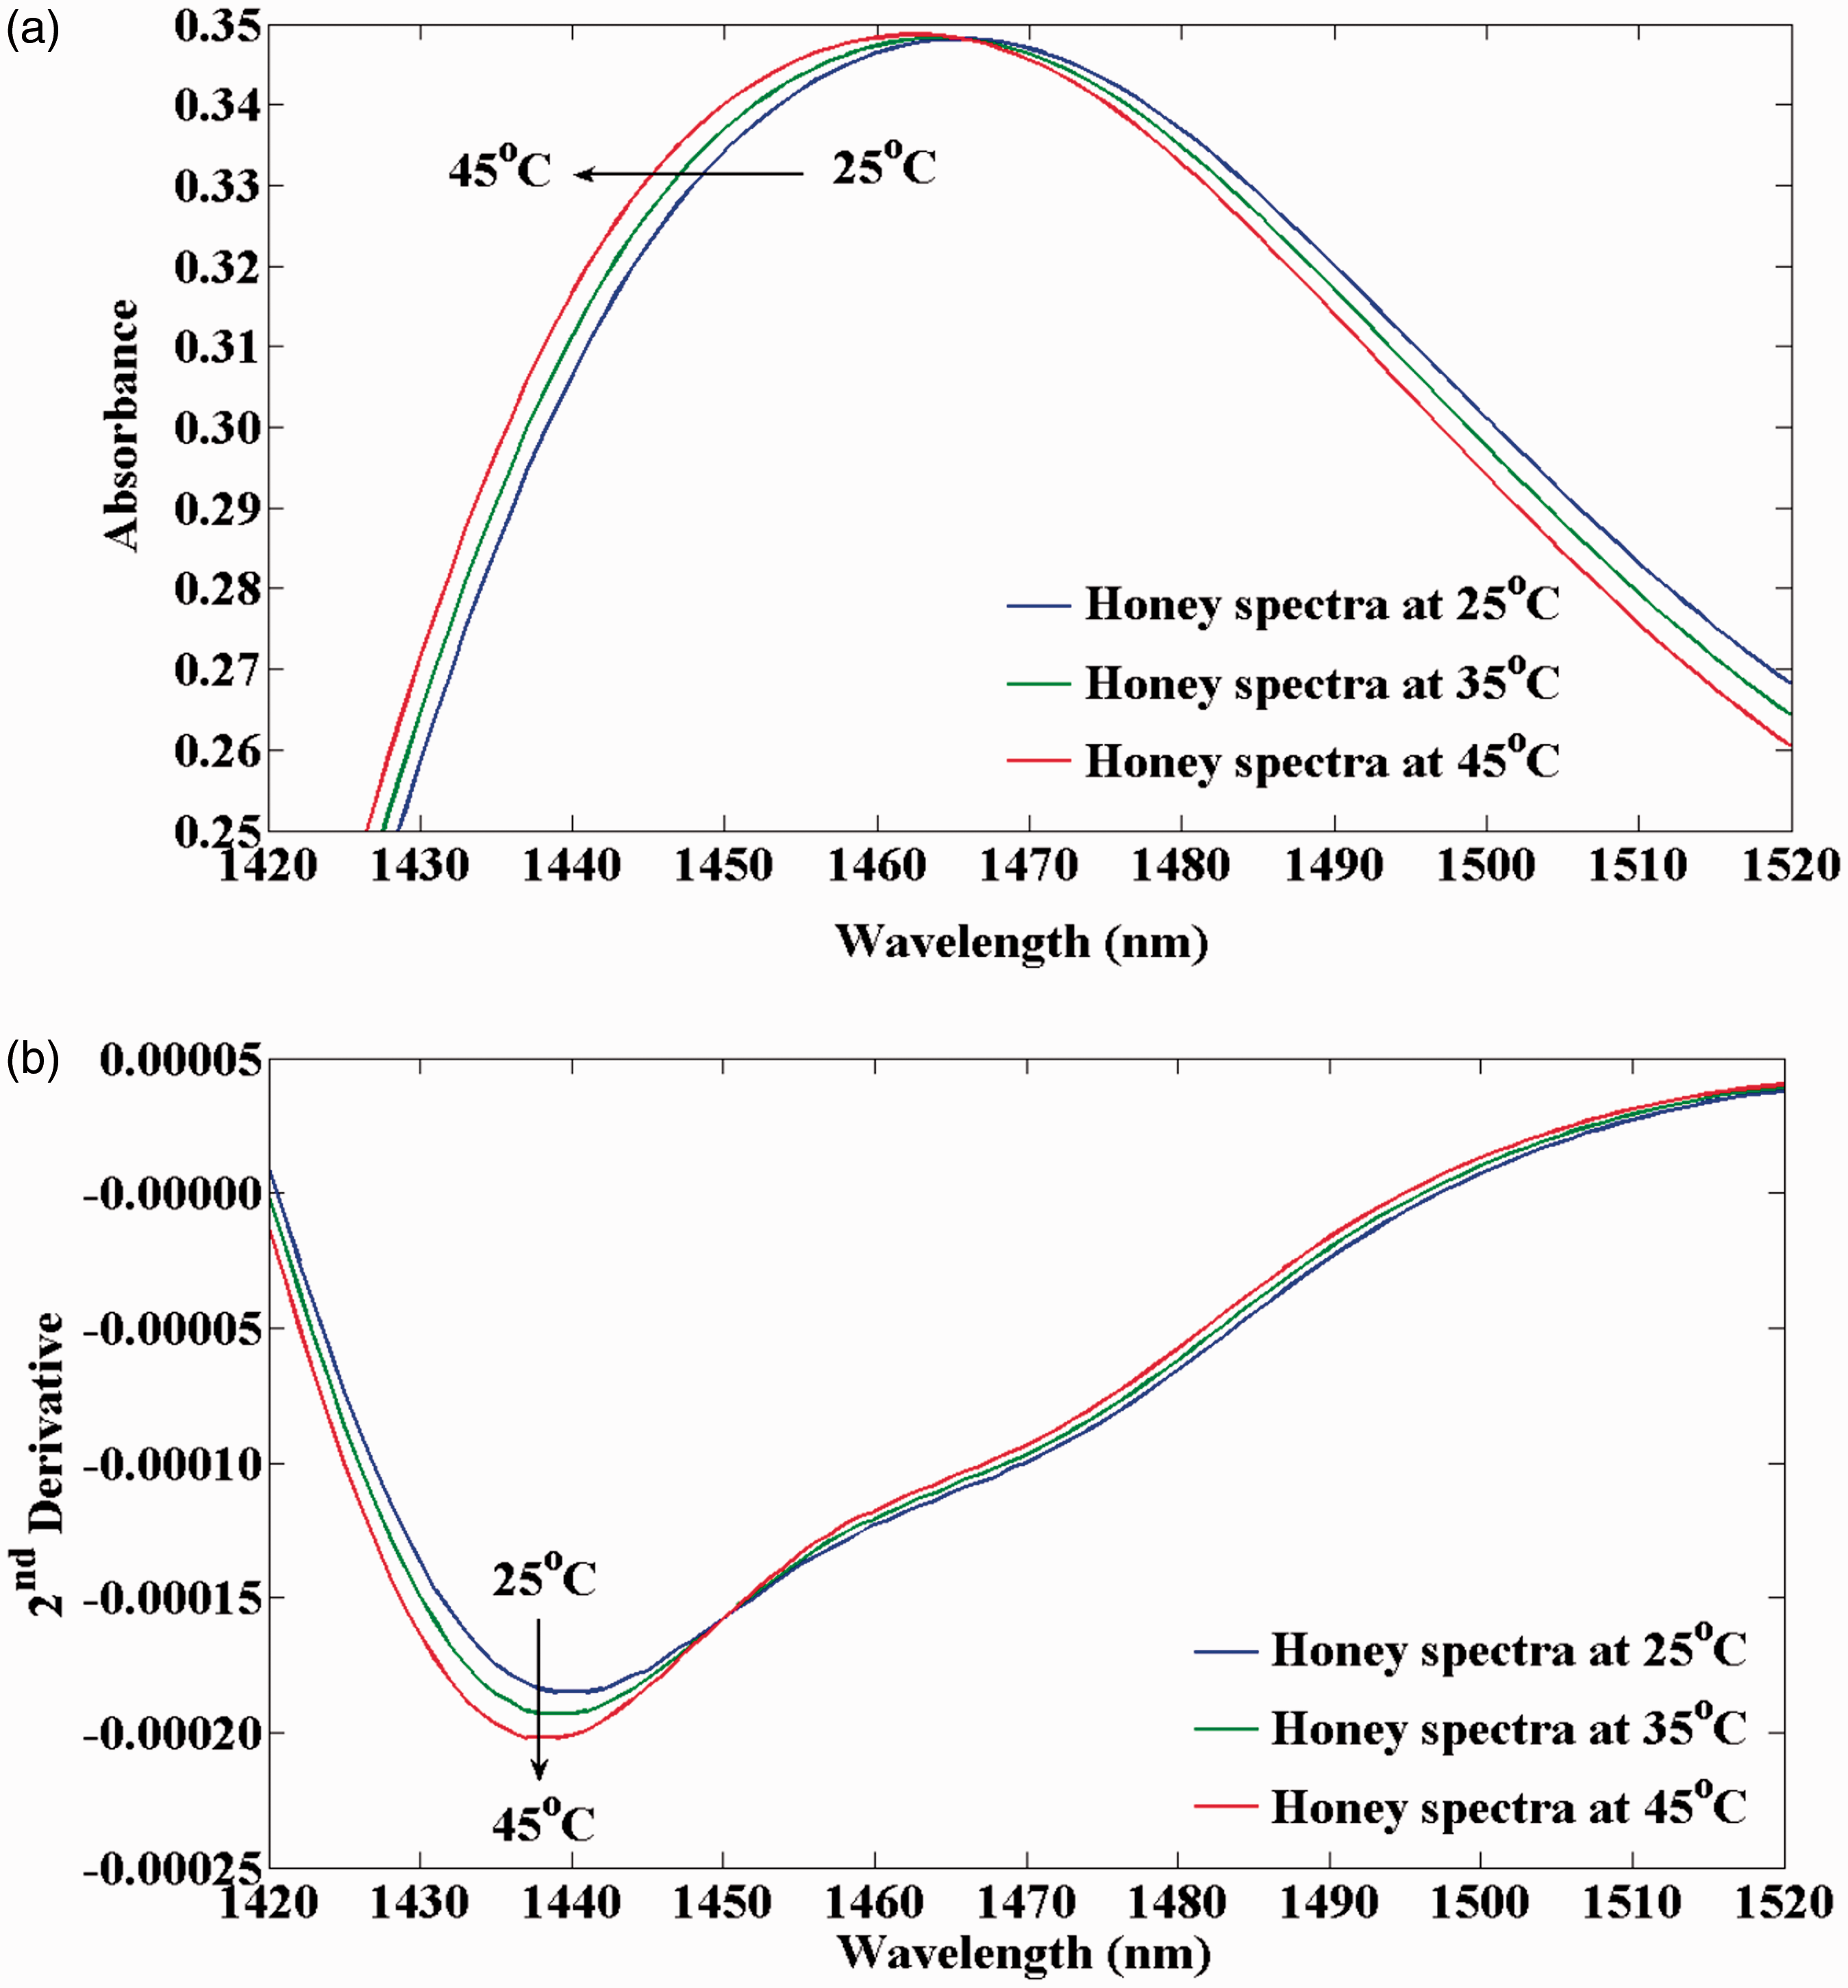
Temperature effects can also be observed for NIR spectra of alcohols because self-associate forms of the alcohols dissociated into oligomers, dimers and monomers as a function of temperature. 15 Conversely, Peirs et al. 14 found that changes in peak shifts due to temperature variation were not observed in NIR spectra of apple fruits, probably because of the highly complex mixture of components which induces overlapping of the individual component spectra.
In addition, it can be seen from Figure 2(b) that a peak near 1440 nm in the second derivative spectra increases with a small lower wavelength’s shift with temperature. This may be explained by the increase in the water species with weaker hydrogen bonds with temperature. A similar result was found by Jensen et al. 30 who measured the NIR absorbance of pure water and water–glucose mixture when the temperature varied between 30 and 42℃. They observed the variations of absorption bands located at 1450 nm due to temperature and explained that these changes lead to the appearance of several isosbestic points independent of the temperature.
The performance of calibration models with and without temperature compensation
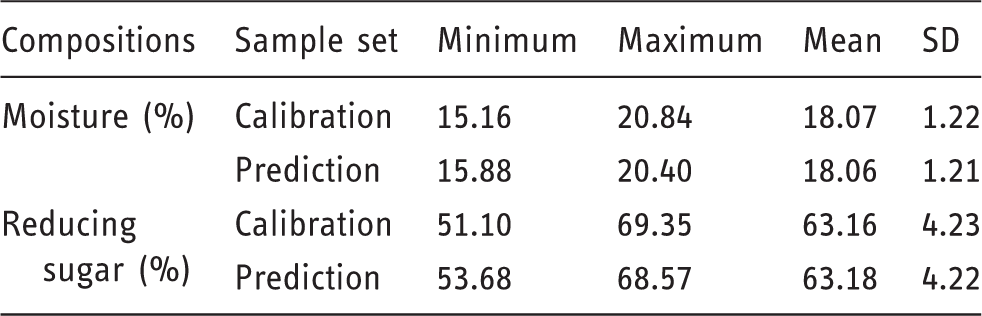
Characteristics of calibration and prediction sample sets.
NIR calibration and validation statistics of PLS calibration model with and without temperature compensation for moisture and reducing sugar.
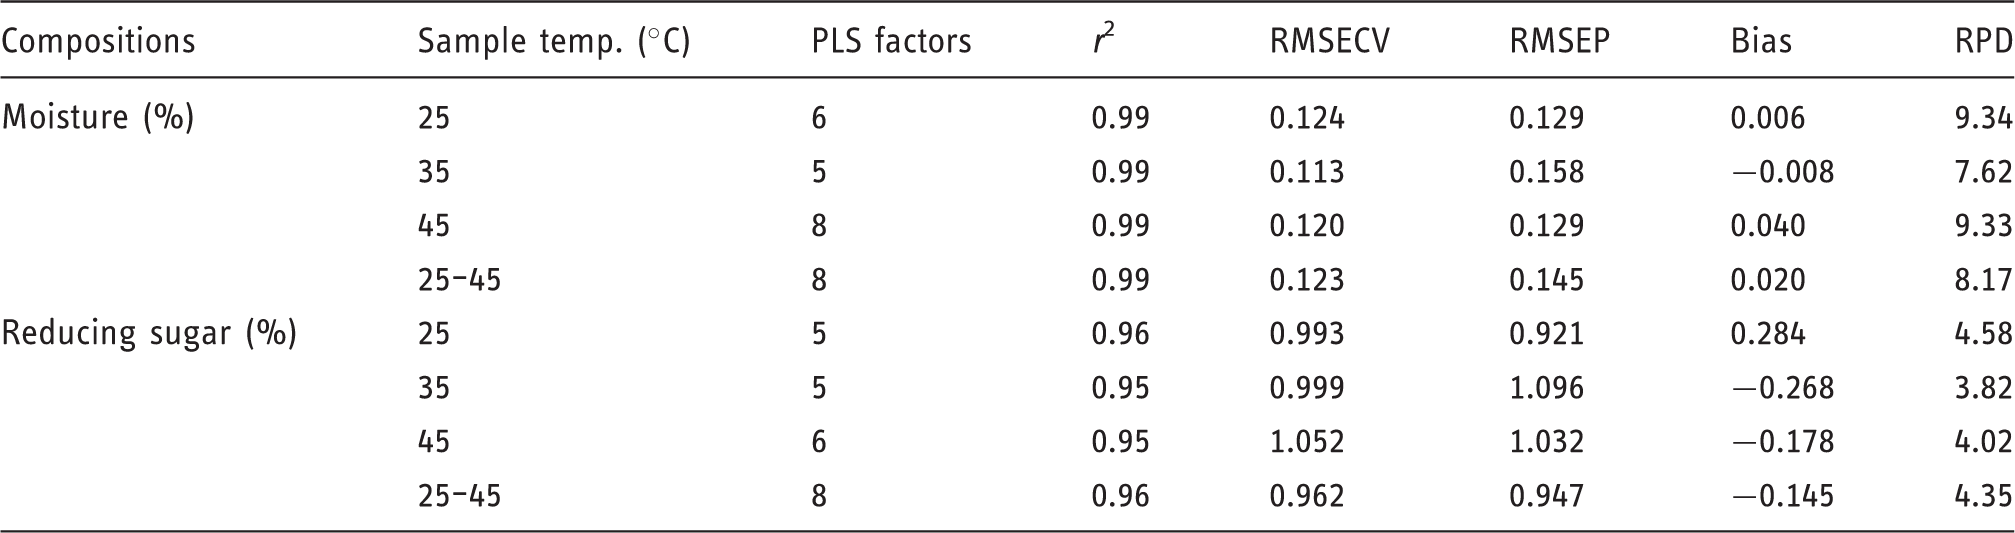
r2: Coefficient of determination for prediction; RMSECV: root mean square error of cross-validation; RMSEP: root mean square error of prediction; RPD: residual prediction deviation (standard deviation/RMSEP).
Other researchers have shown that NIR may be a reliable method for honey analysis. They developed the calibration models at a constant sample temperature (20℃). For examples, Qiu et al. 31 developed a regression model of modified partial least squares (mPLS) to determine moisture content of honey produced in four different cities (Beijing, Hong Kong, Los Angeles, and Melbourne). The mPLS model yielded R2 and SECV values of 1.00 and 0.08%, respectively. García-Alvarez et al. 32 developed a modified partial least squares (mPLS) model using NIR transflectance spectra for determination of fructose, glucose and moisture content of honey samples collected during 1992, 1995, and 1996. They proposed that good predictions were achieved for moisture with equations for the particular year. The R2 values ranged from 0.88 to 0.98, 0.86 to 0.96 and 0.96 to 0.98 for fructose, glucose and moisture respectively. However, the predictions were not always accurate when the equations calculated for one particular year were applied to samples from another year.
It can be seen from Table 4 that the RMSEP of models at 25℃ for moisture and reducing sugar were better than those for the sample temperatures 35℃ and 45℃. Surprisingly, the temperature compensation model results were even better than those of the calibration models constructed at the temperature 35℃ for moisture, and 35℃ and 45℃ for reducing sugar, respectively. The reason that better results for temperature compensation model can be obtained may be that the incorporation of more temperatures in the calibration model increases the resistance against small measurement deviations 14 and also may be due to more PLS factors being used.
However, the values of RPD are larger than 3.0, indicating that all the models, with and without temperature compensation, can be used for good prediction.
10
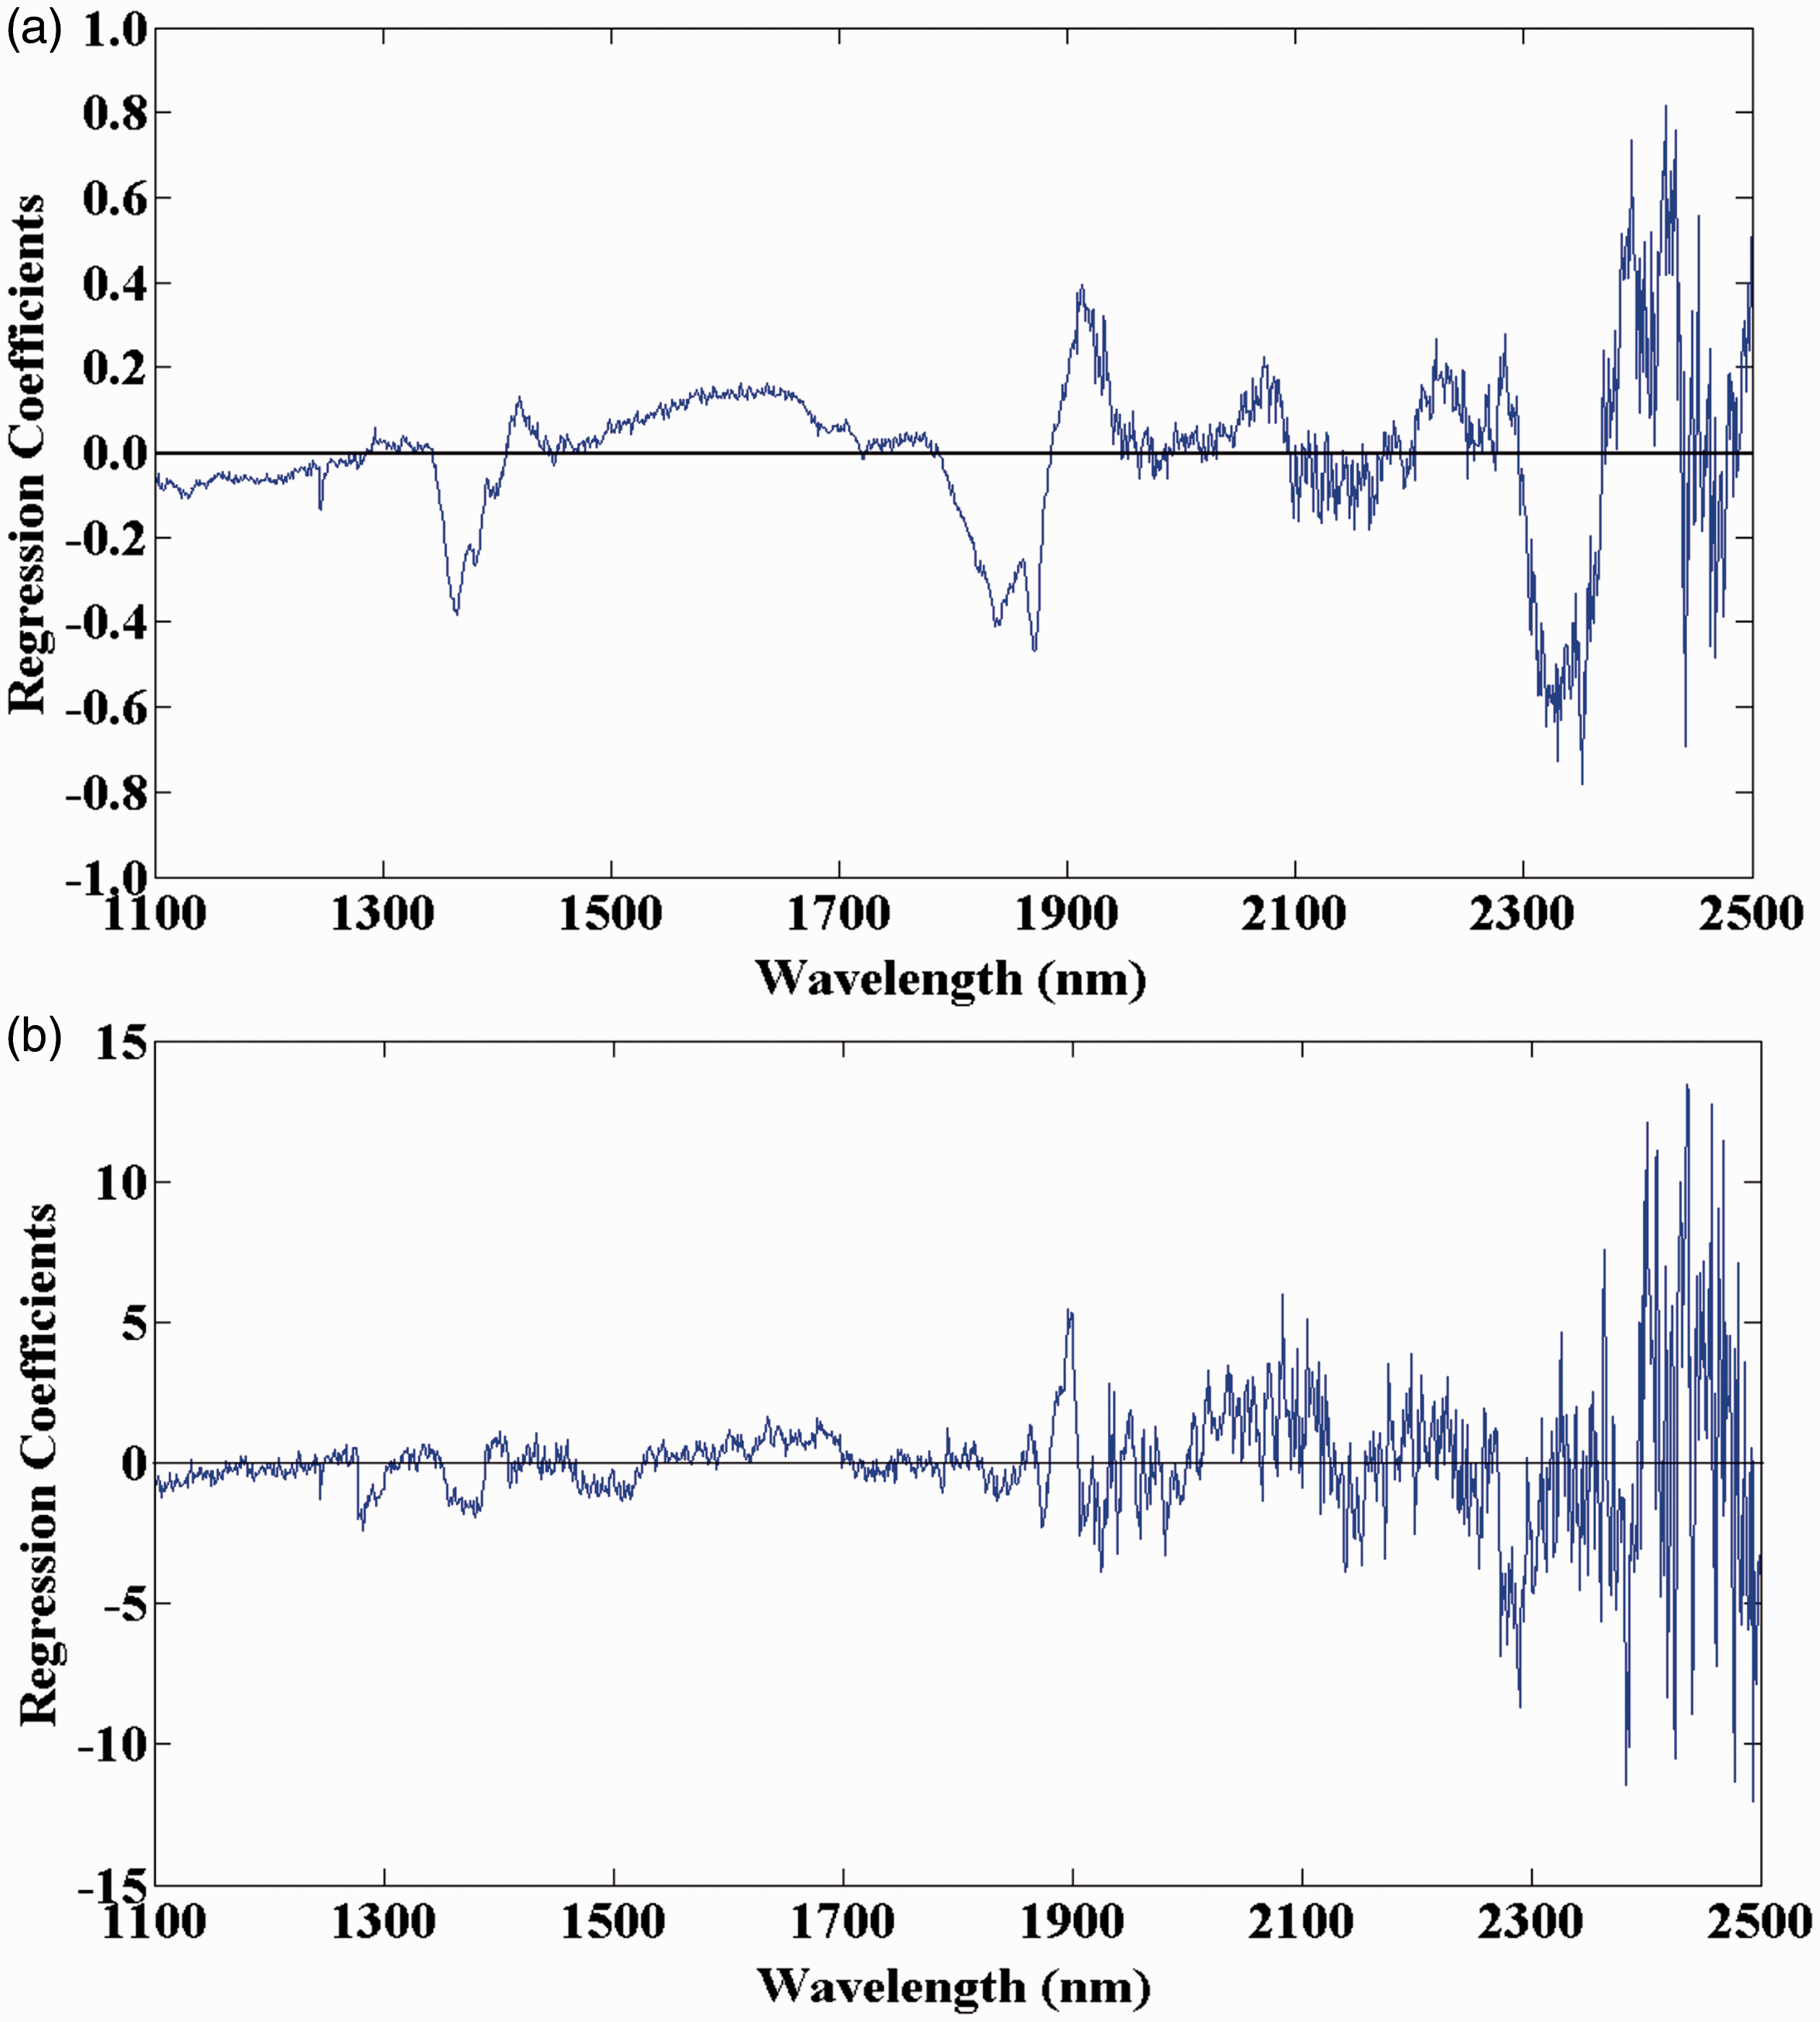
Figure 3 shows the correlation between the measured and predicted values of (a) moisture and (b) reducing sugar of honeys obtained by temperature compensation models. In the paired t-test, results demonstrated that no statistically significant difference (p = 0.38 and 0.31 for moisture and reducing sugar values, respectively) was found between the measured values and NIR predicted values. As shown in Figure 4, the NIR loadings showed that the highest variation in the calibration set for moisture content (Figure 4(a)) was associated with a broad band at 1940 nm due to the combination of O–H stretching and bending modes of water.
15
The predominant absorption bands responsible for modeling the reducing sugar (Figure 4(b)) included the bands in the region of 2200–2460 nm are due to C–H combination mode characteristic of sugar.
22
Correlation between the predicted and measured values of (a) moisture and (b) reducing sugar of the prediction set (n = 60) using the temperature compensation model. Corresponding regression coefficients of the temperature compensation model for (a) moisture content and (b) reducing sugar.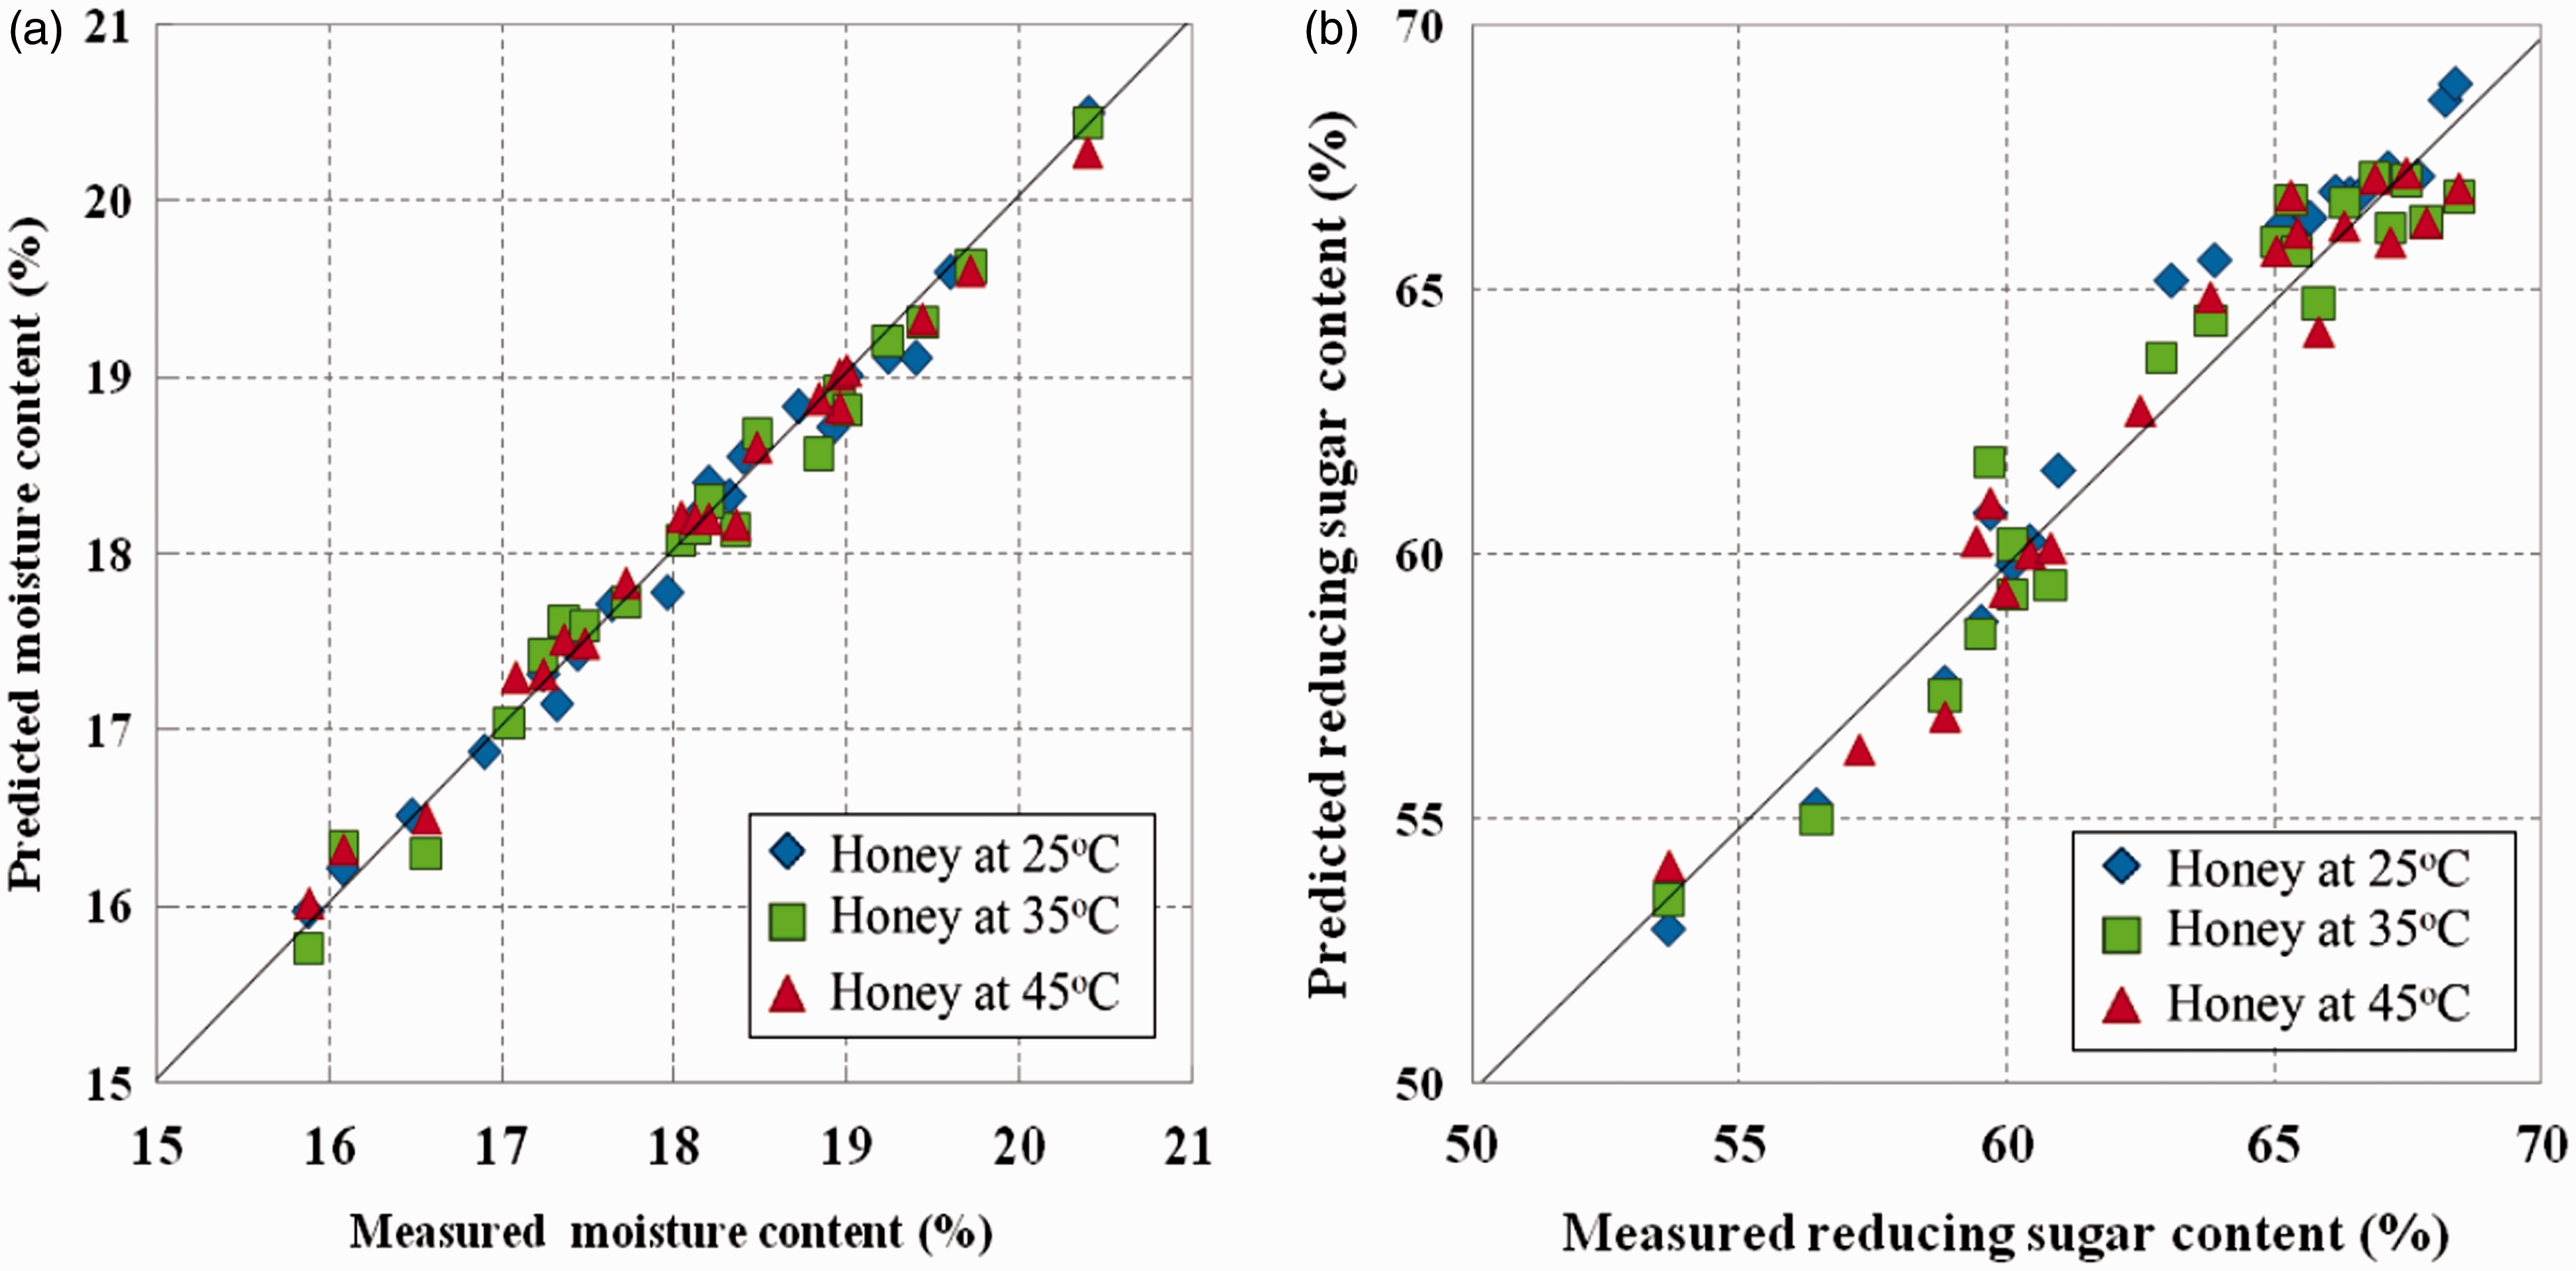
It is notable that moisture and reducing sugar of honey can be predicted directly, if a model and a prediction sample are measured at the same temperature. However, applying the calibration model at constant temperature in practical routine analysis has some disadvantages such as it is necessary to know or control exactly the temperature of the new samples. In this regard, the temperature compensation calibration model was found to work well and be more robust. The results in this study are very similar to those reported for wine, 15 apple, 14 sucrose in aqueous solution 33 and tomato. 34
Conclusions
This study demonstrated the importance of the effect of sample temperature on NIR spectra of longan honey and the peformance of calibration models with and without temperature compensation. NIR spectra of honeys were affected by sample temperature variation, mainly due to change of hydrogen bonds of water. The PLS calibration model established using NIR spectra collected at 25℃ yielded the best prediction for moisture and reducing sugar. Furthermore, temperature compensation models were robust and stable in prediction when sample temperature varied. It is not necessary for the temperature compensation model to know the exact temperature of the new samples to be predicted. It can be concluded that a calibration model with temperature compensation could be developed using a combined calibration set which covered a variation in temperature of the samples in the future. Enlargment of the sample collection seasons and floral honey sources should simplify the development of a more robust and accurate model.
Footnotes
Acknowledgements
We would like to thank the Kasetsart Agricultural and Agro-Industrial Product Improvement Institute, Kasetsart University, Thailand for giving us the opportunity to use the Spectra Star™ 2500 NIR instrument.
Declaration of conflicting interests
The author(s) declared no potential conflicts of interest with respect to the research, authorship, and/or publication of this article.
Funding
The author(s) disclosed receipt of the following financial support for the research, authorship, and/or publication of this article: This research was financially supported by the Graduate School, Kasetsart University, Thailand.