
Abstract
Particle size and bulk density are two important fundamental properties of food powder that directly affect processing and final product quality. The objective of this study was to evaluate and compare two optical sensing methods, i.e. visible/shortwave near infrared spectroscopy and hyperspectral scattering, for bulk density determination and particle size classification of wheat flour. Hyperspectral scattering images over the spectral region of 500–1000 nm and visible/shortwave near infrared reflectance spectra covering the spectral region of 400–1000 nm were acquired for 474 wheat flour samples. Partial least squares regression and discriminant analysis models for visible/shortwave near infrared spectra and mean spectra extracted from the hyperspectral scattering profiles were developed for determining the bulk density and classifying the particle size, of wheat flour samples. Hyperspectral scattering gave much better prediction results for bulk density, with the r2 (the coefficient of determination for prediction) value of 0.87 and the root mean squares error of prediction value of 30.20 mg ml−1, compared with the r2 of 0.55 and root mean squares error of prediction of 57.13 mg ml−1 obtained by visible/shortwave near infrared spectroscopy. Moreover, hyperspectral scattering resulted in 98.2% classification accuracy for particle size, versus 96.8% by visible/shortwave near infrared spectroscopy. This research suggested that hyperspectral scattering is more suitable than visible/shortwave near infrared spectroscopy for bulk density determination and particle size classification of food powder.
Keywords
Introduction
Powder is composed of a large number of fine particles, whose size typically ranges from nanometers to millimeters. Currently, many food products in the market are processed and sold in a powder form for ease of use as well as for specific processing and keeping quality. 1 The properties of food powder depend on both characteristics of raw materials and processing conditions, and will directly impact the end use of the product. Hence, it is desirable to measure the properties of food powder for the design of machines, processes, and controls, for analyzing and determining the efficiency of a machine or an operation, for developing new consumer products, and for evaluating and retaining the quality of the final products. 2 The properties of food powder can be classified into fundamental, functional, and defective properties. 3 The fundamental properties are most important because they directly influence the other two properties. Particle size and bulk density are two key fundamental property parameters that can affect the bulk behavior of food powder during processing and handling, such as flowability, compressibility, and explosibility. 4 Wheat flour quality index consists of ash content, moisture content, gluten index, gluten content, stability time, falling number, particle size (granularity), etc. Thus particle size is an important factor in the classification of wheat flour quality; it is used for classifying wheat flour into three categories of strong gluten, medium gluten, and weak gluten, and for further subdivision levels within each gluten category. 5 Consumers use wheat flour with different gluten categories for making different types of food. For example, extra high gluten flour rich in moisture and crude protein is more suitable for gluten and deep-fried dough sticks. Bulk density, on the other hand, has an important effect on compaction and storage in bins or hoppers in wheat flour handling, and compaction affects the flow characteristics of wheat flour. 6 Meanwhile, bulk density is closely related to the compressibility index and Hausner ratio, which are good indicators of the compaction mechanism that occurs during handling and processing of food powder materials due to vibration or tapping. 7 Moreover, bulk density of wheat flour is also an important consideration in the design of conveying and storage systems. 8
Many methods and instruments have been developed for determining particle size and particle/bulk density. They include laser diffraction, 9 sieve analysis, 10 image analysis, 11 and microscope counting 12 for particle size, and pycnometry 13 and tapping machine for bulk density. But these methods are time consuming and/or laborious. Furthermore, they cannot measure particle size and bulk density simultaneously.
Visible/near infrared reflectance (Vis/NIR) technology is one of the most practicable analytical techniques for food powder owing to its rapid, simple, and nondestructive detection advantages. Considerable research has been reported on using Vis/NIR spectroscopy for chemical composition measurement of food powder, such as apparent amylose content, gel consistency, and moisture.14–16 Studies also have been reported about using Vis/NIR spectra and shortwave near infrared (SWNIR) spectra for rapid measurement of physical properties of food powder. Hareland 9 predicted flour particle size distributions using Vis/NIR reflectance spectroscopy within ± 2 standard errors for more than 96% of the flours tested. Chen et al. 17 employed SWNIR transmittance spectroscopy to predict particle size distributions of Chinese winter wheat flour and obtained good prediction results, with the r2 value of 0.85. Saeki et al. 18 predicted polyethylene bulk density by NIR spectroscopic technique, and reported the r2 value of 0.96 for PLS analysis. Since light attenuation in powder involves both scattering and absorption, 19 conventional Vis/NIR or SWNIR technique only measures the aggregate amount of light that is diffusely reflected from or transmitted through a sample; it is not designed for measuring, or enhancing the measurement of, light scattering in diffusive materials like food powder. Consequently, this could limit Vis/NIR spectroscopy for accurate determination of the two important properties of food powder.
It is well known that scattering is attributed to the physical properties such as structure, particle size, and density, whereas absorption is mainly determined by the chemical composition of the material. Particles in the wheat flour contribute to strong multiple scattering events, which are dependent on the size of the particles and bulk density. Hence, the scattering component can provide an effective means to measure particle size. Extensive research has been reported over the past two decades on the development of novel optical techniques (e.g. spatially resolved, time-resolved, and frequency domain) for measuring the absorption and scattering properties of biological and food materials. Hyperspectral imaging-based spatially resolved technique (hereinafter referred to as “hyperspectral scattering” for brevity) is a promising, relatively new method for measurement of the scattering and absorption properties of food samples.19,20 The method differs from conventional Vis/NIR or SWNIR spectroscopy in that it measures the backscattered reflectance profiles from a sample, resulting from the normal incidence of a small light beam, at different spatial distances, over a spectral region. It can thus provide better quantification or measurement of the light scattering and absorption properties of food products. The absorption and scattering coefficients, two important fundamental optical property parameters for diffusive materials, can be estimated from the spatially resolved reflectance profiles (also called hyperspectral scattering profiles) using a diffusion theory model, coupled with an inverse algorithm. 20 Alternatively, empirical methods, such as simpler mathematical equations (e.g. Gaussian and Lorentzian functions and their variants) or simple computations of mean and/or standard deviation, can be used for characterizing the hyperspectral scattering profiles.21,22 The technique recently has been used for assessing internal quality of fruits,23,24 vegetables, 25 and other food products.26,27
Since bulk density and particle size have a significant impact on the scattering characteristics, it is therefore reasonable to expect that hyperspectral scattering technique can achieve more accurate measurement for the bulk density and particle size of food products in powder form than Vis/NIR or SWNIR spectroscopy. However, hyperspectral scattering technique has not been used for measuring the properties of powder foods. This study was therefore aimed at evaluating and comparing Vis/SWNIR spectroscopy and hyperspectral scattering for determination of bulk density, and classification of particle size, for wheat flour. The specific objectives were to:
Acquire hyperspectral scattering images and diffuse reflectance spectra from wheat flour samples over the spectral regions of 500–1000 nm and 400–1000 nm, respectively; and Develop calibration models, using both Vis/SWNIR spectra and hyperspectral scattering spectra, for bulk density prediction and particle size classification.
Materials and methods
Sample preparation
All 474 wheat flour samples harvested from 2009 to 2012.
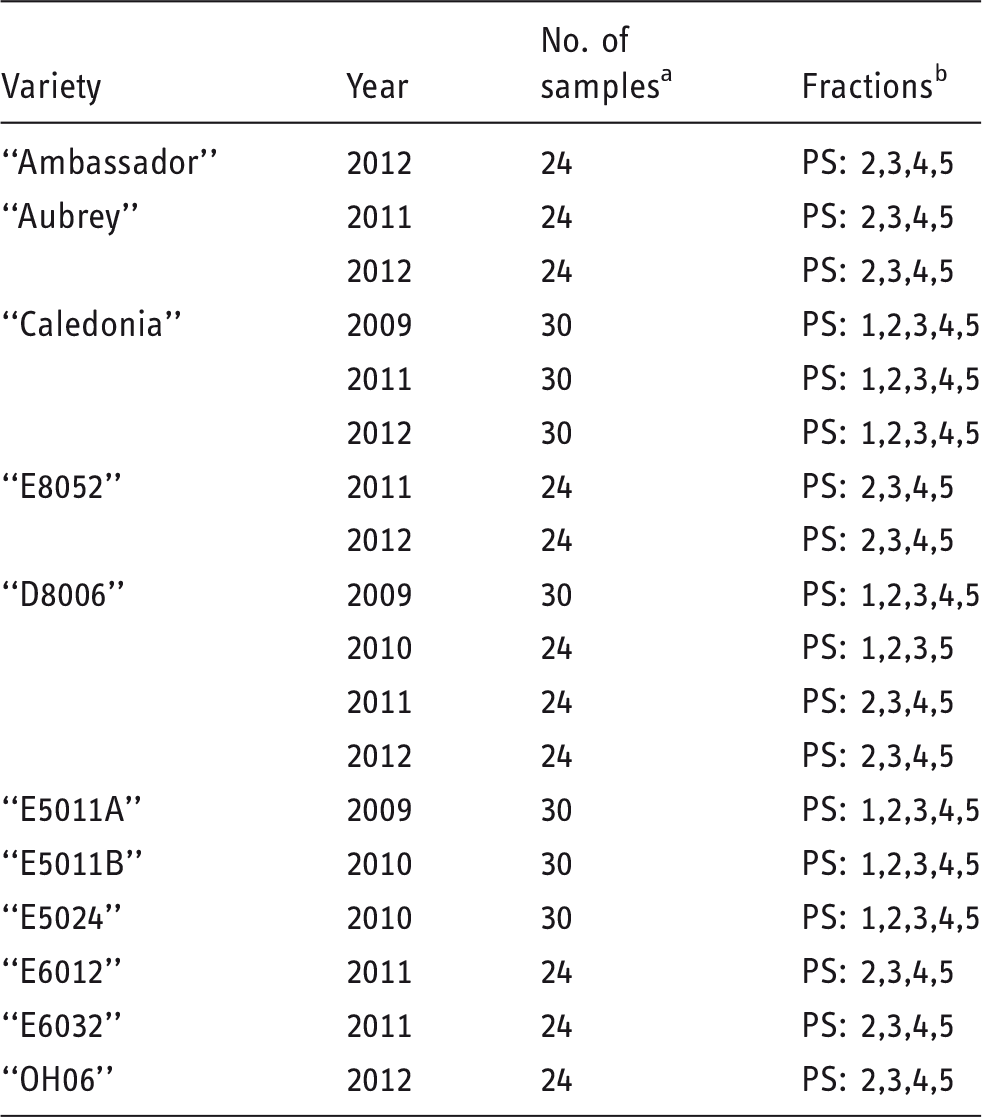
Numbers represent the sums of several fractions, i.e. every fraction has six samples.
PS 1, 2, 3, 4, and 5 represent particle size classes of smaller than 63 µm, 63–75 µm, 75–93 µm, 93–120 µm, and larger than 120 µm, respectively.
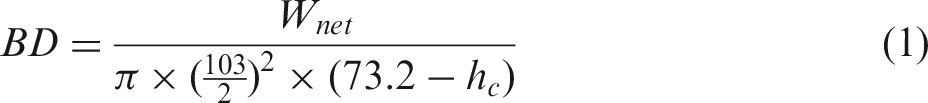
The flour samples had been kept in plastic bags in cold storage (4℃) for various time periods (ranging from less than 1 year to the maximum of 4 years) before the optical measurements were taken in this study. About 200 g wheat flour of each fraction was poured into a cylindrical container weighing 124.9 g, with the height and internal diameter of 73.2 mm and 103 mm, respectively. After the surface of the flour in the container had been smoothed, the container filled with wheat flour was then weighed and the net weight of the flour in the container was recorded. From a statistical point of view, the performance of a statistical model is influenced by the range of the collected samples. A wider sample distribution range is preferable for developing a more reliable statistical model that would be suitable for a larger range of samples. Therefore, flour samples with a wide range of bulk density were artificially created. To achieve this goal, each flour sample in the container was subjected to 1, 6, 11, 16, 21, and 23 mm successive compressions using a Texture Analyzer (TA.XT2i, Stable Micro Systems, Inc., Surrey, U.K.) equipped with a compression disk of 103 mm at a loading speed of 0.2 mms−1. The bulk density (BD) was calculated using the following formula:
After each compression, hyperspectral scattering images and Vis/SWNIR spectra (details are presented in the following section) were obtained. A total of 474 flour samples (i.e. 11 varieties × 4 size fractions × 6 compression levels and 7 varieties × 5 size fractions × 6 compression levels) were measured in this study.
Acquisition and processing of hyperspectral scattering images
A hyperspectral imaging-based spatially resolved instrument, also called “Optical Property Analyzer” (OPA), developed by the USDA Agricultural Research Service’s postharvest engineering laboratory at Michigan State University, East Lansing, Michigan, was used to acquire hyperspectral scattering images from wheat flour samples.
29
The schematic diagram of the OPA is shown in Figure 1. The main hardware of the OPA includes a high-performance 14-bit electron multiplying CCD (EMCCD) camera (Luca R604, Andor Technology, South Windsor, Connecticut, USA), an enhanced imaging spectrograph (ImSpector V10E, Spectral Imaging, Ltd., Oulu, Finland) covering the wavelength region of 400–1000 nm with a prime lens (Xenoplan 1.9/35, Schneider Optics, Hauppauge, New York, USA), a 20-W tungsten halogen lamp (HL-2000-HP, Ocean Optics, Dunedin, Florida, USA) controlled by a DC regulated controller chip (PT6204N, Texas Instruments, Inc., Dallas, Texas, USA), and a sample positioning platform consisting of a motorized linear horizontal stage (Twintrac, TSZ8020, US23T22104-8LS, U.S. Automation Corp., Laguna Hills, California, USA) and a manual vertical stage. The incident beam of 1.0 mm in size generated from an optical fiber was delivered to the sample at an angle of 15° with respect to the vertical axis via a specially designed focusing lens. Furthermore, the beam was positioned parallel to the imaging scanning direction with an off distance of 1.5 mm from the scanning line for avoiding signal saturation.
Schematic of the hyperspectral imaging-based spatially resolved system, also called Optical Property Analyzer, for measurement of wheat flour samples (a) and top view of multi-line scanning mode for acquiring spatially resolved reflectance profiles (b).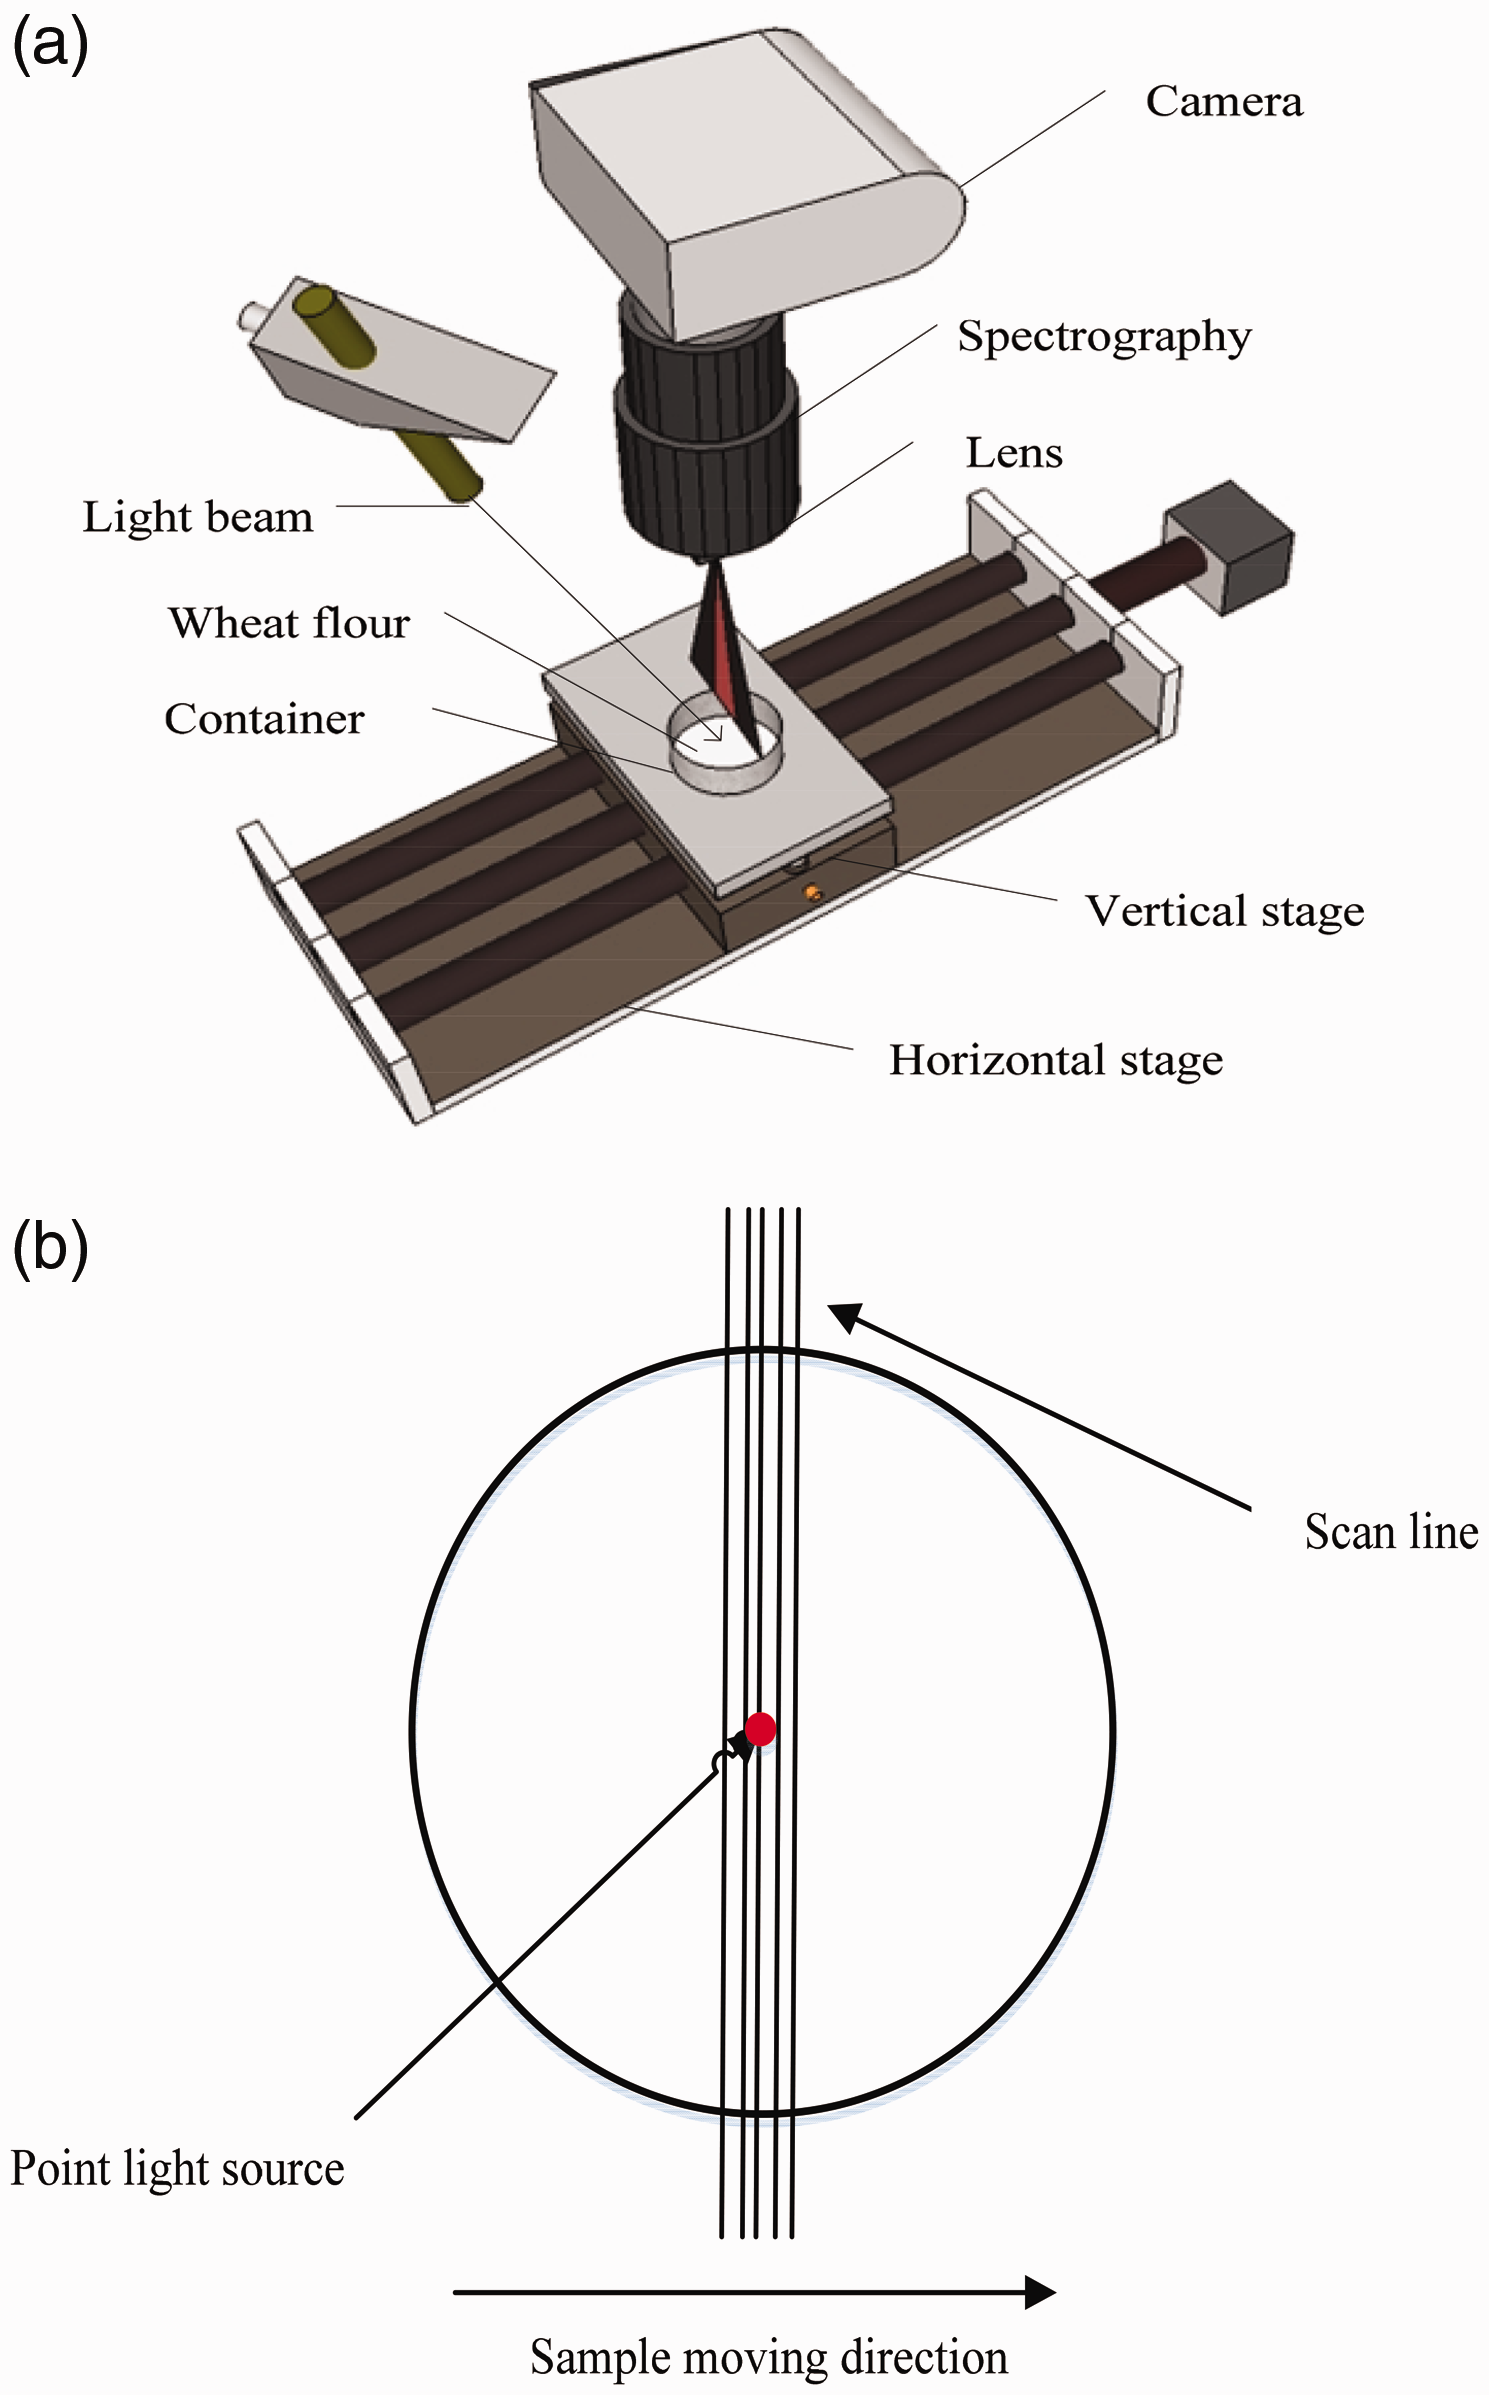
For each flour sample, 19 scans covering 9 mm distance were acquired at an expose time of 120 ms for each scanning image at 0.5 mm incremental step. These scanning images were then averaged to obtain the mean image and saved for further analysis. After 4 × 4 binning operations, the resultant dark-corrected hyperspectral scattering images had 3.1 nm spectral resolution per pixel and 0.21 mm spatial resolution per pixel. For correcting the light source effect, reference scattering images were also acquired from a white Teflon disk.
A typical raw hyperspectral scattering image for a wheat flour sample is shown in Figure 2(a), where the horizontal axis represents a spatial dimension and the vertical axis shows the wavelength. After consideration of the signal-to-noise ratio and the need for a sufficient scattering distance, a total of 161 scattering profiles, covering the spectral region between 500 and 1000 nm and a spatial distance of 20 mm, were selected from each image for extraction of features.
Raw hyperspectral scattering image of a “Caledonia” flour sample harvested in 2012 (a) and scattering profiles for three wavelengths (b).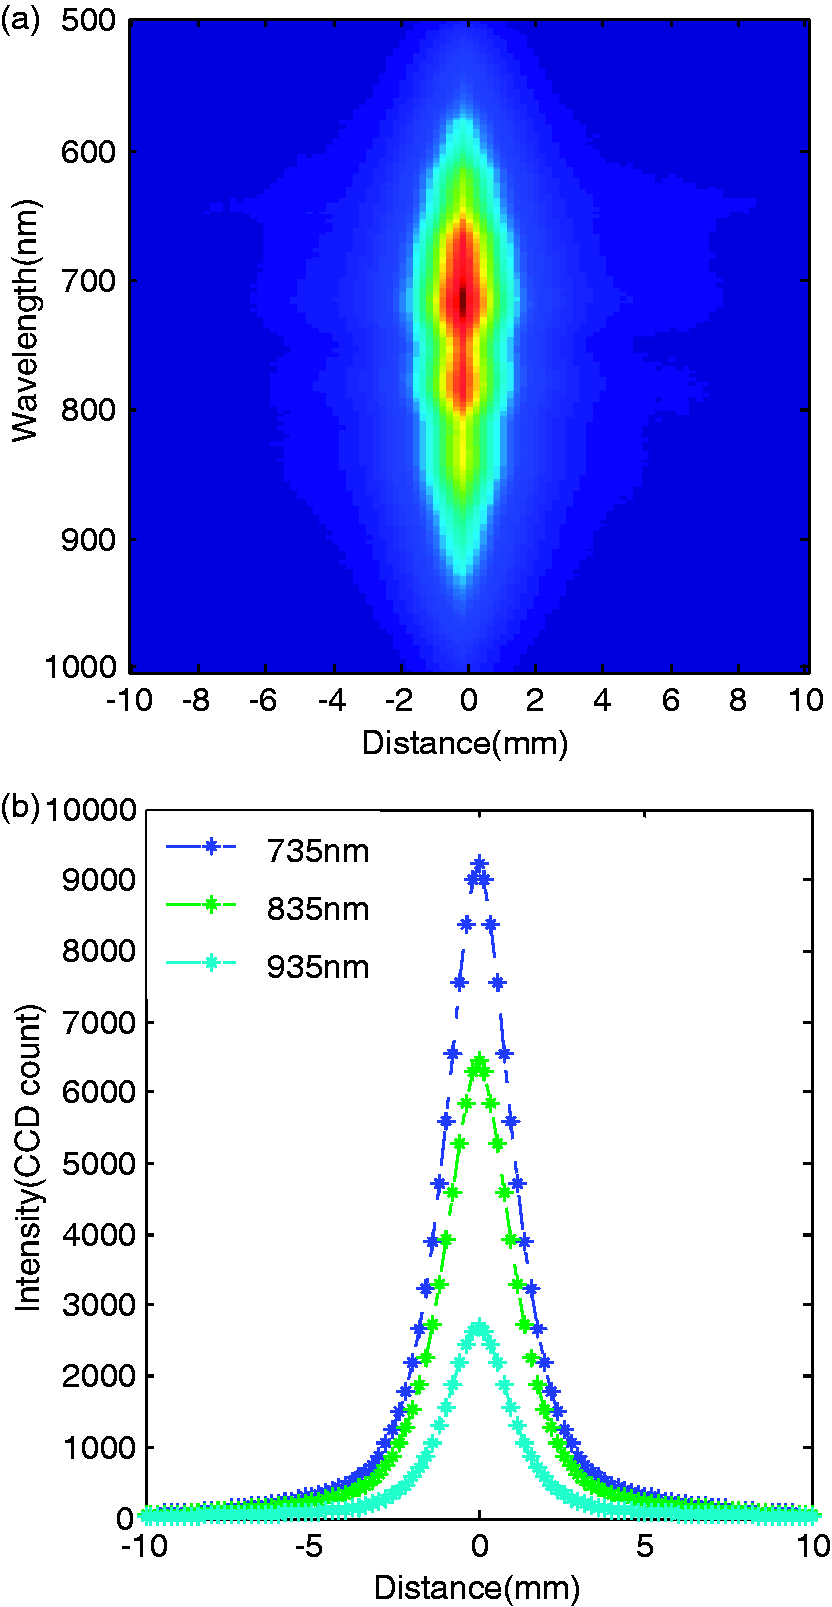
Different methods, including a modified Lorentzian distribution function with four parameters,
22
diffusion theory method for estimating absorption and scattering coefficients,
19
moment method,
24
and mean spectra,
21
have been proposed to characterize and analyze the scattering profiles (Figure 2(b)). The mean spectra method was used in this study for extracting features from the scattering profiles, because it is simple and also effective for describing the scattering profiles, which are similar to the normal distribution (Figure 2). Mean relative reflectance, 
Collection and processing of Vis/SWNIR spectra
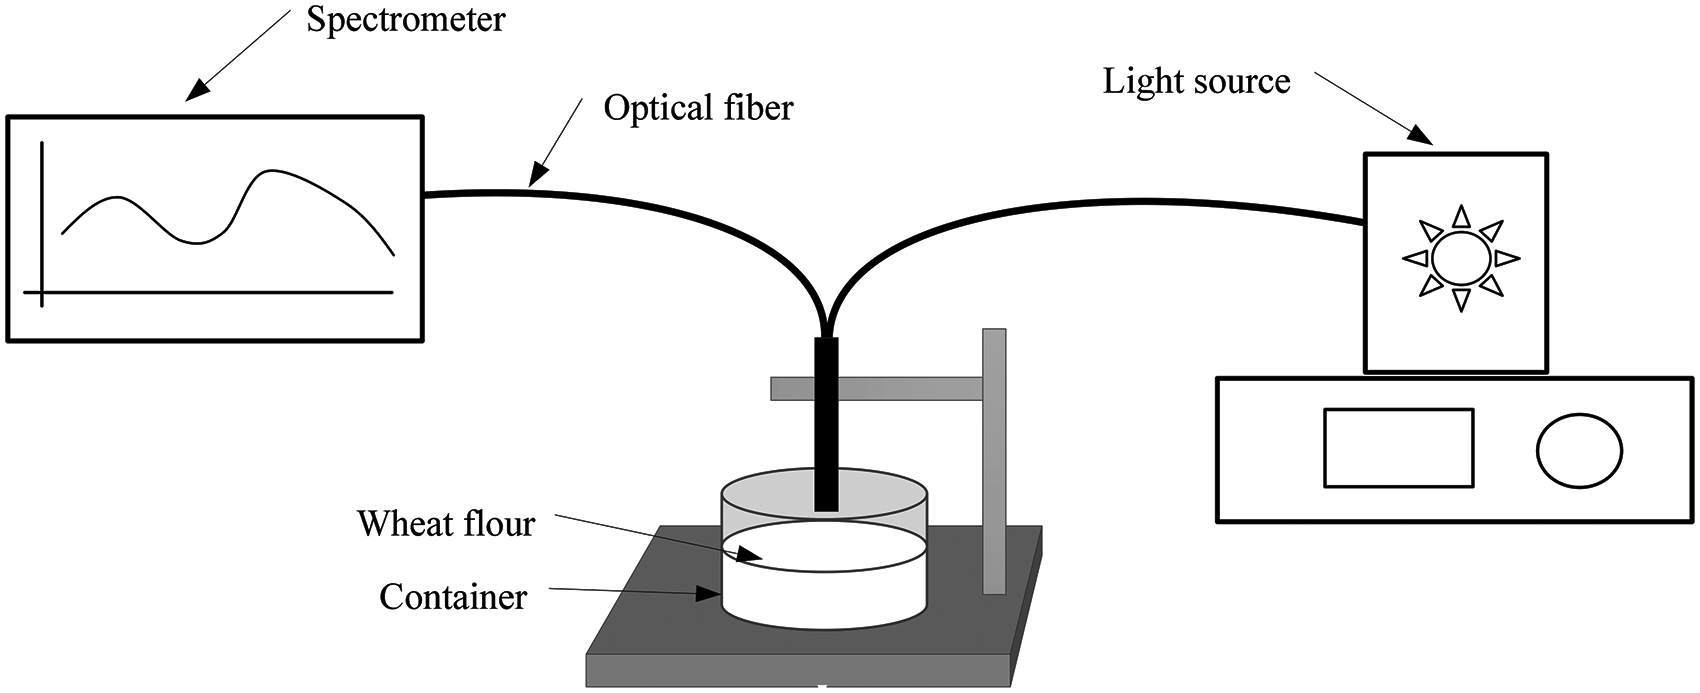
A portable Vis/SWNIR spectrometer (Model LOE-USB; Tec5USA Inc., Plainview, New York, USA) covering the spectral region of 400–1000 nm with 3.3 nm wavelength resolution was used in this research (Figure 3). The light beam was perpendicularly incident to the sample surface delivered from an optical probe, and the reflected light from the sample was acquired. The illumination power was set to 100 W, and the integration time was 40 ms to ensure that the maximum recorded values for the spectra of flour samples would be no more than 80% of the full recording value. The illumination area of the incident beam was set to 10 mm by adjusting the distance between the optical fiber and the sample surface, so that the acquired reflectance would cover a sufficiently large area of wheat flour samples. Three scans were acquired from the same location of each wheat flour sample and then averaged for further analysis. Reference spectra from a white Teflon disk and dark current were collected to calculate the relative reflectance intensity IR using the following equation:
Schematic of the visible and shortwave near-infrared (Vis/SWNIR) spectroscopic system for reflectance measurement of wheat flour samples. The distance between the detection probe and the surface of the sample was kept at 10 mm.
After calculation of the relative reflectance intensity IR, four common preprocessing methods, i.e. smoothing, Savitzky-Golay derivative, 30 standard normal variate (SNV), 31 and multiplicative scatter correction (MSC), 32 were used to pretreat relative absorbance (log(1/IR)) spectra.
Developing calibration models for bulk density prediction and particle size classification
There are many effective algorithms available for calibration and classification. Partial least squares regression (PLSR) is a popular multivariate calibration method. It is especially suitable for multi-component spectral analysis, making it a first choice in Vis/NIR spectroscopy, Raman spectroscopy and hyperspectral imaging. PLS discriminant analysis (PLS-DA), an extension form of PLS, aims to identify the variables and directions in a multivariate space that discriminate the known classes in the calibration set, and it is a well-established data analysis approach for chemometric classification. 33 In this study, PLSR and PLS-DA were used for determining wheat flour bulk density and classifying wheat flour particle size, respectively. The optimum number of latent variables chosen for the PLSR and PLS-DA models was determined by leave-one-out cross-validation method.
The coefficient of determination for calibration (R2) and prediction (r2), root mean squares error for calibration and prediction (RMSEC and RMSEP), bias (predicted fault) and the ratio of sample standard deviation to standard error of prediction (RPD) were calculated and used to evaluate the performance of PLSR calibration models. The performance of PLS-DA classification models was evaluated by calculating the correct classification rate (CCR) in both calibration and test sets, which is expressed by the following equation:

Prior to the model development, all 474 samples were randomly divided into two sets with 75% for calibration and the remaining 25% for prediction (independent validation for PLS models) or test (independent validation for PLS-DA models). For a given analysis, the calibration and prediction/test results, to some extent, may vary depending on how the calibration and prediction/test samples were actually selected. The random sampling procedure described above was repeated 10 times. The same calibration and test/prediction procedure was repeated, resulting a new set of R2 and r2 and RMSEC and RMSEP for each run. The statistics from the 10 runs were then averaged and are presented in the article.
PLSR and PLS-DA modeling were run in Matlab R2014a (The MathWorks Inc., Natick, Massachusetts, USA) and PLS Toolbox 5.0 (Eigenvector Research, Inc., Manson, Washington, USA).
Results and discussion
Statistics of bulk density and particle size
Statistics of bulk density for 474 wheat flour samples harvested from 2009 to 2012 measured by standard methods.
PS 1, 2, 3, 4, and 5 represent particle size classes of smaller than 63 µm, 63–75 µm, 75–93 µm, 93–120 µm, and larger than 120 µm, respectively.
Spectral features for wheat flour samples
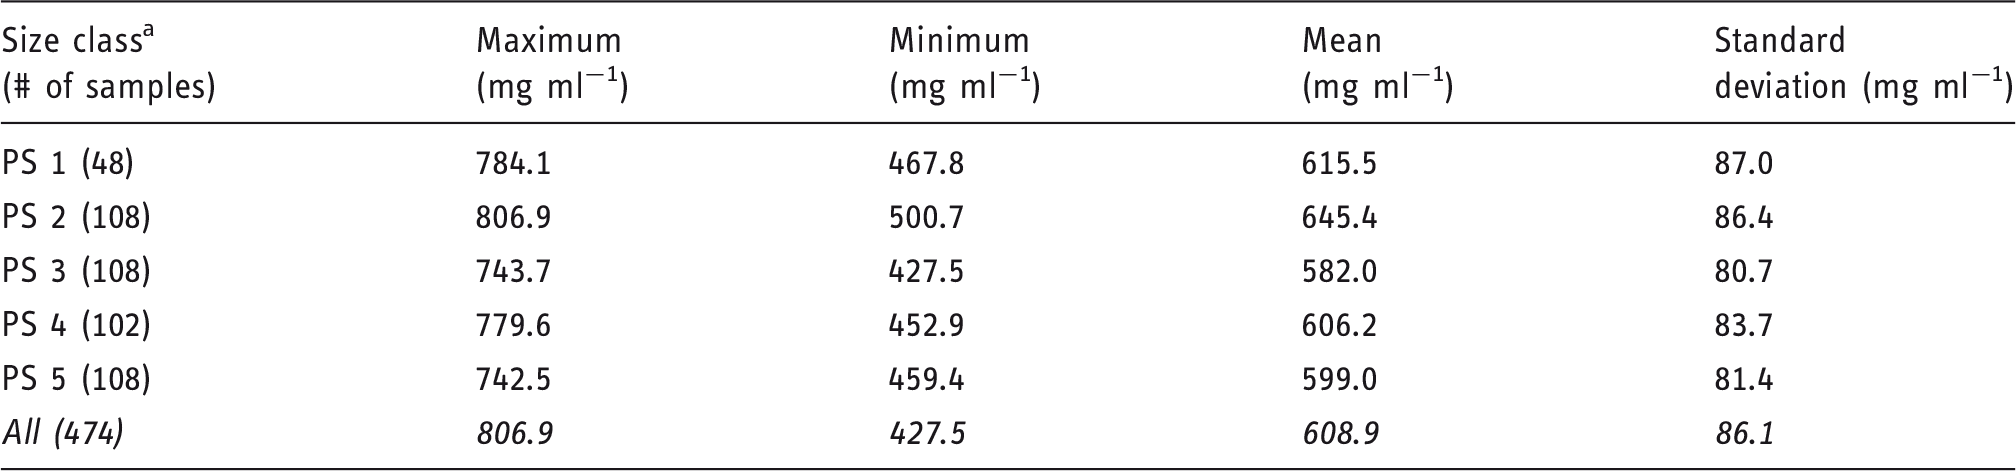
Figure 4(a) and (b) shows the relative absorbance spectra (log (1/R)) of all wheat flour samples obtained from the hyperspectral scattering images for 500–1000 nm and Vis/SWNIR absorbance measurements for 400–1000 nm, respectively. Absorbance (log (1/R)) for the wheat flour samples decreased with wavelength for both hyperspectral scattering and Vis/SWNIR measurements. There were four noticeable absorption peaks occurring to the mean spectra obtained by the hyperspectral scattering system. The absorption peak at about 670 nm is likely associated with the composition of flour pentosans.
35
The absorption peak around 750 nm should be associated with the third overtone of the O–H band and the fourth overtone of the C–H band,
36
whereas the absorption peak around 920 nm is related to the third overtone of C–H and CH2.
37
The absorption peak at 980 nm is due to the second overtone of O–H associated with water and carbohydrate.
38
This is consistent with the work of Yan et al.
39
and Cocchi et al.40,41 Yan et al.
39
gave the log (1/R) NIR spectra of wheat flour covering the spectral region of 570–1098 nm, in which the absorption peaks were clearly observed, while Cocchi et al.40,41 showed the log (1/R) NIR spectra of wheat flour over the spectral region of 400–2498 nm, from which only the general absorbance curve of wheat flour could be observed. On the other hand, the absorption peaks mentioned above were either not obvious or nonexistent in the Vis/SWNIR spectra, compared with hyperspectral scattering spectra. This was likely because that in the reflectance mode for Vis/SWNIR spectral measurement, most of the received light did not go deep into the flour sample, before it was being reflected and then received by the sensor. In other words, there would have been much less interaction between the light and flour particles for the Vis/SWNIR sensing mode, compared to the hyperspectral scattering configuration. Moreover, Vis/SWNIR spectra would also contain more specular reflectance because of the specific arrangement of the lighting and detecting optic fibers for the reflectance mode. The spectral data in Figure 4 suggest that hyperspectral scattering was likely more sensitive to the composition of wheat flour samples, compared to Vis/SWNIR spectroscopy, even though the spectral resolution for the two measurement systems was about the same (3.1 nm/pixel versus 3.3 nm/pixel).
Relative absorbance spectra of wheat flour samples extracted from the hyperspectral scattering images over the spectral region of 500–1000 nm (a) and Vis/SWNIR absorbance spectra over 400–1000 nm (b).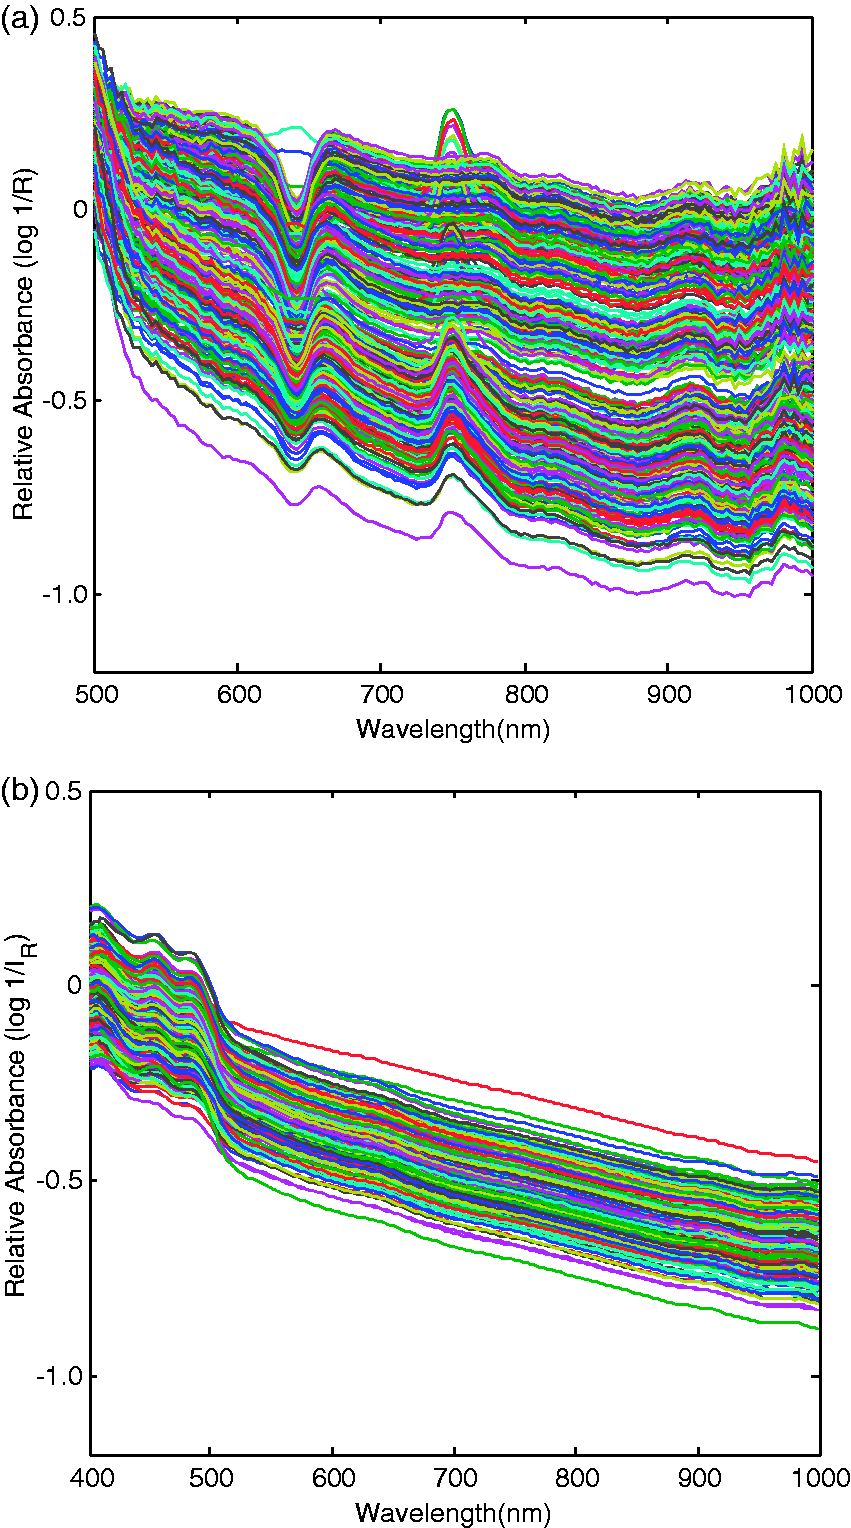
Figure 5(a) shows average absorbance spectra (log (1/R)) obtained by hyperspectral scattering for each particle size class of wheat flour samples. There were large differences in the average hyperspectral scattering spectra for the five size fraction classes over the spectral region of 550–1000 nm; values of the average absorbance spectra (log (1/R)) decreased with the particle size, except for the classes of PS 1 and PS 2, whose difference was minimal over the entire spectral region. The minimal difference or overlapping of the two average absorbance spectra for PS 1 and PS 2 could be due to their small particle size differences (≤63 µm for PS 1) and (63–75 µm for PS 2). The range of difference for the five classes reached minimal over the spectral region of approximately 800–1000 nm.
Average absorbance spectra for the five particle size classes of wheat flour samples obtained by hyperspectral scattering covering 500–1000 nm (a) and by the Vis/SWNIR spectroscopy covering 400–1000 nm (b).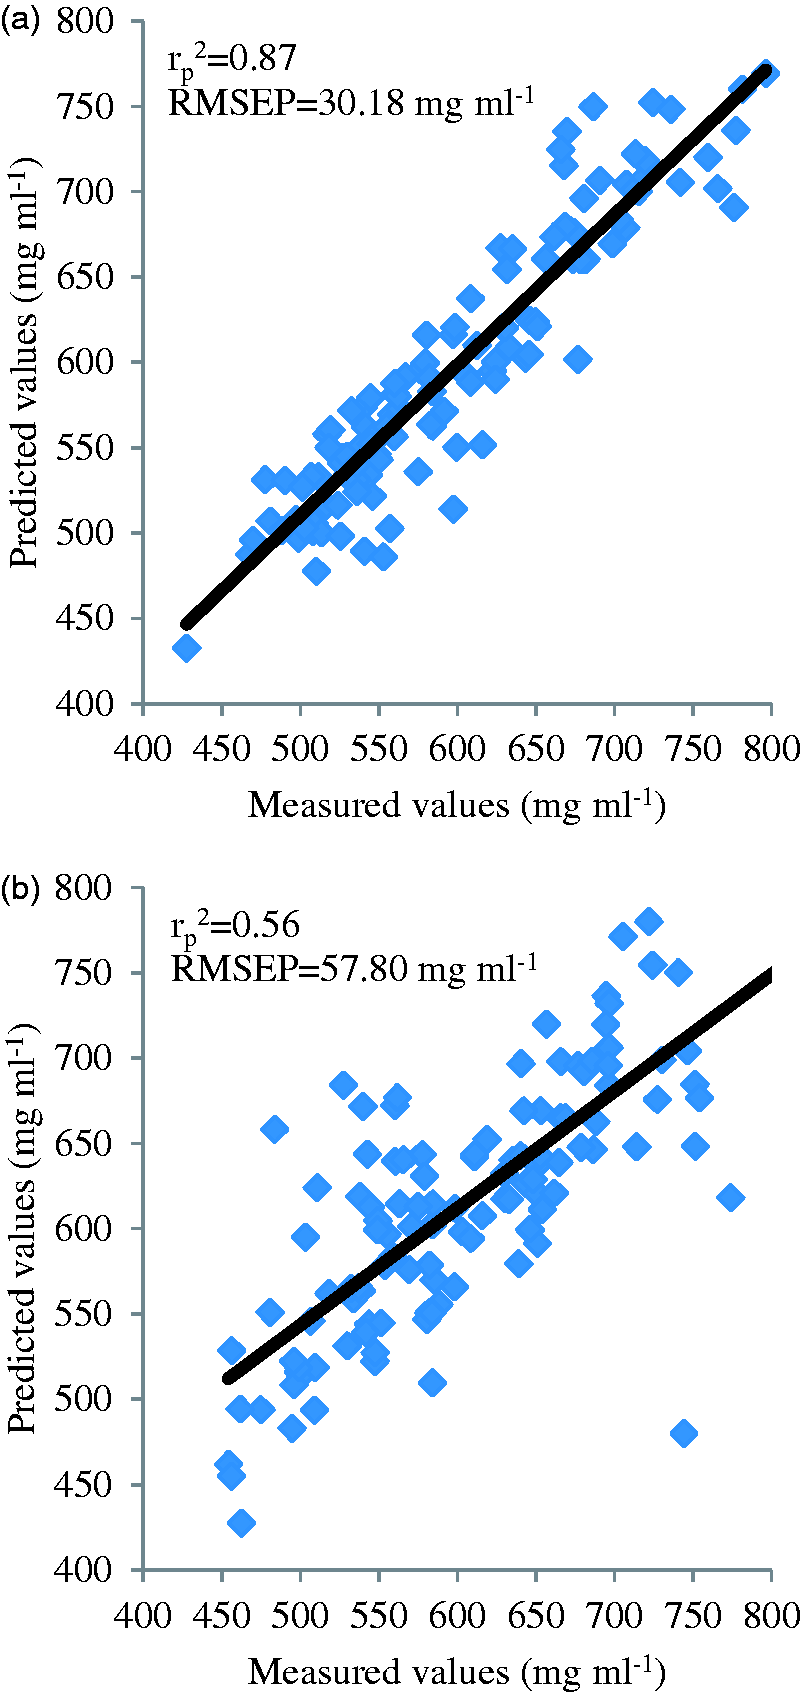
However, the pattern of change for the average Vis/SWNIR absorbance spectra for the five size classes was distinctly different (Figure 5(b)). First, the range of difference for the five average absorbance spectra was much smaller than those observed from the hyperspectral scattering data (Figure 5(a)). Second, the pattern of change in the average absorbance spectra for the five classes was also different. Over the spectral region of 400–530 nm, average absorbance (log (1/IR)) increased consistently with the increase of particle size. However, for the spectral region of approximately 530–1000 nm, no consistent pattern of change was observed for the five size classes. The results in Figure 5(a) and (b) clearly suggest that particle size had a far greater influence on hyperspectral scattering measurements than on Vis/SWNIR measurements. In other words, hyperspectral scattering measurements were more sensitive to the scattering of light in the flour samples, compared to Vis/SWNIR measurements. This has also confirmed our initial conclusion that the hyperspectral scattering technique can enhance the measurement of light scattering in diffusive materials like powder foods. In conjunction with the earlier discussion about the prominent absorption peaks observed from the hyperspectral scattering data, it is reasonable to draw a preliminary qualitative conclusion that hyperspectral scattering can better describe the absorption and scattering characteristics of diffusive materials like wheat flour samples.
Bulk density prediction using PLSR
Bulk density calibration and prediction results for wheat flour samples using hyperspectral scattering imaging (HSI) and Vis/SWNIR spectroscopy with different spectra pretreatments. a
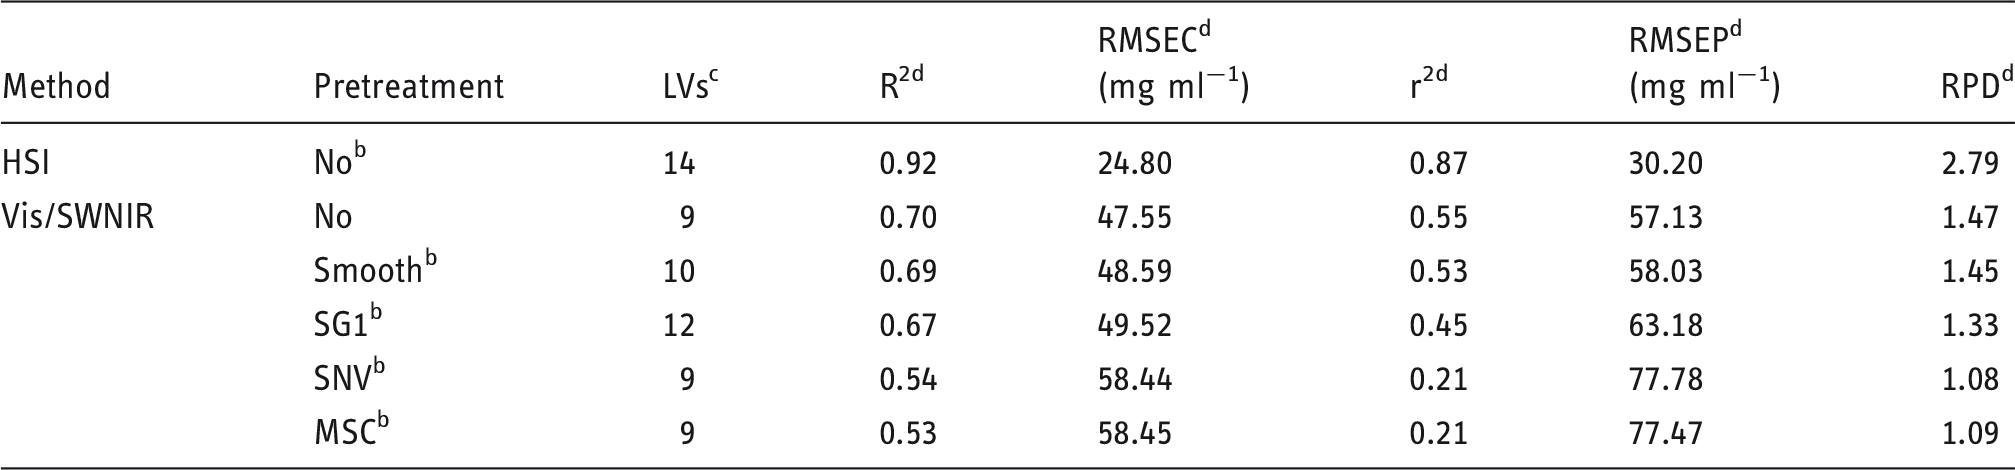
The statistical values reported here are averages of 10 calibration/prediction runs.
“No” stands for no pretreatment for spectra; “Smooth,” smoothing of five data points; “SG1,” the first-order Savitzky-Golay derivative; “SNV,” standard normal variate; “MSC,” multiplicative scatter correction.
LVs is the number of PLS latent variables.
R2 and r2 are the coefficient of determination for calibration and prediction, respectively; RMSEC and RMSEP, root mean squares errors for calibration and prediction, respectively; RPD, the ratio of sample standard deviation to standard error of prediction.
Hyperspectral scattering achieved significantly better predictions for both calibration and prediction (R2 = 0.92 and r2 = 0.87), compared to the best prediction results (r2 = 0.55) for Vis/SWNIR spectra. The comparison became even starker, as measured by the RMSEP; it was only 30.20 mg ml−1 for hyperspectral scattering, compared with 57.13–77.78 mg ml−1 for Vis/SWNIR spectroscopy with the five pretreatments (including no pretreatment). Figure 6(a) and (b) shows correlations between measured and PLSR-predicted bulk density for one run of wheat flour samples for hyperspectral scattering and Vis/SWNIR spectroscopy. The residual predictive deviation (RPD) is often applied to evaluate the performance of a prediction model. The value of RPD for hyperspectral scattering was 2.79 compared with the RPDs of 1.08–1.47 for Vis/SWNIR spectroscopy with the five different pretreatments. An RPD value between 2.5 and 3 or above corresponds to good to excellent prediction accuracy, while an RPD value between 1.5 and 2 means that the model can discriminate low from high values.
42
The results showed that hyperspectral scattering was superior to Vis/SWNIR spectroscopy for bulk density prediction of food powder.
Prediction results from 1 of 10 model runs for the bulk density of wheat flour samples using hyperspectral scattering (500–1000 nm) (a) and Vis/SWNIR spectroscopy (400–1000 nm) (b).
Particle size classification using PLS-DA
Particle size classification results for the calibration and test sets of wheat flour samples using hyperspectral scattering and visible/shortwave near-infrared (Vis/SWNIR) spectroscopy. a
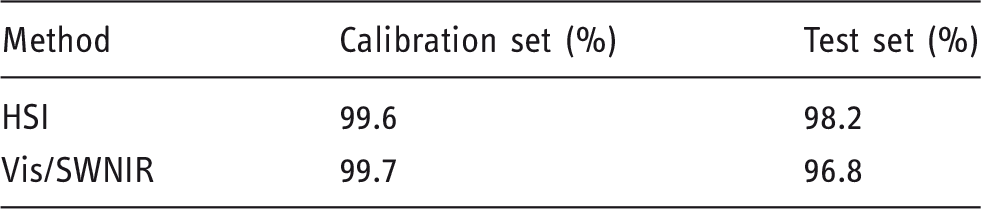
The statistical values shown here are averages of 10 calibration/test runs.
Results for classification of the test set of wheat flour samples into five particle size classes using hyperspectral scattering.
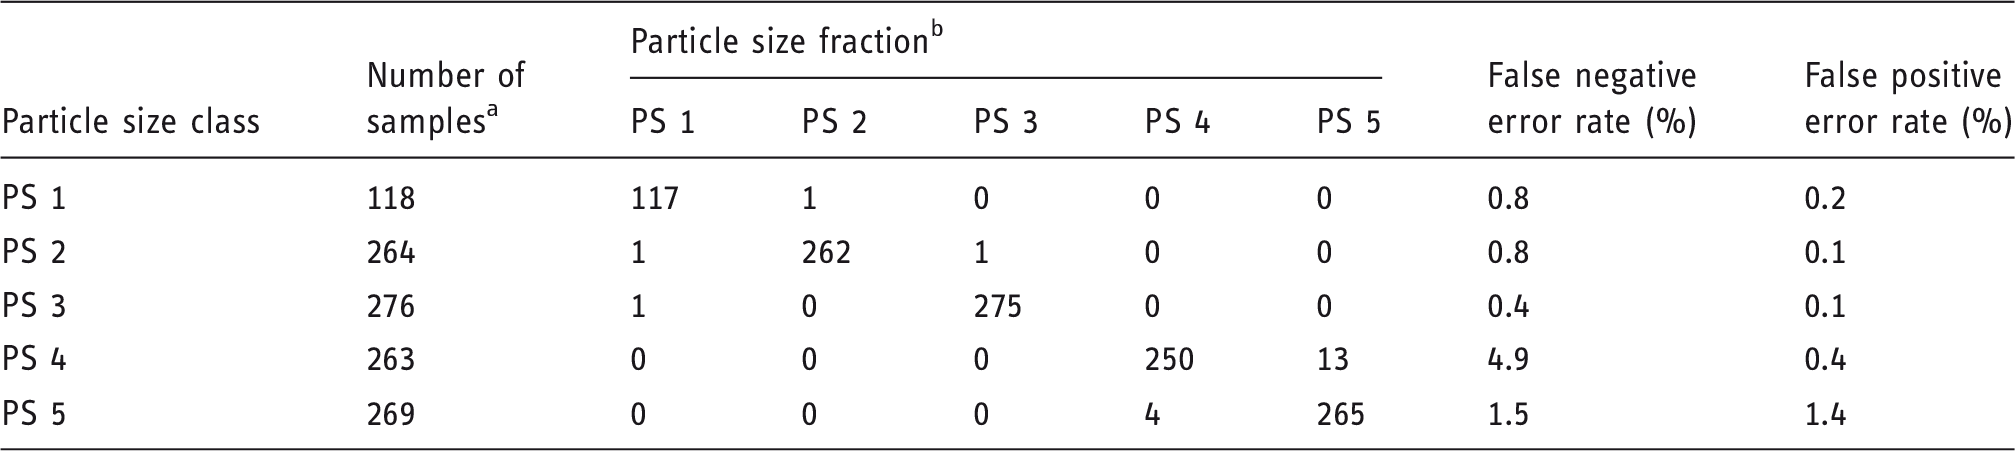
Numbers represent the sums of 10 runs.
PS 1, PS 2, PS 3, PS 4, and PS 5 represent particle size classes of smaller than 63 µm, 63–75 µm, 75–93 µm, 93–120 µm, and larger than 120 µm, respectively.
Results for classification of the test set of wheat flour samples into five particle size classes using visible/shortwave near-infrared (Vis/SWNIR) spectroscopy.
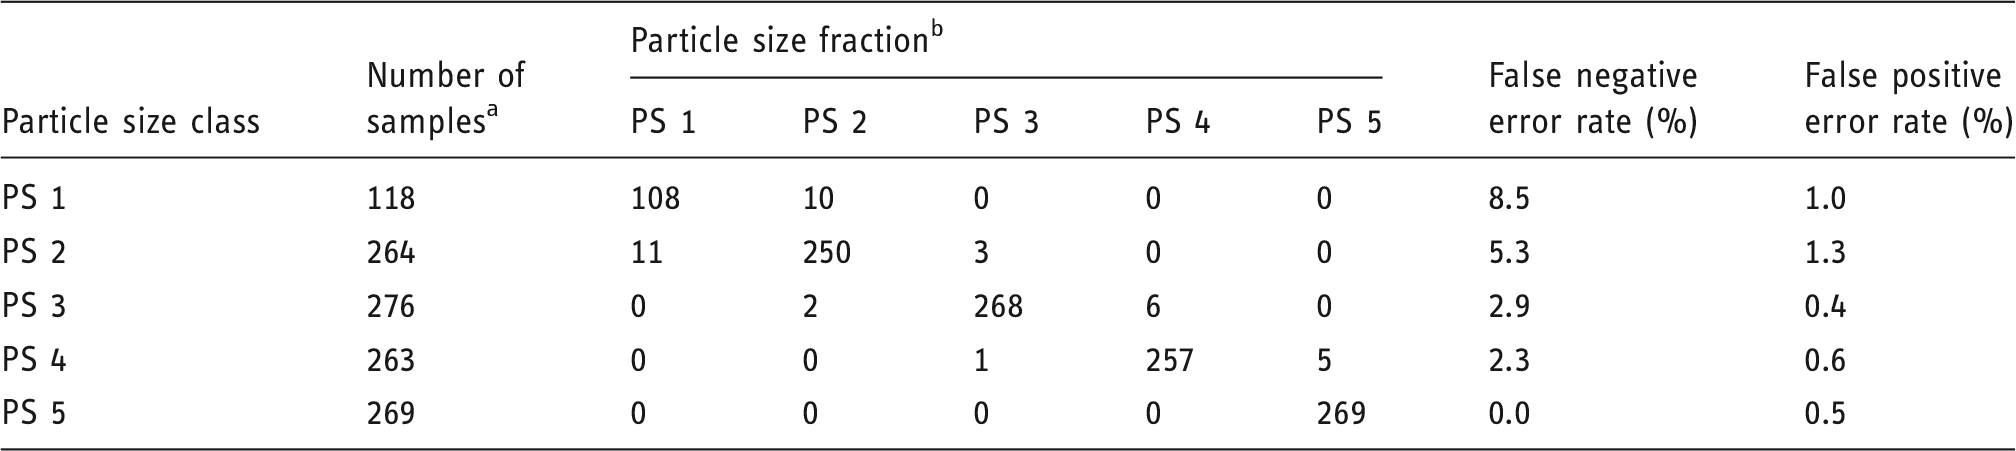
Numbers represent the sums of 10 runs.
PS 1, PS 2, PS 3, PS 4, and PS 5 represent particle size classes of smaller than 63 µm, 63–75 µm, 75–93 µm, 93–120 µm, and larger than 120 µm, respectively.
This study showed that hyperspectral scattering over the wavelengths of 500–1000 nm can provide better measurement of the bulk density and particle size class, compared to Vis/SWNIR spectroscopy. This is mainly because the hyperspectral scattering technique can enhance the measurement of scattering properties of wheat flour samples, which are strongly related to the bulk density and size of particles, two important parameters for physical characterization of wheat flour and many other food power materials. Hence hyperspectral scattering can be used as a tool for laboratory and industry applications, where knowledge of these two properties is needed.
Conclusions
This research evaluated two optical sensing methods, i.e. hyperspectral scattering imaging (500–1000 nm) and Vis/SWNIR reflectance spectroscopy (400–1000 nm), for measurement of the particle size and bulk density of wheat flour samples. Hyperspectral scattering measurements were more sensitive to the variation in particle size, and it was also able to detect several prominent absorption peaks related to specific chemical compositions of the powder samples, which were either nonexistent or inconspicuous for the Vis/SWNIR spectra. The hyperspectral scattering technique gave much better predictions of bulk density, with the r2 of 0.87, RMSEP of 30.20 mg ml−1, and RPD of 2.79, compared with the relatively poor Vis/SWNIR results of r2 = 0.55, RMSEP = 57.13 mg ml−1, and RPD = 1.47. Hyperspectral scattering and Vis/SWNIR spectroscopy achieved high classification accuracies of 98.2% and 96.8%, respectively, when the powder samples were classified into five particle size classes. This research demonstrated that hyperspectral scattering technique over 500–1000 nm is better suited for determining bulk density and particle size of wheat flour samples.
Footnotes
Disclaimer
Mention of commercial products or trade names is solely for providing factual information and does not imply recommendation or endorsement by the U.S. Department of Agriculture. USDA is an equal opportunity provider and employer.
Declaration of conflicting interests
The author(s) declared no potential conflicts of interest with respect to the research, authorship, and/or publication of this article.
Funding
The author(s) disclosed receipt of the following financial support for the research, authorship, and/or publication of this article: Qibing Zhu, Yongchun Xing, and Min Huang would like to acknowledge financial support from the National Natural Science Foundation of China (Grant Nos. 61271384 and 61275155), the 111 Project (B12018) and Qing Lan Project.