
Abstract
To improve the recycling rate of wooden materials, it is necessary to classify wood waste by disposal method and usage. In the industrial manufacture of these materials, rapid and accurate determination of their chemical and physical properties is critical for a stable supply of wood products with reliable quality. In this study, we investigated a discriminant analysis process for waste wood products using hyperspectral imaging with a newly developed repetitive principal component analysis. Hyperspectral images of four types of wood waste (plywood coated with resin, preservative-treated wood, hardwood and softwood) were acquired. The mean spectrum of each sample was extracted from a hypercube in order to build a classification model. A novel classification method based on principal component analysis, named repetitive principal component analysis, was developed. A total of three repetitions of principal component analysis were performed to classify the four types of wood waste. Cross-validated results of repetitive principal component analysis resulted in classifications greater than 85% for any of the four wood waste types. The discriminant model was then applied to single-pixel spectra of the hypercube to form a prediction map. Hyperspectral imaging, with the aid of the new repetitive principal component analysis discriminant analysis, is a powerful tool in wood recycling processes.
Keywords
Introduction
Wood-based materials are generally regarded as renewable and eco-friendly from the viewpoint of carbon storage and sustainable material. Once discarded, they are classified by material type and are then used as raw materials for new products such as particle boards, papers and fillers for wood–plastic composites. Some of wood waste which cannot be used in material recycling can be burnt to obtain thermal energy or landfilled. With the objective of improving the recycling ratio and reducing carbon dioxide emissions, it is necessary to improve the longevity of wood as a ‘wood-based material’. Wooden constructions comprise many types of wood-based materials: plywood for sheathing and walls, solid wood and glue-laminated timber for posts and beams or particle or fibre board for furniture. Since most wood waste is produced as demolition debris, it must be classified properly based on the purpose of recycling in order to improve the material recycling ratio.
When it comes to wood recycling mills, the shape and surface condition of wood waste collected from demolition sites vary widely. It is necessary to develop an analysis technique that can rapidly measure a large area without contact. Spectral imaging might be suitable for assessing a massive amount of wood waste at a time. From a material recycling standpoint, it is necessary to eliminate non-recyclable materials from the overall waste. Furthermore, solid wood must be separated from other wood waste.
In particle board production using recycled wood, wood waste is checked using a metal detector, in order to detect metal fastenings and fittings. It is then separated into chips and other non-wood components via sieving and centrifugation. However, these methods cannot grade wood waste by the type of wood-based material. Although visual inspection enables the classification of such materials or tree species, it is not realistic because it is slow and labour intensive, which results in inefficient processing.
Near infrared (NIR) spectroscopy has been widely used for fast, non-destructive quality control in numerous fields. Furthermore, in the field of wood science, the potential of NIR spectroscopy as a non-destructive tool has been demonstrated by many researchers.1–8 The basic technique for assessing wood with NIR spectroscopy was summarized by Sandak et al. 1 In addition to the determination of chemical composition, 2 NIR spectroscopy has a potential for the quality evaluation of logs, 3 identification of wood species 4 and classification of wood and wood-based material. 5 There are many absorption bands in wood-based materials due to the overtone and combination of the vibrations of functional groups such as CH, OH and NH. 9 In previous research, the feasibility of near infrared imaging for the identification of wood-based materials was examined.6–8 Recently, NIR imaging analysis has been used with hyperspectral imaging (HSI) for the determination of wood density,10,11 moisture content, 12 assessment of the extractives content 13 and identification of compression wood. 14 Based on the concentrations of chemical components, NIR can be applied to both qualitative and quantitative analyses.
However, diffuse reflectance light is strongly influenced by scattering created at the surface of an object. Thus, the surface condition must be controlled if NIR spectroscopy is to be used for industrial applications. 15
Since an NIR spectrum comprises hundreds of variables that have strong multicollinearity, multivariate analyses, such as the soft independent modelling of classification,6–8,16–18 partial least squares regression discriminant analysis19,20 and artificial neural network or support vector machine20,21 are often employed. These classifications are mostly based on the projection of a vector in linear space to enhance the differences between classes. However, projecting in linear space means compressing spectral information, which sometimes results in the loss of smaller spectral variation. When several types of classes are considered, those with small spectral differences might not be classified adequately.
The aim of this study was to develop a classification technique based on NIR spectral analysis. HSI was employed to obtain the reflectance spectra with high spatial resolution. Four types of wood waste (plywood coated with resin, preservative-treated wood, softwood and hardwood) collected from a recycling mill were analysed to build a discrimination model using the newly developed classification method named repetitive principal component analysis (rPCA). The classification ratios of the discrimination model were validated using a cross-validation method, and finally, models were applied to build a prediction image.
Materials and methods
Sample preparation
Wood waste was collected from a wood recycling mill in Nagoya city. Figure 1 shows the collection site. These materials originate from the demolition debris of wooden constructions. The collected samples were classified into four categories: solid wood (softwood), solid wood (hardwood), preservative-treated wood and plywood coated with resin (Figure 2). The preservative-treated wood was impregnated with creosote. The surface of the plywood coated with resin was coated with a polyurethane resin. All the samples were cut into 50 mm × 50 mm × 15 mm squares, and their surfaces were wiped with a dry paper towel to remove any mud. Twenty-five specimens were prepared for each category (a total of 100 specimens).
View of a pile of wood at a recycling mill. Representative surfaces of four types of wooden waste: (a) plywood coated with resin, (b) preservative-treated wood, (c) hardwood and (d) softwood.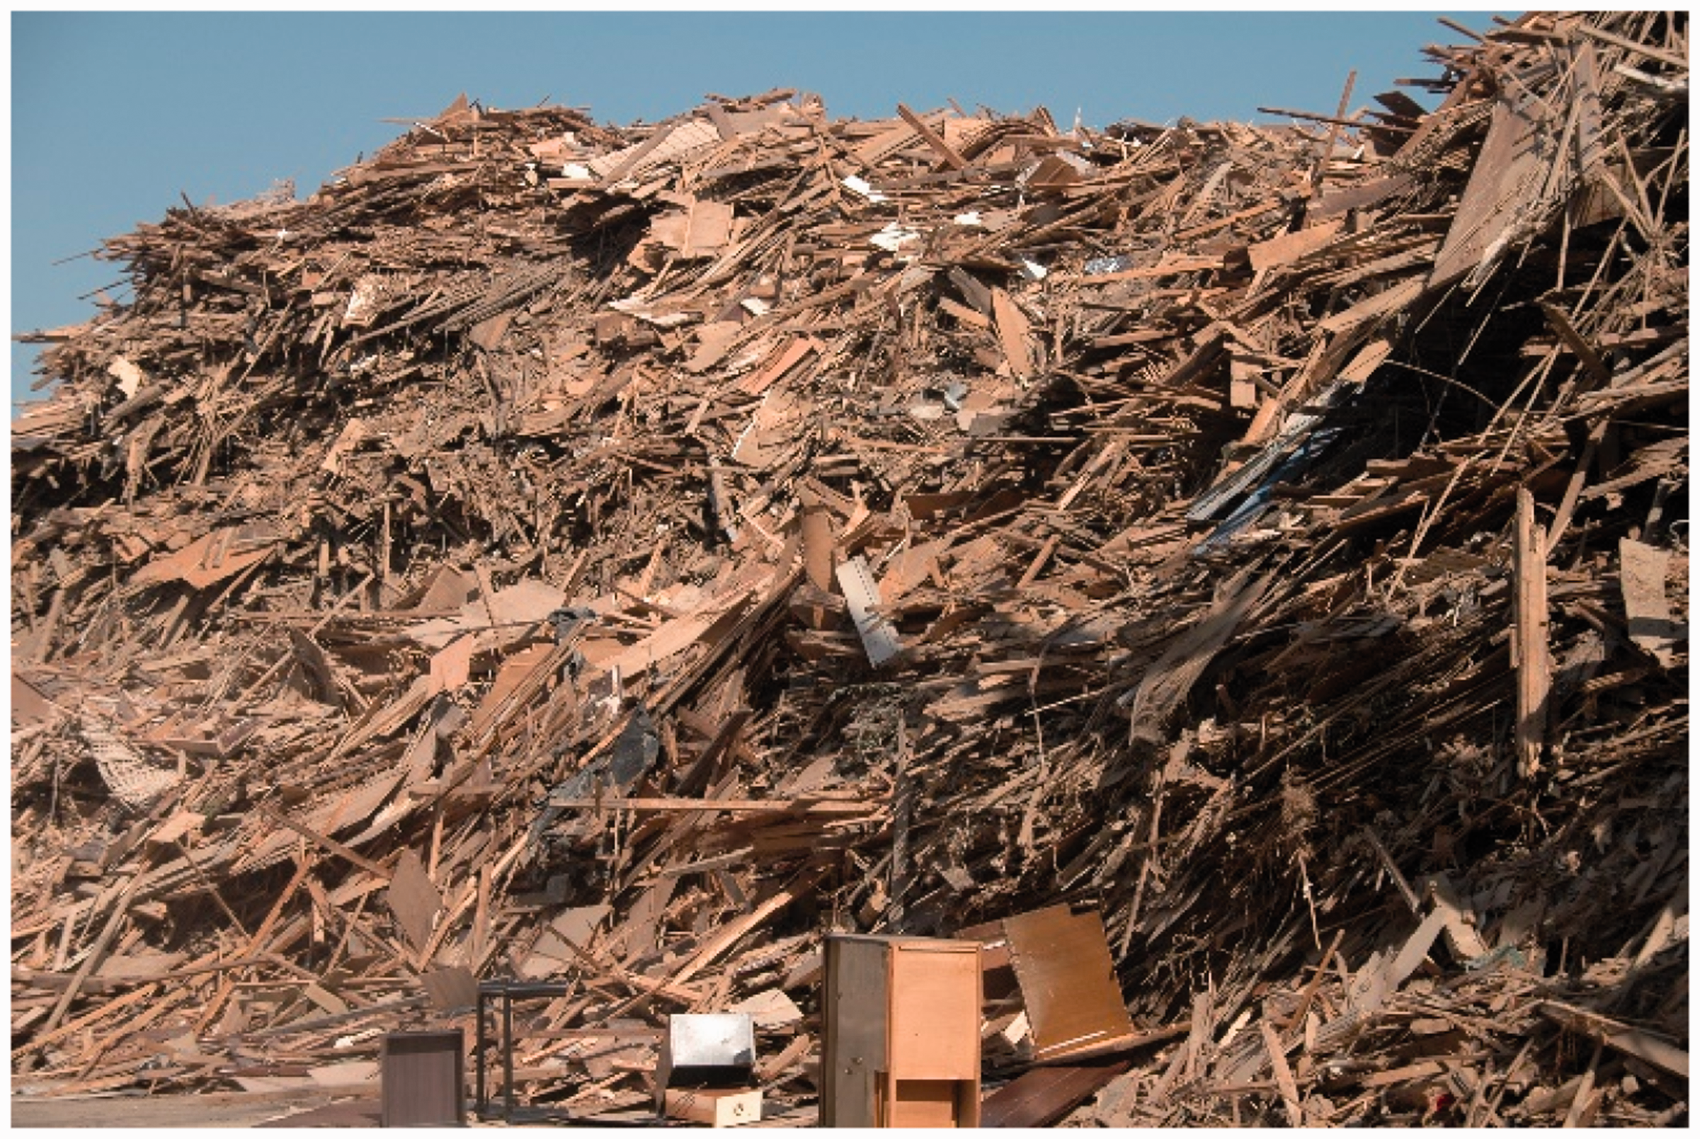
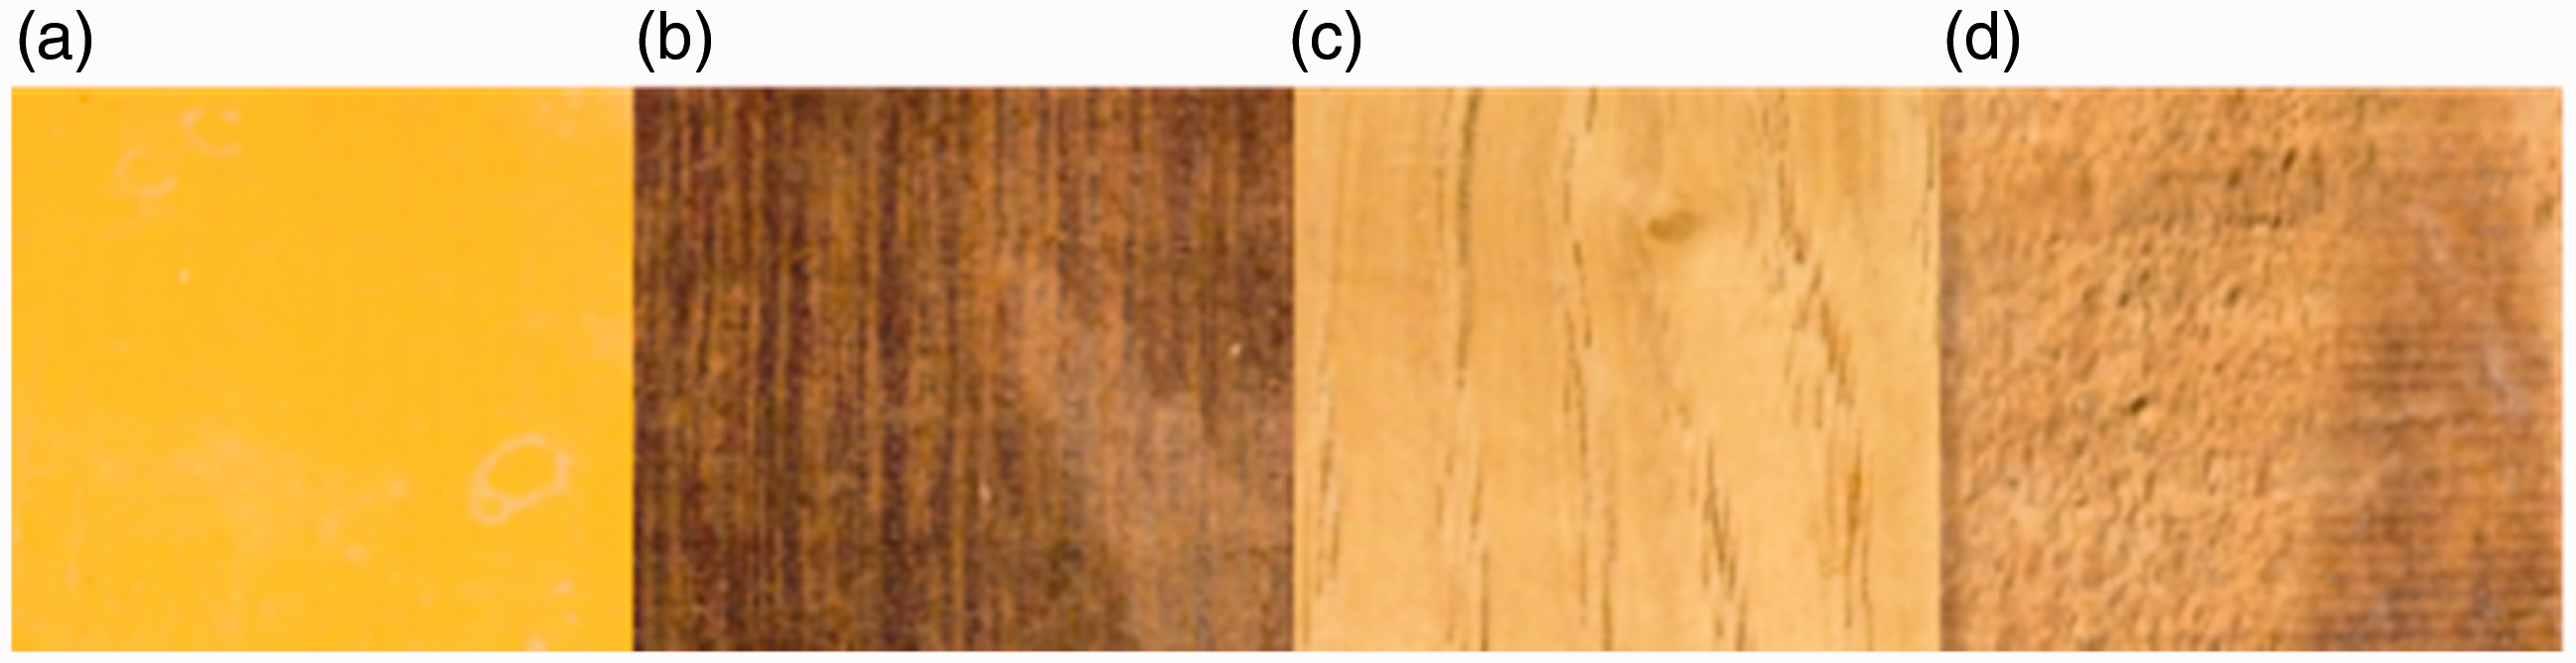
Image acquisition and spectra extraction
Image data acquisitions were carried out using a HSI system (Compovision, Sumitomo Electronic Industries, Ltd, Osaka, Japan). This is a push-broom line scanning camera covering the spectral range of 1046–2546 nm with a 6 nm wavelength interval. The standard pixel size was 0.44 mm × 0.44 mm with a 140 mm field width. The moving speed of the conveyer was set to 45 mms−1, and the exposure time was set to 3 mms−1 for each line. Finally, 534 (lines) × 237 (wavelength) × 320 (field width) pixels of hypercube data were acquired. Each pixel corresponded to a 16-bit reflectance value. Two halogen lamps were placed over the conveyer to illuminate the samples at an angle of 45° from both sides of the sample. Dark signals were acquired by covering the lens with the lens cap, and a white plate image was acquired as a reference before the acquisition of sample images. Images of four samples were taken simultaneously. Both were acquired before each sample image acquisition. The raw data were transformed into corrected reflectance as follows
Data processing – rPCA
The aim of this study was to develop a novel classification model for waste wood products based on HSI. The authors developed the concept of a classification method based on rPCA.
22
As with conventional classification methods, rPCA needs model building using calibration data that are set before the practical application. The details of rPCA are as follows: a first round of PCA is performed for all the calibration samples consisting of N classes. Then, one class is classified by the single threshold value for a particular score value. In this study, PC2 scores were used for classification. The first round of the second PC2 loading vector and the threshold value for the PC2 score will be used as the classification model for Class 1. Then, PCA is performed again without the Class 1 sample. Another class is classified by the single threshold value for the second round of the PC2 score value. PCA is repeated N−1 times until all classes were classified. The outline of model building and discrimination of unknown samples by rPCA is illustrated in Figure 3.
The repetitive principal component analysis (rPCA) process.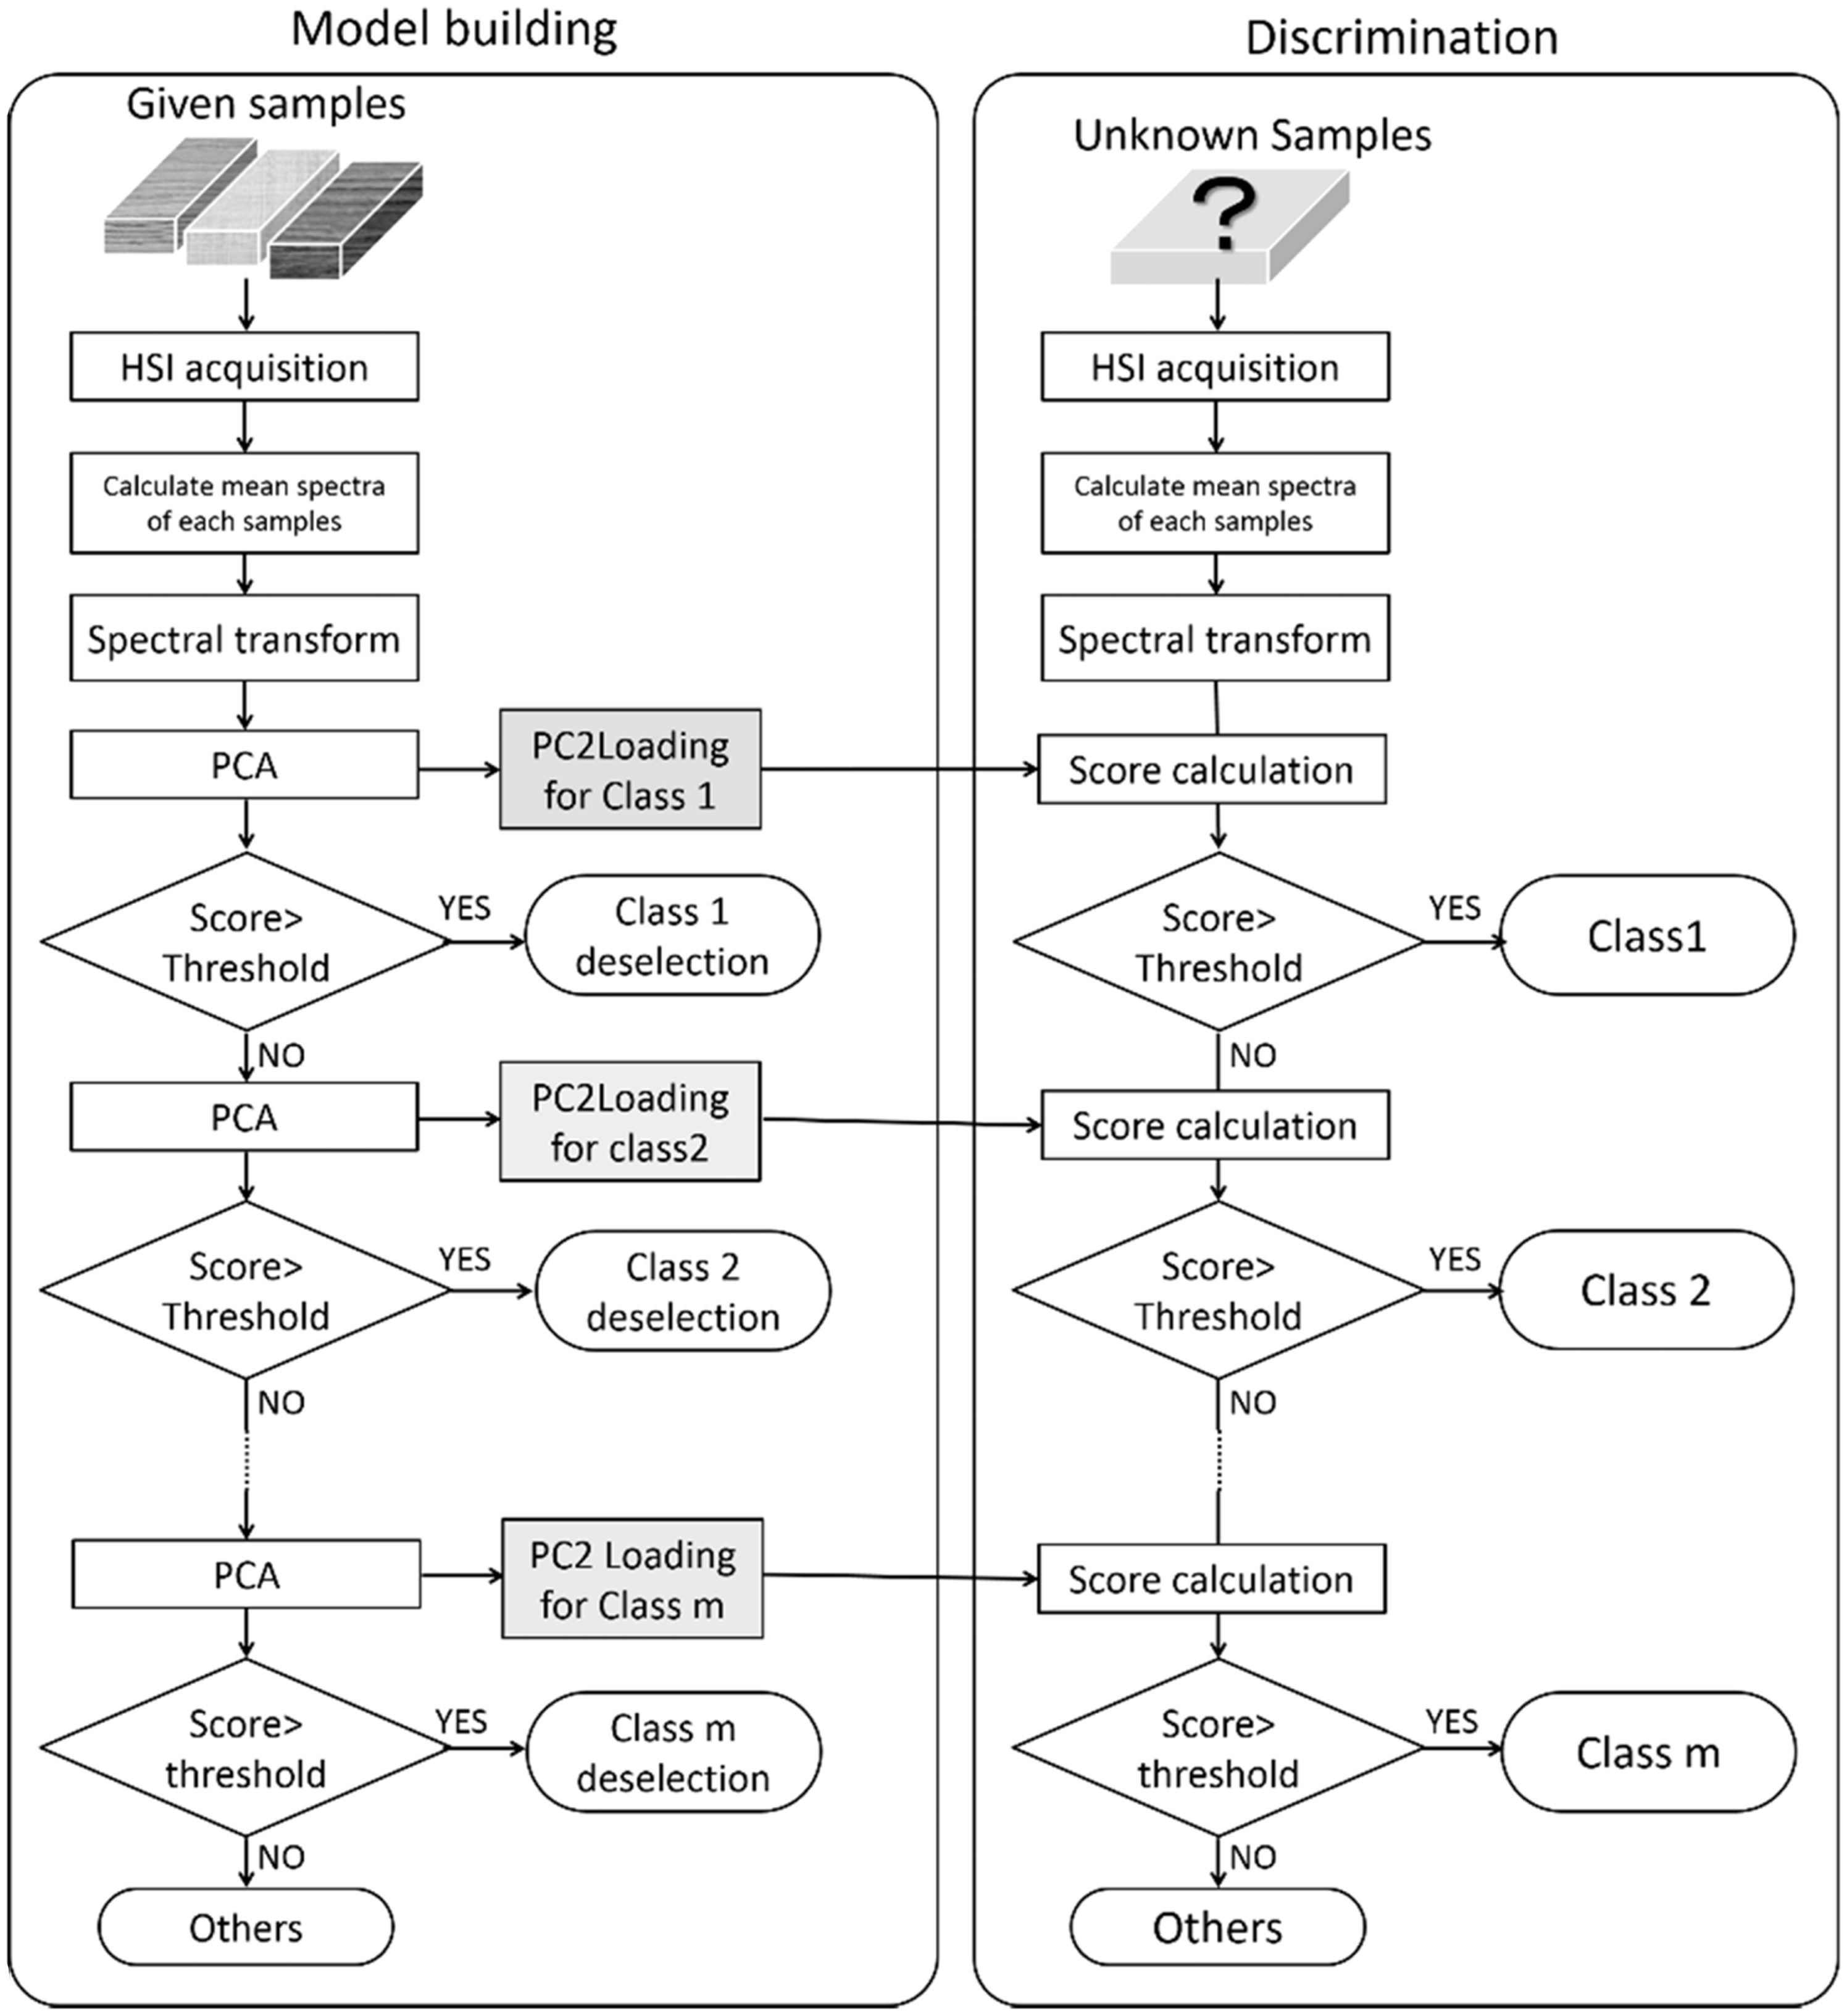
As mentioned above, rPCA classifies each category one by one. In other words, each round of PCA discriminates the samples into two groups which are the target group and the remaining groups. Only a few PCs will be required for each discrimination. In this study, PCA was performed without any pre-treatment such as mean centring and auto scaling. In this case PC1 score will not be mean centred. Therefore, PC2 was selected to be the discriminating principal component. All samples are ultimately assigned a certain class. Furthermore, rPCA is performed repeatedly with different data sets. Thus, the loading vectors used for the discriminant model are not necessarily orthogonal to each other. These characteristic features will contribute to a robust classification.
Results and discussion
Band assignment of mean spectra
Figure 4 shows the example of second-derivative spectra of four kinds of the wood wastes. Several characteristic absorptions are summarized in Table 1.
9
Strong absorptions around 1433 and 1924 nm were observed for all types of wood waste. The 1433 nm absorption was assigned to the first overtone of the OH symmetric stretching vibration due to cellulose. The 1924 nm absorption was due to a combination of the deformation and asymmetry stretching vibration of OH. There were also several characteristic absorption peaks for each wood waste type. Absorptions at 1205 and 1685 nm in the spectra of preservative-treated wood were assigned to the second and first overtones of CH stretch, respectively, in polycyclic aromatic hydrocarbons. In the case of plywood coated with resin, there were absorptions at 1685 nm (first overtone of the stretching vibration of CH) and 2156 nm (combination due to the amide bond) due to the surface polymer. The reflectance spectra of softwood and hardwood were similar. However, hardwood had a small absorption at 1717 nm (CH3). This may due to the different structure of lignin: in softwood, only guaiacyl lignin exists, whereas the lignin in hardwood comprises both guaiacyl and syringyl.
Representative second-derivative spectra of the wooden wastes and their significant absorption bands: 1 – 1205 nm, 2 – 1433 nm, 3 – 1685 nm, 4 – 1717 nm, 5 – 1924 nm and 6 – 2156 nm. Note that the raw spectra were obtained as reflectance, thus absorption peaks of second derivative appear as positive peak. Summary of band assignments.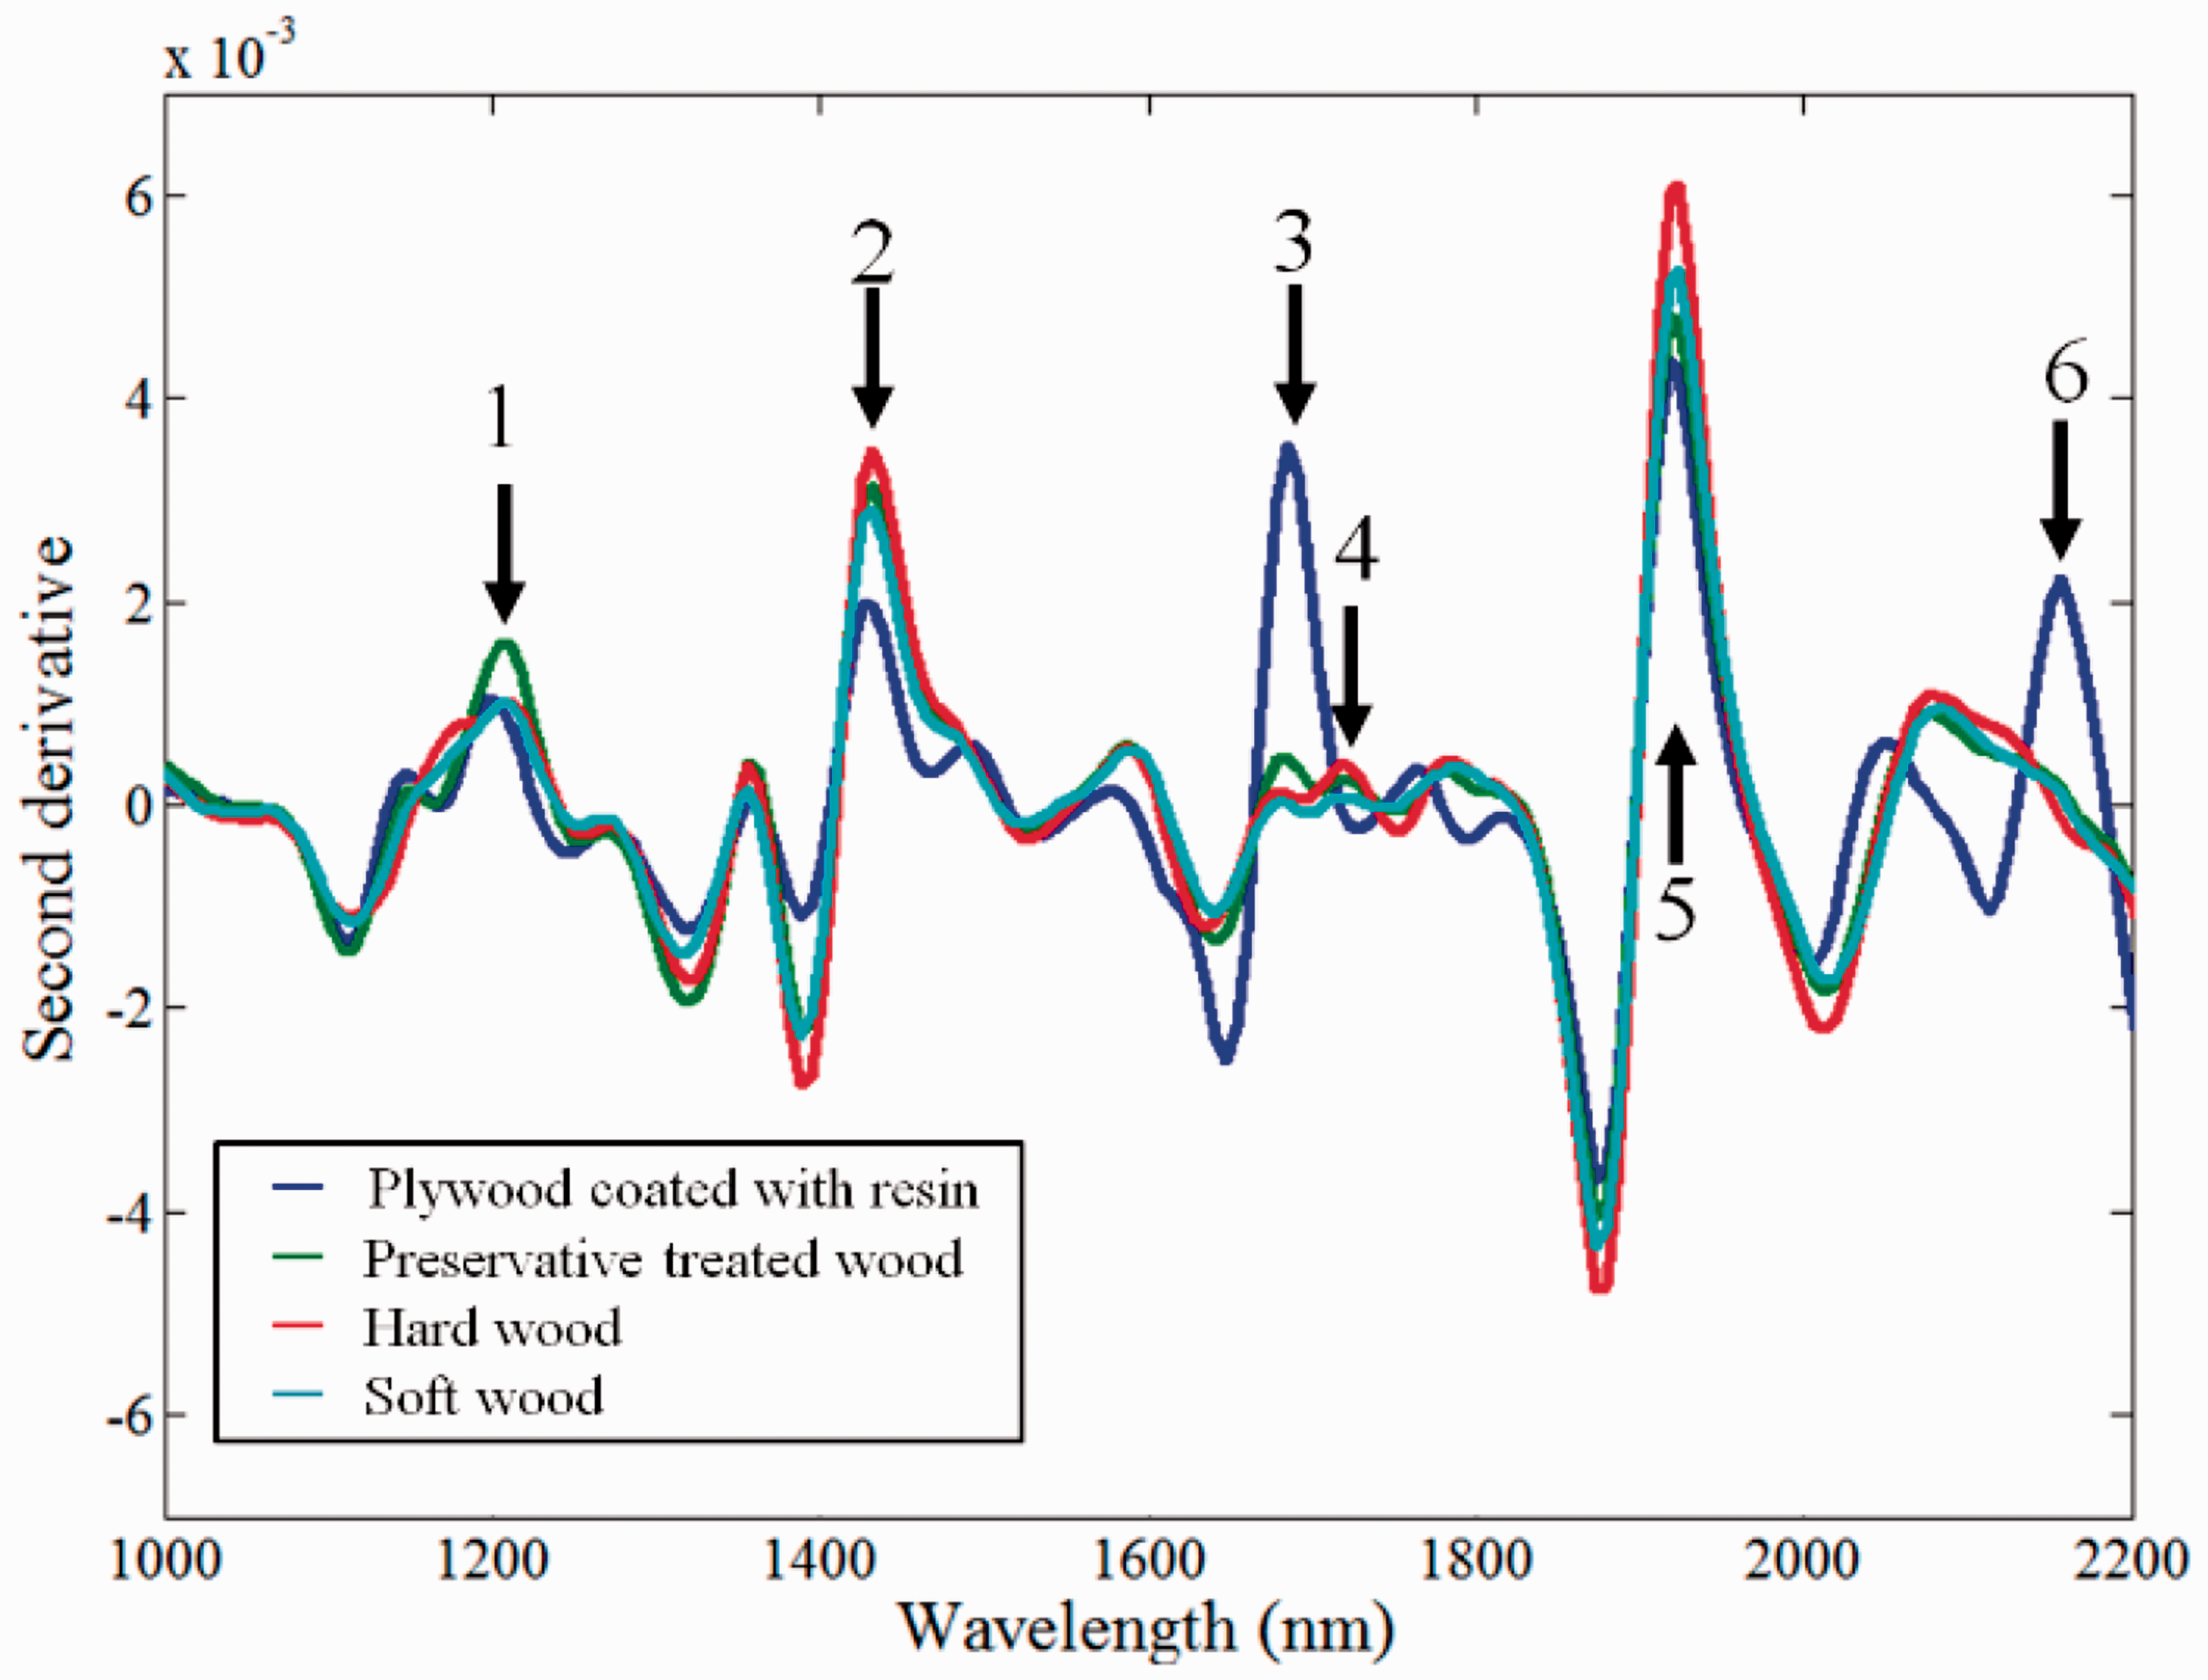
Discriminant model building
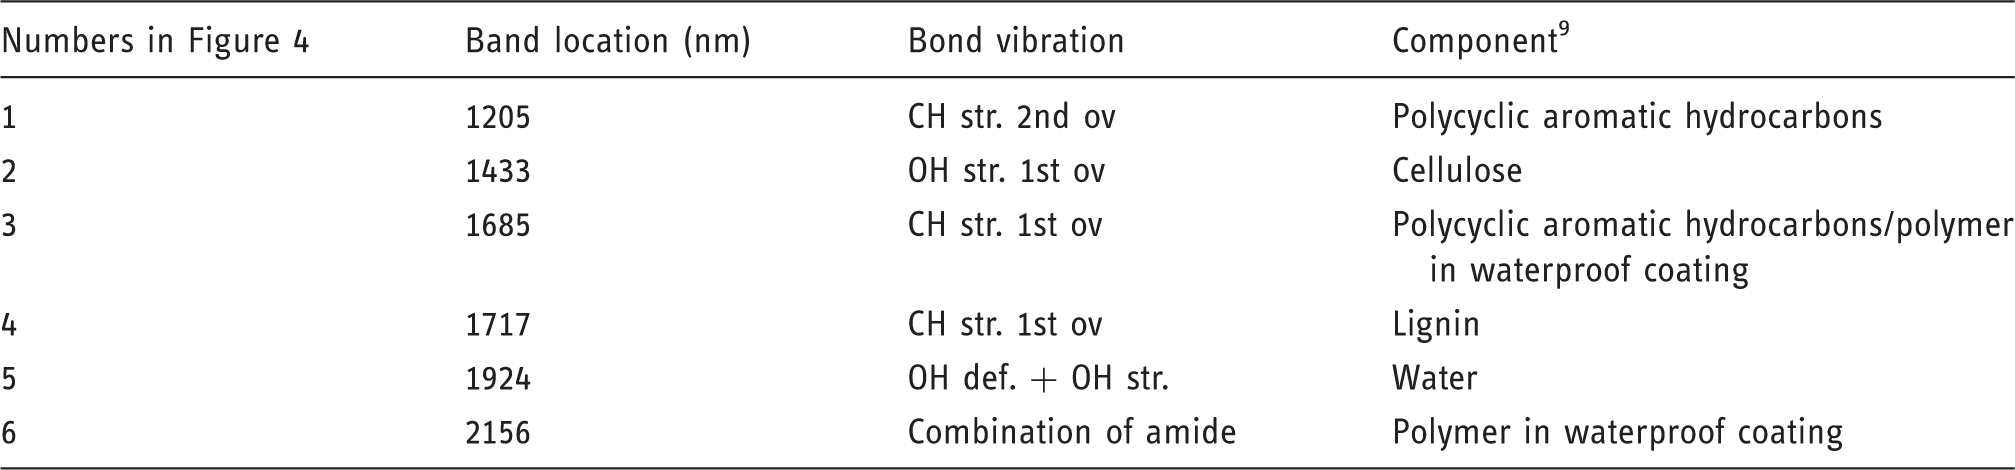
In this study, rPCA was conducted on 100 mean spectra, and PC2 was applied for discriminating each type of wood waste. The PC2 score values for classification are shown in Figure 5. The threshold for each classification model was set to zero. Plywood coated with resin was classified by the first PCA. The second PCA was then performed on the remaining 75 spectra without plywood coated with resin. As shown in Figure 5, the second round of PCA classified preservative-treated wood from untreated wood. Finally, softwood was discriminated by the third PCA.
Principal component analysis (PCA) score values for the discriminant model of (a) plywood coated with resin, (b) preservative-treated wood and (c) softwood.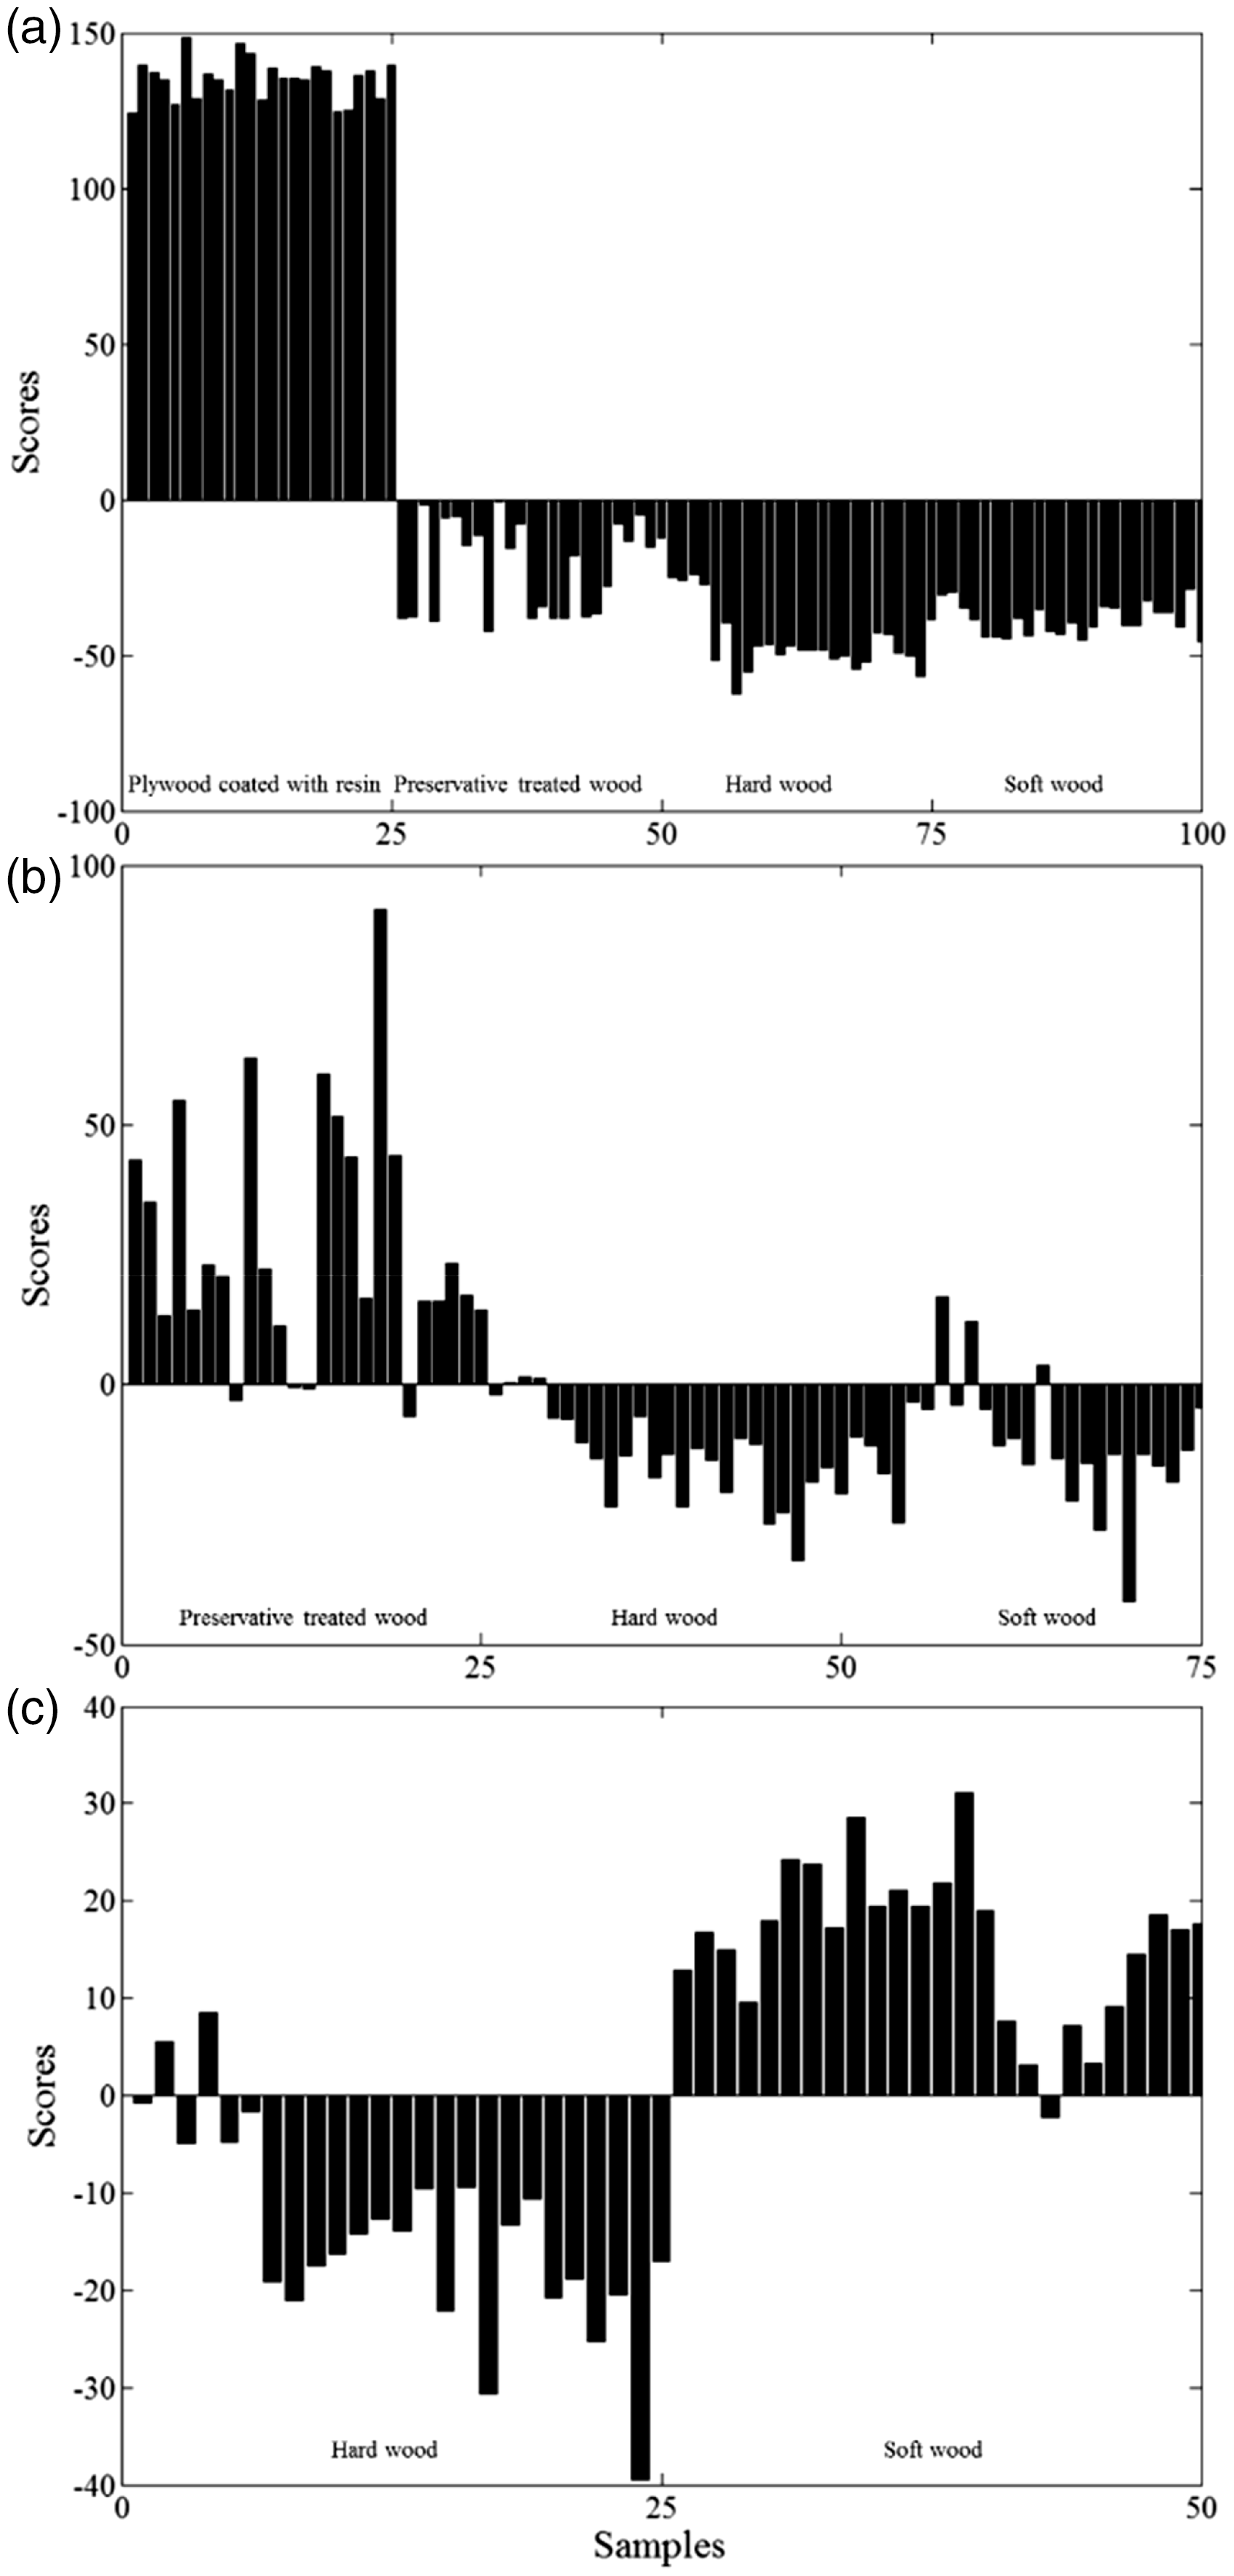
Figure 6 shows the PC2 loading vector of first, second and third rounds of PCA in rPCA. As shown in Figure 6(a), loading was high at 1685 and 2156 nm, where the second-derivative spectra of plywood coated with resin had strong absorption. This indicates that the synthetic polymer applied to the surface of plywood has contributed to its classification. The PC2 loading vector of the second PCA, which was used for the classification of preservative-treated wood, had the highest value at around 1205 nm. This wavelength range exhibits absorption because of the polycyclic aromatic hydrocarbons of creosote. These two discriminant models (first and second PCA) projected spectral differences based on the characteristic absorption bands for each wood waste type. In contrast, the difference of the spectra between softwood and hardwood was rather smaller because they were solid, and no artificial chemical compositions were added. In contrast to the other loadings, the PC2 loading of the third PCA did not have any wavelength which dominated the loadings. However, in this study softwood and hardwood were correctly separated. As shown in Figure 6(c), various wavelengths are involved in discriminating softwood. In the PC2 loading of the third PCA, there was a negative peak at 1717 nm, which is assigned to the CH of lignin. Probably the difference between the lignin structures of softwood and hardwood contributed to the classification.
Loading vectors for the discrimination of (a) plywood coated with resin, (b) preservative-treated wood and (c) softwood.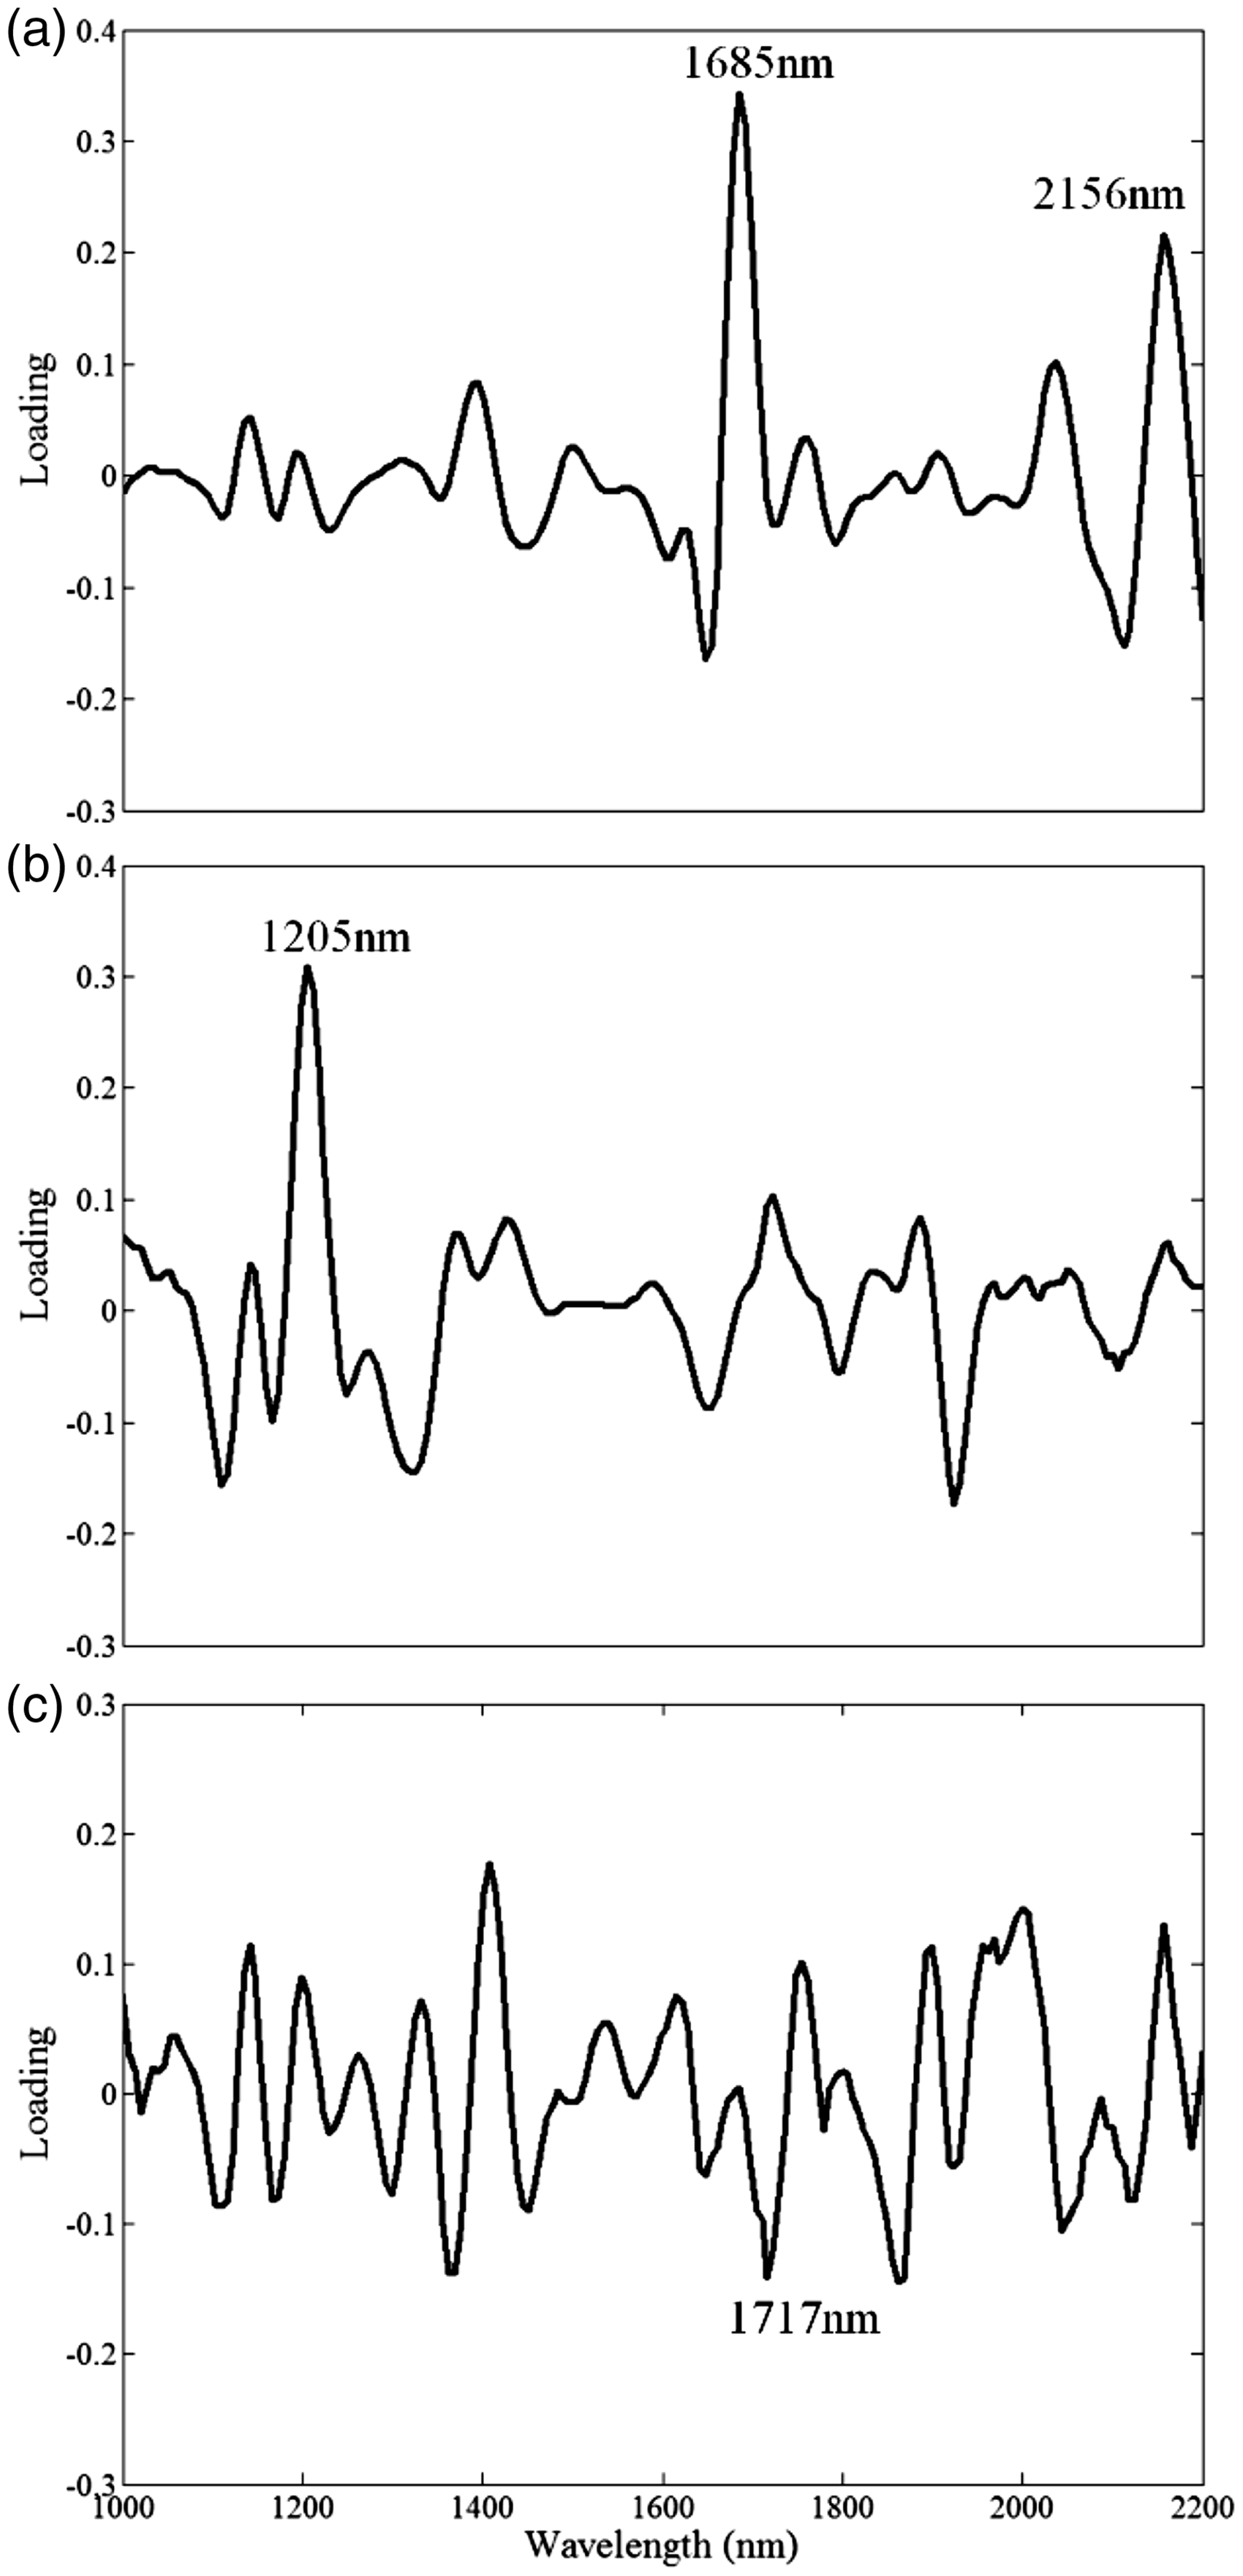
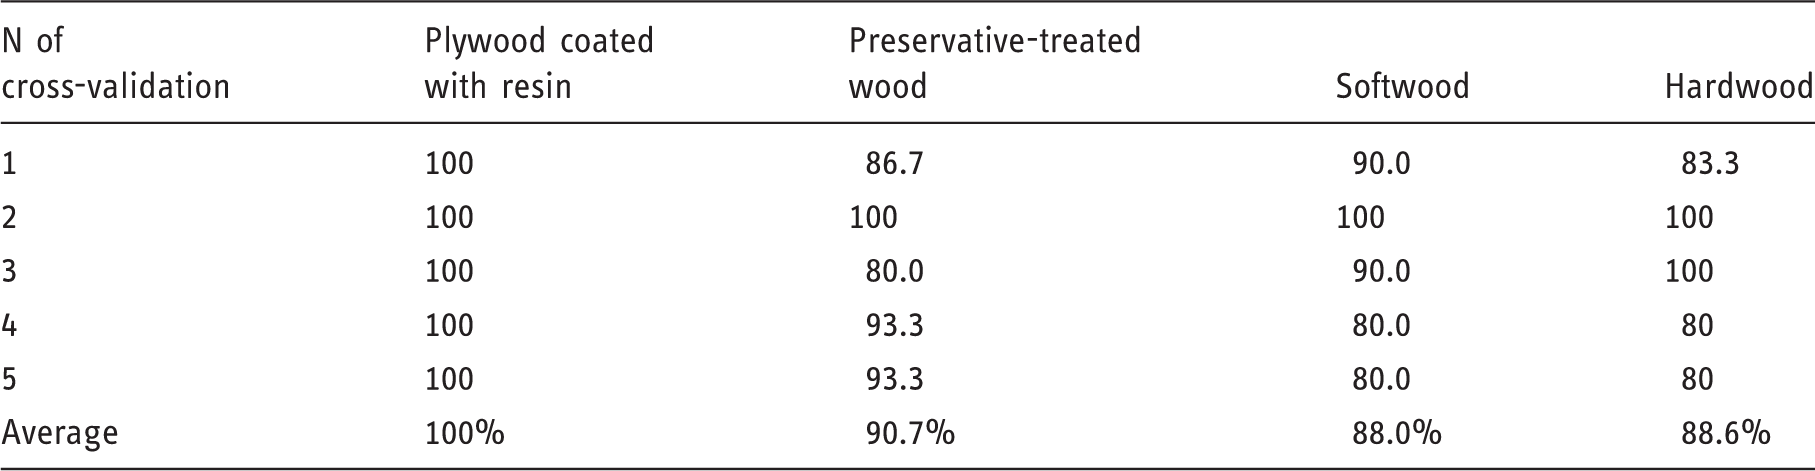
Correct classification ratios from cross-validation.
Mapping of rPCA discriminant model
Figure 7 shows the RGB images of the four types of wood waste and the false colour image calculated by each classification model. For each false colour image, the range was scaled from zero to the maximum score. As shown in Figure 7(b), plywood coated with resin is clearly classified. In the case of classifying preservative-treated wood (Figure 7(c)), several pixels showed negative value, which means that these pixels are classified as other types of wood. However, the average score value of preservative treated wood was greater than zero. By contrast, the mean values of softwood and hardwood were less than zero, four-thirds of the pixels (76%) showed positive value. When building the classification model, the spectra of each sample were averaged. Thus, the spectral variation caused by the position of the sample was reduced. Furthermore, the S/N ratio of the spectra used for model building was higher than that used for mapping. With the aid of another type of image processing such as segmentation, this technique will be ready for use in recycling mills for wood-based materials.
(a) Visible images of four types of wooden wastes, (b) score image for plywood coated with resin discrimination, (c) score image for preservative-treated wood discrimination and (d) score image for softwood discrimination.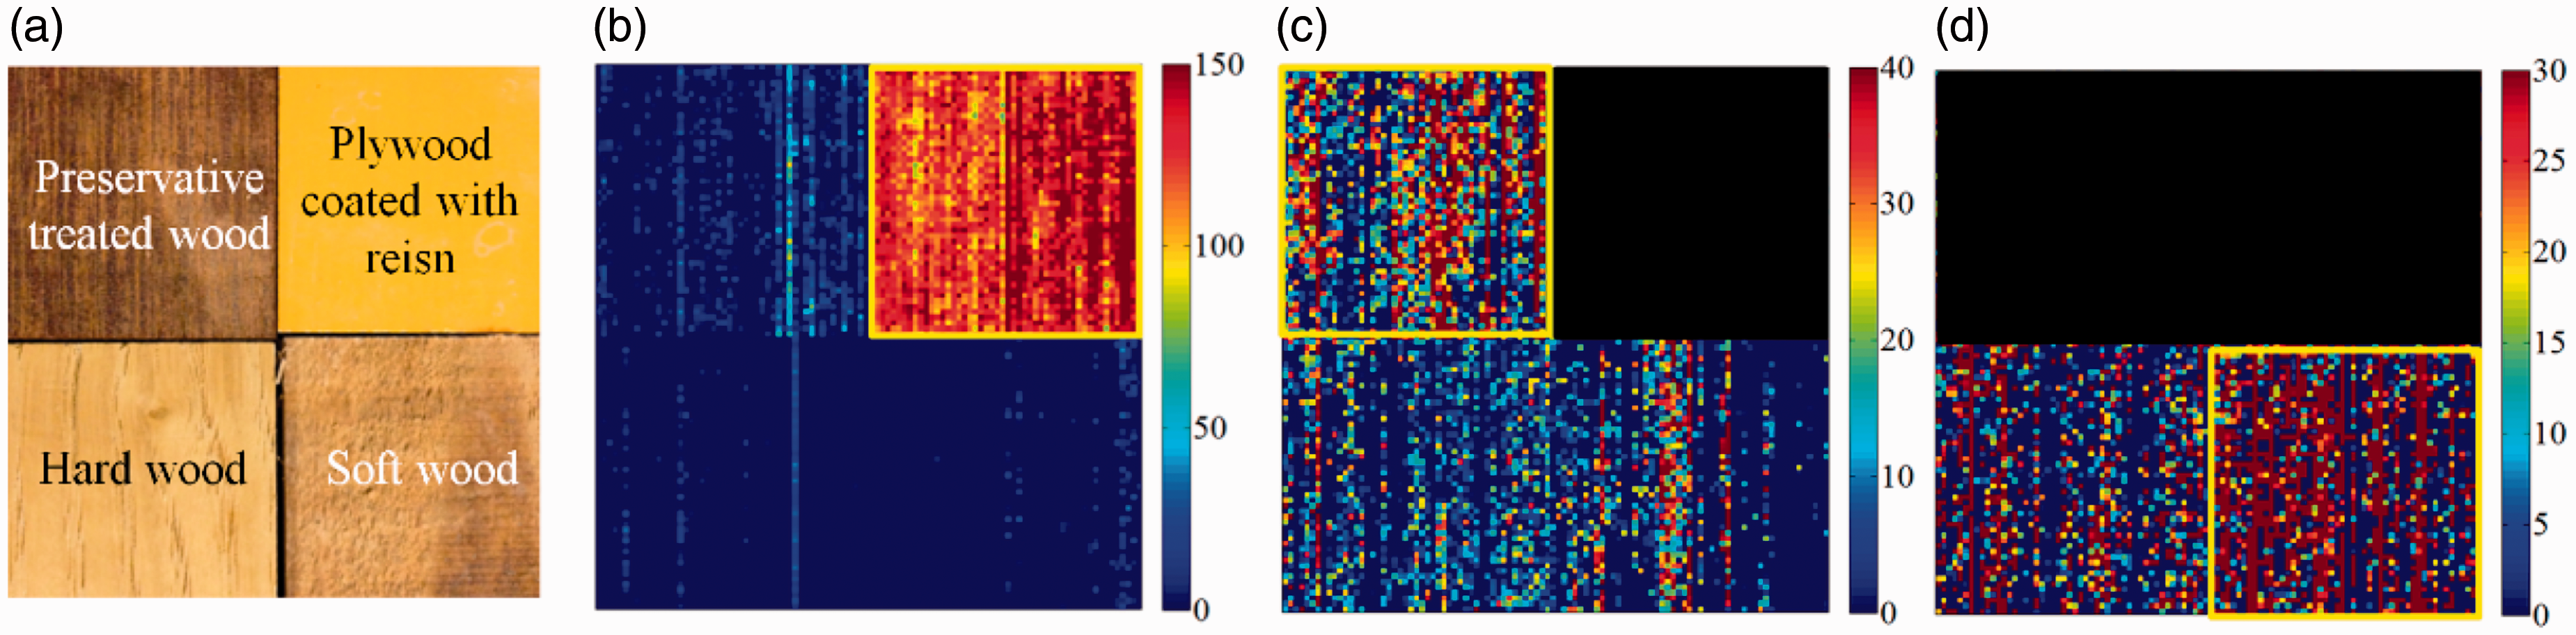
Conclusion
In this study, a new discrimination method (rPCA) was developed to evaluate the feasibility of discriminating four types of wood waste: plywood coated with resin, preservative-treated wood, softwood and hardwood. The first round of PC2 scoring was used for discriminating plywood coated with resin, and the second round of PC2 scoring was then used for classifying preservative-treated wood. Finally, the third round of PCA was performed for softwood and discrimination. Cross-validation showed sufficient accuracy (over 80% correct classification) for classifying the four types of wood waste. In practice, the threshold could be changed to match the required tolerance of the discrimination model. With rPCA, classification will be performed for the class which has large spectral differences compared to other classes. In this study, the spectral differences between plywood coated with resin, preservative-treated wood and solid wood were large. By comparison, for solid wood, the spectral difference between softwood and hardwood was much smaller. Despite such small spectral differences, rPCA enabled the correct classification of softwood and hardwood. These results suggest that rPCA could be a powerful tool for wood recycling mills. Despite this, there are still a number of problems to be solved. For example, the HSI images were acquired under controlled conditions, with the same distance and angle between the measuring surface and focal plane. In a recycling mill, conditions including the angle, size and surface roughness of wood waste vary widely. Some of these problems can be solved by image processing. Others might become much easier to solve if the sample surface conditions (angle and size) can be physically controlled. Therefore, the development of an imaging system with a hardware that can obtain a flat, uniform image of samples is required in order to apply this technique in recycling mills.
Footnotes
Declaration of conflicting interests
The author(s) declared no potential conflicts of interest with respect to the research, authorship, and/or publication of this article.
Funding
The author(s) received no financial support for the research, authorship, and/or publication of this article.