
Abstract
Due to the rapid development of the corn-to-ethanol industry, the demand for process monitoring has led to the gradual substitution of traditional analytical techniques with fast and non-destructive methods such as near infrared spectroscopy. In this study, the feasibility of using Fourier transform–near infrared technology as an analytical tool to predict operational parameters (dry solids, starch, carbohydrate, and ethanol content) was investigated. Corn flour, liquefied mash, fermented mash, and distiller’s dried grains with solubles were selected to represent the feedstock, two intermediate products, and one primary co-product of corn-to-ethanol plants, respectively. Multivariate partial least square calibration models were developed to correlate near infrared spectra to the corresponding analytical values. The validation results indicate that near infrared models can be developed that will predict various parameters accurately (root mean square error of prediction: 0.16–1.14%, residual predictive deviation: 3.0–6.3). Measurement of starch or carbohydrate content in corn flour or distiller’s dried grains with solubles is challenging due to low accuracy of wet chemistry methods as well as sample complexity. The study demonstrated that near infrared spectroscopy, a high-throughput analytical technique, has the potential to replace the enzymatic assay.
Introduction
Corn-based ethanol is the most prominent biofuel in the United States. Ethanol is an essential component of the 138-billion-gallon U.S. gasoline market. Blending of ethanol and gasoline increases octane rating, reduces costs of fuel production, and facilitates compliance with emissions and fuel efficiency standards. To ensure stable and consistent operations of the corn-to-ethanol process, raw feedstock (corn flour), intermediate materials (liquefied mash and fermented mash), and finished products (ethanol, distiller’s dried grains with solubles (DDGS)) have to be monitored on a regular basis. Conventional analytical methods for determining dry solids, ethanol, starch, and carbohydrate content in samples require stepwise chemical or enzymatic procedures that are generally labor intensive, time-consuming, expensive, and involve the destruction of the samples tested. 1 Consequently, the sample turnaround rate is low and it is usually impossible to perform real-time process adjustments based on the availability of analytical results.
Near infrared (NIR) spectroscopy is a fast and nondestructive technique which provides simultaneous determination of major components in various sample matrices through multi-constituent analysis of product spectra. 2 This technology bridges the gap between the visible and the mid infrared (mid-IR) regions as an analytical tool. Although the broad and overlapped overtone and combination bands of the NIR region have a very low structural selectivity compared to the spectra in the mid-IR region (where many fundamental vibrations can be identified in isolated positions), the rapid growth of NIR technology was realized by the emergence of high-precision spectroscopic instruments with very high signal-to-noise ratios that can detect differences in the reflectance spectra. In addition, high-speed computers, which can carry out the complex calculations involved in multivariate analysis, further enable application of NIR technology in multiple constituent analysis of virtually any sample matrix. 3 Today, NIR spectroscopy is generally accepted as a technique for industrial applications and has been successfully used for the rapid analysis of moisture, protein, and fat content in many agricultural and food products. 4
In the bioethanol industry, the application of NIR technology is mainly focused on the following areas: direct compositional characterization of the incoming grains, 5 prediction of overall ethanol yield, 1 and determination of the geographical origin of grains. 6 The possibility of using NIR spectroscopy to predict nutritional components such as dietary fiber, crude protein, lipids, and moisture has been investigated, and predictive regression models have been developed.5,7,8 Prediction of ethanol yield is more challenging than prediction of feedstock nutritional composition, 9 possibly due to variations in feedstocks (plant genetics and harvesting methods) and complexity of the processes involved in their conversion to ethanol. Although starch is the major component that determines the process yield during biochemical conversion of carbohydrate to ethanol, poor correlation between starch content and ethanol yield obtained under specific conditions was observed in several studies.10–12 The lack of correlation can be attributed to the problems associated with the analytical reference methods used and variations in the starch to ethanol conversion processes.
To date, most ethanol plants still have to rely on wet chemistry methods to obtain an accurate estimate of starch/carbohydrate input for each batch of grain, and little research has been conducted to apply NIR technology in different segments of the corn-to-ethanol process. Therefore, the objective of this study was to evaluate the feasibility of using NIR spectroscopy to monitor the performance of individual units such as liquefaction, fermentation, and downstream processing. Corn flour, liquefied mash, fermented mash, and DDGS were selected to represent a raw feedstock, a stream from the liquefaction process, a stream from the simultaneous saccharification and fermentation process, and a finished co-product, respectively.
Materials and methods
Sample collection and sample preparation
Samples including corn flour, liquefied mash, fermented mash, and DDGS were collected from starch-based ethanol plants in the Midwest region of the United States between 2013 and 2015. Additional corn flour and DDGS samples were also obtained from ethanol plants in South America by Novozymes Latin America Ltd (Barigui, Araucári, Brazil) in 2015. Corn flour and DDGS samples were stored at 4°C and room temperature, respectively. Liquefied mash and fermented mash samples were stored at −4°C until use. Wet chemistry analysis and NIR spectra collection were carried out within two weeks of sample arrival. The storage time was determined based on the laboratory results which showed no significant change of wet chemistry analysis results under the specified storage condition. To minimize the time lag between NIR measurement and analyses by reference methods, the two assays were performed simultaneously.
Samples used for dry solids, ethanol, or carbohydrate analysis were analyzed or scanned without additional treatment. Poor correlation was observed between spectra of untreated slurry samples which have moisture content greater than 65% and their respective starch content (data not shown), which can be attributed to the interference caused by the existence of water (present in large quantity in slurry samples), monosaccharides, disaccharides, and other soluble oligosaccharides. To avoid the interference, only the insoluble solid fraction was used for starch calibration. To prepare insoluble solids for spectrum collection as well as for wet chemistry analysis, samples were washed repeatedly with deionized water until glucose in the aqueous phase was less than 0.05% (w/v), which was determined by high-performance liquid chromatography (HPLC). The washed solid was then lyophilized with a Freezone 2.5 L freeze dryer (Labconco, Kansas City, MO, USA) at −48°C for 16 h and homogenized in a Geno grinder (SPEX SamplePrep, LLC, Metuchen, NJ, USA) before spectrum collection and wet chemistry analysis.
Collection of NIR spectra data
All NIR measurements were performed with a Bruker multiple purpose analyzer (Bruker Optics, Billerica, MA, USA) equipped with an NIR source, an interferometer, and a Lead Sulfide (PbS) detector. NIR spectra were collected when samples reached room temperature (22–23°C). Samples used for dry solids, ethanol, or total carbohydrate calibration were scanned in a 600 mL (940 mm dia.) glass beaker while samples used for starch calibration were scanned in a 22 mm (dia.) glass vial due to limitations in sample size. Spectra were recorded in diffuse reflectance mode from 12,500 to 4000 cm−1 using 32 scans; spectral resolution was set to 8 cm−1. The background spectra were obtained once every two hours using the internal background position. Three spectra were recorded for each sample and averaged. Samples were thoroughly mixed between scans.
NIR spectra analysis
The spectral data were processed with the software package OPUS 6.5 (Bruker Optics, Billerica, MA, USA) and Unscrambler® X (Camo Software, Woodbridge, NJ, USA). A principal component analysis (PCA) was performed on each spectral data set. Typically, a diagnostic statistic given by Hotelling T2 defines initial outliers outside Hotelling T2 tolerance ellipse at 95% confidence. Samples which were defined as outlier due to extreme reference values were kept in the dataset. The true outliers were determined after review of plant data and laboratory results. Contamination of liquefied mash, infection of fermented mash, overheating of DDGS, and insufficient oil recovery by tricanters were the fundamental problems for the sample abnormality. The abnormality can typically be confirmed by high ethanol, acetic/lactic acid in liquefied mash, high concentration of acetic/lactic acid, fusel alcohols in fermented mash, and excessively dark color or high oil content in DDGS.
After the outliers were removed, about 70–80% of the samples which were uniformly distributed in the four quadrants of the score plots were randomly selected for model construction. 13 When samples clearly formed different groups on score plots, at least one sample from each group (cluster) was included in the calibration set. 13 Samples with extremely high or low reference values were kept in the calibration set to expand the calibration range. The remaining samples were used as an independent validation set to evaluate the performance of the calibration models. The spectra were subjected to various data preprocessing (detrending, standard normal variate transformation) techniques to reduce variability due to scatter and/or further transformation with first or second derivatives to magnify small but significant features and improve resolution. Calibration models were developed using partial least square (PLS) regression analysis on preprocessed spectra. In most cases, since some wavenumbers include irrelevant information while others have low signal to noise ratio, only certain wavenumbers that were related to the chemical information were selected for spectral analysis. The optimal multivariate calibration equations were chosen based on the highest coefficient of determination (R2), lowest root mean square error of cross validation (RMSECV), and highest residual predictive deviation (RPD). The number of factors used for each regression model was also evaluated to avoid over-fitting.
Predictions from calibrated models
The models were further validated by using an independent validation set. A correlation analysis between model predicted values and those obtained through laboratory analyses was performed for each calibration model developed. The accuracy of prediction was evaluated by correlation coefficient of determination (r2) between model predicted and reference values, bias, and root mean square error of prediction (RMSEP).
Chemical analysis
The total solids content of corn flour and liquefied mash was determined gravimetrically by applying AOAC method 945.32 “Characteristics of brewers’ grains.” 14 Dry solids in DDGS was measured by following the method recommended by US Grains Council. 15
The starch/carbohydrate content was determined by following AOAC Method 996.11 with reagents supplied in the Megazyme Total Starch Assay Kit (Megazyme International Ireland, Bray, Ireland). The results obtained on washed solids are defined as starch since monosaccharides, disaccharides, and soluble oligosaccharides are removed during the preceding washing step. When the assay is performed on unwashed corn flour or DDGS, the result is termed carbohydrate because the enzymatic hydrolysis product includes monomeric sugar released from disaccharides, oligosaccharides, and polysaccharides. To minimize the effect of water, the carbohydrate values were expressed as carbohydrate as a fraction of dry solids. After two-stage hydrolysis, the hydrolysate was centrifuged (3000 r min−1, 20 min), filtered through a 0.45 µm nylon filter, and analyzed with a modular HPLC (Agilent 1200 series; www.agilent.com). The HPLC was equipped with quaternary pump, thermostatted autosampler, temperature-controlled column compartment, and refractive index detector (Santa Clara, CA, USA). Separation was performed at 65°C with a Bio-Rad HPX-87H column (7.8 × 300 mm; Bio-Rad No. 125-0140) with a Bio-Rad Micro-Guard Cation H refill guard cartridge (Bio-Rad No. 125-0129; Bio-Rad Laboratories, Inc., Hercules, CA, USA). The separation was run isocratically with a mobile phase of deionized water (≥18.2 MΩ-cm) at a flow rate of 0.6 mL min−1.
To measure the ethanol concentration in fermented mash, the samples were centrifuged (3000 r min−1, 20 min), filtered through a 0.45 µm nylon filter, and subjected to HPLC analysis as described above.
Results and discussion
Wet chemistry analysis
Descriptive statistics of the chemical parameters used in calibration and validation. a
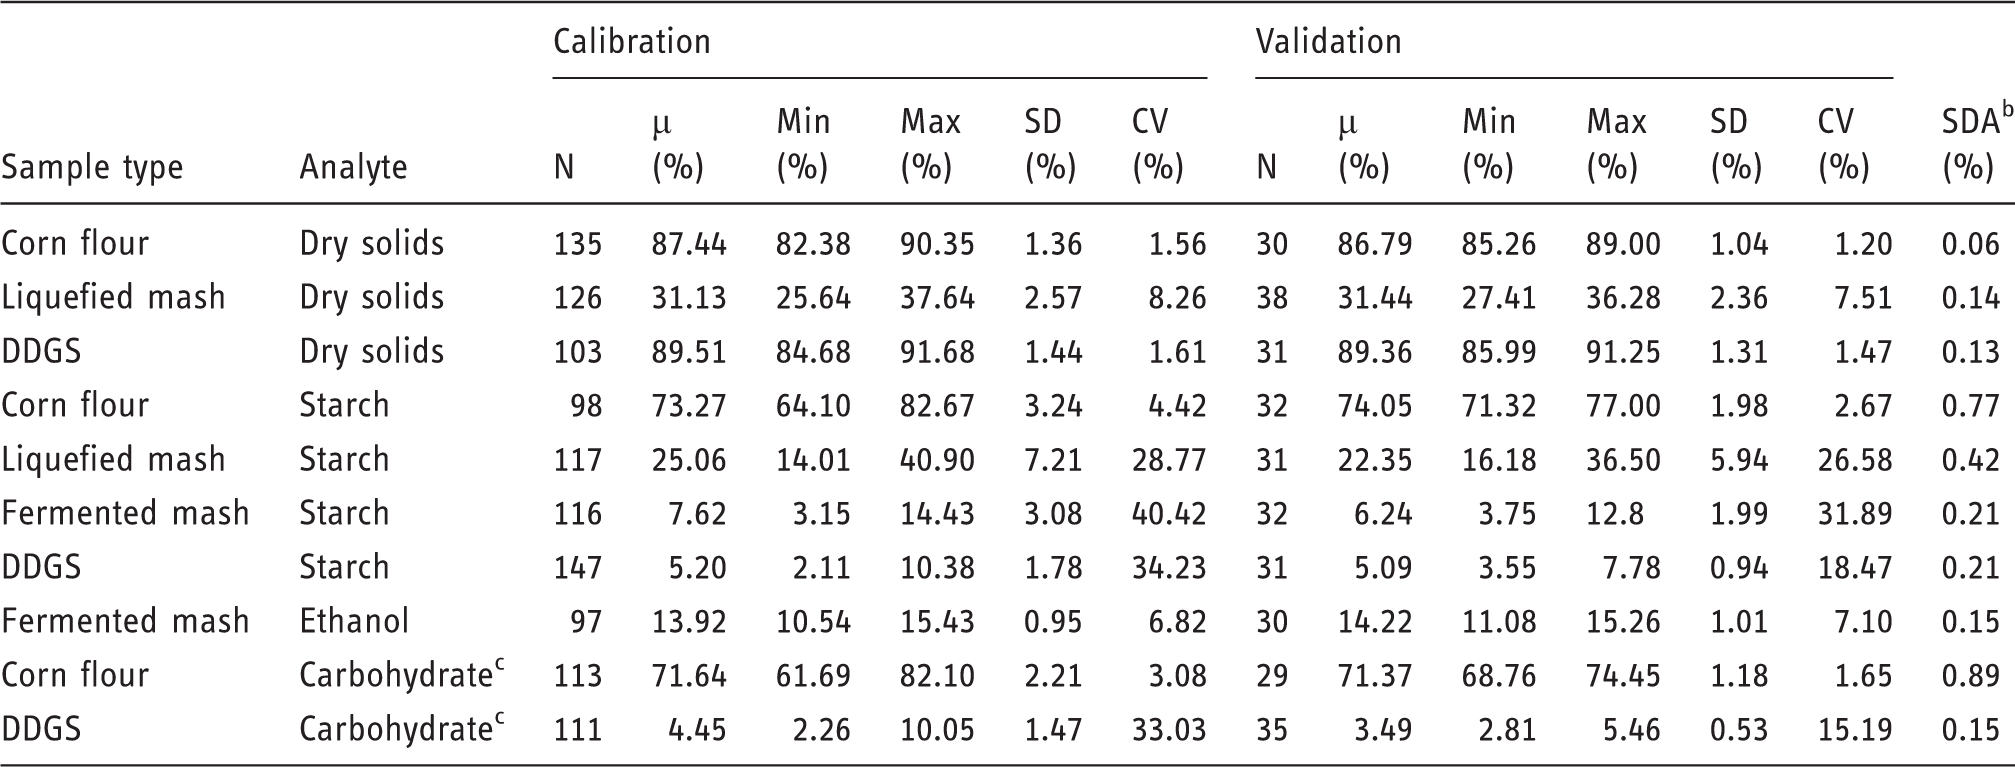
N: number of samples; µ: mean; Min: minimum values; Max: maximum values; SD: standard deviation; CV: coefficient of variation; SDA: standard deviation of analysis; DDGS: distiller’s dried grains with solubles.
Samples used for calibration and validation were from North America only.
One sample from each sample type was analyzed six times using standard lab protocol on three separate work days and standard deviation of all assay results was calculated as SDA.
Values indicate the carbohydrate content in dried samples.
Overview of spectra and statistics of moisture and starch
Figure 1(a) shows the NIR spectra in the range of 10,000 to 4000 cm−1 of four sample types. Both liquefied mash and fermented mash had water content greater than 65%, while the water content in corn flour and DDGS was generally less than 18%. This difference can be demonstrated in their respective spectra. Compared to that of corn flour and DDGS, significantly higher absorbance was observed in the region of 5500–5000 and 7000–6000 cm−1 for liquefied mash and fermented mash, which correlates with the combination (asymmetric stretch and bending) and first overtone bands assigned to water.
NIR spectra of the (a) untreated and (b) washed/dried corn flour, liquefied mash, fermented mash, DDGS obtained in the range of 10,000 to 4000 cm−1.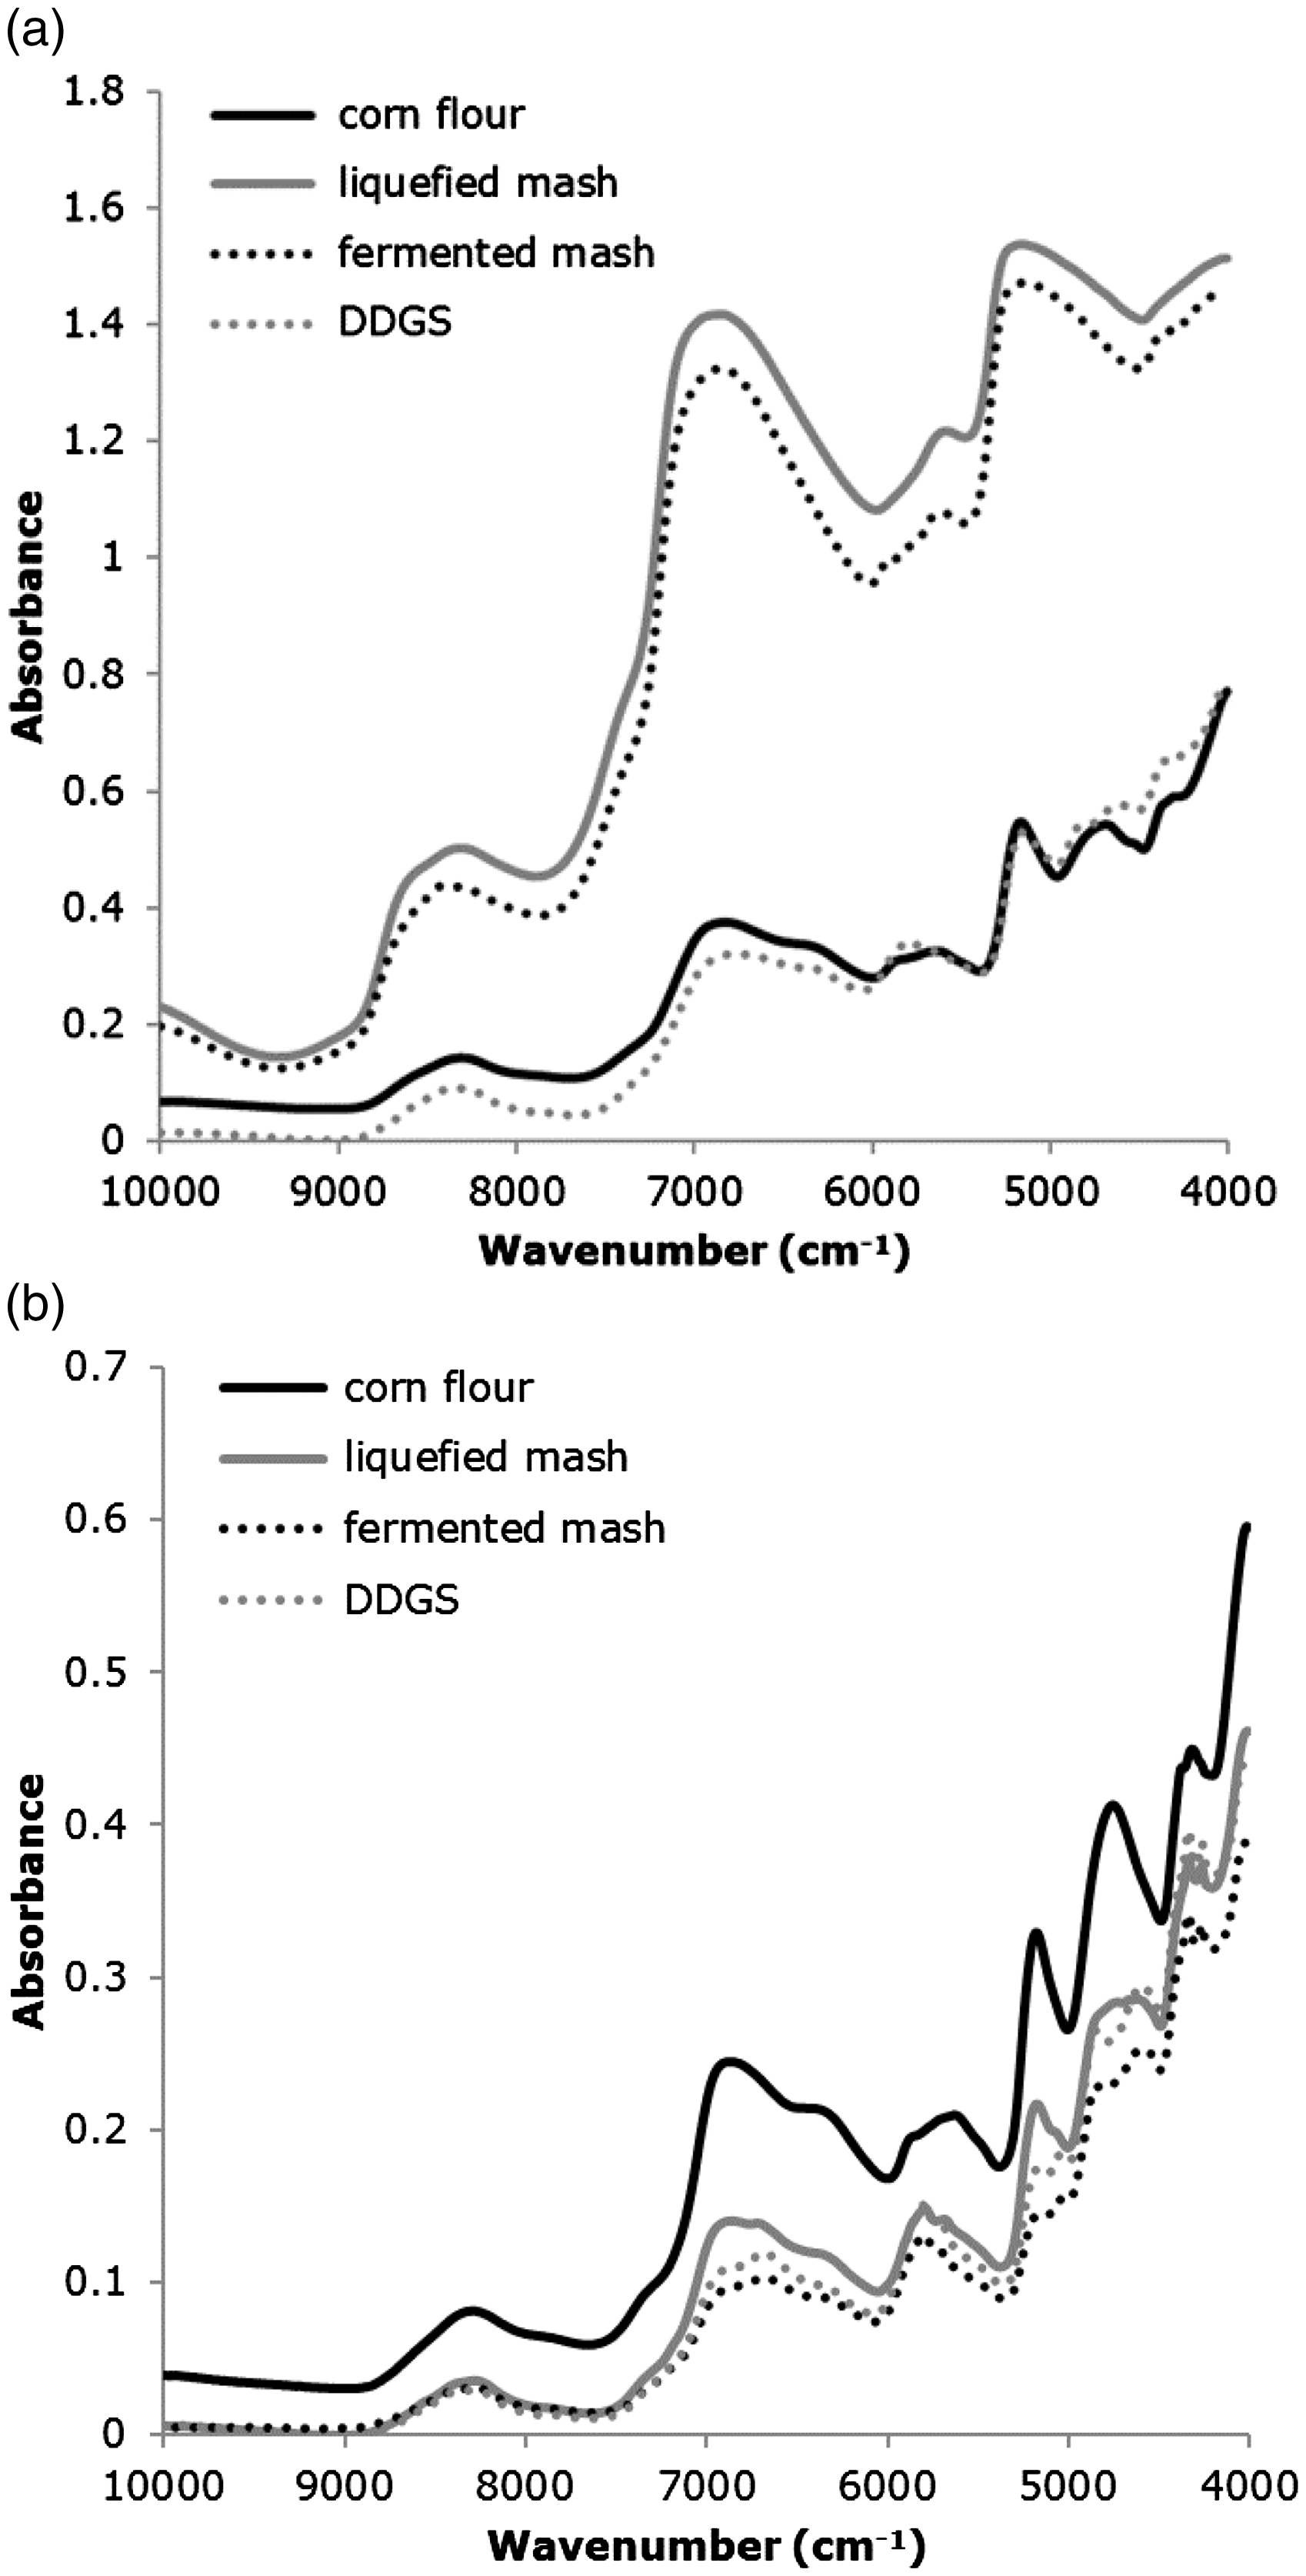
Figure 1(b) shows the NIR spectra of the insoluble solids fraction of the four sample types. As corn flour goes through liquefaction, simultaneous saccharification and fermentation, distillation, and downstream processing, starch content decreases as ethanol is generated through the combined effects of enzymes and yeast. The change in sample composition is correlated with the decrease of the peaks in the region of 6300–6200 and 5500–4200 cm−1, which are the dominant absorption bands attributed to the first overtone of the O-H stretching and amylose and amylopectin helix structures.9,16
PCA analysis was applied to all spectra on each sample type for every analyte to evaluate spectral variability and determine population structure. The objective was to reduce the number of dimensions of the multivariate data to find trends and outliers, as well as clusters of similar samples. The score plots of untreated corn flour and DDGS are shown in Figure 2. PCA indicates that grouping was mainly based on geographical difference between North America and South America. It is worth mentioning that North America samples dominate the PCA plot due to the lower number of corn ethanol plants in South America and U. S. Government restriction/prohibition of the entry of foreign agricultural products. The distribution of the samples may change if more balanced dataset can be made available. The percent of variation explained by each principal component (PC) is indicated in the parenthesis. The summation of the percent of variation explained by PC1 and PC2 was close to 100%, indicating that two PCs explained most of the variations in corn flour and DDGS.
PCA analysis of (a) corn flour and (b) DDGS.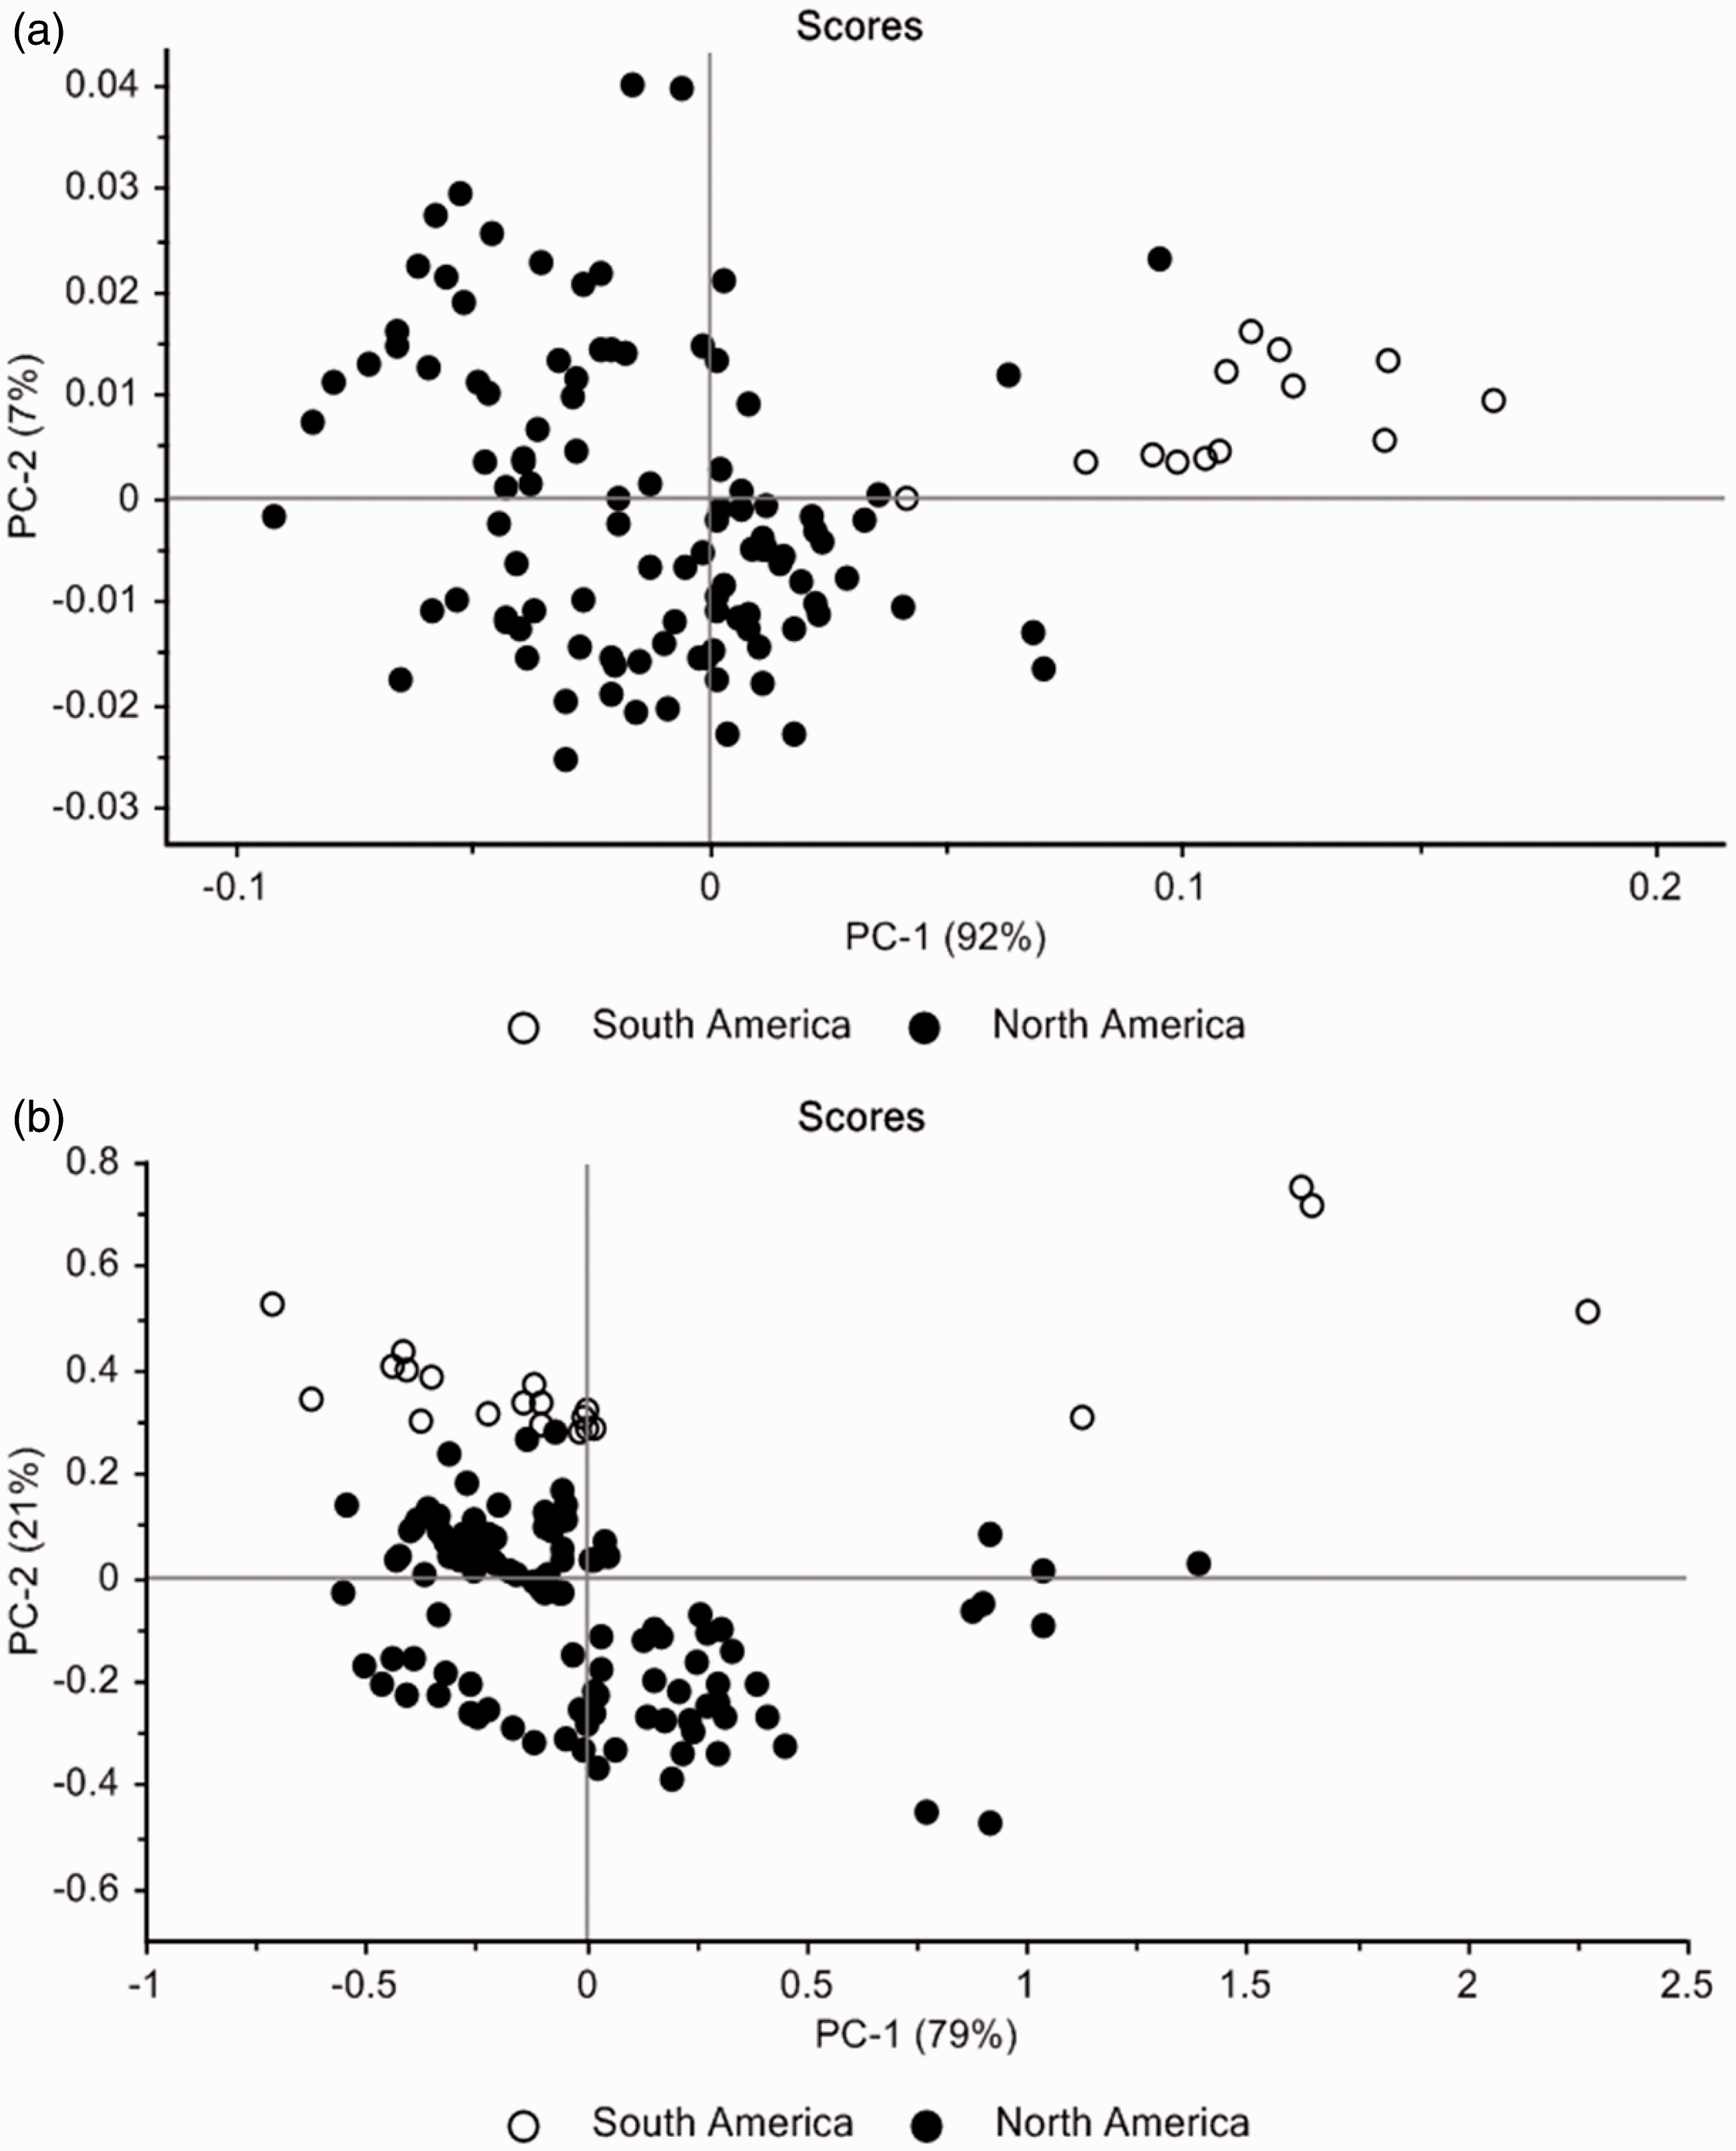
Development of PLS models
Calibration statistics for determining dry solids, starch, ethanol, and DDGS with FT-NIR.
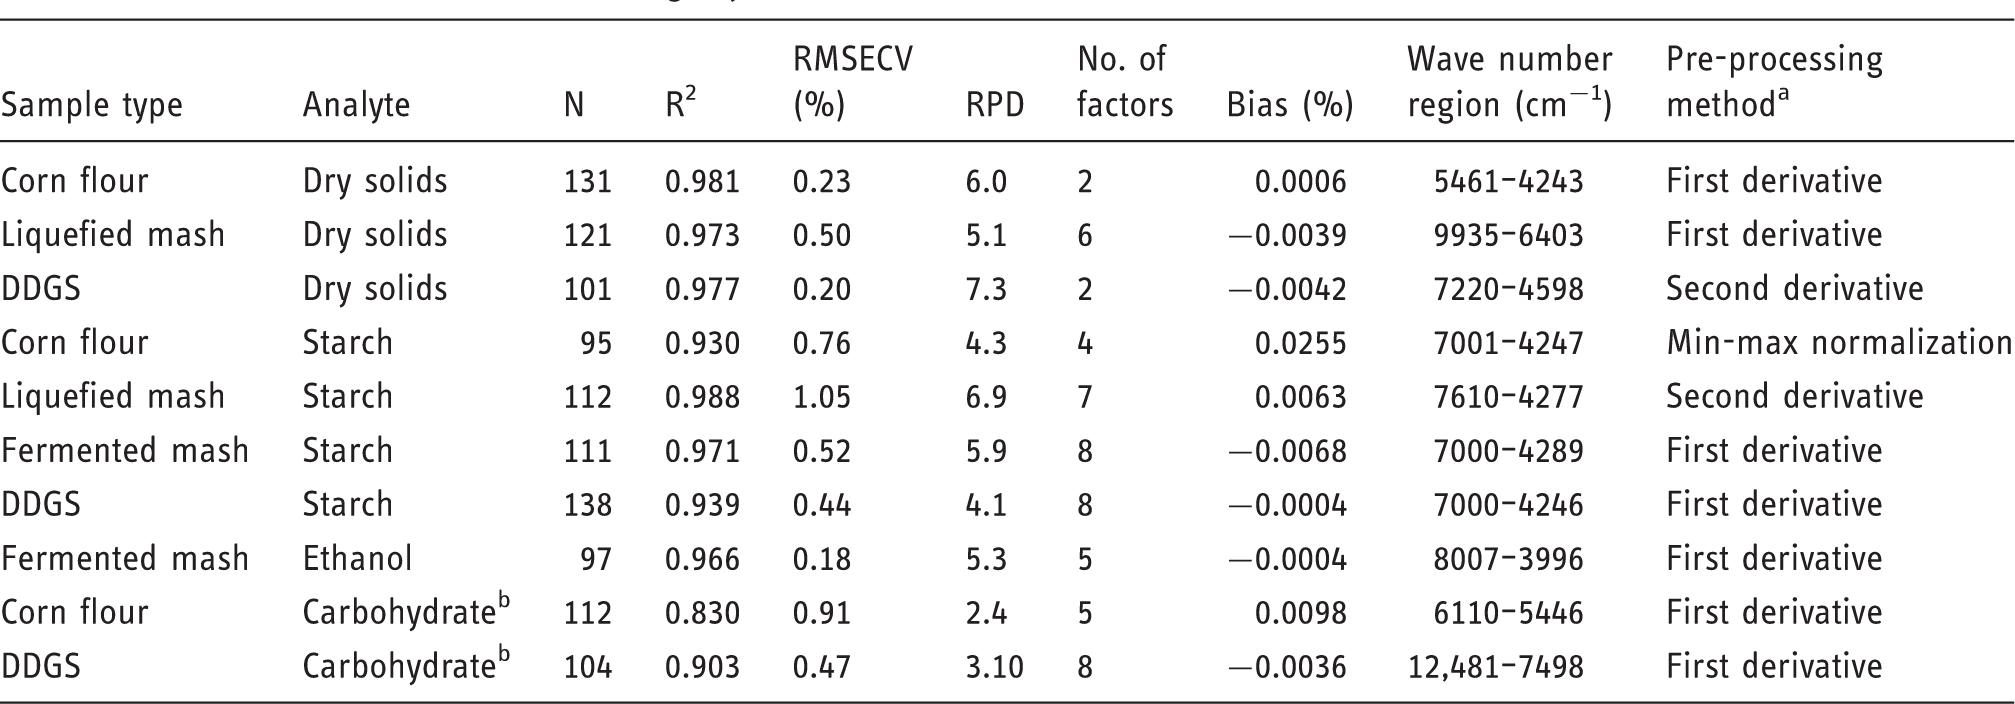
FT-NIR: Fourier transform near infrared; DDGS: distiller’s dried grains with solubles; RMSECV: root mean square error of cross validation; RPD: residual predictive deviation.
First derivative: five points, second order polynomial smoothing. Gap size 3. Second derivative: second points, second order polynomial smoothing. Gap size 3.
Values indicate the carbohydrate content in dried samples.
Spectral bands in the NIR region typically have a very low structural selectivity due to the superposition of the overtone peaks and combination bands. 2 However, water displays two dominant bands at approximately 5200 cm−1 (OH combination band) and 6900 cm−1 (band of the first overtone of the O-H stretch). These absorption bands are not only strong but are also typically well resolved from other peaks. 19 Therefore, they are widely used for quantitative analysis of water content in various sample matrices. In relatively dry samples such as corn flour and DDGS, where the dry solids content typically reaches 85–92%, the sharp first overtone band at 6900 cm−1 decreases in intensity. 20 Therefore, the absorption band at approximately 5200 cm−1, which is typically attributed to a combination of free water and water bound to proteins or other molecules, is used for quantification.21,22 Water is a critical matrix component for liquefied mash (28–35% dry solids). These samples show the strongest absorbance bands at approximate 8400, 6900, and 5200 cm−1, a spectral feature that appears at similar wavenumbers to those of water. 20
Major PLS loadings used for corn flour and DDGS dry solids analysis are shown in Figure 3(a) and (b), which clearly indicate that the spectral range of 8000 to 4500 cm−1 was particularly efficient for prediction of total solids of the two sample types. The main regression coefficients obtained also fall in the same region. For corn flour and DDGS, the first two PCs explained more than 95% of the variation. Figure 3(d) and (e) show the score plots for PC1-PC2 for the spectra of corn flour and DDGS. All points are grouped and indicated by different symbols according to the dry solids values, where levels 1, 2, and 3 indicate the dry solids content of 84.4–86.4%, 86.4–88.4%, and 88.4–90.4% for corn flour and 84.6–87.0%, 87.0–89.3%, 89.3–91.7% for DDGS, respectively. The plot of PCs shown in Figure 3(a) and (b) reveal the dry solids effect, as indicated by the clustering of samples in individual groups and separation of the groups along PC1 (for corn flour) or PC1-PC2 (for DDGS). More complex models are required to determine dry solids in slurry samples. This can be explained by inhomogeneity and complexity of the sample matrix compared to ground corn flour and DDGS. The liquefied mash was a mixture of water, insoluble corn (starch, protein, oil, and fiber), as well as soluble short chain dextrins and glucose generated during starch hydrolysis with α-amylase at 82–87°C. In addition to the difference in feedstocks, process variations such as corn meal cooking conditions, enzymes applied, liquefaction time and temperatures also increased the level of sample inconsistency. As indicated in Figure 3(c), major PLS loading used for dry solids analysis for liquefied mash were in the spectral range of 9000–5500 cm−1. Similar score plots for PC1-PC2 for the spectra are presented in Figure 3(f). All points are grouped and indicated by different symbols according to the dry solids values, where levels 1, 2, and 3 indicate the dry solids content of 22.6–27.6%, 27.6–32.6%, and 32.6–37.7% for liquefied mash, respectively. The first two PCs explained approximately 80% of the variation, as indicated by the certain level of overlapping between individual groups. Six factors were needed to explain the variation in the inhomogeneous slurry samples.
Major PLS loading of the best PLS models for dry solids determination in (a) corn flour, (b) DDGS, and (c) liquefied mash and (d) score plots for corn flour, (e) DDGS, and (f) liquefied mash. In Figure 3(d) to (f), the percentage of spectral variation and the percentage of wet chemistry variation explained by the factor are indicated by the two values in the parenthesis, respectively. Levels 1–3 indicate different dry solids content in samples.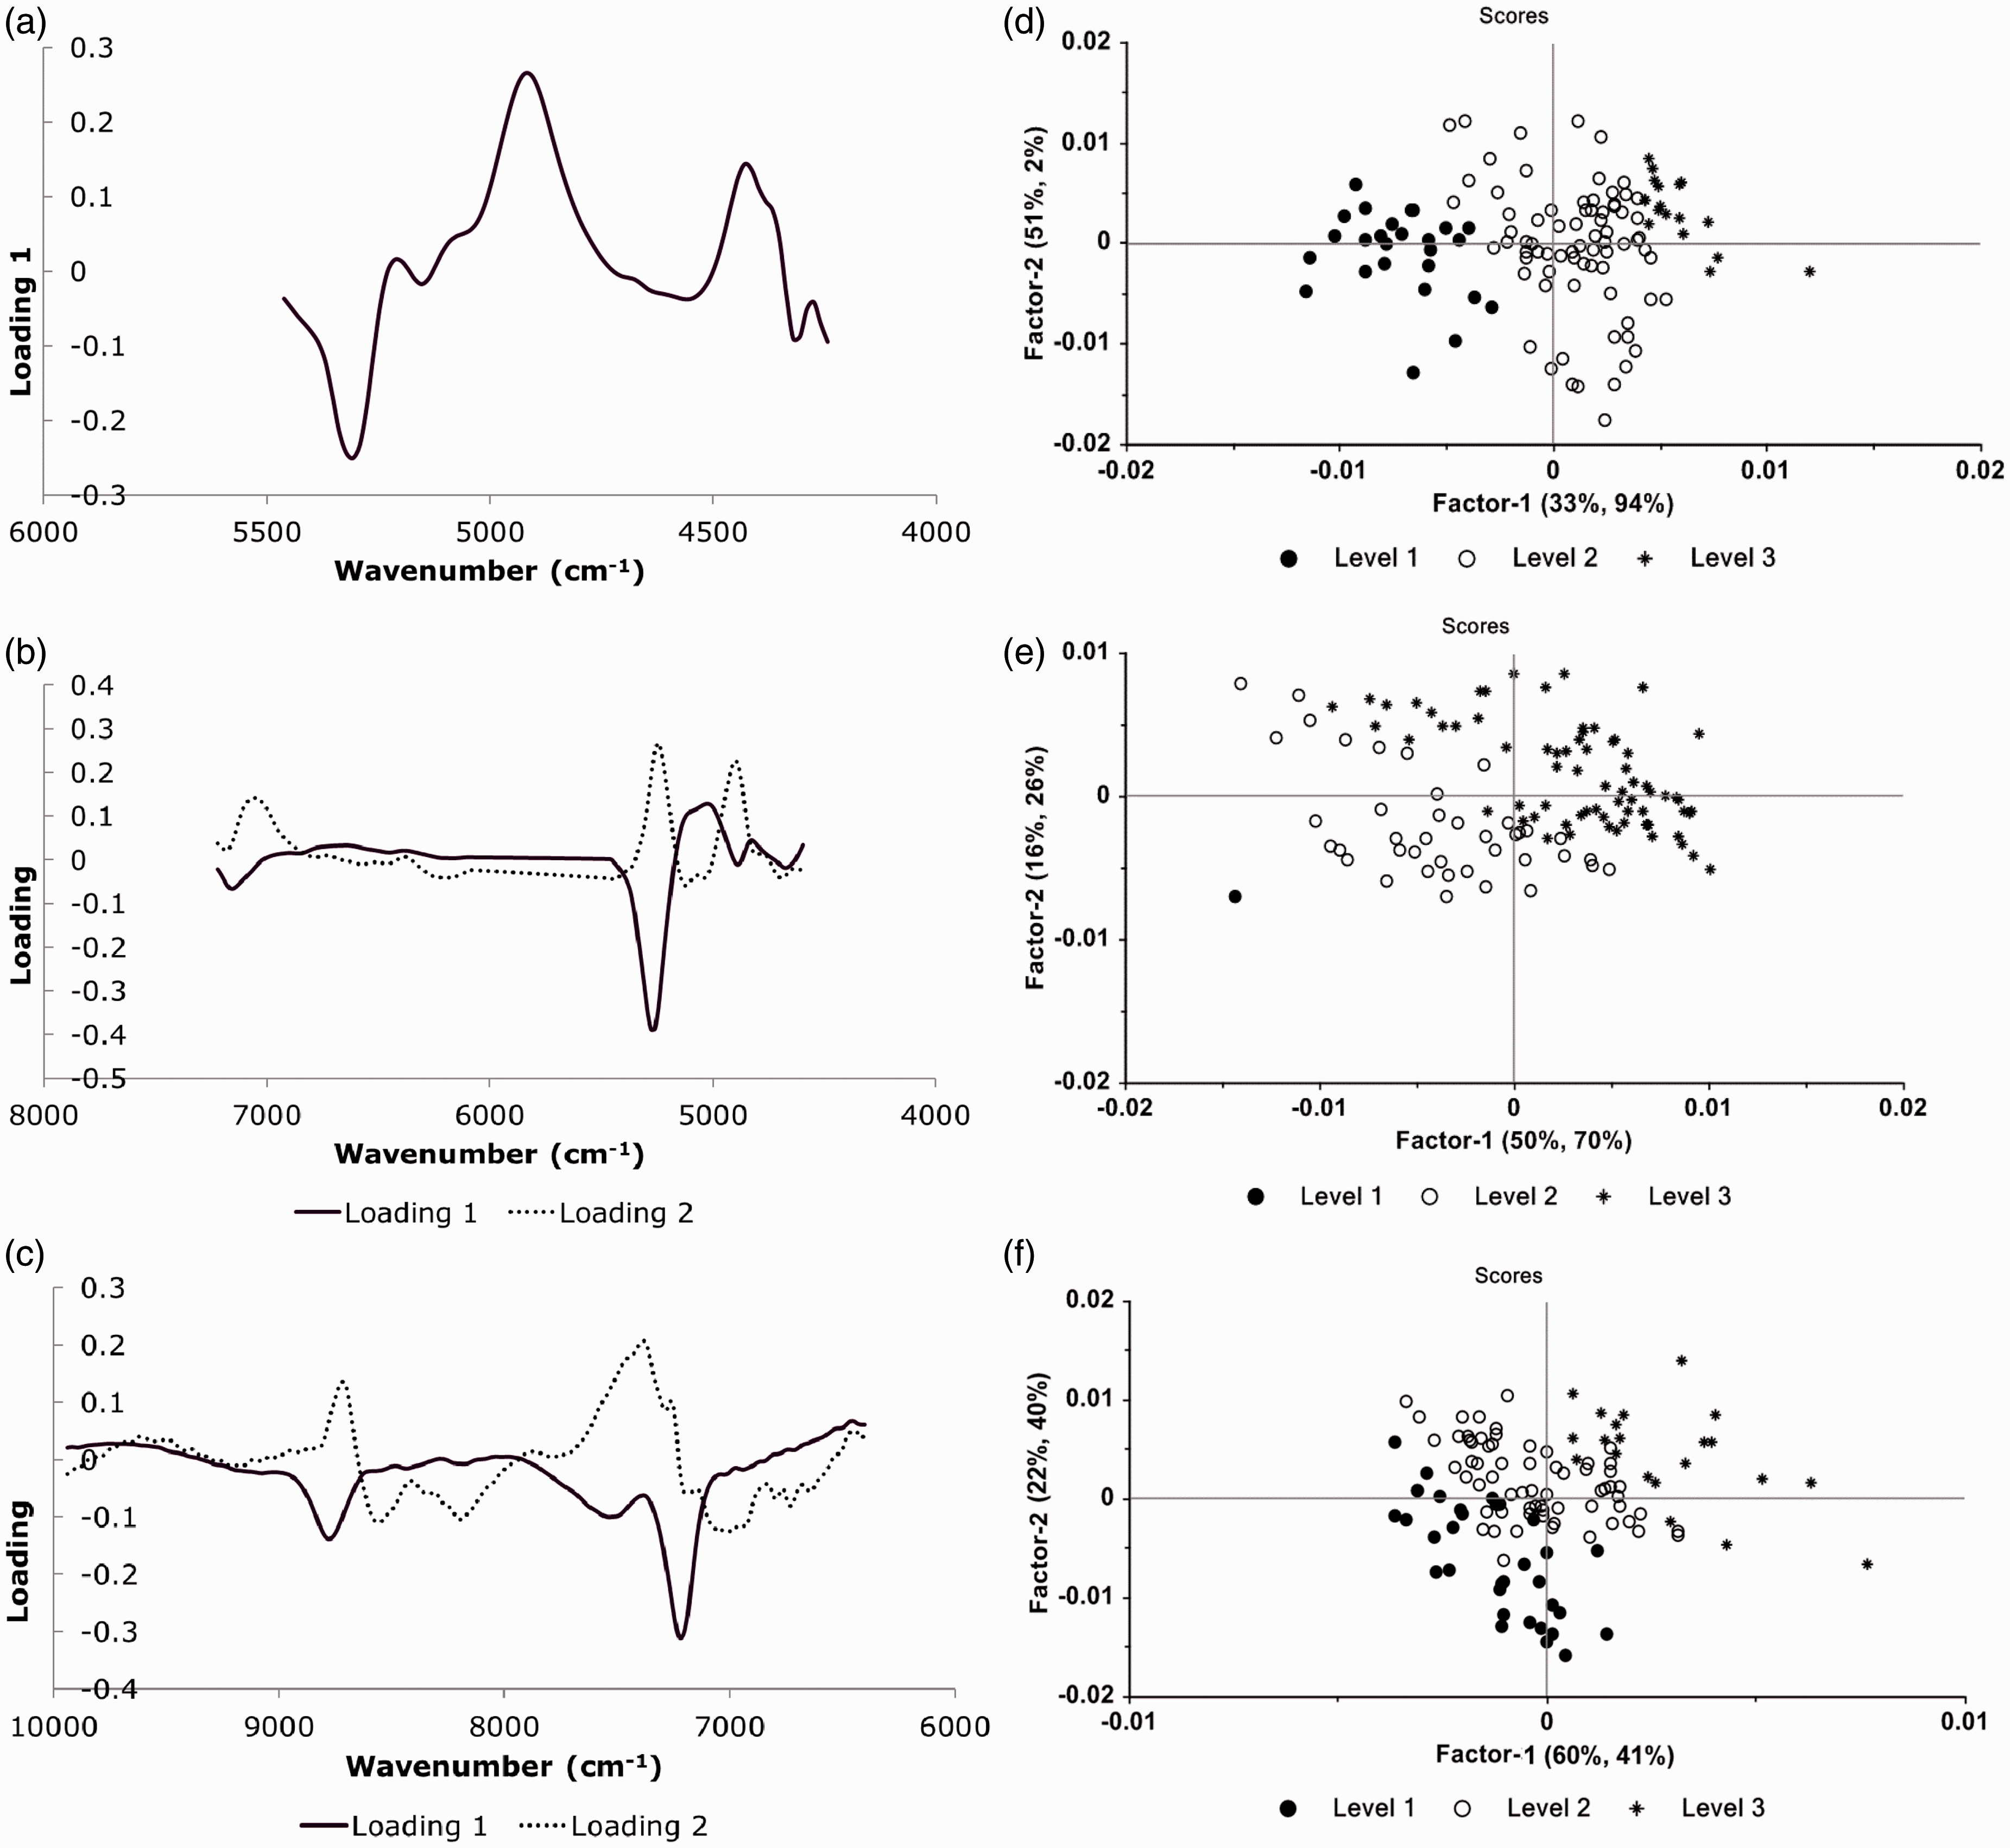
Cross validation statistics for starch content determination for four sample types as well as carbohydrate content determination for corn flour and DDGS are also summarized in Table 2. The PLS models were able to predict starch content in insoluble solids with an average RMSECV of 0.76%, 1.05%, 0.52%, and 0.44% for corn flour, liquefied mash, fermented mash, and DDGS, respectively. Compared to models developed for dry solids, regression models for starch prediction showed higher RMSECV and lower R2 values, which may be attributed to the limitations in starch quantification methods. Accurate determination of starch/carbohydrate in grains has been challenging due to its complex structure and the presence of other components such as lipid and proteins. The well-established methodologies typically involve chemical treatments to break down polysaccharides to simple sugars prior to chromatographic analysis. Acid hydrolysis can achieve complete depolymerization. However, degradation of monomeric sugars and/or insufficient treatment of complex carbohydrate can be expected due to the differential susceptibility to acid of various glycosidic linkages. Enzymatic digestion used in this study can prevent the overtreatment of simple sugars. However, accurate quantification can still be compromised by the presence of inaccessible substrate and different activities of enzyme cocktails used. 23
From NIR spectra at selected wave numbers better correlations were obtained than when using the entire NIR region. Major PLS loadings used for corn flour starch content prediction are shown in Figure 4; the first two factors explained 94% of the variation. More factors were required for predicting starch content in liquefied mash, fermented mash, and DDGS samples. Their loading graphs are therefore not shown in this study. Figure 4 shows that variations in starch content were mainly observed in the spectral range of 7000–4000 cm−1. The dominant absorption bands attributed to starch included 6300–6200 cm−1 (the first overtone of the O-H stretch),
24
5300–5200 cm−1 (amylose and amylopectin helix structures),
16
4700–4600 cm−1 (C-H stretching and C-O stretching combination),
25
and 4386–4283 cm−1 (C-H stretching and CH2 deformation combination band).
25
Major PLS loading for corn flour starch determination with FT-NIR.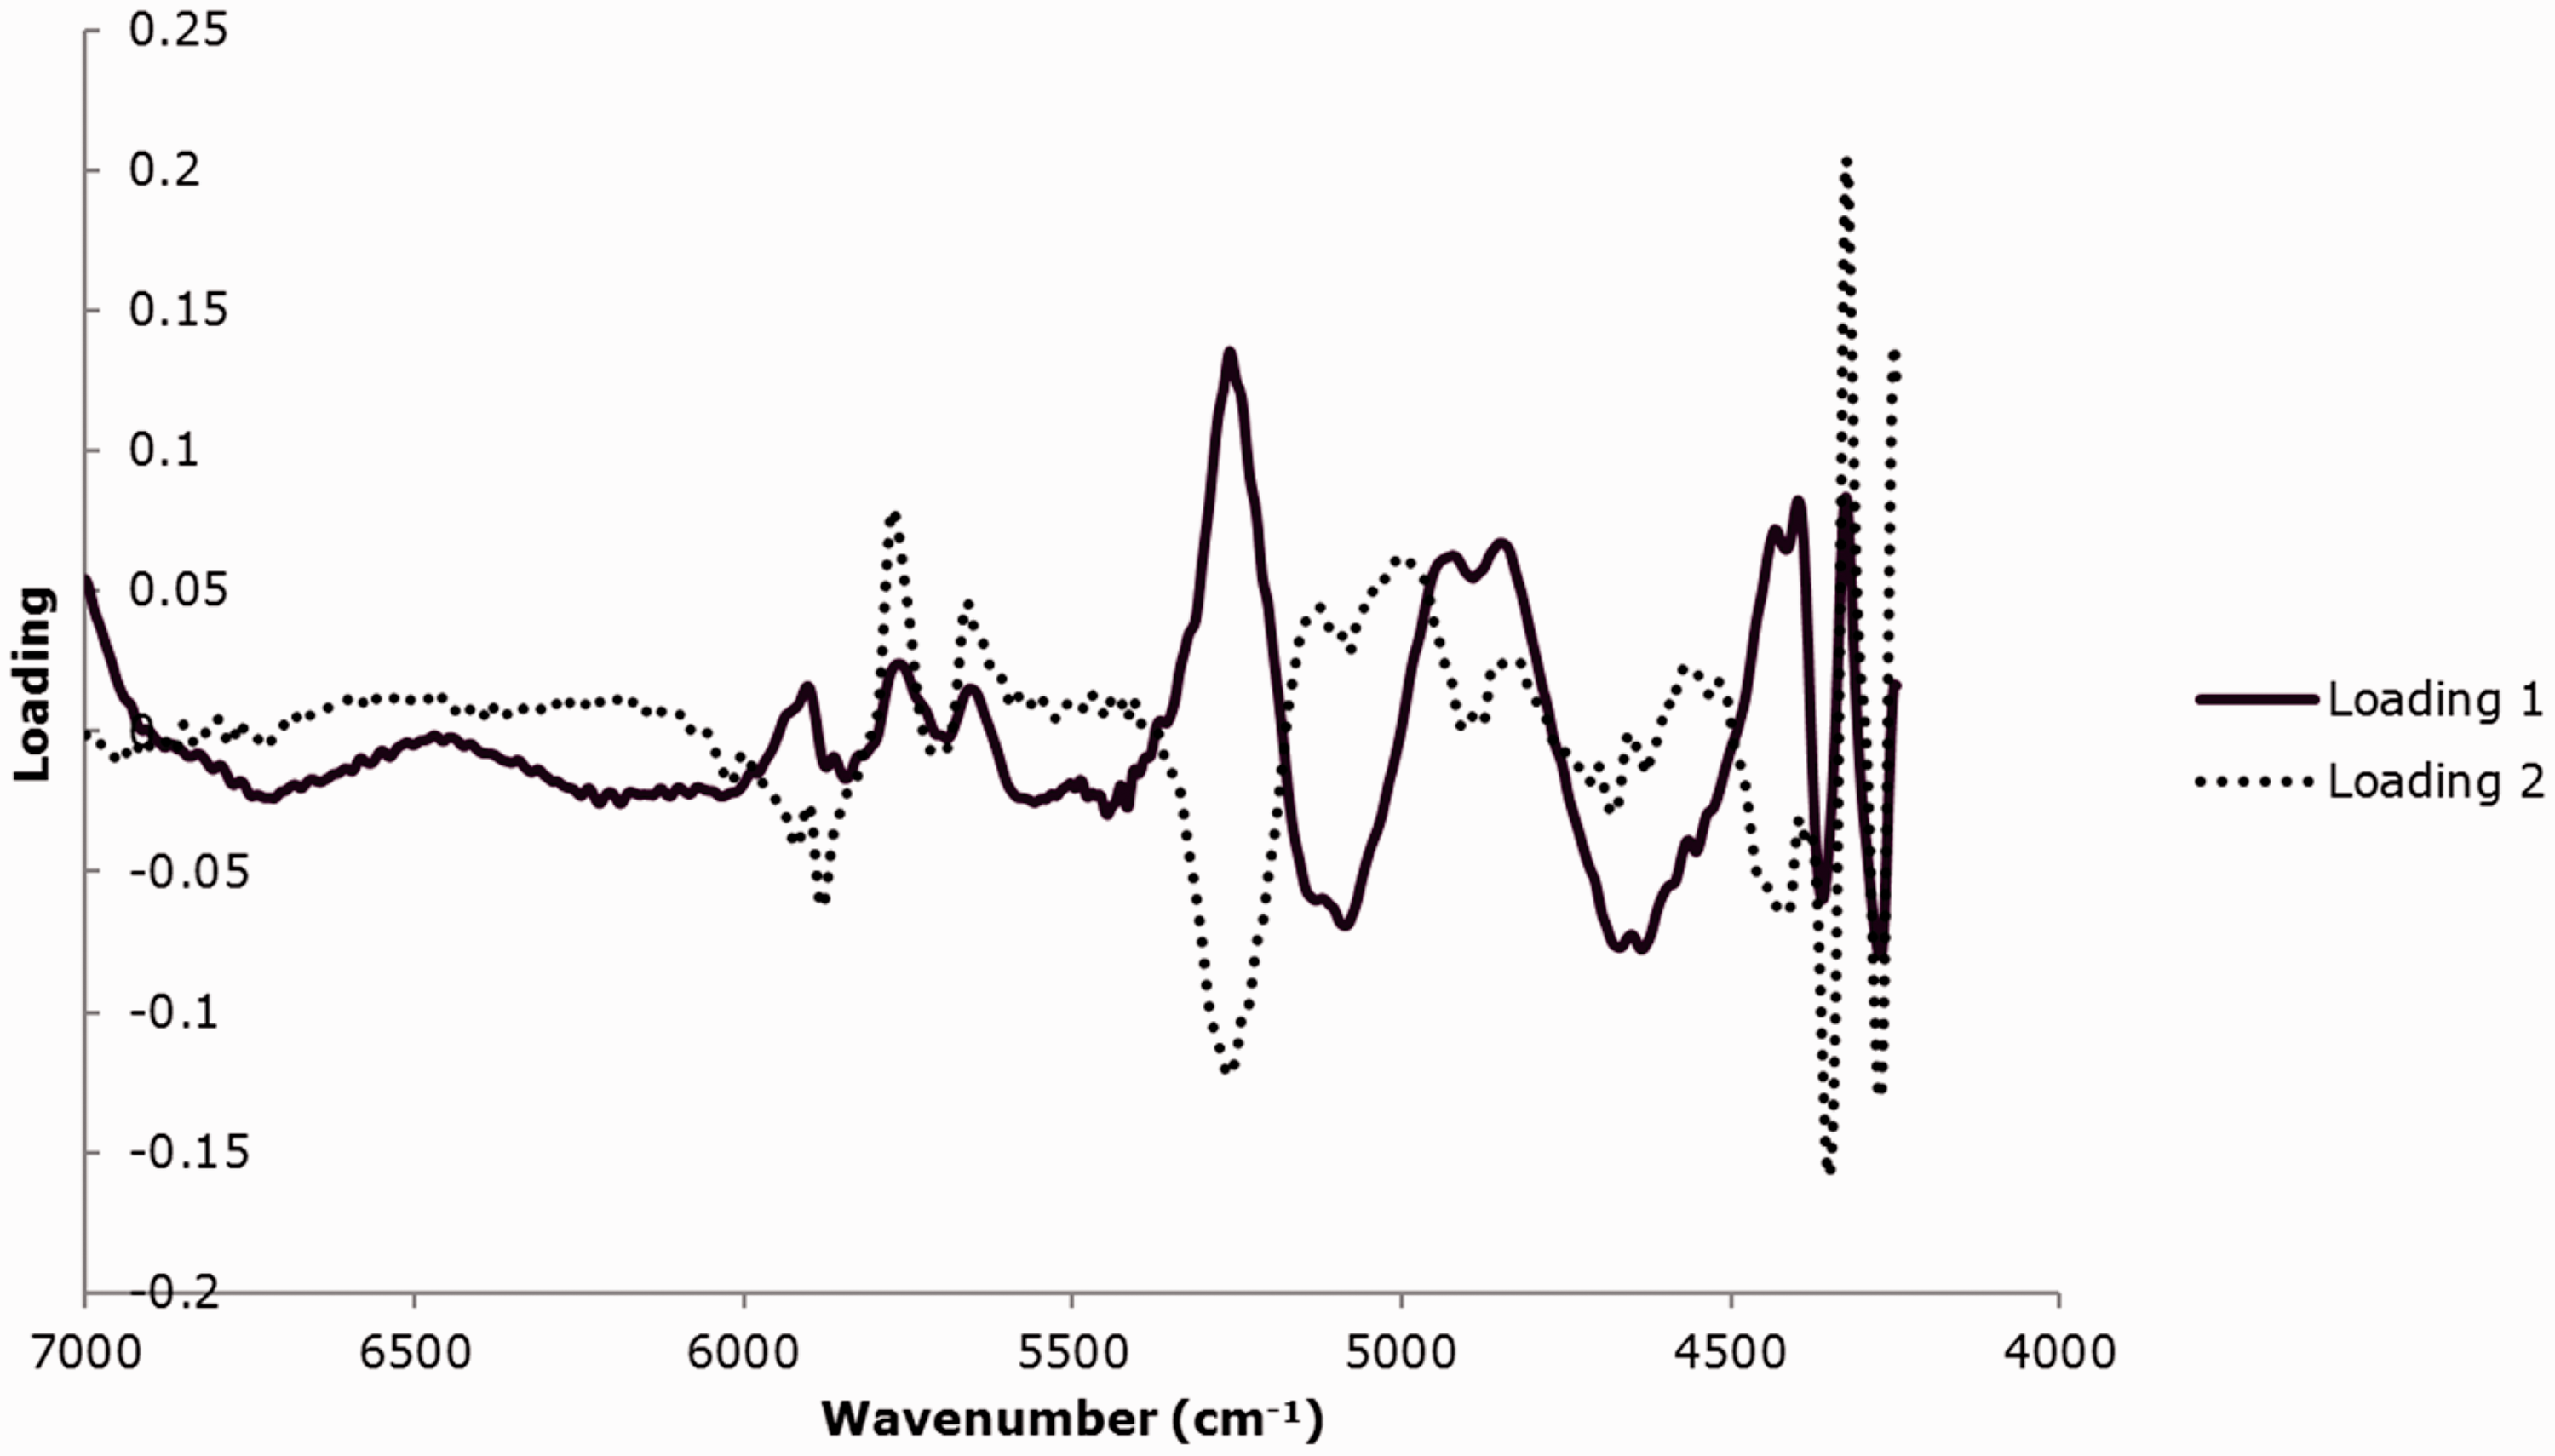
Validation statistics of the evaluated parameters.
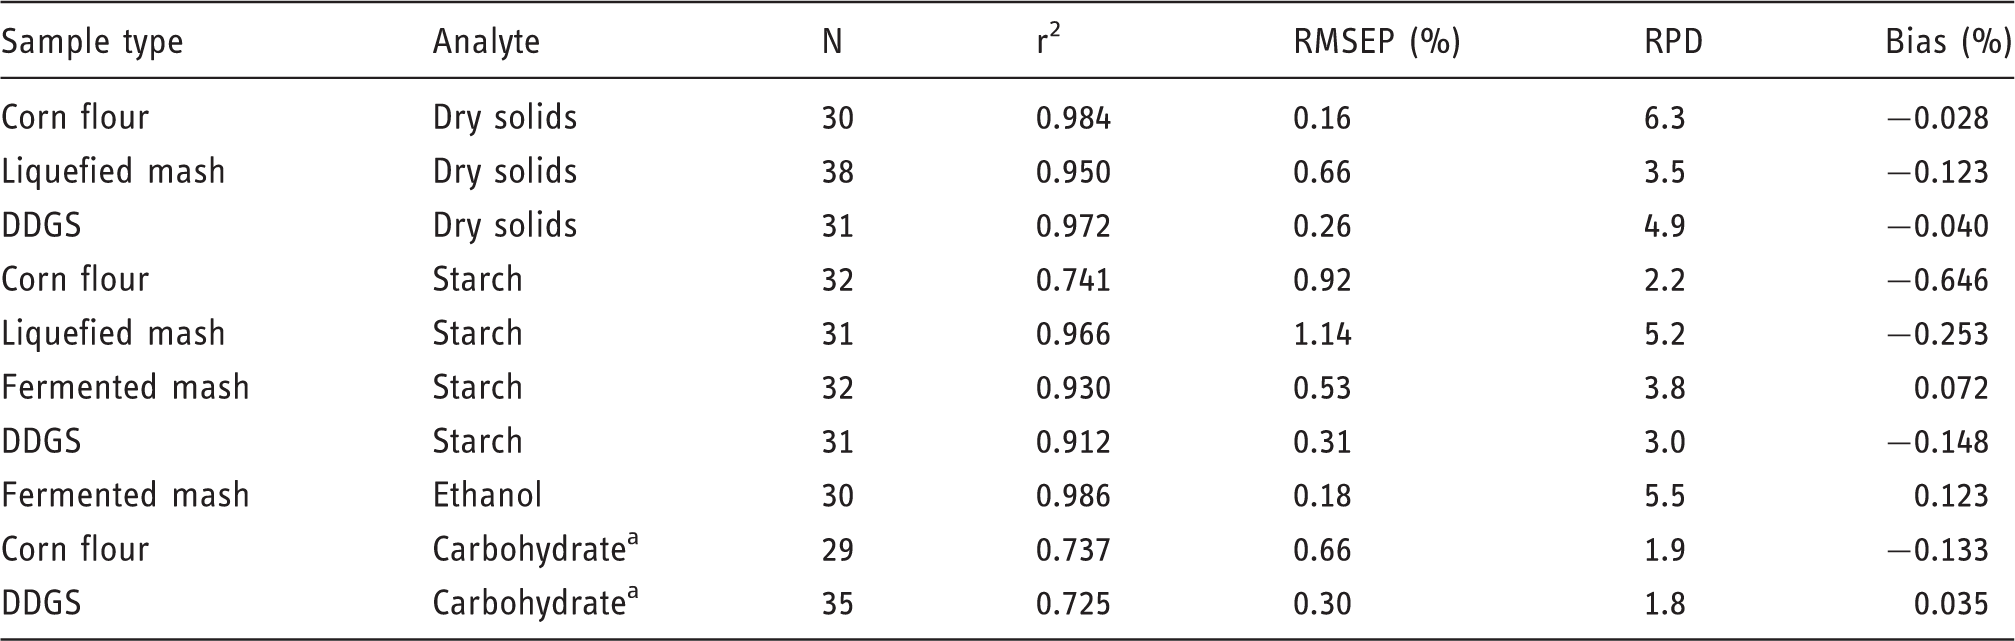
DDGS: distiller’s dried grains with solubles; RMSEP: root mean square error of prediction; RPD: residual predictive deviation.
Values indicate the carbohydrate content in dried samples.
Table 2 summarizes the statistics of PLS regression for ethanol content as the response variable for fermented mash. The PLS models were able to predict ethanol content in fermented mash with an average RMSECV of 0.18%. NIR spectra at selected wave numbers show better correlation to ethanol content than the entire NIR region. Major PLS loadings used for ethanol content prediction are shown in Figure 5, where the first three factors explain 90% of the variation. The loading graph demonstrates that the spectral range of 8000–5000 cm−1 explained most of the variations in ethanol content. Due to its complex nature, the absorption properties of fermented mash samples are strongly affected by the absorption of water and additionally affected by the other main constituents such as ethanol and grain residue. Therefore, band assignment for quantitative interpretation is complicated and challenging. It is generally agreed that the peaks between 5500–4500 cm−1 can be assigned to combination bands of the OH vibrations of alcohols.29,30 The broad peak in the region of 6800–6200 cm−1 can be attributed to the first overtone of hydroxyl groups.30,31 The region close to 5900 cm−1 may include the contributions from the first overtone of the CH3 asymmetric stretching, CH2 asymmetric stretching, and CH3 symmetric stretching vibrations. Engelhard et al.
29
found that the 5910 and 5817 cm−1 peaks increased as the ethanol concentration increased, which confirms that quantification is partially based on the spectral information of the target analyte.
Major PLS loading for ethanol determination with FT-NIR.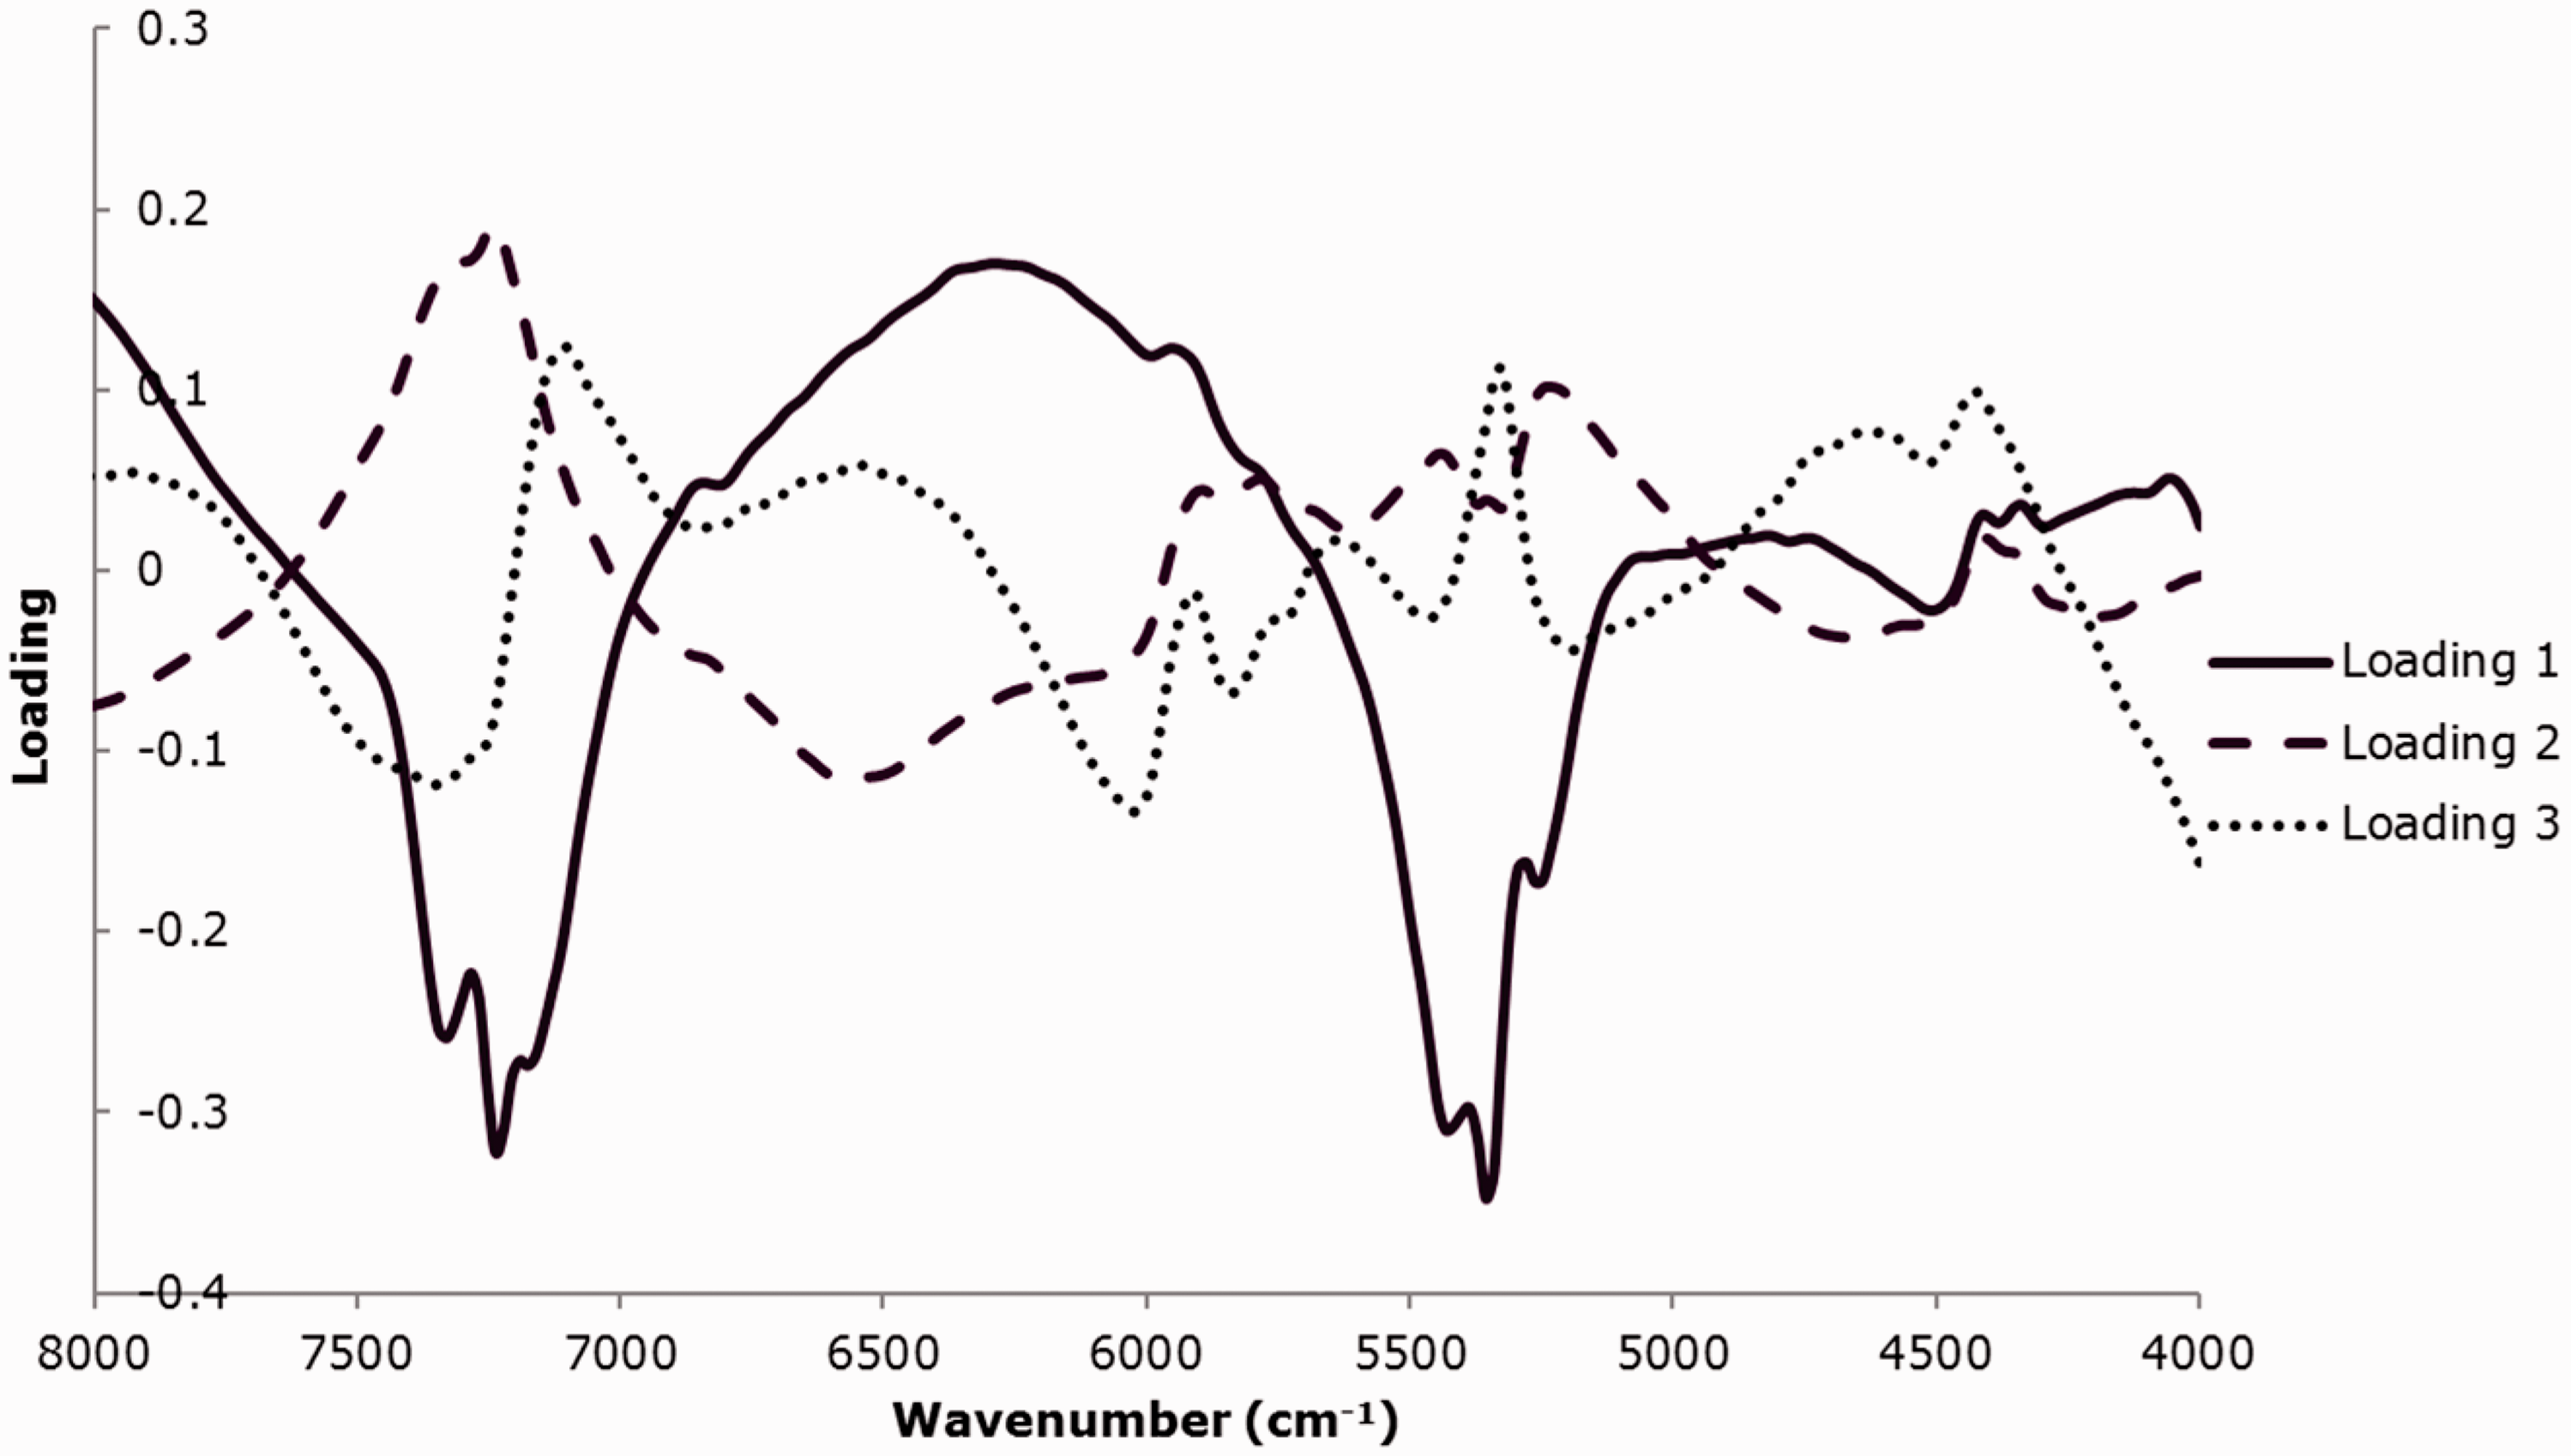
Validation of PLS models
Figure 6 shows the values measured by reference methods plotted against the ones predicted by Fourier transform (FT)-NIR for selected analytes in certain sample types. The graphs for the remaining samples are summarized in supplementary materials. Table 3 summarizes the description statistics of r, RMSEP, RPD, and bias.
Comparison of predicted to reference values for (a) dry solids content in corn flour, (b) dry solids content in DDGS, (c) ethanol content in fermented mash, (d) starch content in corn flour, (e) starch content in DDGS, and (f) carbohydrate content in DDGS.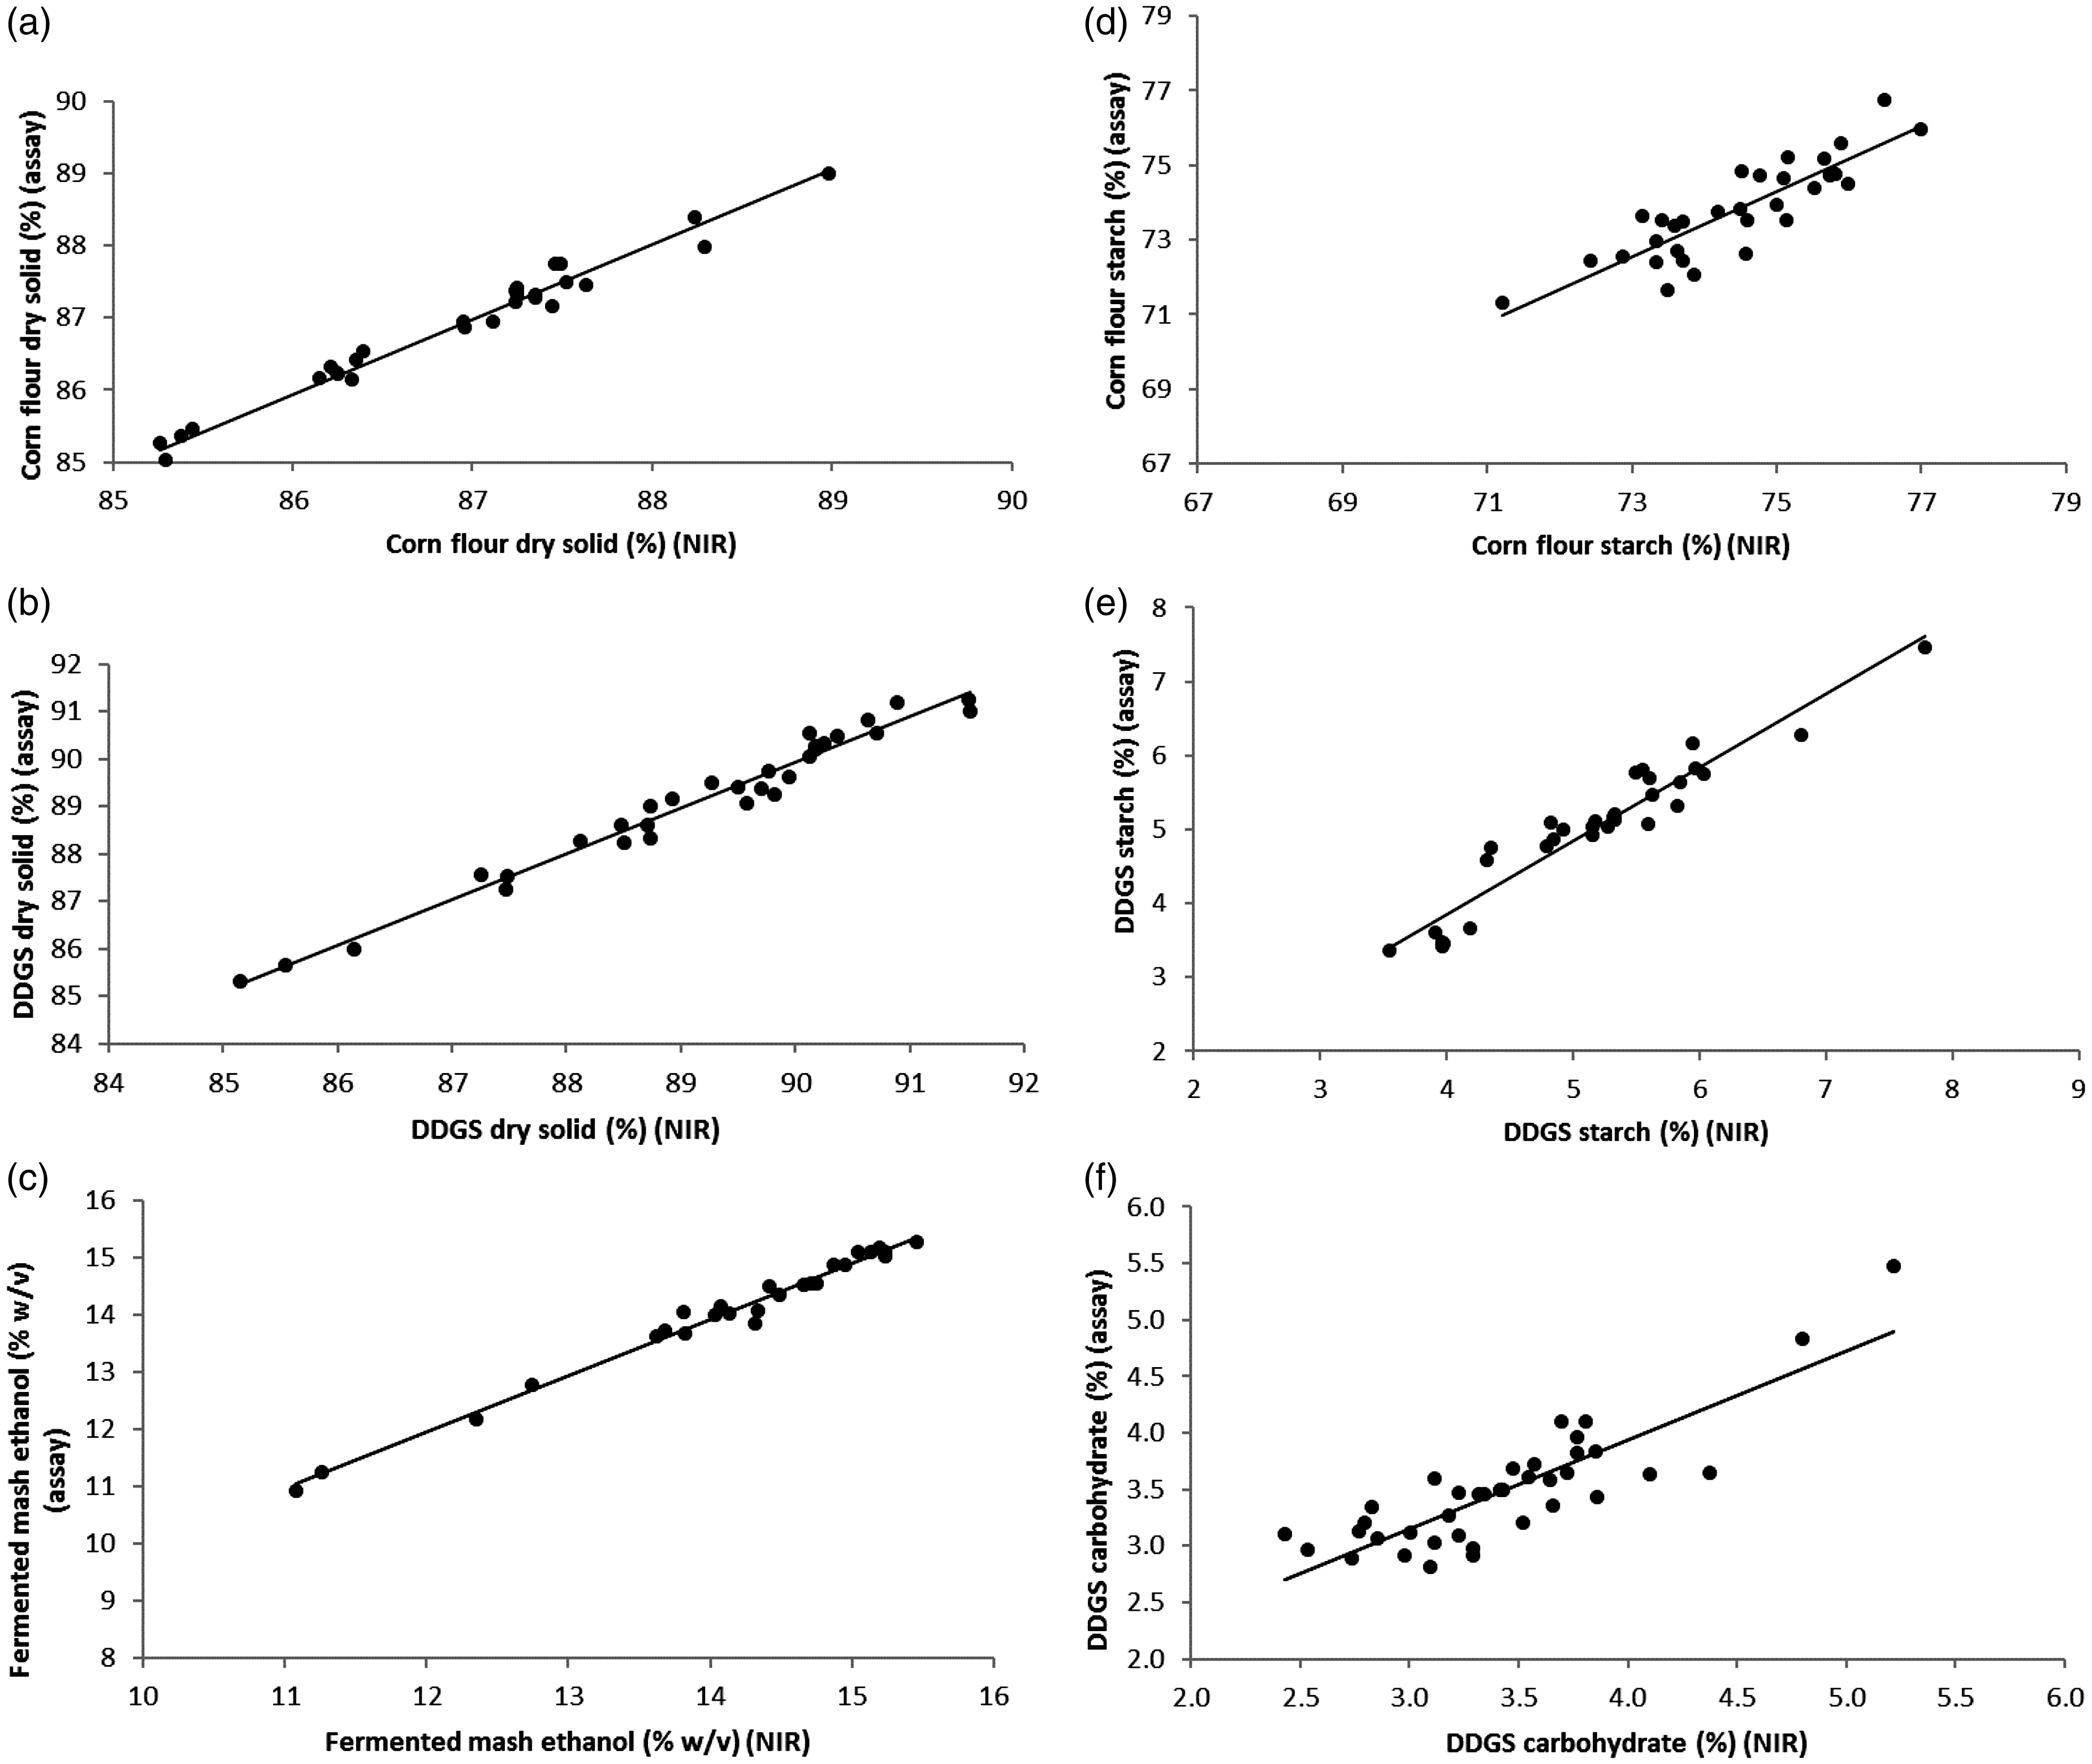
When NIR-based models were applied to the independent dataset, the regression models showed that the NIR predicted values and the assay results were highly correlated for dry solids and ethanol (Figure 6(a) to (c)). Low RMSEP and high RPD values were obtained which can be attributed to the few variables needed to describe the models and also to the accuracy of the reference methods. RPD values for starch in liquefied mash, fermented mash, and DDGS are >3, which was recommended by Williams and Sobering 17 as a desired value for an appropriate model. For prediction of starch and carbohydrate content in corn flour (Figure 6(d) and Figure S1d in supplementary materials), the low RPD can be explained as follows. The dataset used for calibration and validation was highly clustered. Although the carbohydrate content in corn flour was in the range of 61–82%, 86% of the samples were concentrated in the narrow region of 70–74%. A similar trend was observed for starch data, where 71% of the samples fell in the range of 71–76%. The relatively stable composition in corn is widely observed in agricultural products, which are constrained by their genetics and therefore have nutritional values less impacted by the conditions of production. However, the accurate determination of starch/carbohydrate content is challenging due to the presence of recalcitrant starch, which is resistant or inaccessible to enzyme activities. As a result, the prediction models for corn flour starch and carbohydrate had lower r2 and RPD values below 3. For highly clustered samples, the RMSEP value, which estimates the standard deviation (square root of the variance) of the measurement error of the reference value, may be a better indicator of the model quality. For DDGS (Figure 6(e)), in addition to the challenges associated with determination of recalcitrant starch that is typically present at low levels, the difficulty also involves selection of a calibration population that includes all variances in future prediction. DDGS compositions can be highly complex due to the variety of their processing conditions. It is very challenging, sometimes impossible, to include representative, well-distributed data points that cover all the sample characteristics. A calibration model in which the new variation is not modeled can easily disturb the prediction process and lead to inaccurate results. To get more robust models, continuous model maintenance and updates are needed to account for the source of variances.
Conclusions
This study demonstrates the feasibility of predicting operational parameters in corn processing products with FT-NIR spectrometry. Dry solids, ethanol in fermented mash, carbohydrate in corn flour and DDGS can be analyzed without additional pretreatment. To quantify starch content accurately, sugars and dextrins have to be removed before spectra are collected. For most parameters, the PLS models developed showed sufficient accuracy as indicated by r2, RMSE, and RPD. DDGS is the most challenging sample type. Prediction of starch and carbohydrate in DDGS was less accurate due to its chemical complexity, low starch/carbohydrate level, and less accurate reference analytical method.
Footnotes
Acknowledgements
The authors thank Drs. Hua Yu, Kurt Creamer, and Feng Xu for helpful comments on earlier drafts of this paper.
Declaration of conflicting interests
The author(s) declared no potential conflicts of interest with respect to the research, authorship, and/or publication of this article.
Funding
The author(s) disclosed receipt of the following financial support for the research, authorship, and/or publication of this article: The funding of this study was provided by Novozymes North America.