
Abstract
This paper describes the use of near infrared spectroscopy as a tool for the determination of moisture and resin content on papers impregnated with melamine-formaldehyde resins for high-pressure laminate production. The papers had different colours and grammages. The near infrared analysis range comprised wavelengths between 12,000 cm−1 and 4000 cm−1. Several multivariate calibration procedures and pre-processing techniques were tested for selection of the best spectral interval, including interval partial least-square, forward interval partial least-square and synergy interval partial least-square. The performance of calibration models was evaluated computing the root mean-squared error of cross-validations and the coefficient of determination (R2). An external validation procedure was done using different decorative papers (red, pearl, yellow, violet and pale green). The performances of the best models were compared using the statistical criterion root mean square error of prediction. It was shown that the developed models can be applied in the determination of resin content independently of the grammage and colour of the papers. However, regarding the volatile content, the models seemed to be affected by external factors, such as the presence of dyes and pigments, and were only applicable to papers having spectra similar to those used in the calibration model.
Keywords
Introduction
High-pressure laminates (HPL), manufactured with paper and thermosetting resins, are a value-added product that have been increasingly used for home and commercial surfaces. Three types of paper are used in the manufacture of HPL: kraft, decorative and overlay. The kraft paper is impregnated with phenolic resin and used in the lower layers of the HPL. It provides mechanical and moisture resistance to the laminate. The decorative and overlay papers are impregnated with melamine-formaldehyde resin, which, unlike phenolic resin, is colourless. The decorative paper is responsible for the aesthetic aspect of the HPL (colour and pattern), while the overlay, if used, provides improved abrasion resistance. Typically, an HPL is obtained by pressing a set of four kraft sheets topped with one decorative and one (optional) overlay paper, at 80–100 bar and 140–150℃. The hot-pressing procedure promotes chemical curing of the impregnation resins leading to strong adhesion of the sheets and formation of a hard and mechanically resistant surface.
When the decorative paper is impregnated with resin, it is essential to measure the volatile (VC) and resin contents (RC), which ensure the quality of the final HPL. RC directly influences the visual appearance of the HPL since an appropriate amount of resin in the paper is necessary to form a homogeneous surface during hot-pressing. On the other hand, the volatile content indicates whether the paper has been dried properly. If the volatile content is too high the sheets can stick together when being piled before being sent to the hot press for curing. If this parameter is too low, the paper may have been dried excessively after impregnation and the resin may have reacted prematurely and inter-sheet bonding during the curing process may be compromised.1,2 These parameters are currently measured by operators by sample weighing. This is time consuming and subject to operator and equipment error.
Near infrared (NIR) spectroscopy is an interesting approach for characterizing resin-impregnated paper, due to its non-destructive nature, straightforward data collection procedure, short processing time and accuracy. This technology has been successfully applied in different fields such as pharmaceutical,3,4 forestry,5–7 cosmetics, 8 industrial chemistry9,10 and others.
So far, few studies have been done on the use of NIR spectra for characterizing impregnated paper. Dessipri et al. 11 used the NIR technology to compare NIR spectra of a paper recently impregnated with resin and spectra of artificially aged impregnated paper. Very different spectra were obtained from aged and recently impregnated papers. These changes were attributed to the difference in RC and moisture content (VC) of the samples. A methodology for measuring the volatile content on laminating paper products was reported by Nakos and co-workers, but lacked information on method reproducibility. 12
NIR spectroscopy must be combined with chemometrics in order to extract maximum information. Some of the techniques include principal component analysis (PCA), discriminant analysis (DA) and partial least-squares (PLS). 3 In the PLS approach, the regressions are computed with least squares algorithms. The goal is to establish a linear relation between two matrices, the spectral data X and the reference values Y. This technique models both X and Y in order to find out the variables in X matrix that will best describe the Y matrix. 3 However, the full spectrum of the PLS model can be easily disturbed by irrelevant components, which influence the quality and precision of the calibration model. Thus, selecting an appropriate spectral region is important. In recent years, both theoretical and experimental evidence have been published to prove that spectral region selection can significantly improve the performance of the full-spectrum techniques, such as interval partial least-square (iPLS), forward interval partial least-square (fiPLS) and synergy interval partial least-square (siPLS).13,14 Pre-processing of the data must be performed prior to PLS modelling in order to minimize undesirable scatter effects that influence the recorded sample spectra. 15
The aim of this work was to determine the feasibility of using FT-NIR spectroscopy combined with different PLS methods and pre-processing techniques for the determination of resin and moisture contents in decorative papers impregnated with melamine-formaldehyde resin. The study includes papers of different colours and grammages.
Experimental
Materials
A commercial melamine-formaldehyde resin, impregnation additives (acid catalyst, release agent and surfactant) and impregnated decorative papers with different colours and grammage (red, 100 g m−2; yellow, 100 g m−2; violet, 82 g m−2; pearl, 91 g m−2; pale green, 91 g m−2) were all supplied by Euroresinas – Indústrias Químicas, S.A. (Sines – Portugal).
Impregnated paper
Paper impregnation
Red paper sheets of 21 × 30 cm2 were impregnated with the commercial resin using additives (acid catalyst, release agent and surfactant). All papers were impregnated in a two-step processes consisting of two baths. The paper was fully impregnated in the first bath and then oven-dried at 140℃. In the second bath, the sheets were impregnated only on the front side and resubmitted to an oven at 140℃. The latter procedure, designated coating, ensured good resin impregnation in the front side of the paper. In both cases, the drying time was optimized in order to obtain the desired resin and volatile contents.
Industrially impregnated papers have a narrow range of variability in terms of resin and volatile content (normally 54–56% for RC and 6–7% for volatile content), due to the tight control of process variables. In order to increase the range of calibration of these two parameters, some decorative paper samples were manually impregnated and included in the model.
Calibration and validation samples
A total of 105 samples of impregnated decorative red paper (impregnated industrially and manually) were used for the RC calibration. The RCs ranged from 43.6% to 58.5%. Regarding volatile content, 87 samples of impregnated decorative red paper were used for the calibration of volatile content (once again impregnated manually and industrially) within a range from 3.1% to 10.2% related to the amount of volatile content.
Sets of impregnated decorative papers with different colours were used for validation analysis, namely red with 100 g m−2 (30 samples), yellow with 100 g m−2 (33 samples), violet with 82 g m−2 (29 samples), pearl colour of with g m−2 (24 samples) and pale green colour with 91 g m−2 (29 samples). All impregnated papers for the validation set had a RC within the range of 54–56% and a volatile content of 6–7%. These ranges are within the industrial range.
In the case of RC, the determination was accomplished by differential weighing after the impregnation. For the volatile content, the determination of the residual moisture content (volatile content) was also accomplished by differential weighing, but in this case, after a 5-min drying at 160℃.
NIR equipment and software
The samples were scanned using a spectrometer Matrix-F Bruker with a probe QR400-7-VIS/BX Premium 400 µm Reflection from Ocean Optics (https://oceanoptics.com/product-category/nirquest-series/). The spectrum for each paper was recorded in the wavenumber range of 12,000–4000 cm−1 by signal averaging of 64 scans at a resolution of 16 cm−1. For each paper sample, three NIR spectra were collected randomly and averaged. The reflection probe was placed directly on the paper samples for spectra collection.
The chemometric analysis was processed using iToolbox for Matlab (www.models.life.ku.dk/itoolbox). 16 Principal Component Analysis (PCAs) were performed using OPUS QUANT 2 (Bruker).
Data analysis
Selection of wavelength regions by different PLS models
Partial least-squares (PLS)
PLS is a multivariate data analytical technique designed to handle intercorrelated regressors. It is based on Herman Wold’s general PLS principle, in which complicated, multivariate systems analysis problems are solved by a sequence of simple least-squares regressions. 17 Prior to PLS, a mean centre of each spectrum was performed before any further pre-processing calculation.
Interval partial least-squares (iPLS)
The principle of iPLS algorithm is to split the spectra into smaller equidistant regions and, afterwards, develop PLS regression models for each of the sub-intervals. Thereafter, an average error is calculated for each sub-interval and for the full-spectrum. The region with the lowest error is chosen. 18
Forward interval partial least-squares (FiPLS)
In the forward iPLS (FiPLS) algorithm, the data set is split into a given number of intervals similar to iPLS, but the PLS models are built using successively improving intervals with respect to the root mean-squared error of cross validation (RMSECV) measure. 18
Synergy interval partial least squares (SiPLS)
Synergy interval PLS algorithm is the expansion of the interval PLS algorithm. First of all, it equally divides the whole spectra into several sub-intervals, then performs a PLS regression through permutation and combination with different numbers and different sub-intervals. 14
Data preprocessing
Typically, in NIR spectra, the analytical information is contained in fine spectral variations that are usually dominated by features such as light scattering, background noise and baseline drift. These unwanted variations can have adverse effects on the development of a calibration. 19 Data processing techniques described below were tested as a strategy to minimize these issues.
First derivative
This technique is used to separate overlapping peaks and to correct for baseline shifts. A drawback of derivative spectra is the enhancement of noise. This drawback is avoided by smoothing the spectra with a Savistzky–Golay derivative algorithm. In this algorithm, a window is selected where the data are fitted by a first-order polynomial. The central point in the window is replaced by the value of the polynomial. In this study, a window of five points was used. 20
Standard normal variate (SNV)
SNV is a mathematical transformation method of the spectra used to remove slope variation and to correct for scatter effects. Each spectrum is corrected individually by first centring the spectral values. Then, the centred spectrum is scaled by the standard deviation calculated from the individual spectral values. 21
Calibration models, evaluation and validation
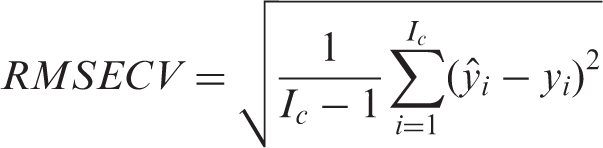
The performance of calibration models was evaluated computing the RMSECV and the coefficient of determination (R2). In RMSECV, a leave-one-sample-out cross-validation is performed: the spectrum of one sample of the training set is deleted from this set and a PLS model is built with the remaining spectra of the training set. The left-out sample is predicted with this model and the procedure is repeated with leaving out each of the samples of the training set. The RMSECV is determined according to
18
The number of PLS factors required to model the data is another major parameter, which represents the optimal number of factors (or latent variables) to retain for generating a predictive model. If this value is too small, the sample information in the spectra is not fully utilized. If the value is too big, extra noise may be included in the model. Therefore, it is necessary to select an appropriate number of PLS factors. 22 In this study, the optimum number of factors was identified as the one that gave the minimum RMSECV, up to a maximum of 10. The general goal was to obtain low values of RMSECV and high values of R2.
Validation
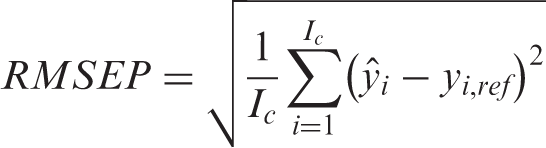
The external validation set was constituted by different decorative papers (red, pearl, yellow, violet and pale green), which were not employed for the construction of the chemometric model, allowing for a true assessment. In this sense, the performance of models developed with different strategies was compared using a statistical criterion, the RMSEP (root mean square error of prediction). This is determined, according to
18
Several algorithms were studied for different spectra interval divisions and interval combinations. For each PLS based methodology, the pretreatment of spectra was applied, including no preprocessing, first derivative and first derivative + SNV. Figure 1 shows a schematic diagram of all the methodologies studied to develop the calibration model of the resin and moisture content of red decorative papers.
Schematic diagram showing all the methodologies used during the calibration stage.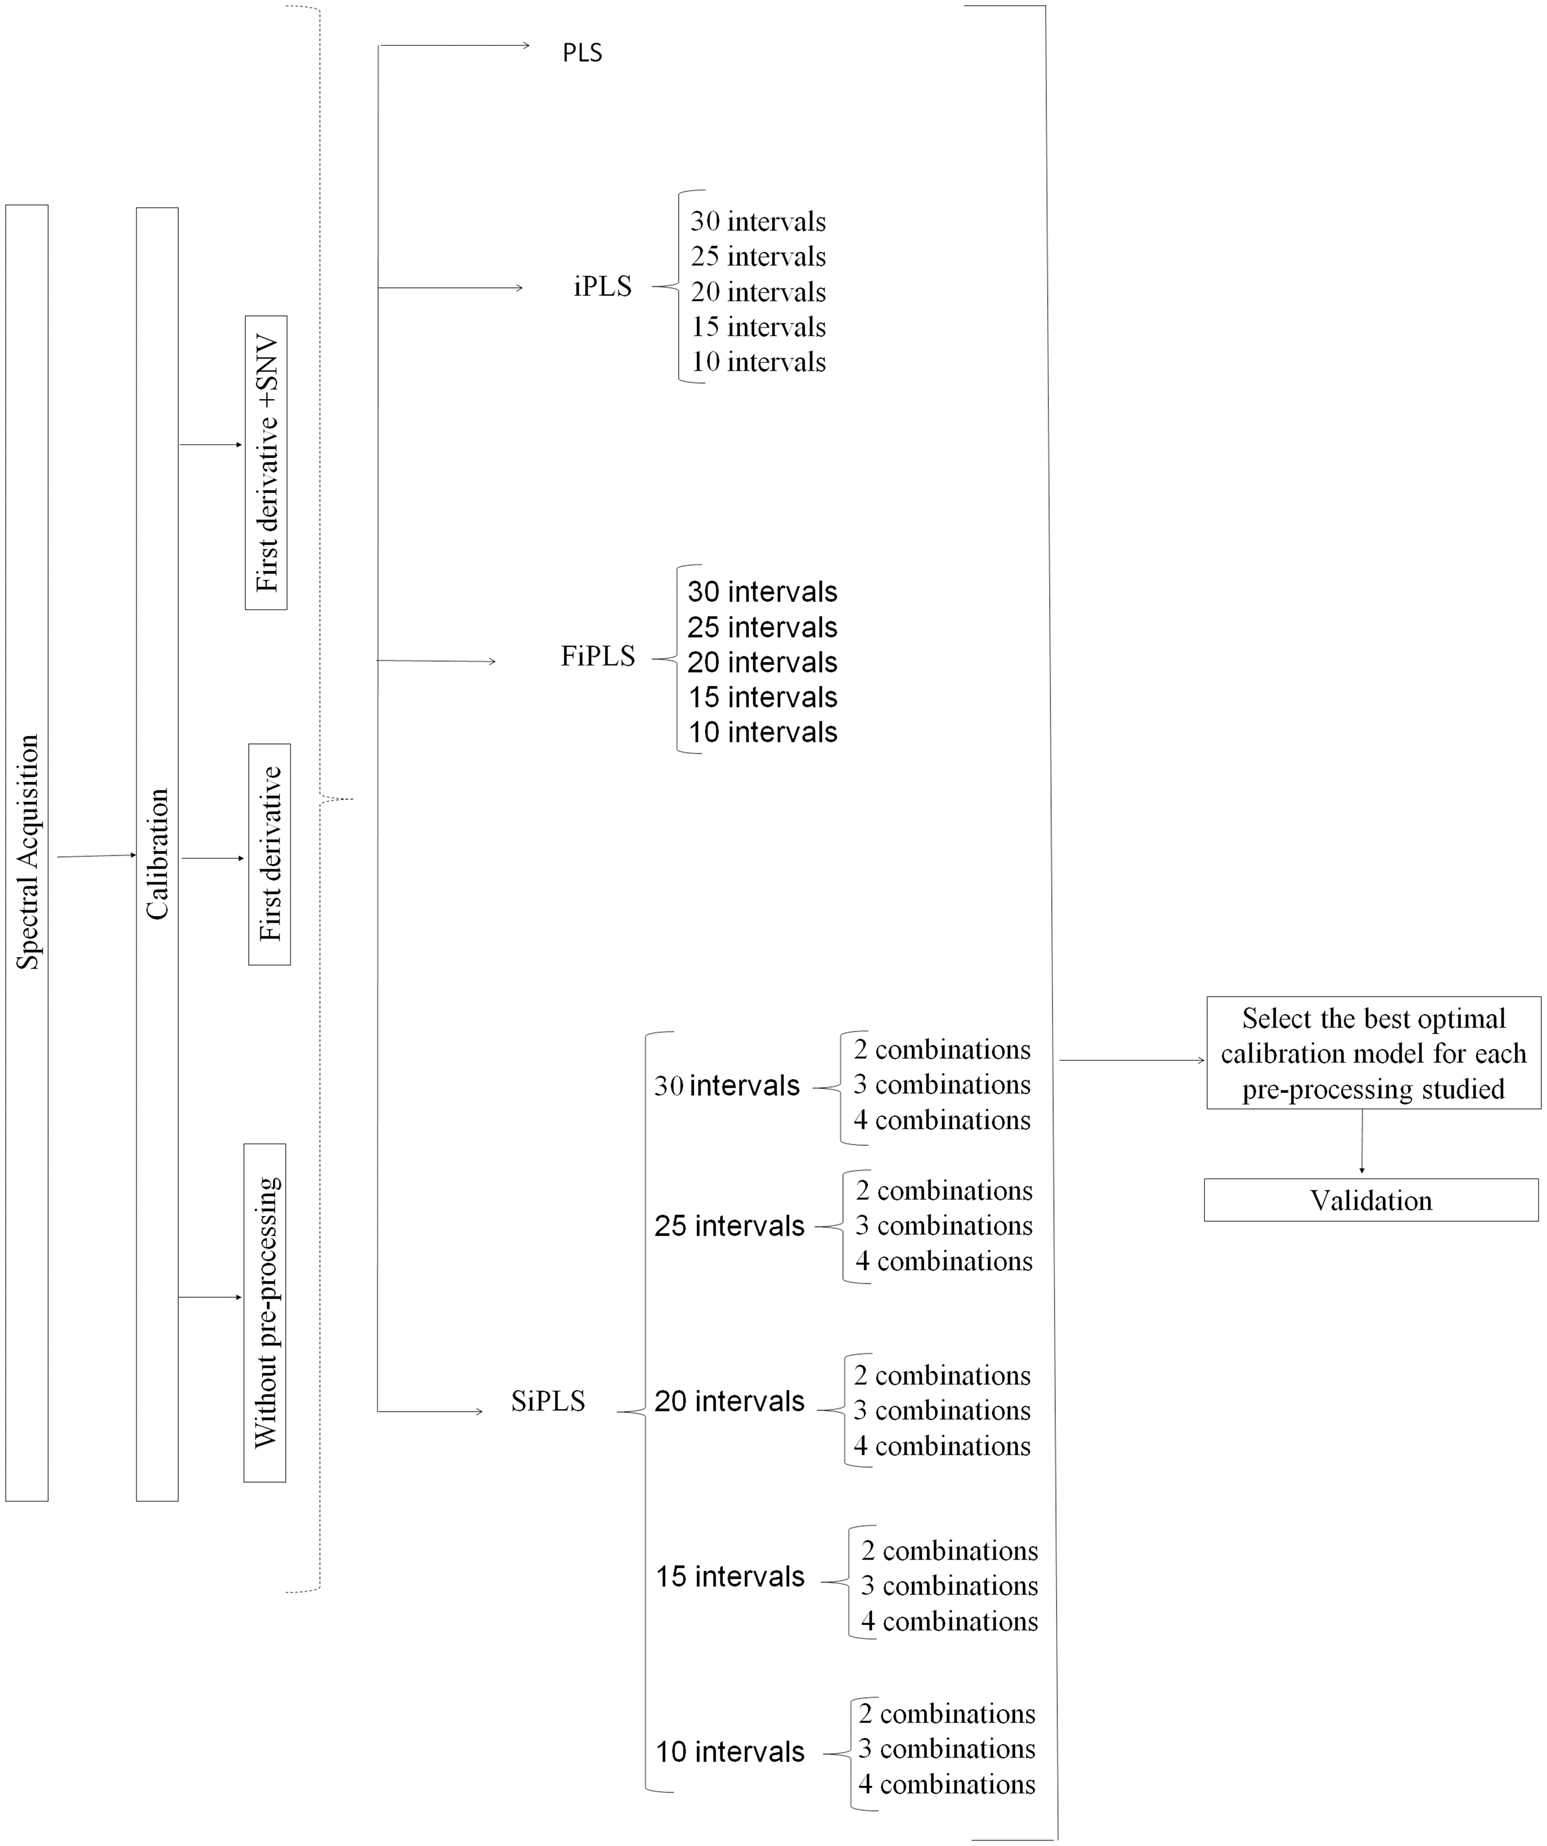
Results and discussion
Figure 2(a) shows a spectrum obtained for red decorative paper impregnated with melamine-formaldehyde resin. Pronounced bands are located in the regions between 7500–6000 cm−1 and 5200–4000 cm−1. The peaks at 6803 cm−1 and 4787 cm−1 can be assigned to O–H stretching and C–H deformation of cellulose and hemicellulose or methylene vibrations. The peak at 5020 cm−1 can be assigned to the O–H deformation vibration of water.
23
Between 6900–6450 cm−1, melamine shows three strong characteristic peaks. Of these, the peak at 6805 cm−1 is the N–H combination band from primary amides.
24
In the region 5000–4000 cm−1, the peaks can be assigned to N–H bending, at 5080–4980 cm−1, combinations vibrations of C–H at 4436 cm−1, and combinations vibrations of N–H at 4642 and 4549 cm−1.
25
Spectrum obtained for the décor paper (a) without pre-processing, (b) with first derivative and (c) with first derivative + SNV pre-processings. SNV: standard normal variate.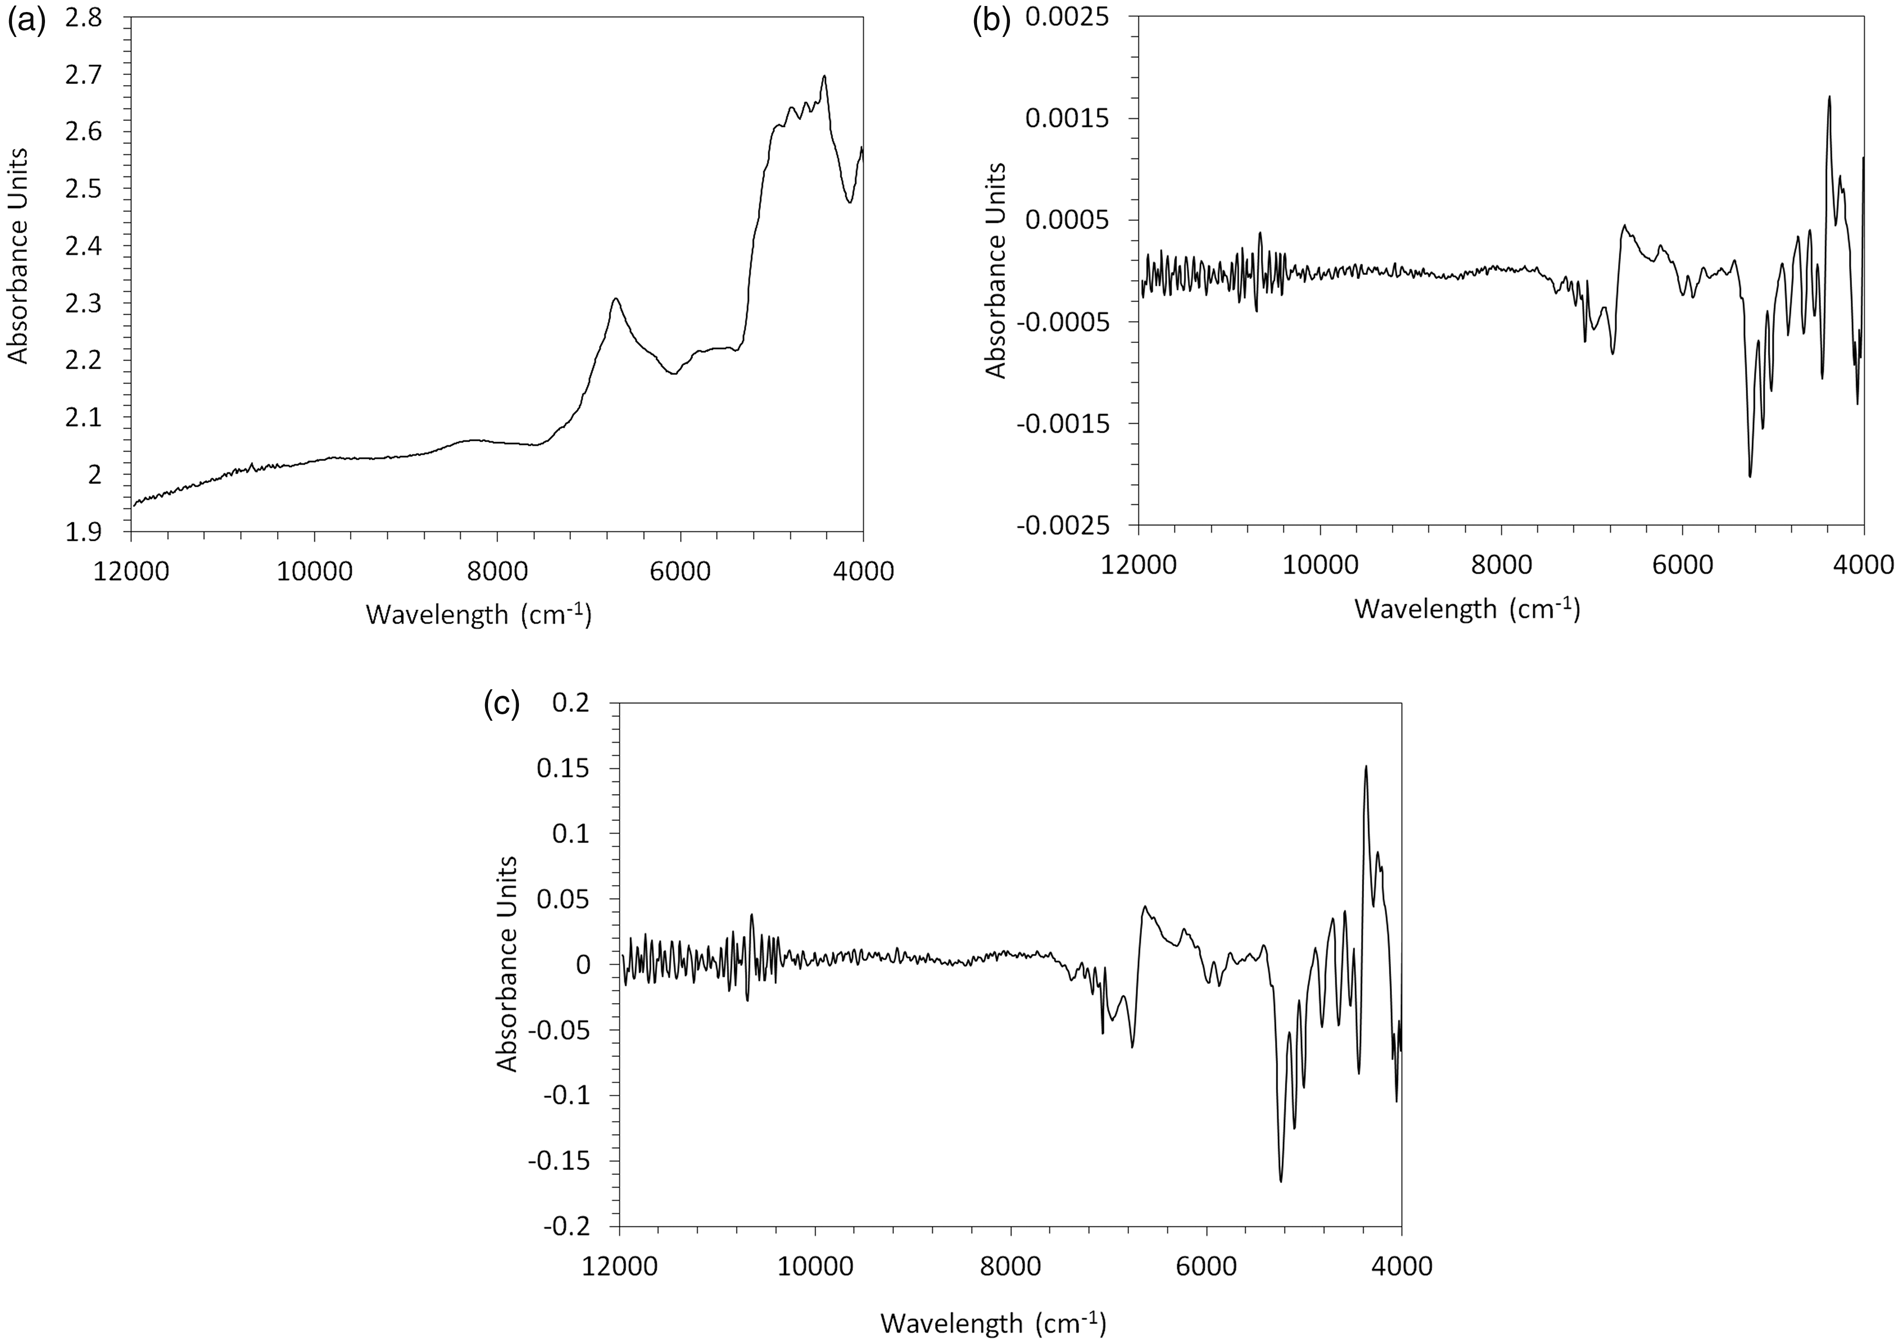
Figure 2(b) and (c) shows the spectra after the application of first derivative and first derivative combined with SNV pre-processings, respectively. With the use of first derivative, the overlapping peaks are separated, while the SNV eliminates linear and quadratic trends over the whole spectrum. 26
Selection of spectral interval and data pre-processing method for resin content determination
Selection of the best spectral interval by PLS, iPLS, FiPLS and SiPLS for the prediction of the resin content, without the use of any pre-processing.
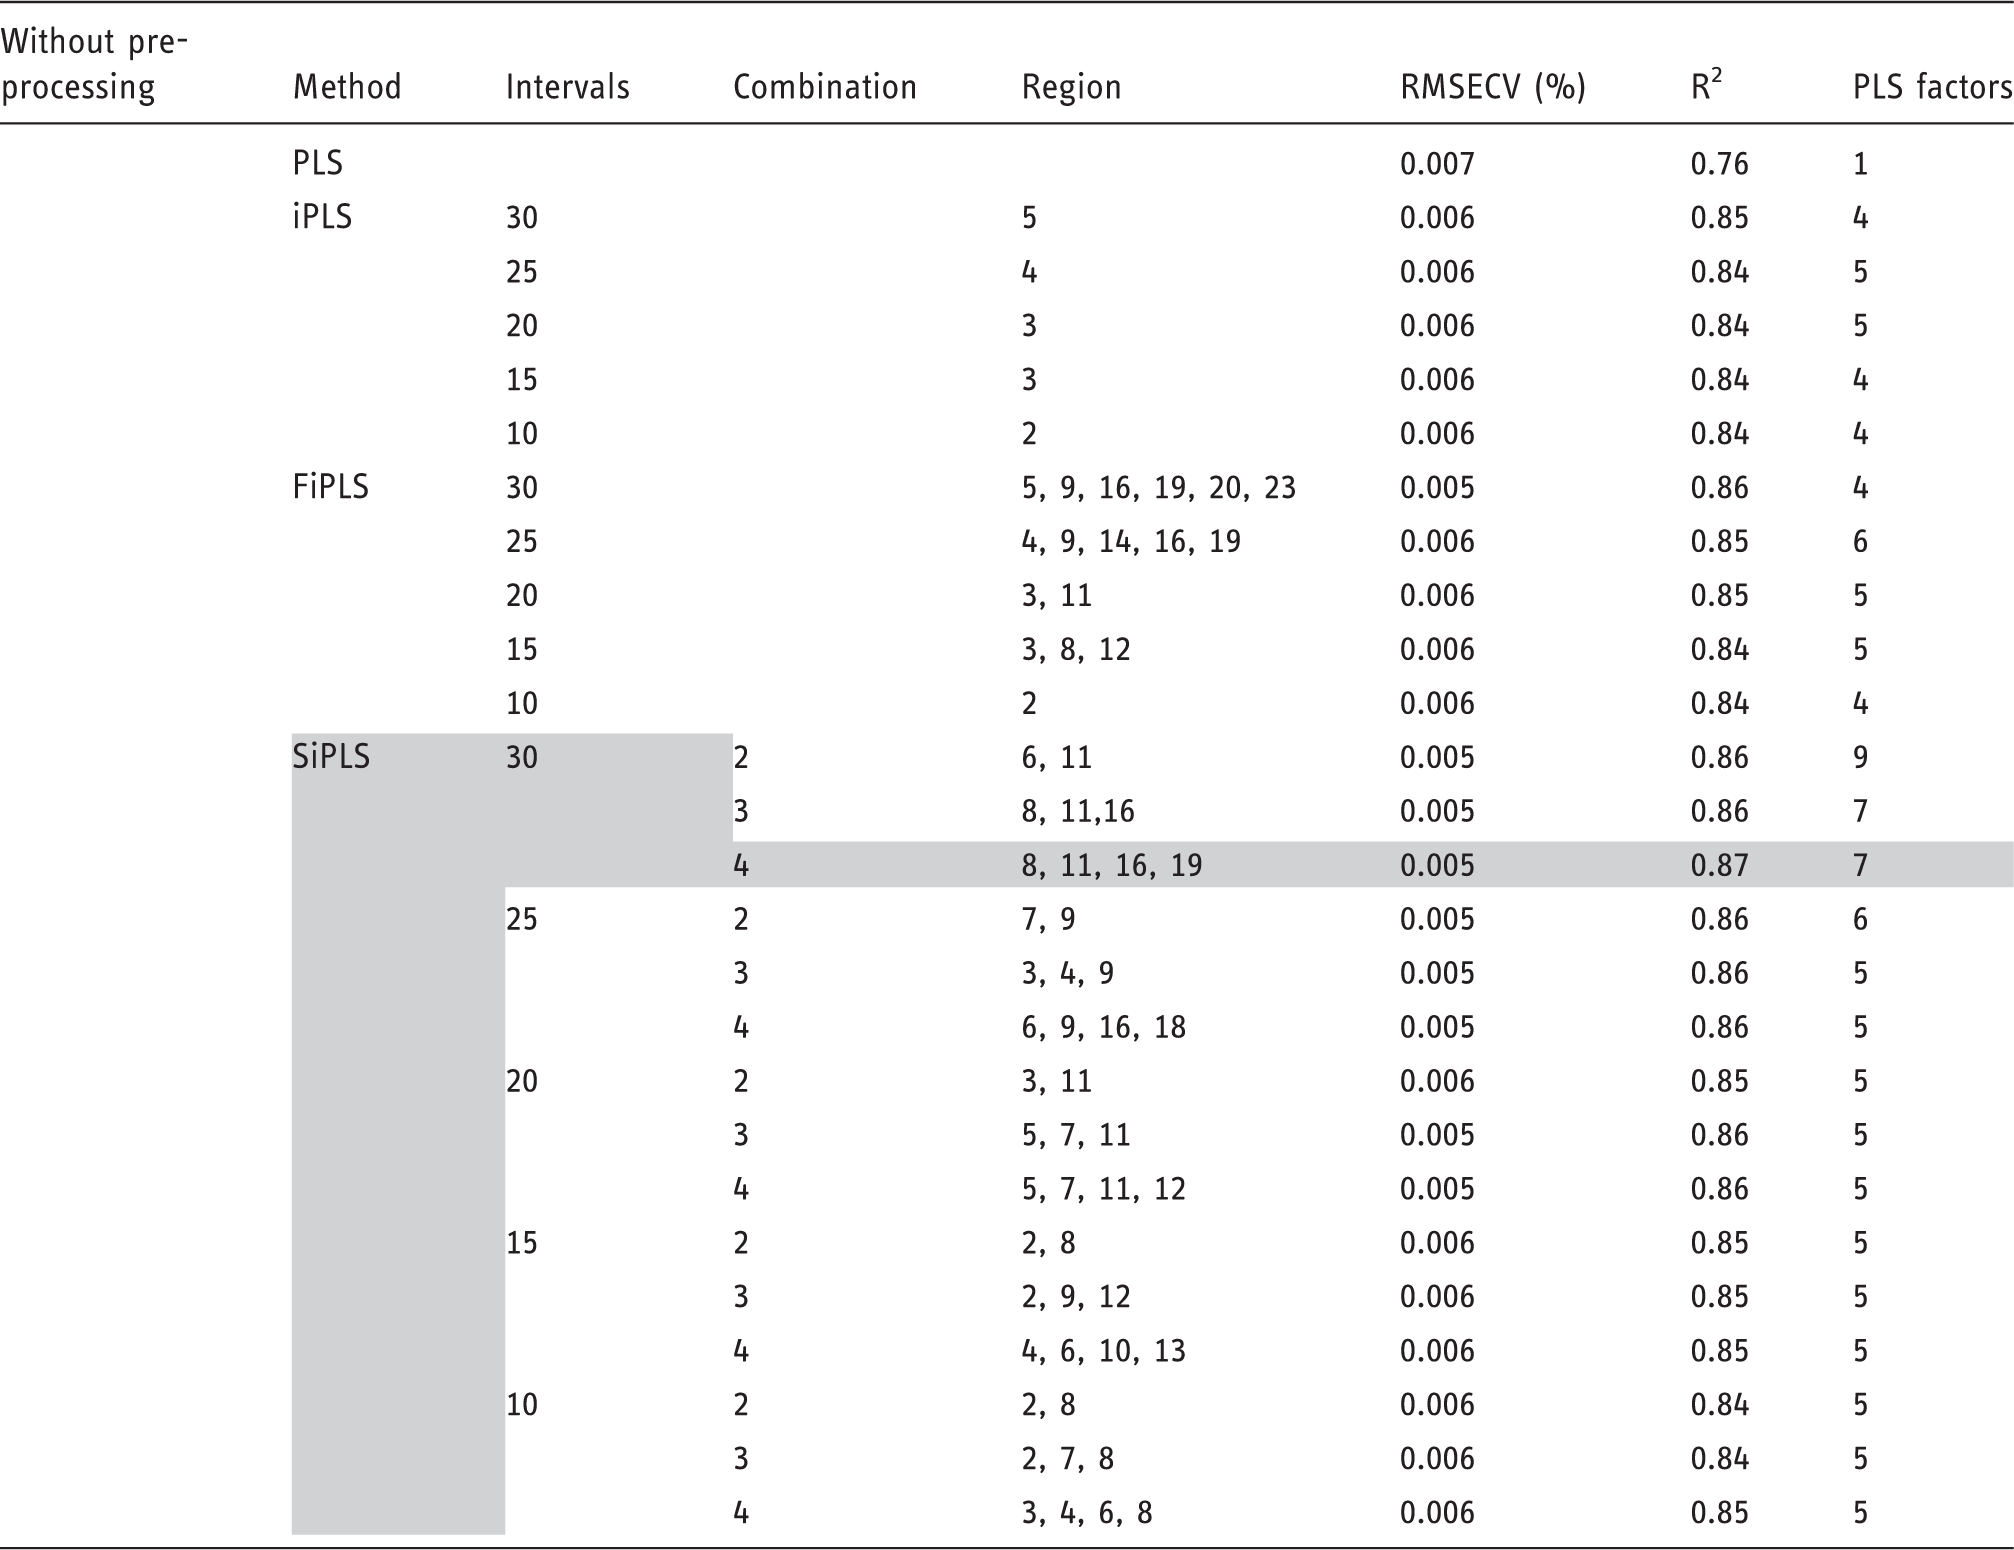
PLS: partial least-square; iPLS: interval partial least-square; FiPLS: forward interval partial least-square; SiPLS: synergy interval partial least-square; RMSECV: root mean-squared error of cross validation.
Selection of the best spectral interval by PLS, iPLS, FiPLS and SiPLS for the prediction of the resin content, using the first derivative as pre-processing.

PLS: partial least-square; iPLS: interval partial least-square; FiPLS: forward interval partial least-square; SiPLS: synergy interval partial least-square; RMSECV: root mean-squared error of cross validation.
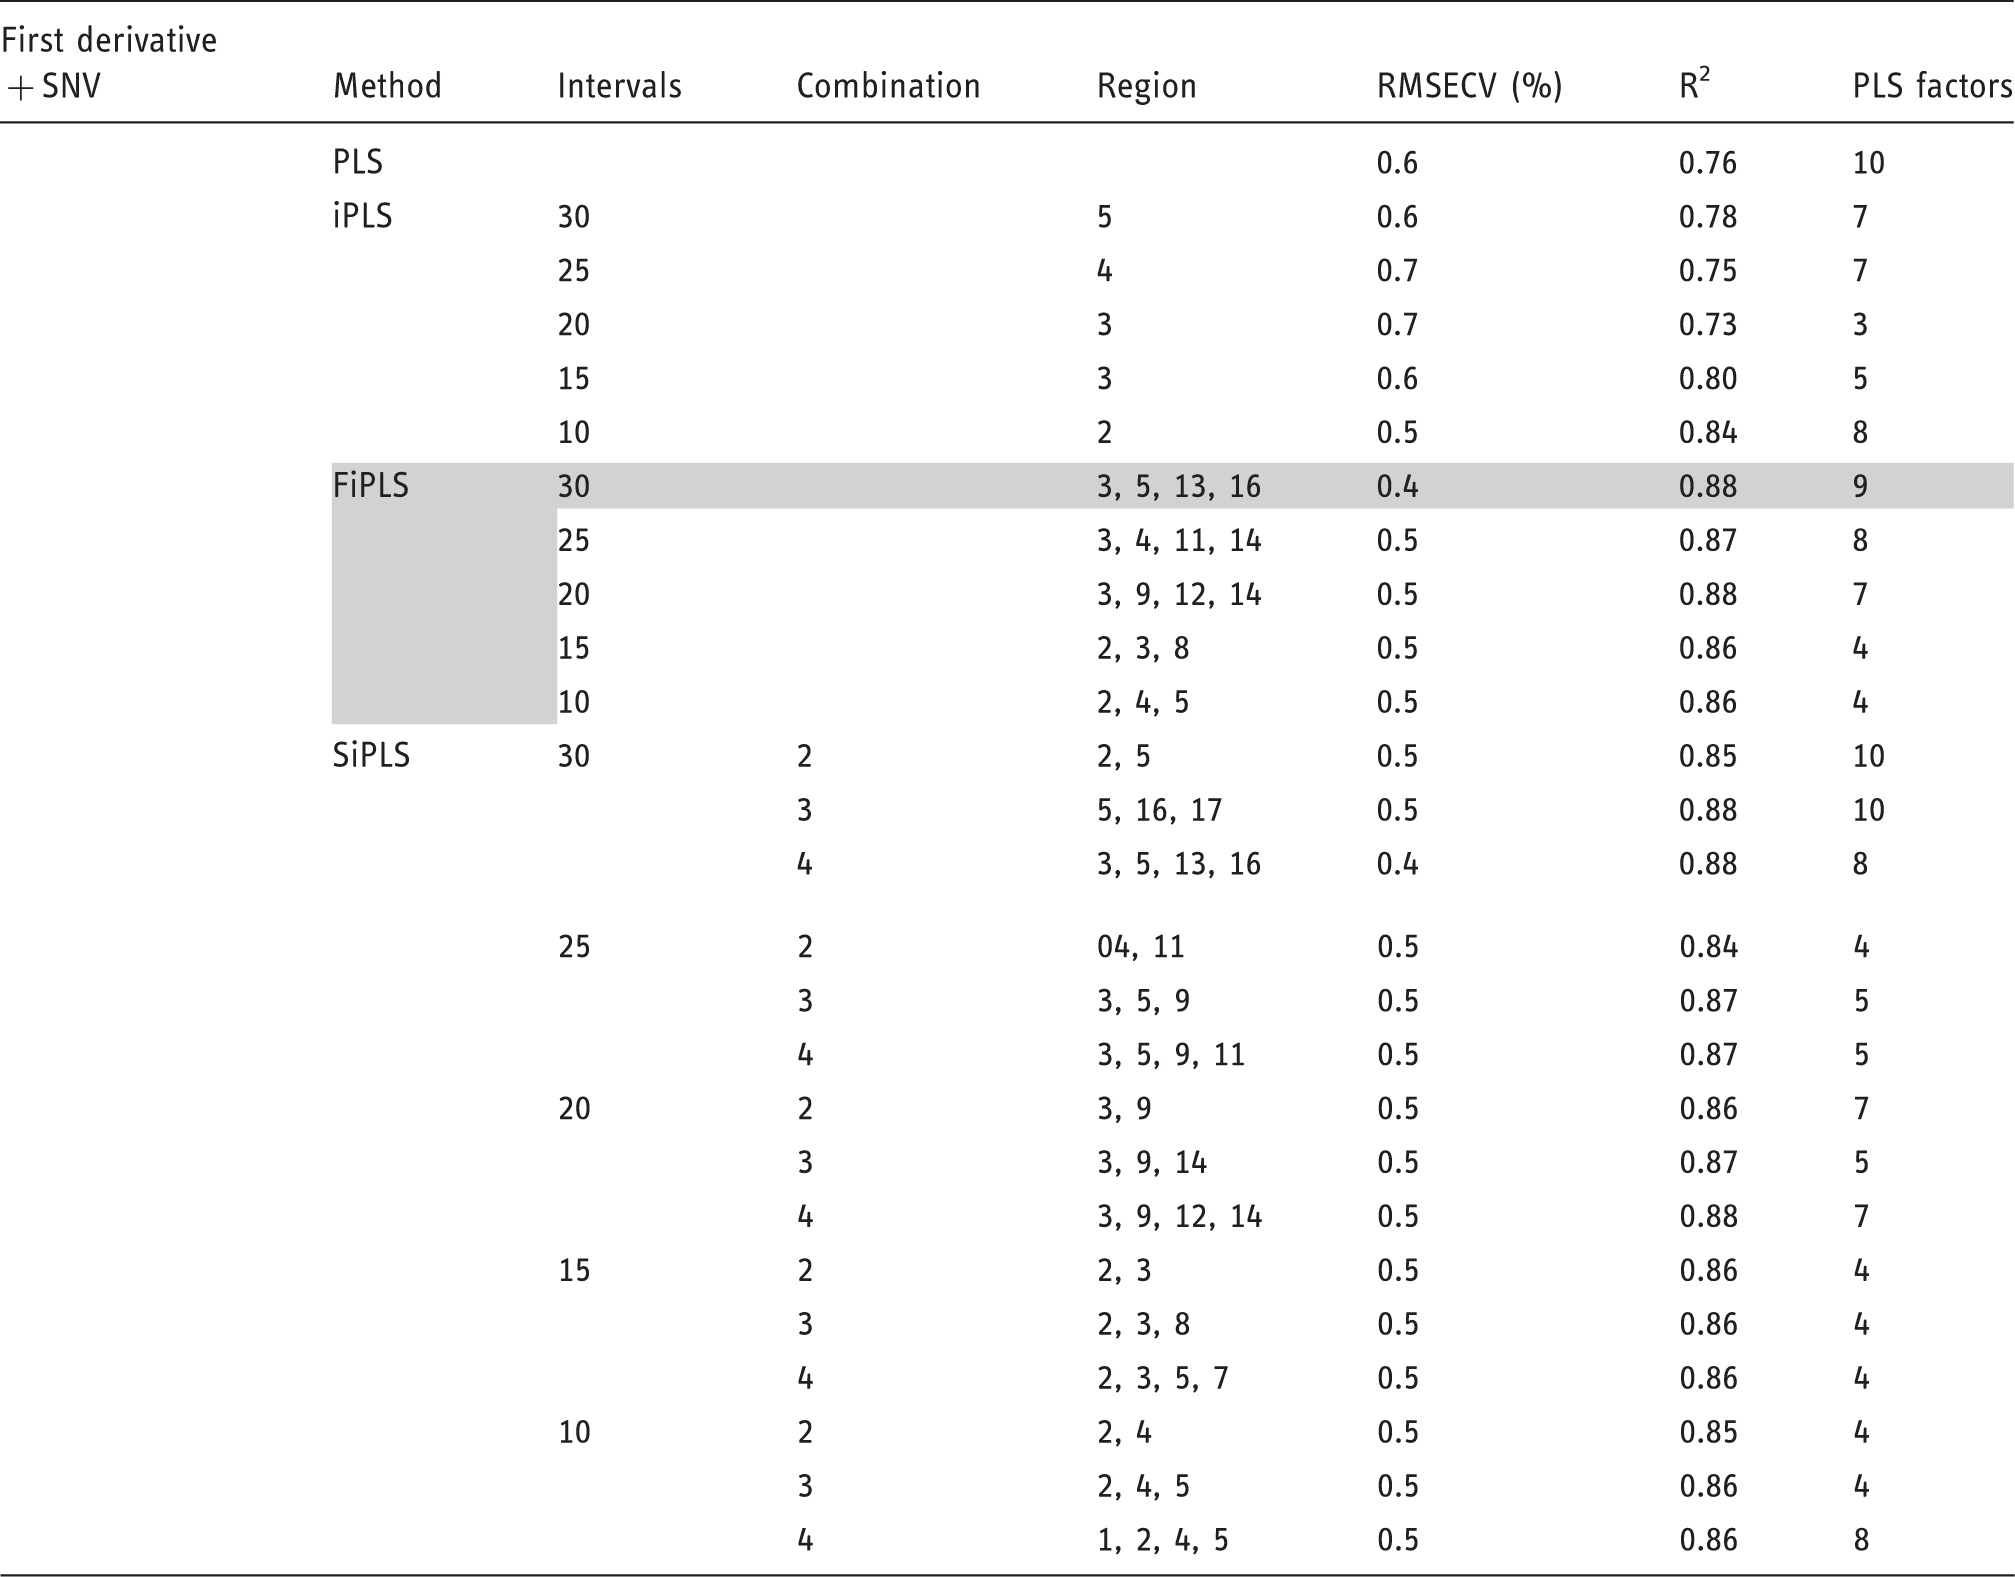
Selection of the best spectral interval by PLS, iPLS, FiPLS and SiPLS for the prediction of the resin content, using the first derivative combined with SNV as pre-processing.
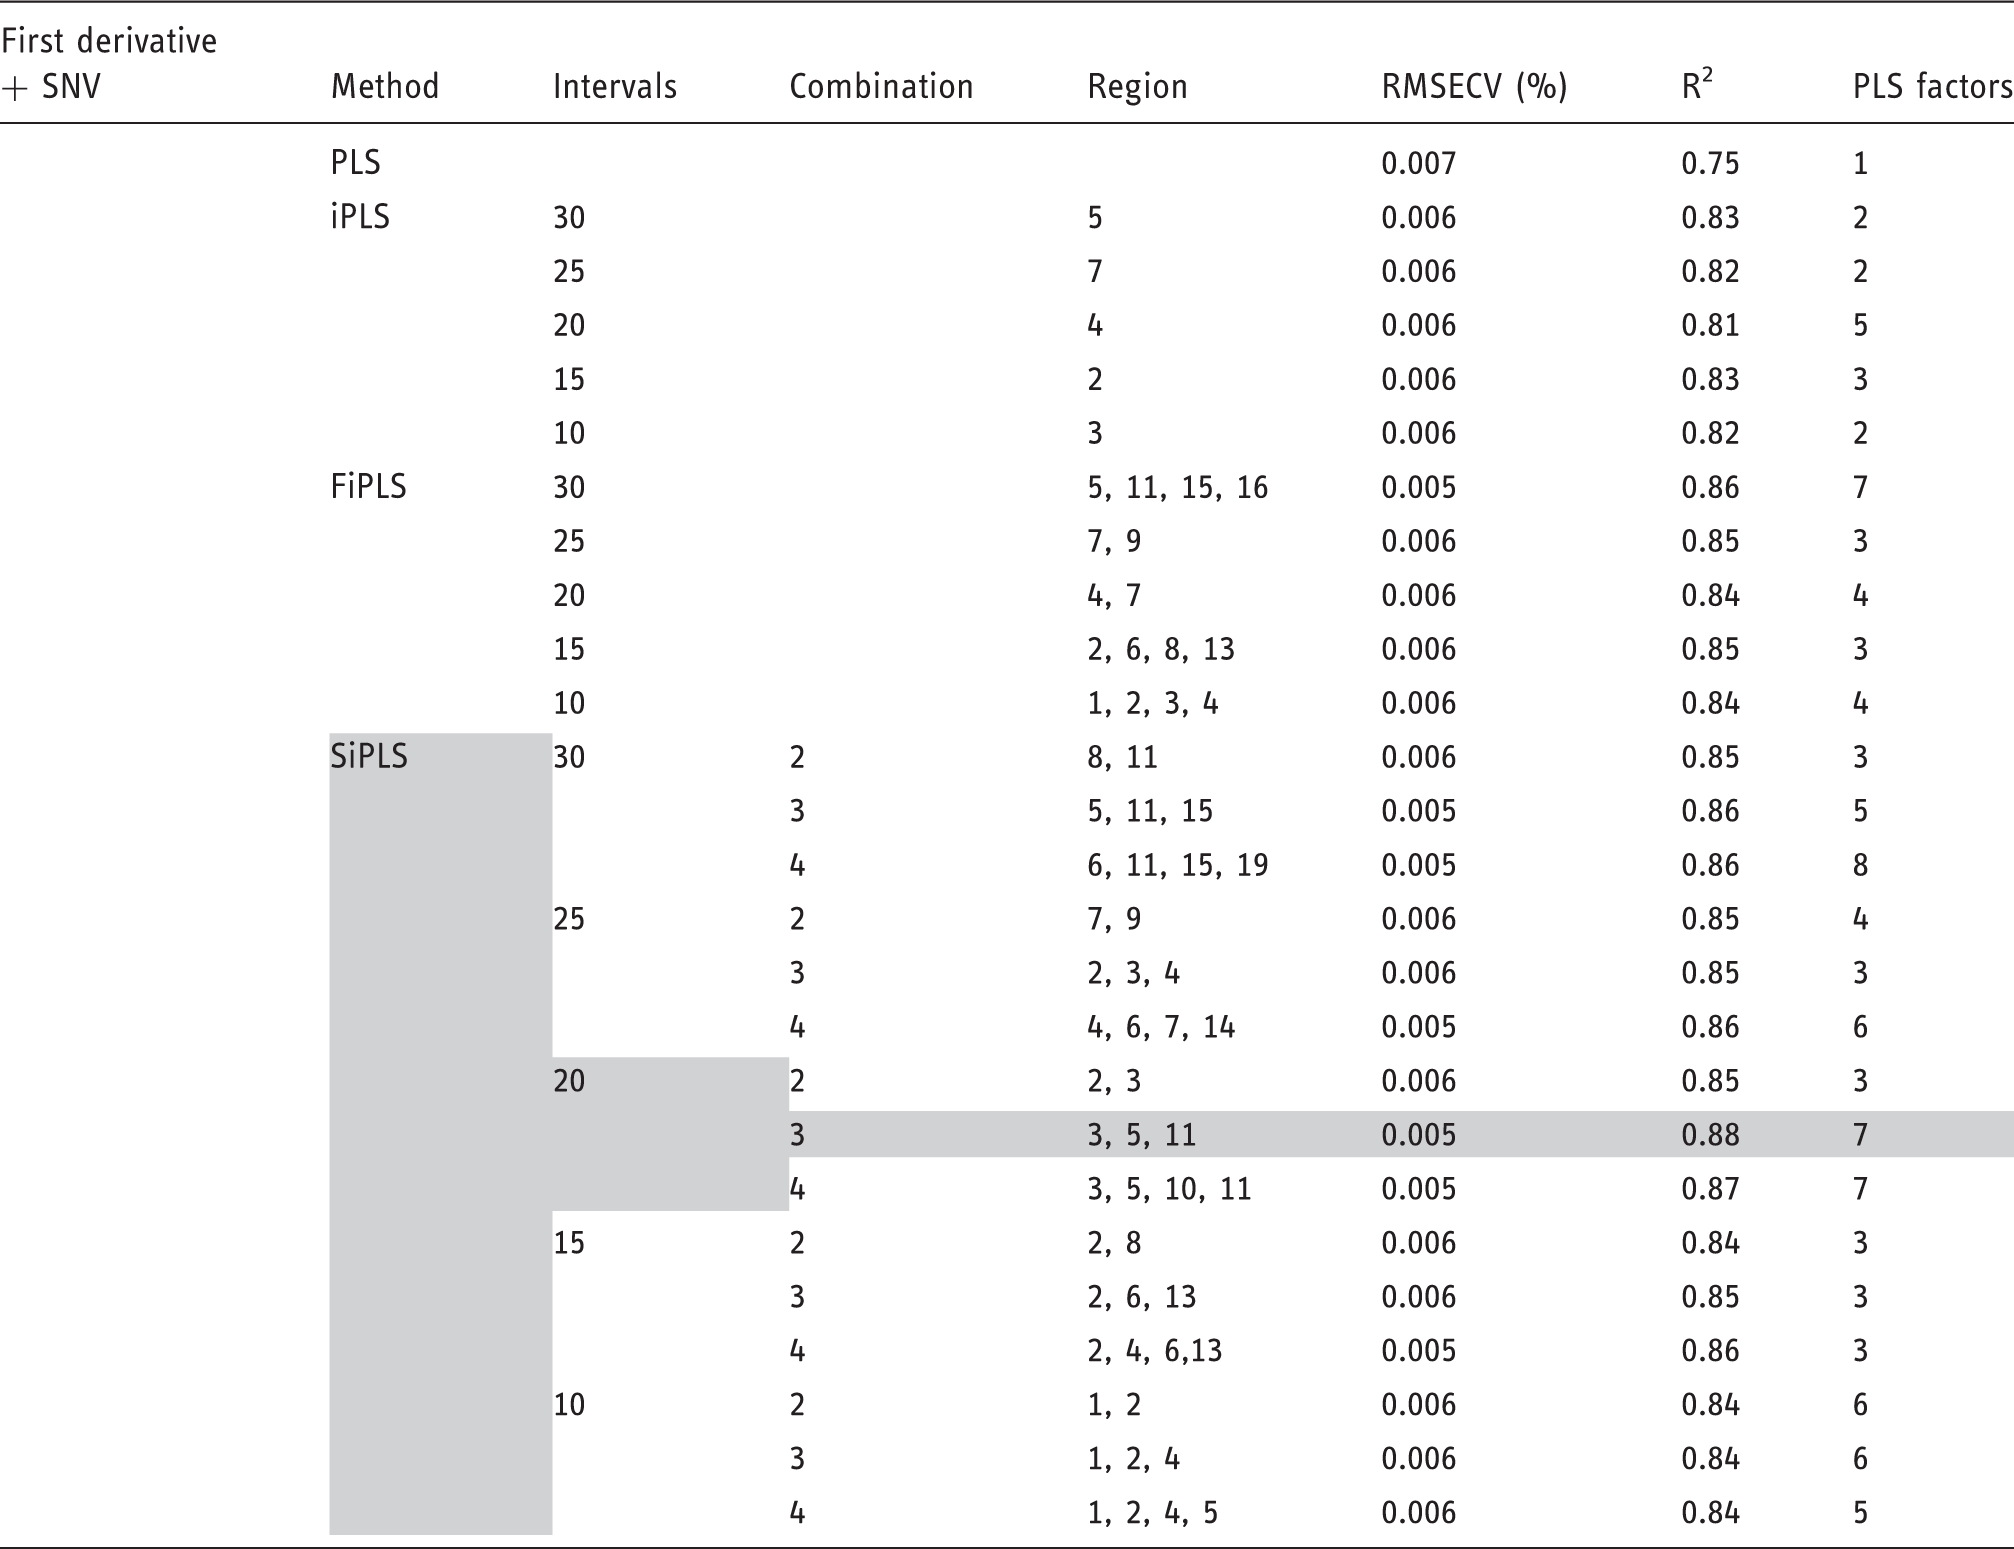
PLS: partial least-square; iPLS: interval partial least-square; FiPLS: forward interval partial least-square; SiPLS: synergy interval partial least-square; SNV: standard normal variate; RMSECV: root mean-squared error of cross validation.
When no data pre-processing was used, the best results were achieved by using SiPLS with 30 intervals and four band combinations as calibration model with a R2 and a RMSECV of 0.87 and 0.005%, respectively.
The use of first derivative did not improve the calibration model for the SiPLS methodology with 30 intervals and four band combinations and no pre-processing, yielding a R2 of 0.86 and an RMSECV of 0.005%. Using the first derivative with SNV, the best calibration model was improved using SiPLS methodology with 20 intervals and four combinations, with a R2 of 0.88 and a RMSECV of 0.005.
Regarding the best calibrations models, the use of different pre-processings resulted in selection of different spectral interval. Without pre-processing, the selected regions pertain to 5886–6148 cm−1, 6696–6958 cm−1, 8045–8309 cm−1 and 8848–9103 cm−1. The regions obtained with the use of first derivative are 5346–5608 cm−1, 5885–6148 cm−1, 6696–6958 cm−1 and 6966–7228 cm−1. Finally, using the first derivative with SNV, the calibration model corresponds to regions 4798–5192 cm−1, 5600–5994 cm−1 and 8007–8400 cm−1.
When no pre-processing was used, the spectral intervals obtained were related mostly to vibrations of C–H of lignin and cellulose or to the methylene linkage (8848–9103 cm−1) to the basic vibrations of NH and water presence (6696–6958 cm−1) and to the first overtone of 2νΝHsym (5886–6148 cm−1).
With the use of first derivative pre-processing, the wavenumbers obtained are similar, corresponding to vibrations related to the water presence (5345–5608 cm−1, 6696–6958 cm−1 and 6966–7228 cm−1). The two latter regions are also related to basic vibrations of N–H and the first overtone 2νΝHsym. Region 5885–6148 cm−1 can be associated to the first overtone 2ν CH2,ass.
Regarding the use of the first derivative with SNV, the selected regions were related to the s-triazine ring of the melamine (4798–5192 cm−1), and the other two bands are related with the first and second overtone of C–H.27,28
Selection of spectral interval and data pre-processing method for volatile content determination
Selection of the best spectral interval by PLS, iPLS, FiPLS and SiPLS for the prediction of the volatile content, without the use of any pre-processing.
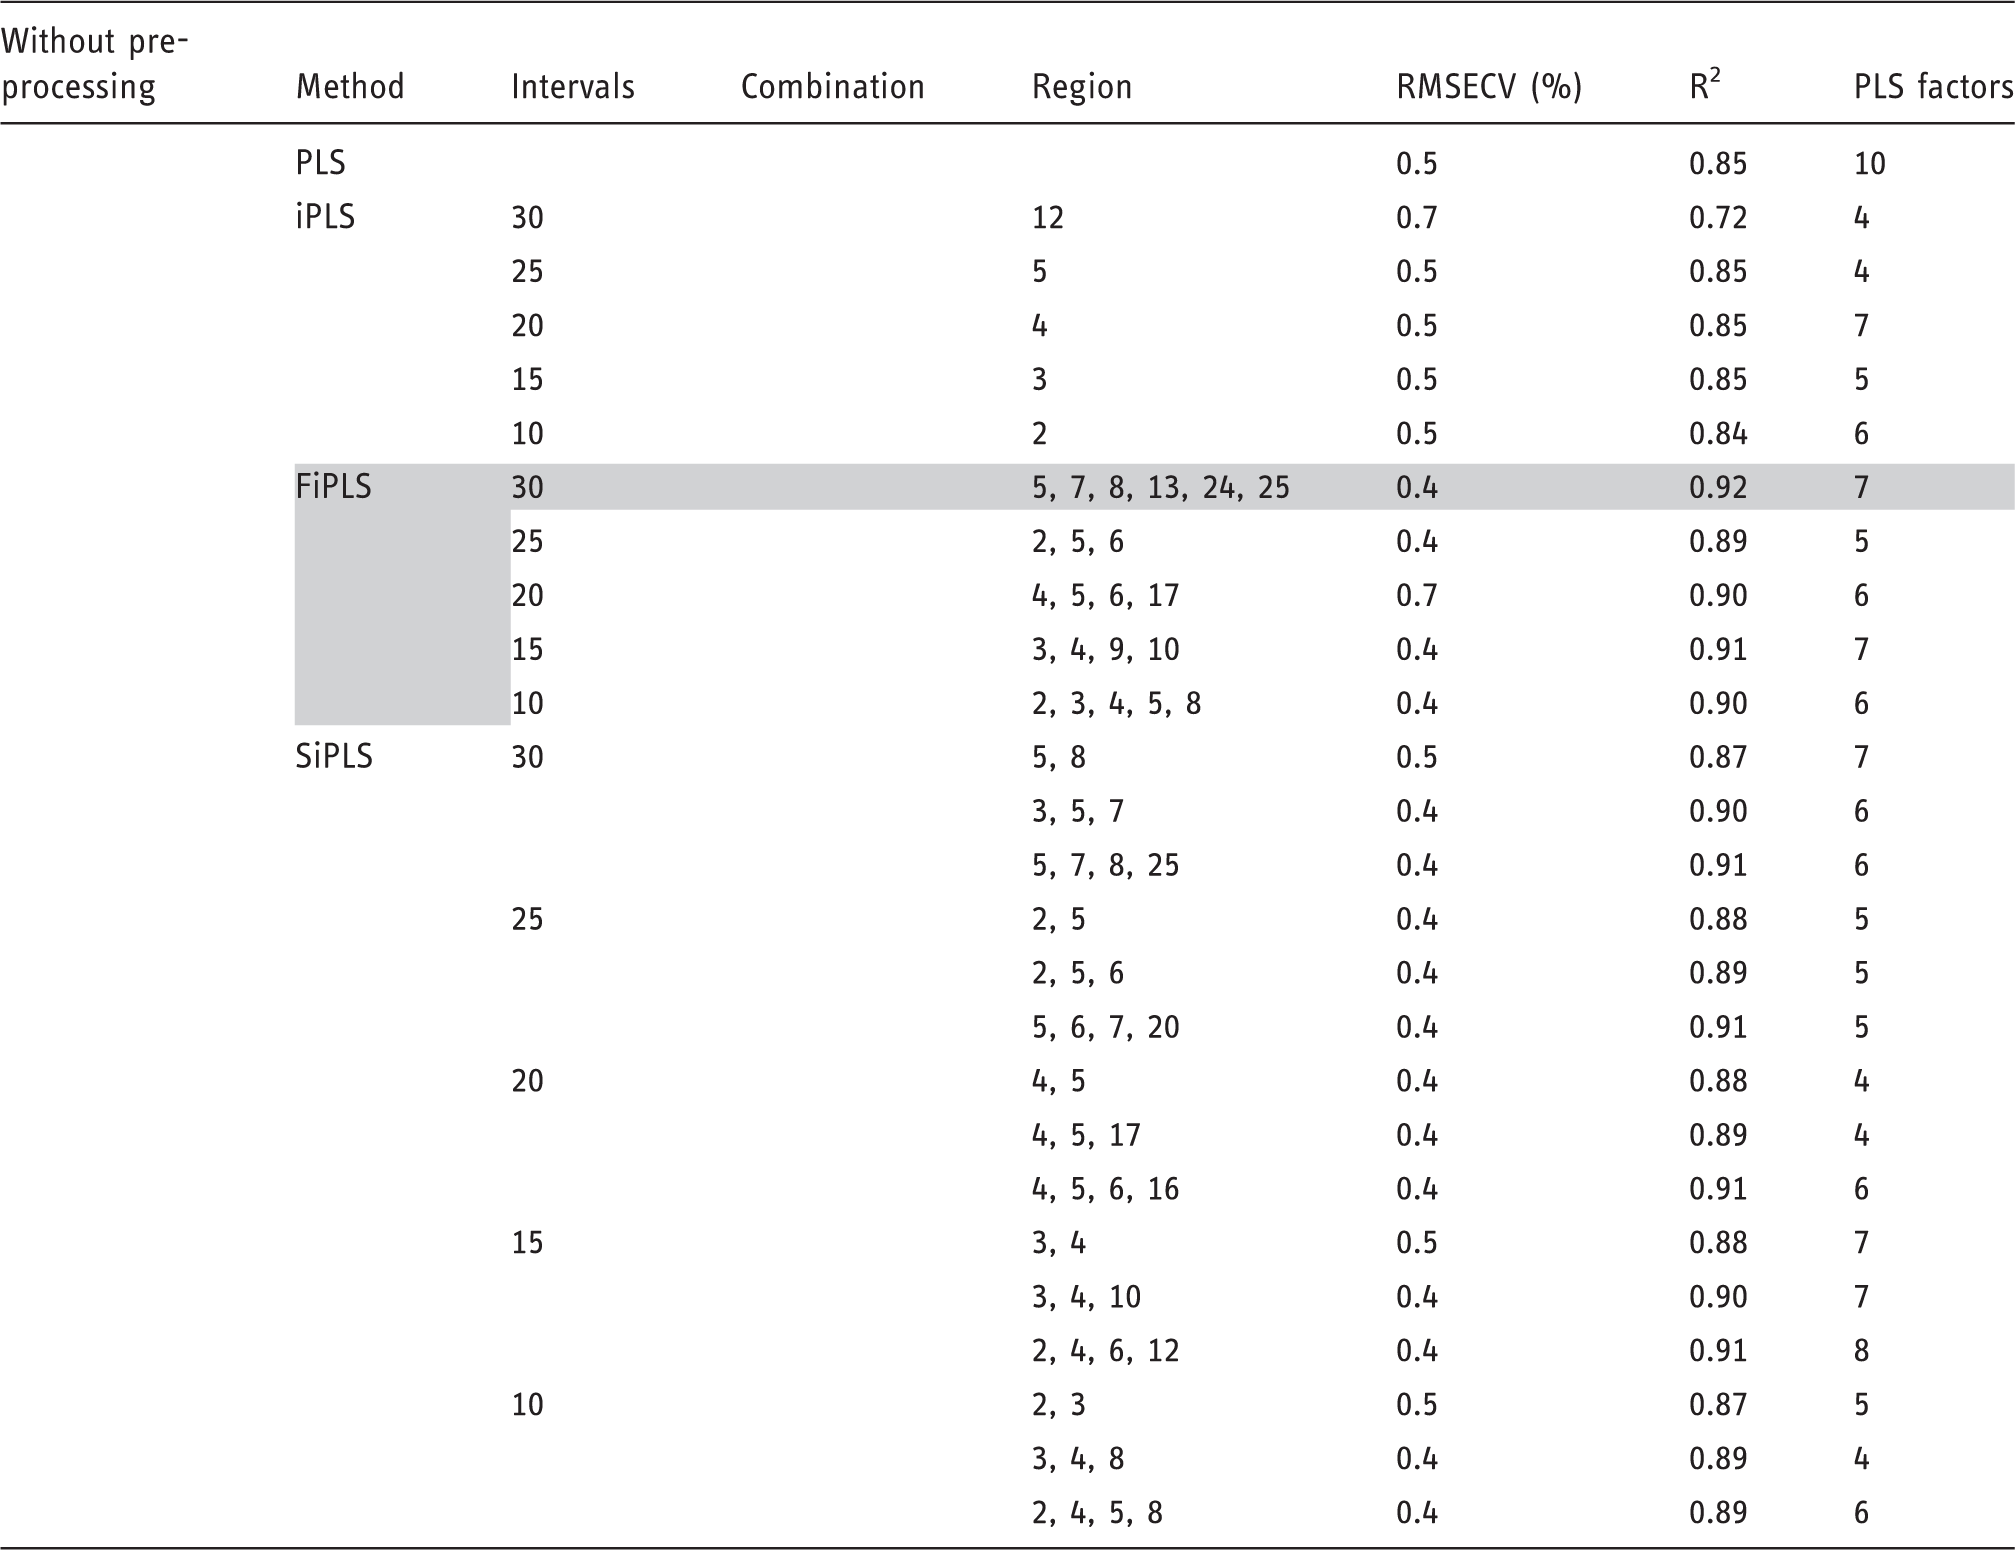
PLS: partial least-square; iPLS: interval partial least-square; FiPLS: forward interval partial least-square; SiPLS: synergy interval partial least-square; RMSECV: root mean-squared error of cross validation.
Selection of the best spectral interval by PLS, iPLS, FiPLS and SiPLS for the prediction of the volatile content, using the first derivative as pre-processing.
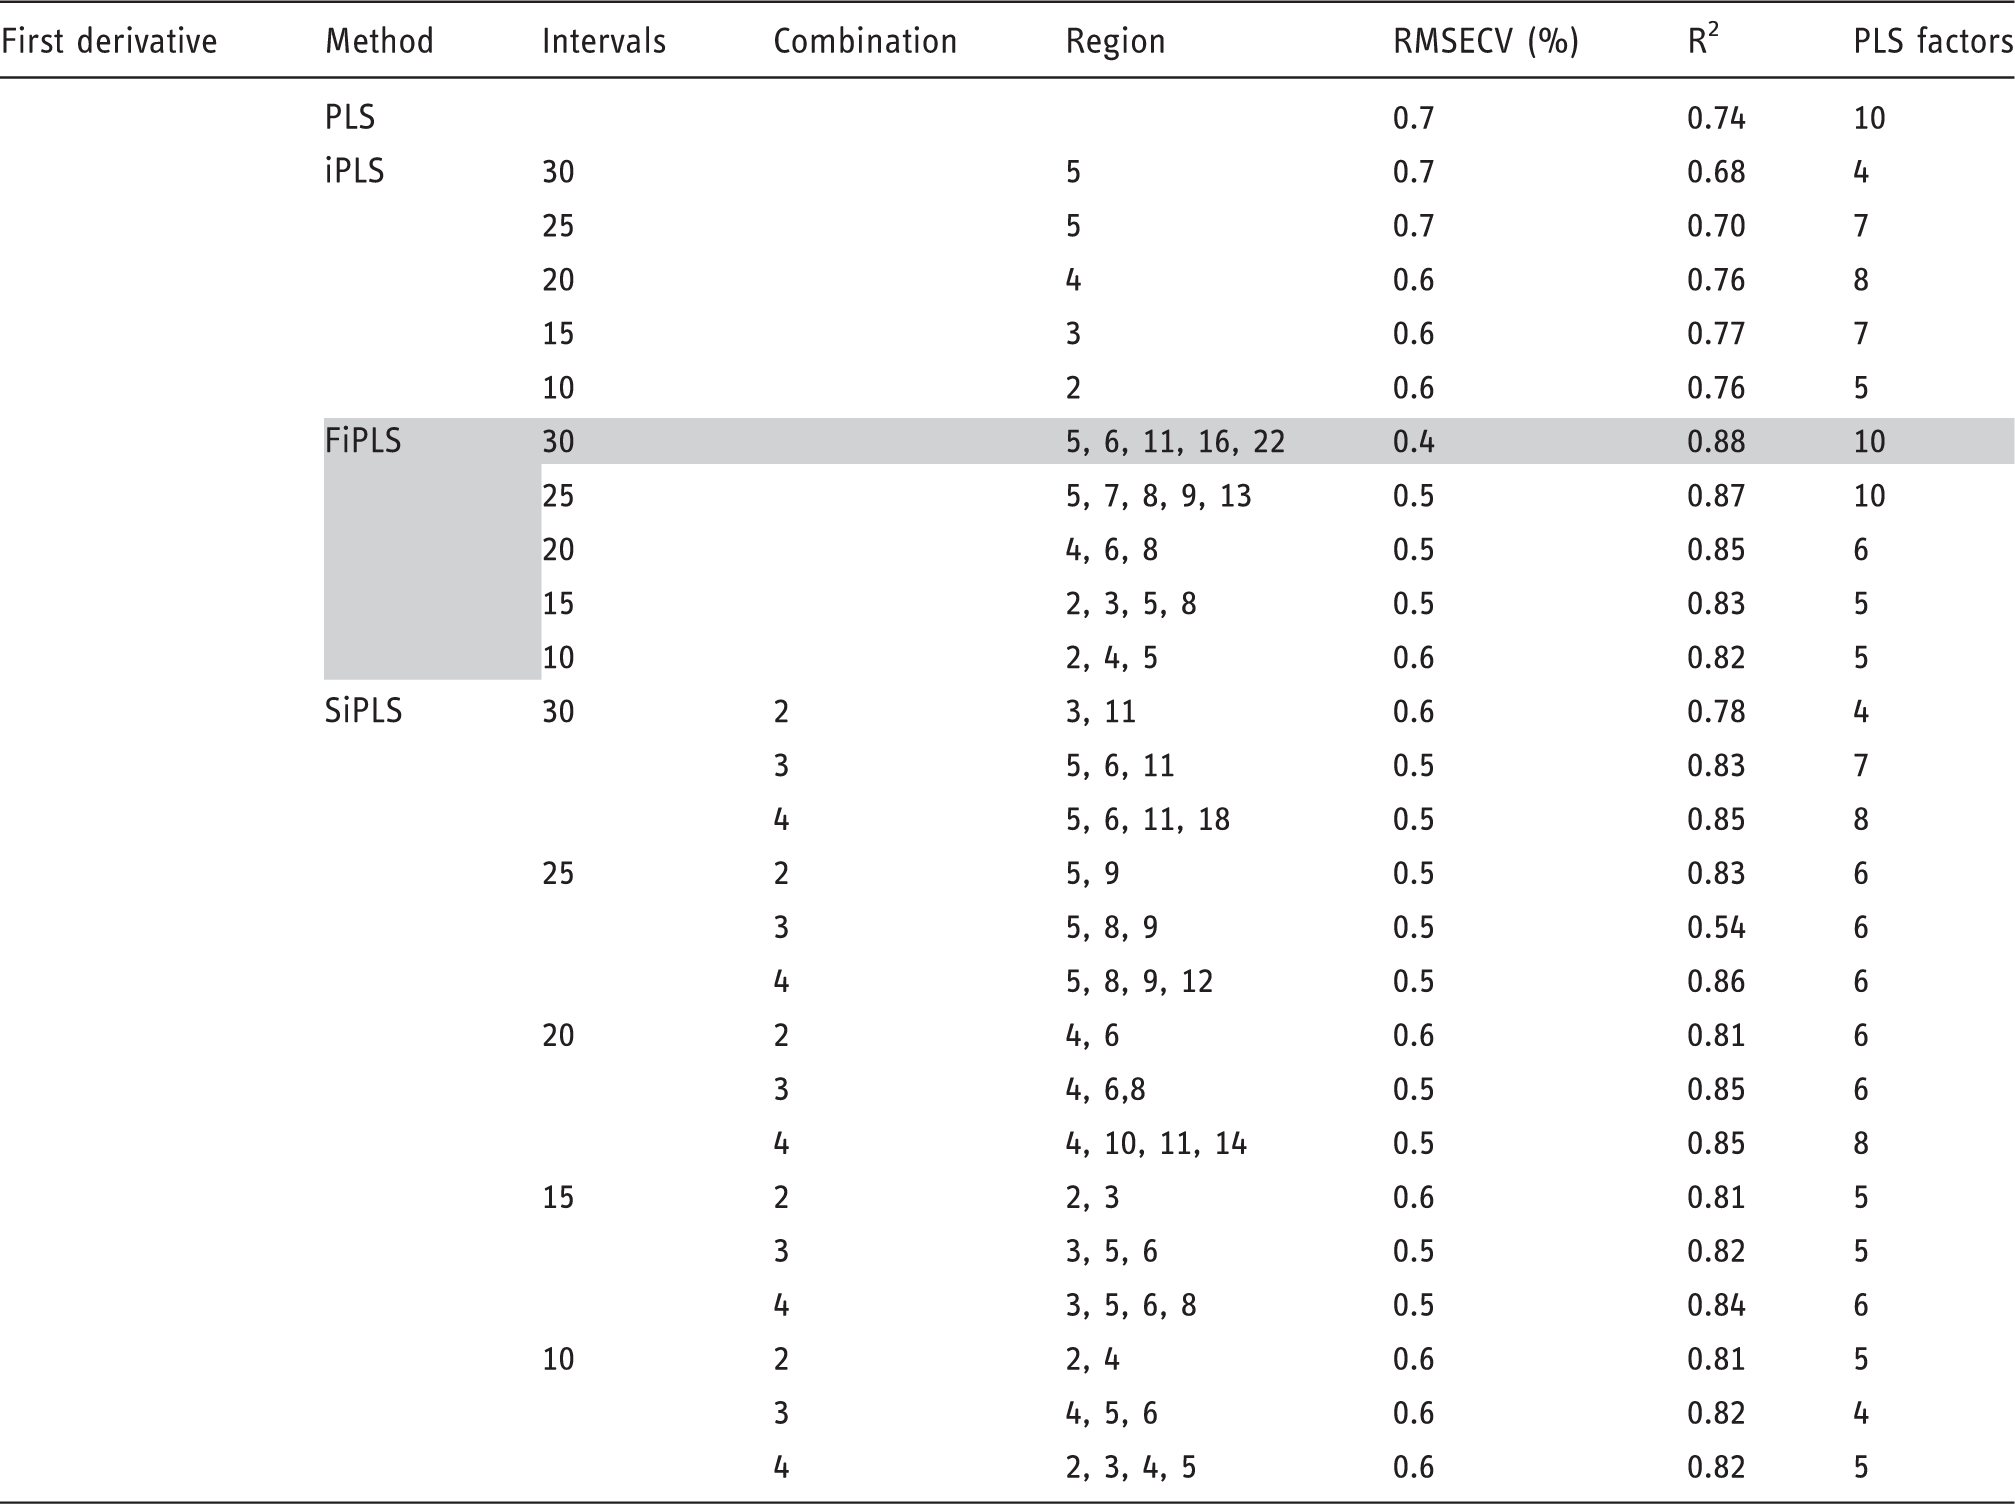
PLS: partial least-square; iPLS: interval partial least-square; FiPLS: forward interval partial least-square; SiPLS: synergy interval partial least-square; RMSECV: root mean-squared error of cross validation.
Selection of the best spectral interval by PLS, iPLS, FiPLS and SiPLS for the prediction of the volatile content, using the first derivative combined with SNV as pre-processing.
PLS: partial least-square; iPLS: interval partial least-square; FiPLS: forward interval partial least-square; SiPLS: synergy interval partial least-square; SNV: standard normal variate; RMSECV: root mean-squared error of cross validation.
For all pre-processing approaches considered, the best calibration model was obtained using FiPLS with 30 intervals. It is interesting to notice that, for this property, the use of pre-processings does not enhance the results. When no data pre-processing was used, the best results were achieved with a R2 and a RMSECV of 0.91 and 0.38%, respectively. With the use of data pre-processing, first derivative led to R2 of 0.88 and RMSECV of 0.4%, while the use of first derivative with SNV led to R2 of 0.88 and RMSECV of 0.44%.
Concerning the spectral intervals, without pre-processing the best calibration model used the regions 5076–5338 cm−1, 5616–5878 cm−1, 5886–6148 cm−1, 6966–7228 cm−1, 10160–10414 cm−1 and 10422–10767 cm−1. With the use of first derivative, the regions changed, corresponding to 5076–5338 cm−1, 5346–5608 cm−1, 6696–6958 cm−1, 8045–8308 cm−1, 8586–8840 cm−1 and 9635–9890 cm−1. For the first derivative with SNV, the selected regions were 4536–4798 cm−1, 5076–5338 cm−1, 7236–7498 cm−1 and 8046–8309 cm−1.27,28
Validation
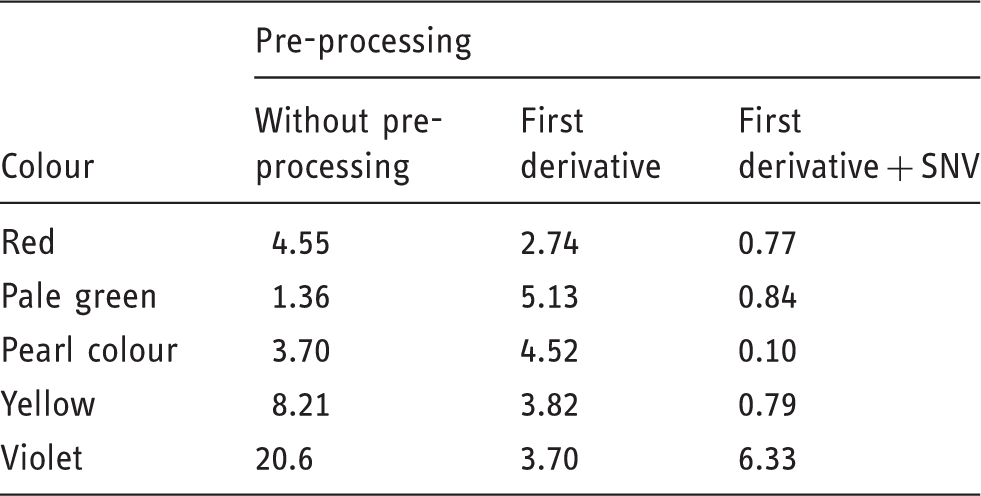
RMSEP values (%) of the developed models for the resin content.
RMSEP: root mean square error of prediction; SNV: standard normal variate.
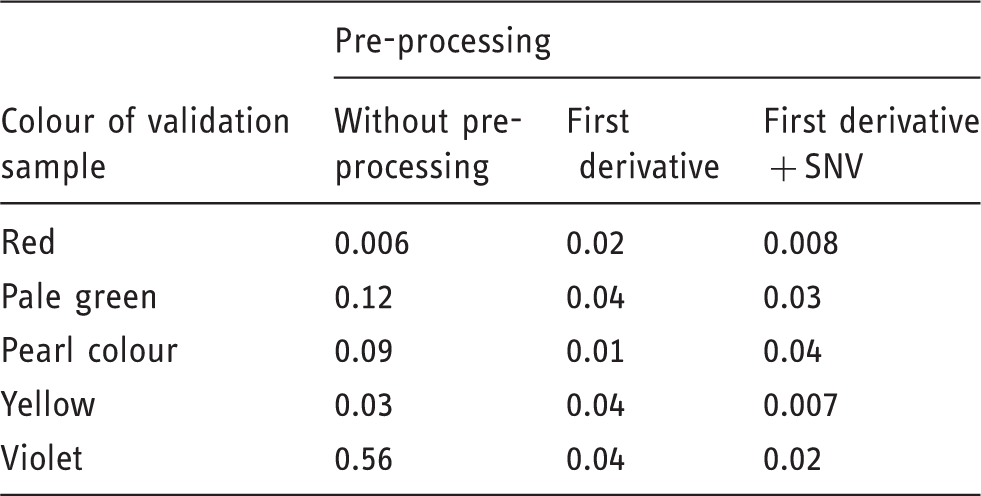
RMSEP values of the developed models for the volatile content.
RMSEP: root mean square error of prediction; SNV: standard normal variate.
For the two studied parameters, the use of the first derivative with SNV pre-processing resulted in the lowest RMSEP values in the validation process, for almost all of the papers studied. This result may be due to the separation of the overlapping peaks and to the removal of slope variations provided by first derivative calculation and by the removal of differences between samples due to the use of SNV.
The results showed that the RC model, developed for red paper, can be applied to papers with different colours and grammages, without affecting accuracy. However, the same conclusion cannot be drawn for the volatile content. The use of the first derivative combined with SNV results in the lowest RMSEP values in the validation process for the volatile content. However, the obtained values are less accurate than the ones obtained for the RC for the validation sets. In addition, it is clear that properties of papers with violet colour are not accurately predicted by the model. In order to understand this result, the spectral intervals obtained were analysed in both models to ensure that those selections were not influenced by other parameters apart from the ones under study, such as the presence of particular pigments or dyes. For that, papers with different colours (red, yellow and violet) were compared with and without resin impregnation.
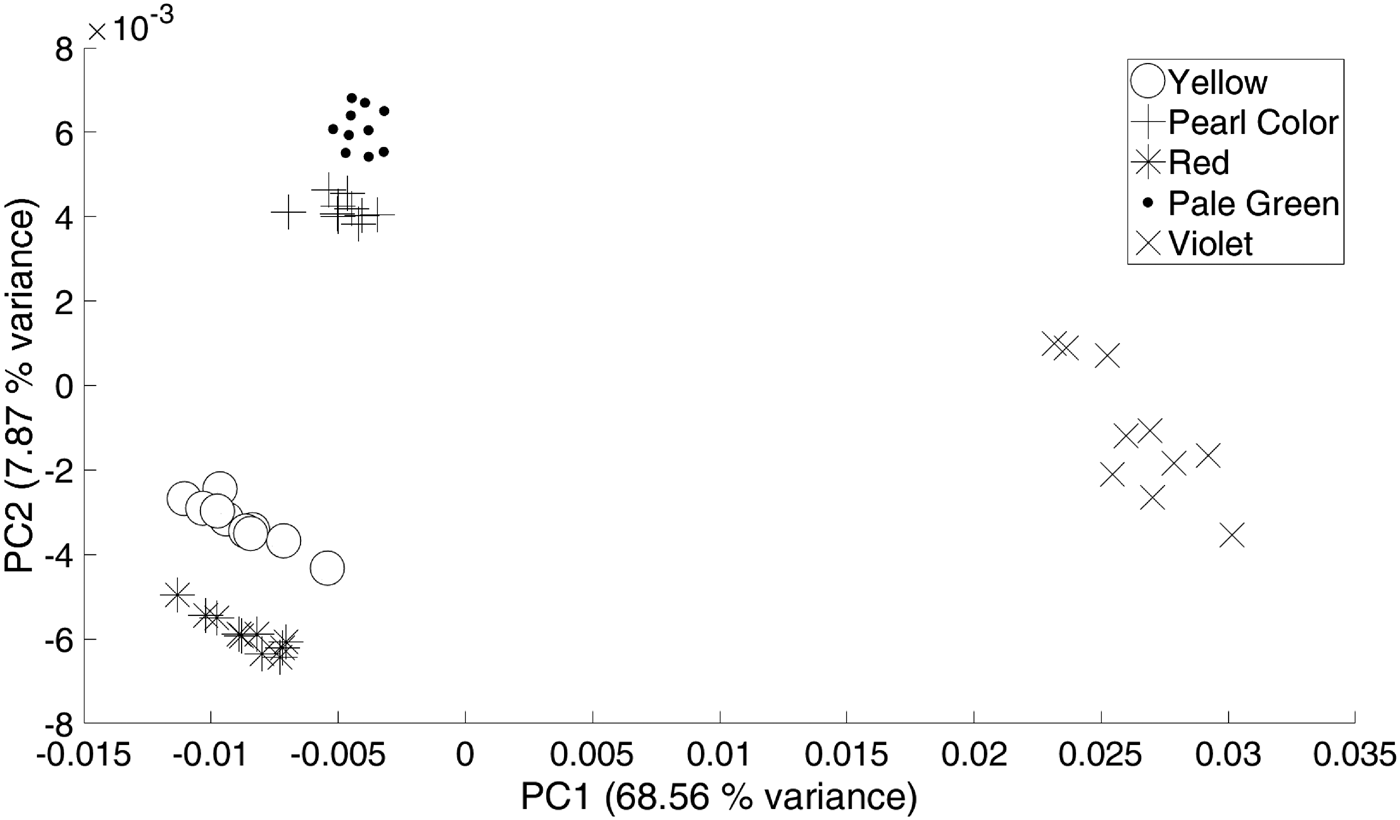
The spectrum of the violet paper was significantly different from the spectra of the yellow and red papers in all wavenumber ranges. Spectral shape and peak intensity differences were not completely attenuated by the use of pre-processing (Figure 3(a)). This explains why the PLS model was not able to predict violet paper properties as well as for other paper colours. Figure 4 shows a PCA scores plot of NIR spectra with pre-processings from different papers with a total of five colours. Ten spectra were used for each colour. The first principal component (PC1) explained 68.56% of the variances between samples. The violet coloured paper appeared in a cluster far to the right in relation to the other papers, confirming that the pre-processed spectra of this paper was different from the rest. Different colour pigments can have different chemical compositions, which may interfere with the NIR spectra. This result shows that violet pigments absorb in the NIR range, making the model inapplicable for this kind of paper.
Spectra of red, yellow and violet non-impregnated papers (a) without pre-processing and (b) after first derivative and SNV. Spectra of red, yellow and violet impregnated papers. SNV: standard normal variate. Score plot of principal component analysis using different coloured papers.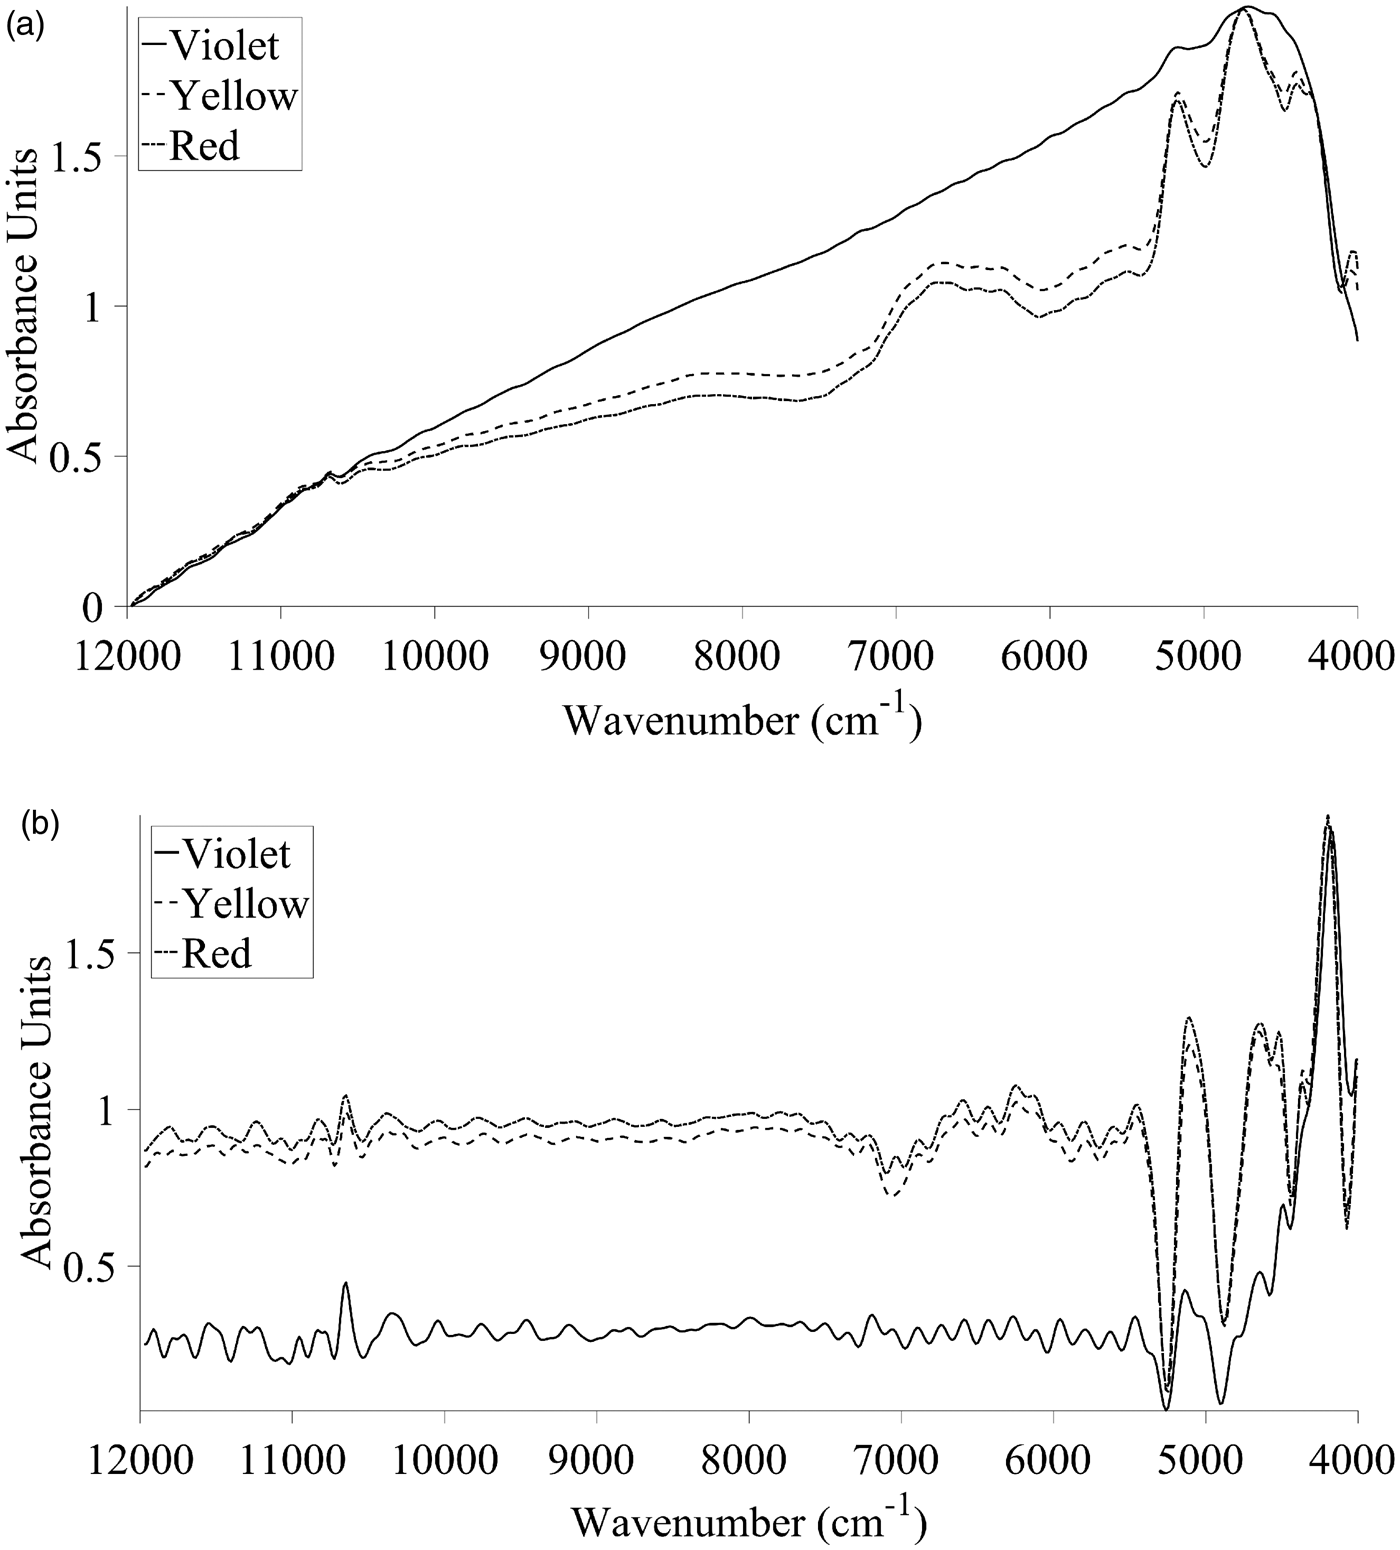
Conclusions
In order to develop calibration models for the determination of resin and volatile content in decorative papers impregnated with melamine formaldehyde resins, several calibration techniques were used such as PLS, iPLS, FiPLS and SiPLS. The most appropriate model was selected by testing different intervals and combinations of intervals and by evaluating the lowest RMSECV. In addition, this approach was employed with spectra without any pre-processing, and with spectra that were subjected to the use of the first derivate and also the first derivative combined with SNV.
Regarding the RC model, the best result was achieved with the use of the first derivate combined with SNV as pre-processing and the SiPLS with 20 intervals and three combinations model. This model achieved an R2 of 0.88 and an RMSECV of 0.005%. Regarding the volatile content, the best model was obtained without the use of any pre-processing and choosing FiPLS with 30 intervals as methodology resulting in a R2 of 0.92 and a RMSECV of 0.38%.
The developed models were applied to an external validation set composed of decorative papers with different colours and grammages. Concerning the results achieved in the validation process, it was found that the use of the first derivative combined with SNV as pre-processing allows for accurate determination of RC within the range of all the papers studied. This is a relevant result, since it does not imply having to adapt a model to each type of paper used. However, for the volatile content, it was found that the developed models were only applicable to papers with a spectrum similar to those used in the calibration, since the quality of the results is highly affected by external factors associated with the colour of the papers.
Footnotes
Declaration of conflicting interests
The author(s) declared no potential conflicts of interest with respect to the research, authorship, and/or publication of this article.
Funding
The author(s) disclosed receipt of the following financial support for the research, authorship, and/or publication of this article: This work was financially supported by Project POCI-01-0145-FEDER-006939 (Laboratory for Process Engineering, Environment, Biotechnology and Energy – LEPABE) funded by FEDER funds through COMPETE2020 – Programa Operacional Competitividade e Internacionalização (POCI) – and by national funds through FCT – Fundação para a Ciência e a Tecnologia. Ana Henriques wishes to thank FCT and EuroResinas for PhD grant SFRH/BDE/93642/2013.