
Abstract
Understanding of light-emitting diode lamp behaviour is essential to support the use of these devices as illumination sources in near infrared spectroscopy. Spectral variation in light-emitting diode peak output (680, 700, 720, 735, 760, 780, 850, 880 and 940 nm) was assessed over time from power up and with variation in environmental temperature. Initial light-emitting diode power up to full intensity occurred within a measurement cycle (12 ms), then intensity decreased exponentially over approximately 6 min, a result ascribed to an increase in junction temperature as current is passed through the light-emitting diode. Some light-emitting diodes displayed start-up output characteristics on their first use, indicating the need for a short light-emitting diode ‘burn in’ period, which was less than 24 h in all cases. Increasing the ambient temperature produced a logarithmic decrease in overall intensity of the light-emitting diodes and a linear shift to longer wavelength of the peak emission. This behaviour is consistent with the observed decrease in the IAD Index (absorbance difference between 670 nm and 720 nm, A670–A720) with increased ambient temperature, as measured by an instrument utilising light-emitting diode illumination (DA Meter). Instruments using light-emitting diodes should be designed to avoid or accommodate the effect of temperature. If accommodating temperature, as light-emitting diode manufacturer specifications are broad, characterisation is recommended.
Introduction
Light sources for near infrared (NIR) spectroscopy can be divided into two groups, broadband (thermal) and narrowband (non-thermal). 1 Light-emitting diodes (LEDs) are non-thermal, but emit a wider range of wavelengths (typically 20–50 nm full width at half maximum (FWHM)) than sources such as diode lasers. Interference filters can be used to limit radiation to a suitable bandwidth. Alternatively, LEDs of different wavelength maxima can be combined to make a broadband source (e.g. at equal 50 nm steps, eight emitters could cover the short-wave near infrared region (SWNIR, 700–1100 nm). The manufacturers of SWNIR wavelength LEDs currently offer off-the-shelf LEDs with peak wavelength outputs available at approximately every 10–20 nm from 700–1200 nm. LEDs can achieve outputs of up to 100 lumens per watt and can survive for >100,000 h, 2 making their use attractive for portable instrumentation. LEDs can also be pulsed for milliseconds to produce higher light output, with higher energy efficiency and greater heat dissipation.
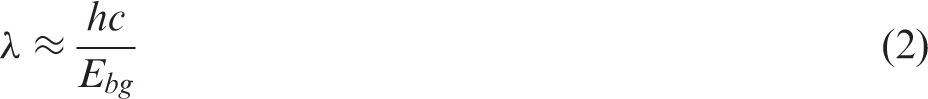
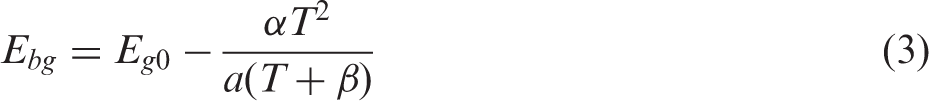
LEDs, however, have the disadvantage of being sensitive to ambient temperature in terms of intensity and peak emission. With an LED, temperature increases give relative intensity decreases and shifts to longer wavelengths (‘red-shifts’) in peak emission. Near room temperature, LED emission intensity, I, is frequently described as
3

Other factors in quality control of LEDs include stabilisation or ‘burn in’ period. 6 ‘Burn in’ refers to a period of instability in peak emission wavelength and intensity in the first period of use after manufacture. Nägele 7 documented an increase in intensity of approximately 10% over the first 1000 h, whilst most others, such as Chen et al., 8 Narendran and Gu 9 and Meneghesso et al. 10 report decreases in intensity over time, with the amount dependent on the operating current.
The final product step in LED manufacture involves optical characterisation (with these values often reported on manufacturer specification sheets), followed by sorting to ‘bins’ to reduce variation. This measurement is typically undertaken within approximately 20 ms after the LED is switched on, although the LED will not be thermally stabilised or fully ‘burnt in’. 7 Variation between individual LEDs is also expected, even with units from the same manufacturer’s flux bin. Therefore users of these products are advised to perform their own characterisation under stable conditions appropriate for the intended use.
Given that the dependence of LED output on temperature is well known, surprisingly most reports fail to mention the effect of LED temperature on a spectroscopic application. For example, temperature was not considered in the reports by Gaião et al., 11 Fonseca and Raimundo 12 or Veras et al. 13 Other developers have documented attempts to minimise temperature change. Malinen et al. 14 developed a 32 wavelength NIR LED array comprised of surface-emitting LEDs centred at 850, 900, 935, 950 and 1020 nm, temperature stabilised with a Peltier element and thermistor.
Temperature-induced wavelength shifts in LED output will impact spectroscopic performance. Shafie et al. 15 optimised a six-wavelength (650, 800, 815, 885, 920 and 930 nm) multiple linear regression model for predicting kiwifruit dry matter content (R2 = 0.94 and root mean square error of prediction (RMSEP) = 1.22%). The temperature-related drifts expected of LED sources were simulated, with wavelength perturbations of 5 nm resulting in a 1% increase in RMSEP. A similar impact of wavelength shift was noted by Hayes et al. 16
Two instruments using LEDs as their light source target fruit assessment. Giovenzana et al. 17 report a system for rapid measurement of total soluble solids content, and titratable acidity of white grapes in the field, using reflectance measurements using LEDs at four wavelengths (630, 690, 750 and 850 nm) with a separate silicon-based photodiode detector associated with each LED. Each LED was paired with a filter to maintain the wavelength maximum of light reaching the sample. The DA Meter (Turoni, Italy) uses LEDs to produce light at 670 and 720 nm, sequentially activated. The difference in absorbance at the two wavelengths is used as an index of chlorophyll content, and thus fruit maturity, however, no documentation of the effect of temperature on performance was found.
The objective of the current study was to document the spectral variation of LEDs with respect to ambient temperature and to elapsed time from power-up, in context of instrumentation appropriate for use in a SWNIR fruit spectroscopic system. This work represents a parallel study to our earlier work with halogen lamps. 18 As a case study, the effect of temperature on an existing LED-based instrument is also presented.
Materials and methods
Equipment
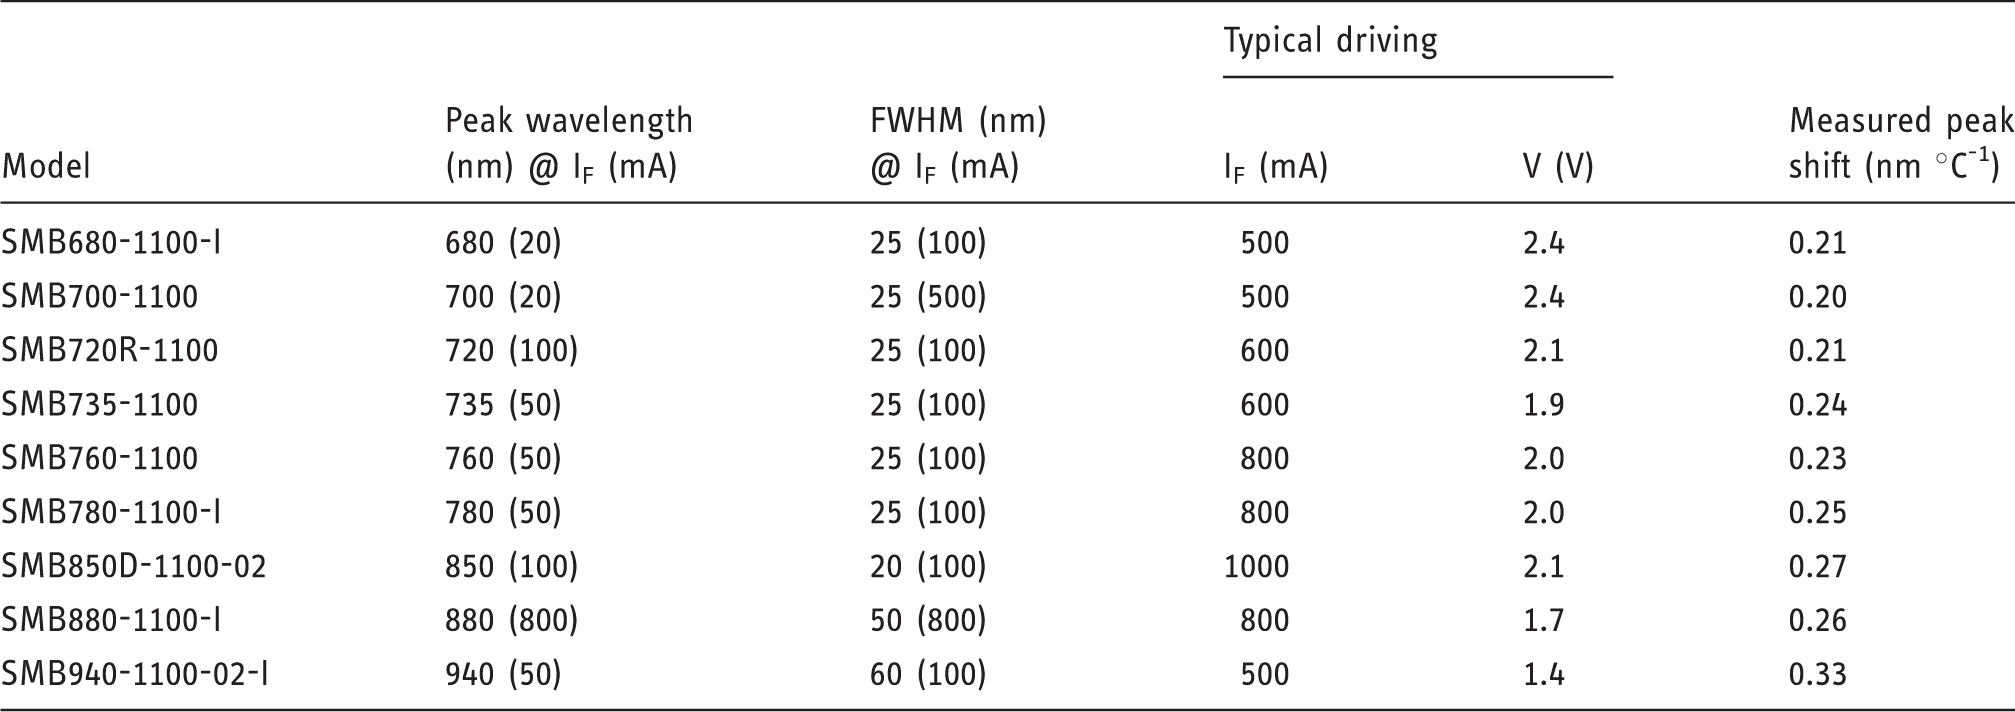
LED (Epitex) specifications for operation at 25℃ in terms of peak wavelength and FWHM at the stated forward current (IF) used for specifications (note variation in current used in peak wavelength and FWHM specification), typical driven current and forward voltage used in normal operation and increase in peak wavelength position per degree environmental temperature increase.
A Contherm 5200HS environmental chamber (Contherm Scientific Limited, Petone, New Zealand) was used, with temperature monitored using a TH-Calc 7425 Thermohygrometer (TSI Inc, Shoreview, MN, USA). External temperature was monitored using a Vaisala HMI 31 Thermohygrometer (Vaisala, Helsinki, Finland). The relative humidity level of the enclosure was maintained at 50% for all experiments.
Zeiss MMS1 NIR Enhanced (Carl Zeiss GmBH, Jena, Germany) spectrometers were interfaced with computers via 16-bit tec5 PD-PCI01V1 A/D cards (Tec5 AG Sensorik und Systemtechnik, Oberursel, Germany) and front-end electronics (Tec5 AG Sensorik und Systemtechnik, Oberursel, Germany) to acquire 45° reflectance spectra of a Teflon™ (polytetrafluoroethylene (PTFE)) tile illuminated by a given LED, with a path length of 10 cm. Spectral data were acquired using software incorporating LabView (National Instruments Corporation, Austin, TX, USA) drivers developed in-house. The spectrometer uses a holographically blazed grating with a silicon photodiode array (pixel dispersion of ca. 3.3 nm and FWHM of 10 nm).
Experimental exercises
Exercise 1 – Power up behaviour
To assess spectral variation from ‘cold’ power up over a short period, spectral measurements were acquired at 12 ms intervals over a period of 6 min after initial power up. All components were maintained in an air-conditioned laboratory at 23 ± 2℃. A longer period assessment was also conducted with spectral measurements acquired at 1-s intervals over a period of 4 h after initial power up. LEDs were housed within the environmental chamber at 10℃, whilst the power supply, spectrometer, front-end electronics and associated computer were located outside the environmental box in an air-conditioned laboratory at 23 ± 1℃.
Exercise 2 – Response to temperature
To assess the effect of variation in environmental temperature on the LEDs, the temperature in the enclosure was incrementally increased in 10℃ intervals between 10℃ and 60℃, with a 1 h stabilisation between increments after the initial start-up period of 4 h. These procedures were repeated three times for each of the LEDs used in this study (81 trials in total).
Exercise 3 – Effect of environmental temperature on an LED-based instrument
The IAD index of fruit maturation, as assessed by the DA Meter (Model 53500, T.R. Turoni srl, Forlì, Italy), involves measurement of the absorbance (A) difference between 670 nm and 720 nm (A670–A720). The instrument utilises an interactance geometry, using six LEDs, three each of two wavelengths, arranged into a ring around a cylinder contacting the sample to block direct ambient light. A single silicon photodiode is used, located in the cylinder. The LEDs of the two wavelengths are alternatively pulsed, with a reference (PTFE tile) measurement taken before sample measurements. The DA Meter has a stated operating temperature range of 0℃ to 70℃. 19
Ambient temperature was incrementally increased in 10℃ intervals between 0℃ and 60℃ as in Exercise 2. LED output was directed onto a PTFE tile and viewed by a probe with collimating lens directing light to a fibre optic, with spectra acquired using an MMS1 spectrometer located outside the chamber. DA Meter readings were acquired of two mango fruit at two locations as the instrument temperature was increased, with the fruit maintained, and the meter referenced, at 23 ± 1℃. The experiment was repeated with DA Meter readings acquired of two apple fruit at two locations, but with the instrument referenced at each temperature.
Results and discussion
Exercise 1 – Power up behaviour
Initial LED power-up to full intensity occurred within a measurement cycle (12 ms), with spectral intensity then decreasing over the 6-min period (Figure 1). A shift in peak intensity to longer wavelengths (red shift) also occurred (Figure 1), varying from 10 nm to 27 nm depending on the LED wavelength rating (data not shown). This shift is consistent with an increase in junction temperature during operation. The time taken for junction temperature equilibration will depend on the forward current driving the LED, and thus the maximum temperature reached. The peak wavelength stabilised after approximately 6 min in all trials involving previously used LEDs, varying by less than 0.5 nm thereafter if environmental temperature was constant (e.g. variation was noted during cabinet defrost cycles).
Spectral output in analogue to digital conversion count (ADCC) at 880 nm and maximum ADCC at any wavelength (top panel) and the shift in peak wavelength emitted (bottom) of the SMB880-1100-I LED over a 6-min period from power-up (representative of three replicate trials of three LEDs). Power was turned on at t = 0.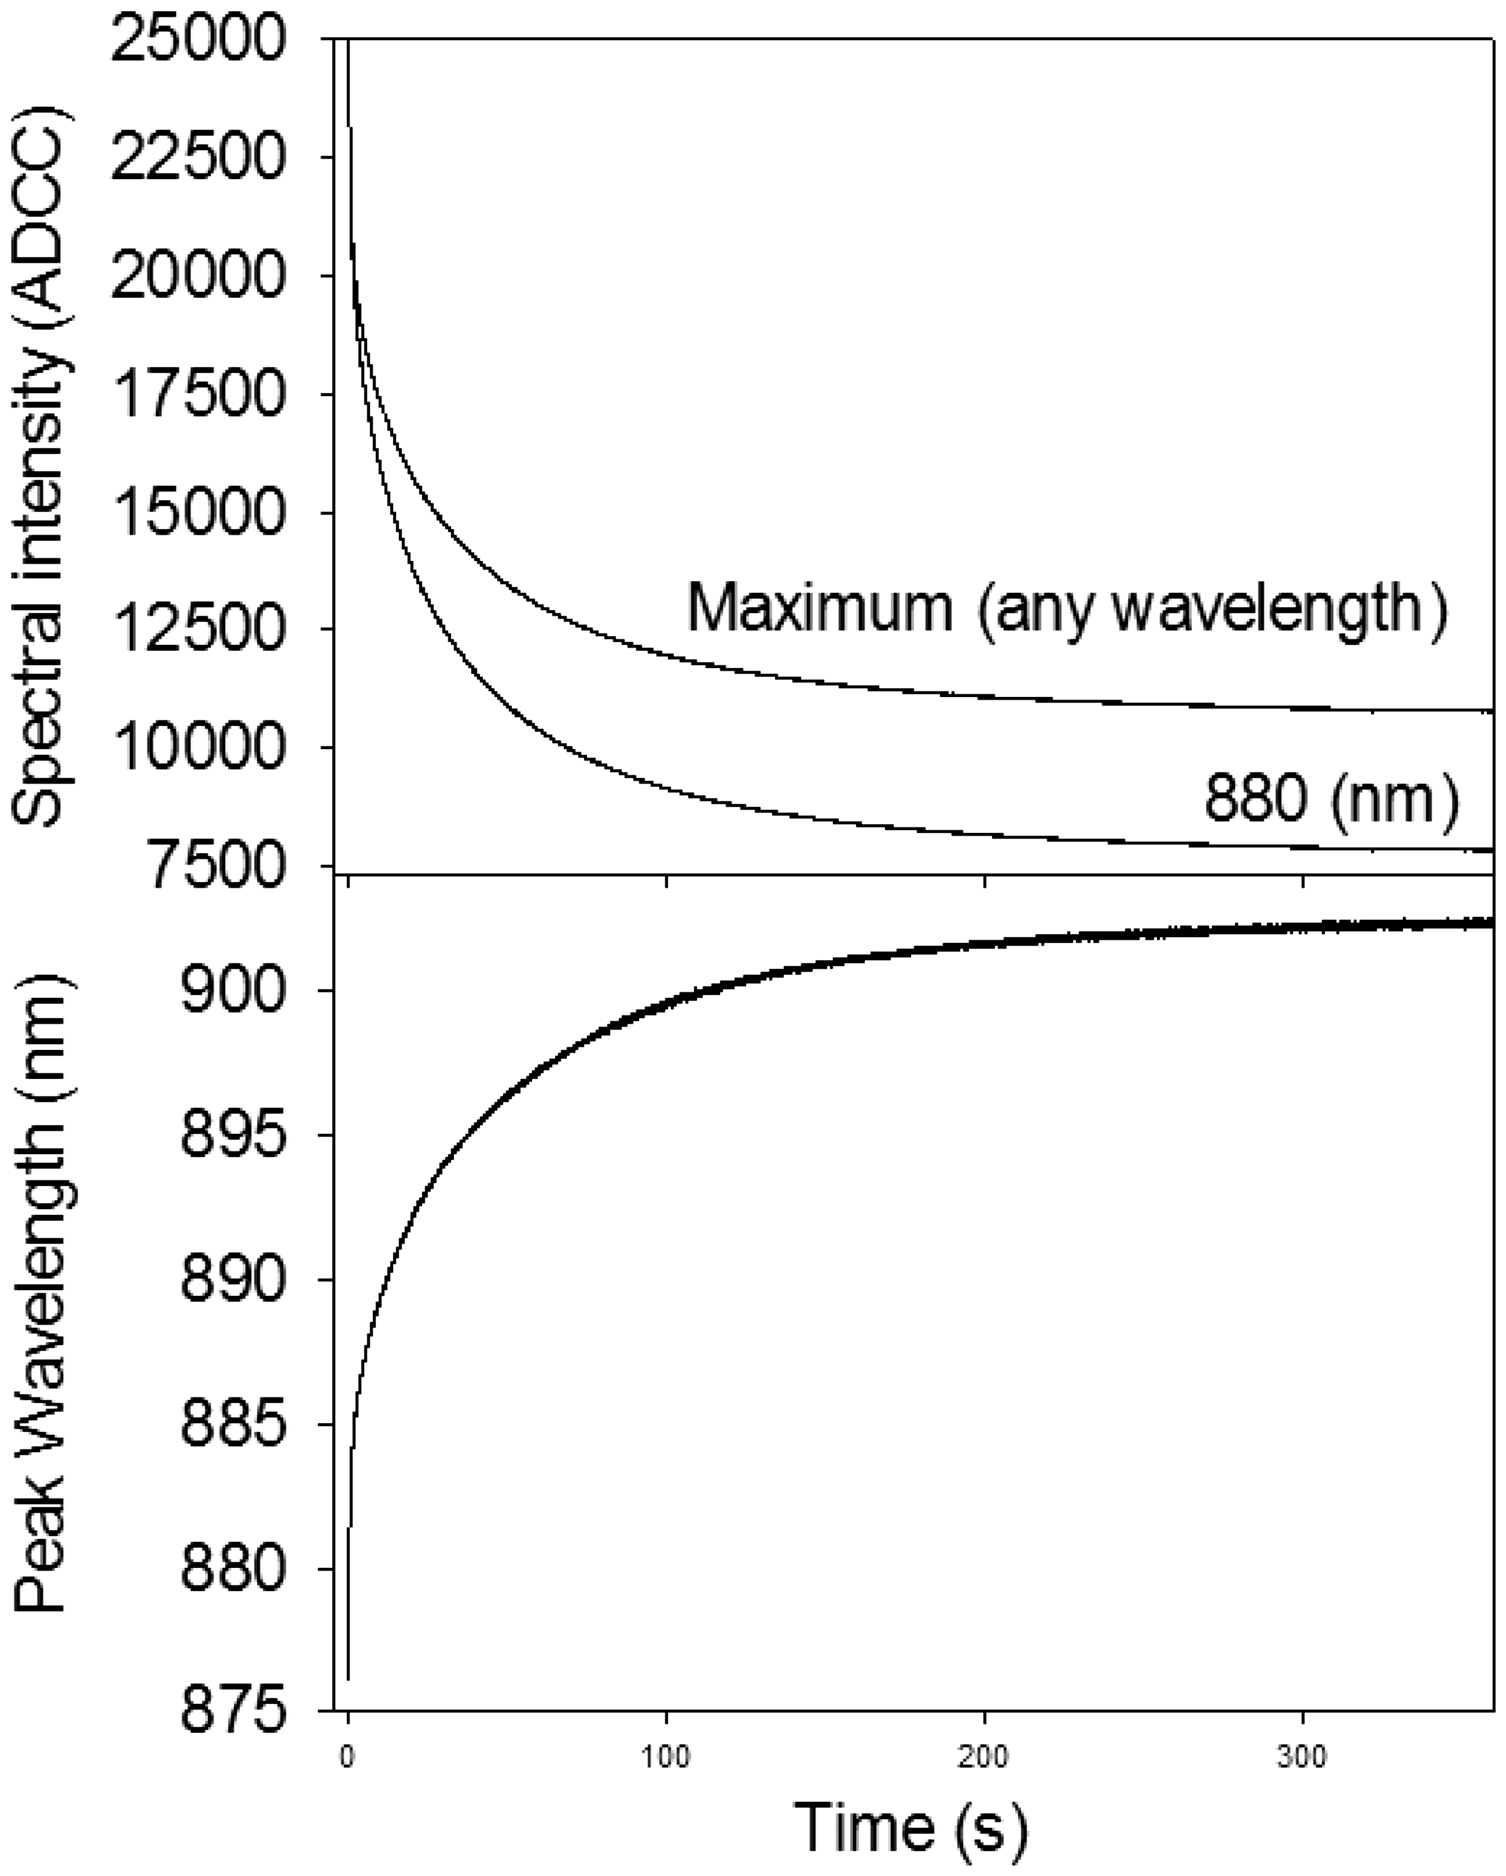
Of the 27 LEDs used, 13 demonstrated ‘burn in’ behaviour on their first use. In these cases, emission intensity was not stabilised within 240 min of initial power-up, and five units did not reach a stable emission over this period in their second use, although the intensity difference was much smaller (<2.5%). It was noted that on some trials (as seen Figure 2, Trial 1), spectral intensity was higher on return to initial temperature, post 240 min from power on. The ‘burn in’ period required to achieve output stability varied between individual LEDs but was less than 24 h in all cases.
The effect of environmental temperature (top panel) on SMB720R-1100 LED intensity, measured in analogue to digital conversion count (ADCC; middle panel) and the wavelength of maximum intensity (bottom panel), monitored over a 4-h period. Middle panel shows sequential trials of two LEDs (labeled (a) and (b)). Trial 1 was the first use of these units. Arrows mark initial readings (t = 0, i.e. at power up). The sharp feature (at approx. 180 min) was associated with a cabinet defrost cycle event.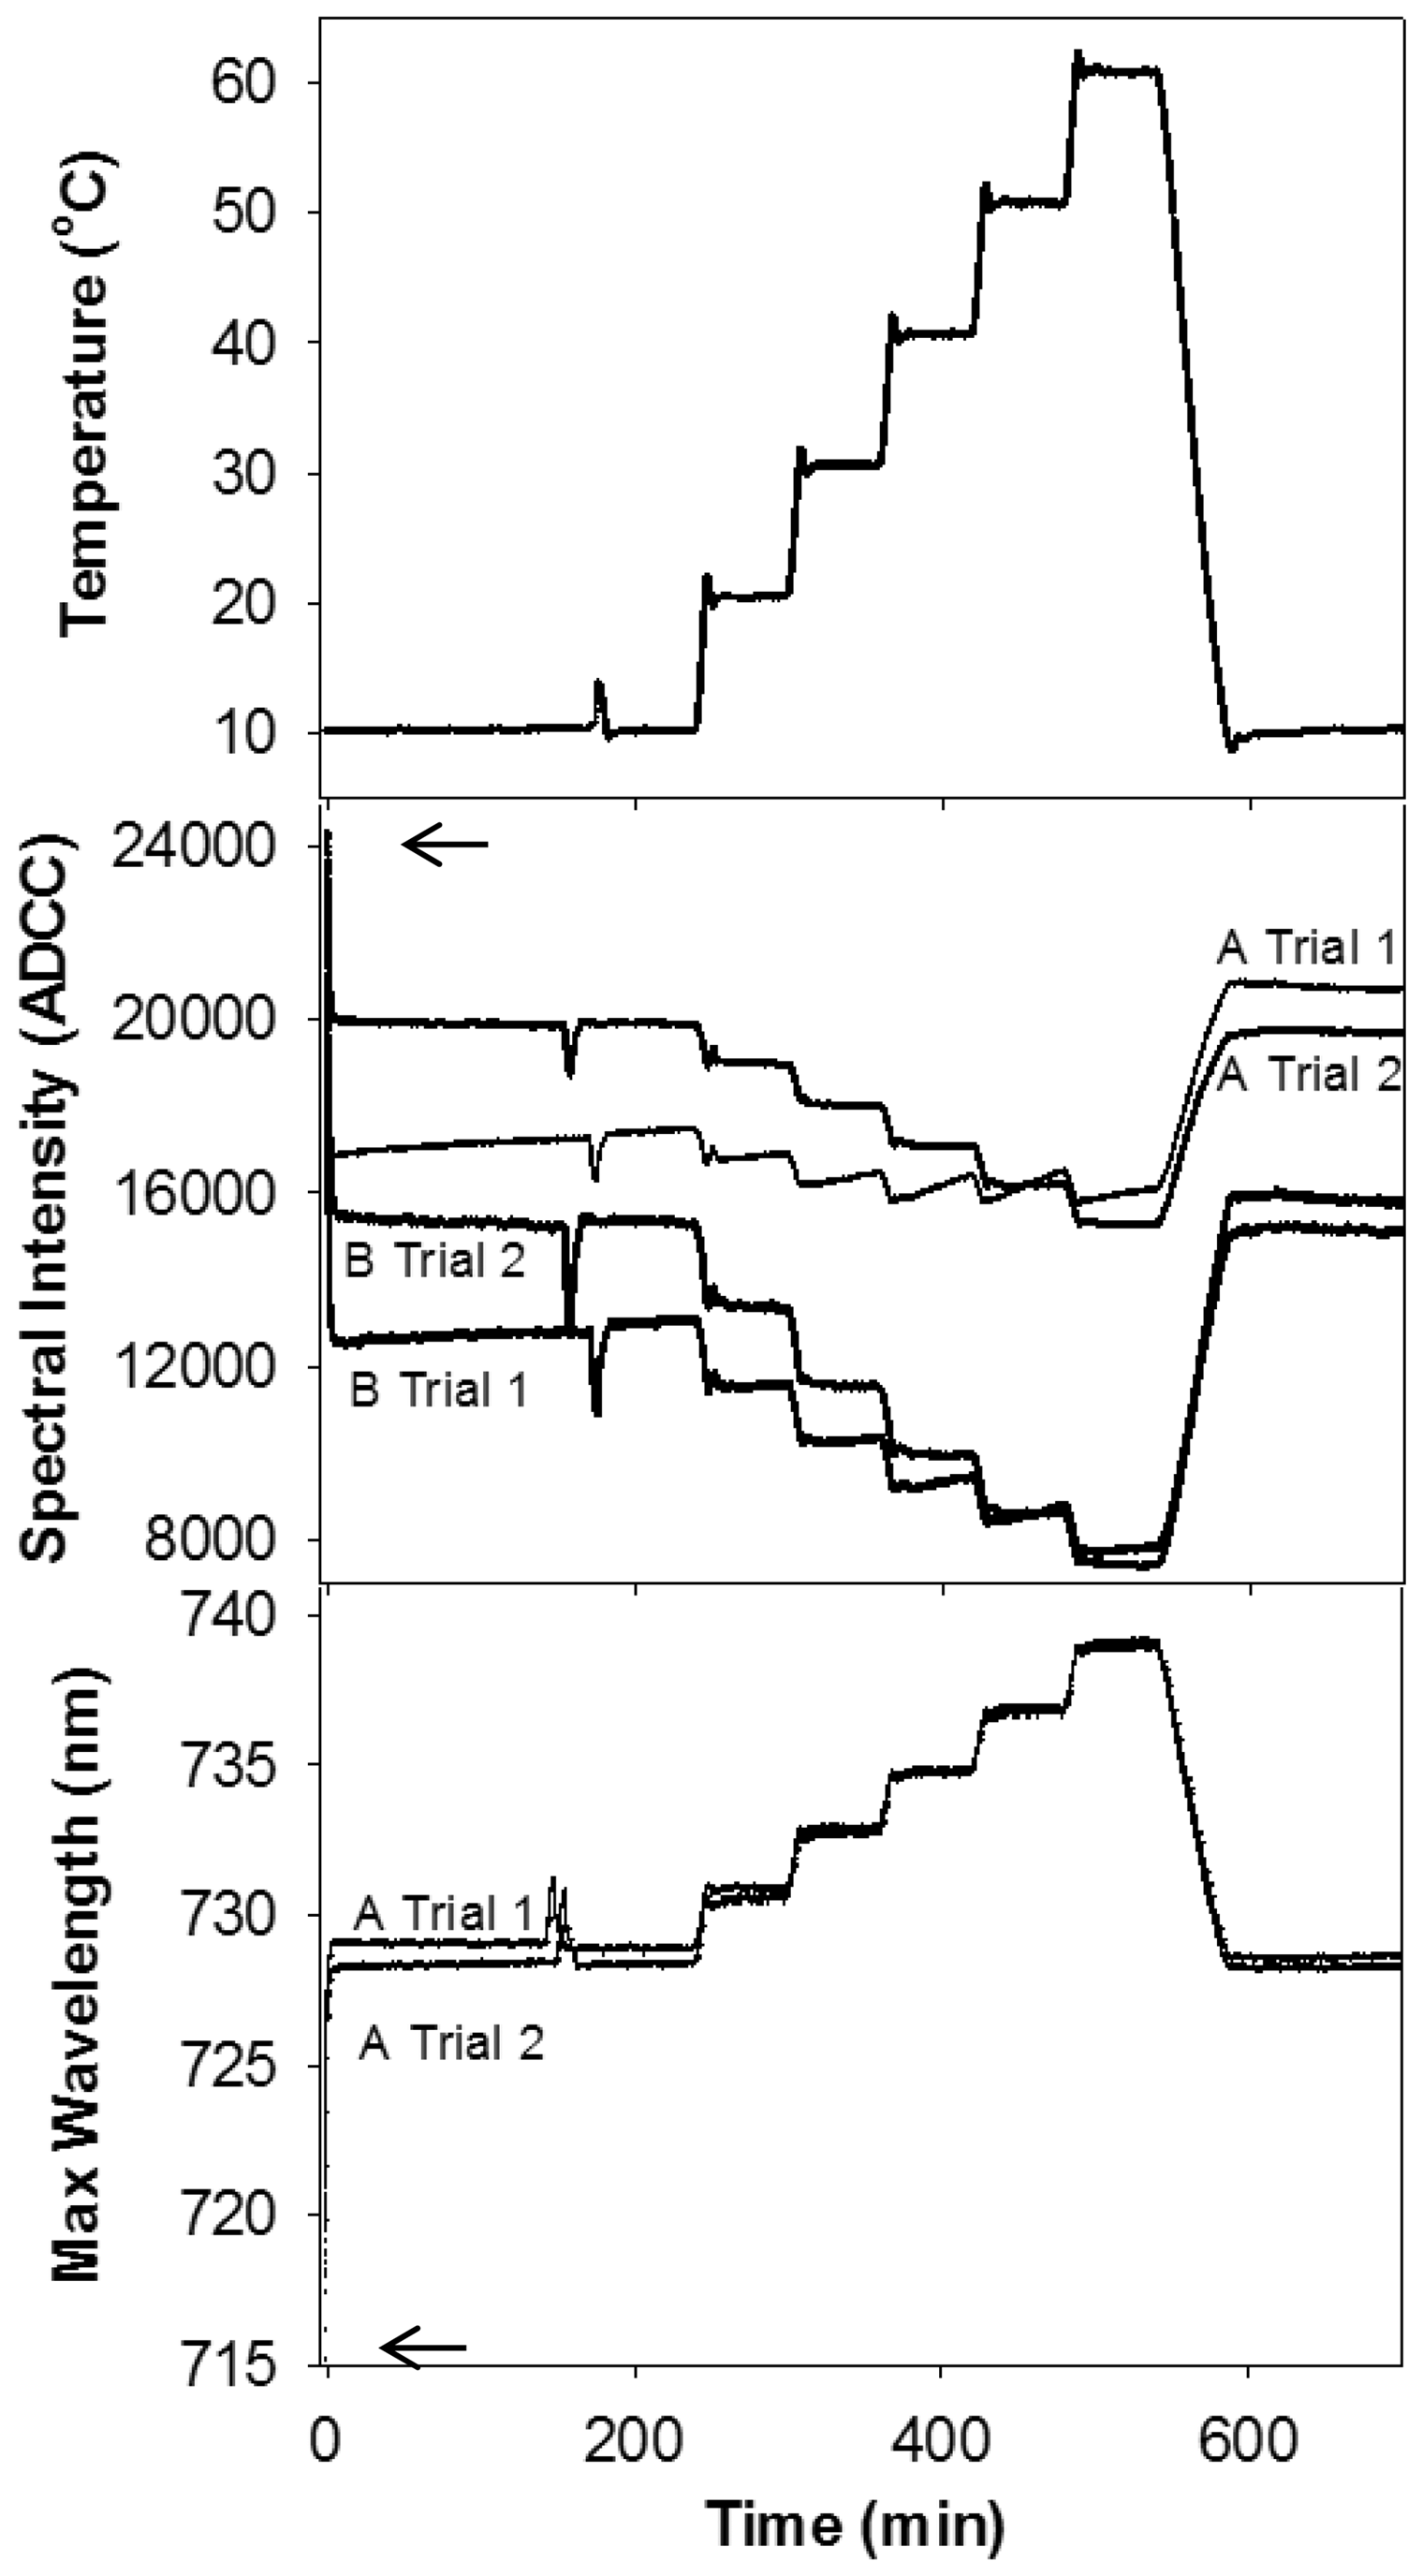
Exercise 2 – Response to temperature
An increase in environmental temperature produced a decrease in intensity of the LEDs and a shift to longer wavelength of the peak emission (Figures 2 and 3), ranging from 0.20 to 0.33 nm ℃−1 depending on LED type (Table 1). For example, the SMB720R-1100 LED linearly increased in peak wavelength emission from 728.3 nm to 738.8 nm as temperature increased from 10℃ to 60℃ (R2 = 0.9995, slope 0.211, intercept 726.2 nm). The result is consistent with the specifications provided by the manufacturer, however, that specification provided is only approximate (0.2 nm ℃−1). If a temperature-induced wavelength is to be modelled in an instrument method, then an empirically determined value is recommended.
Spectral output in analogue to digital conversion count (ADCC) of a SMB720R-1100 LED with increase in environmental temperature from 10℃ to 60℃. Arrow indicates direction of increasing temperature.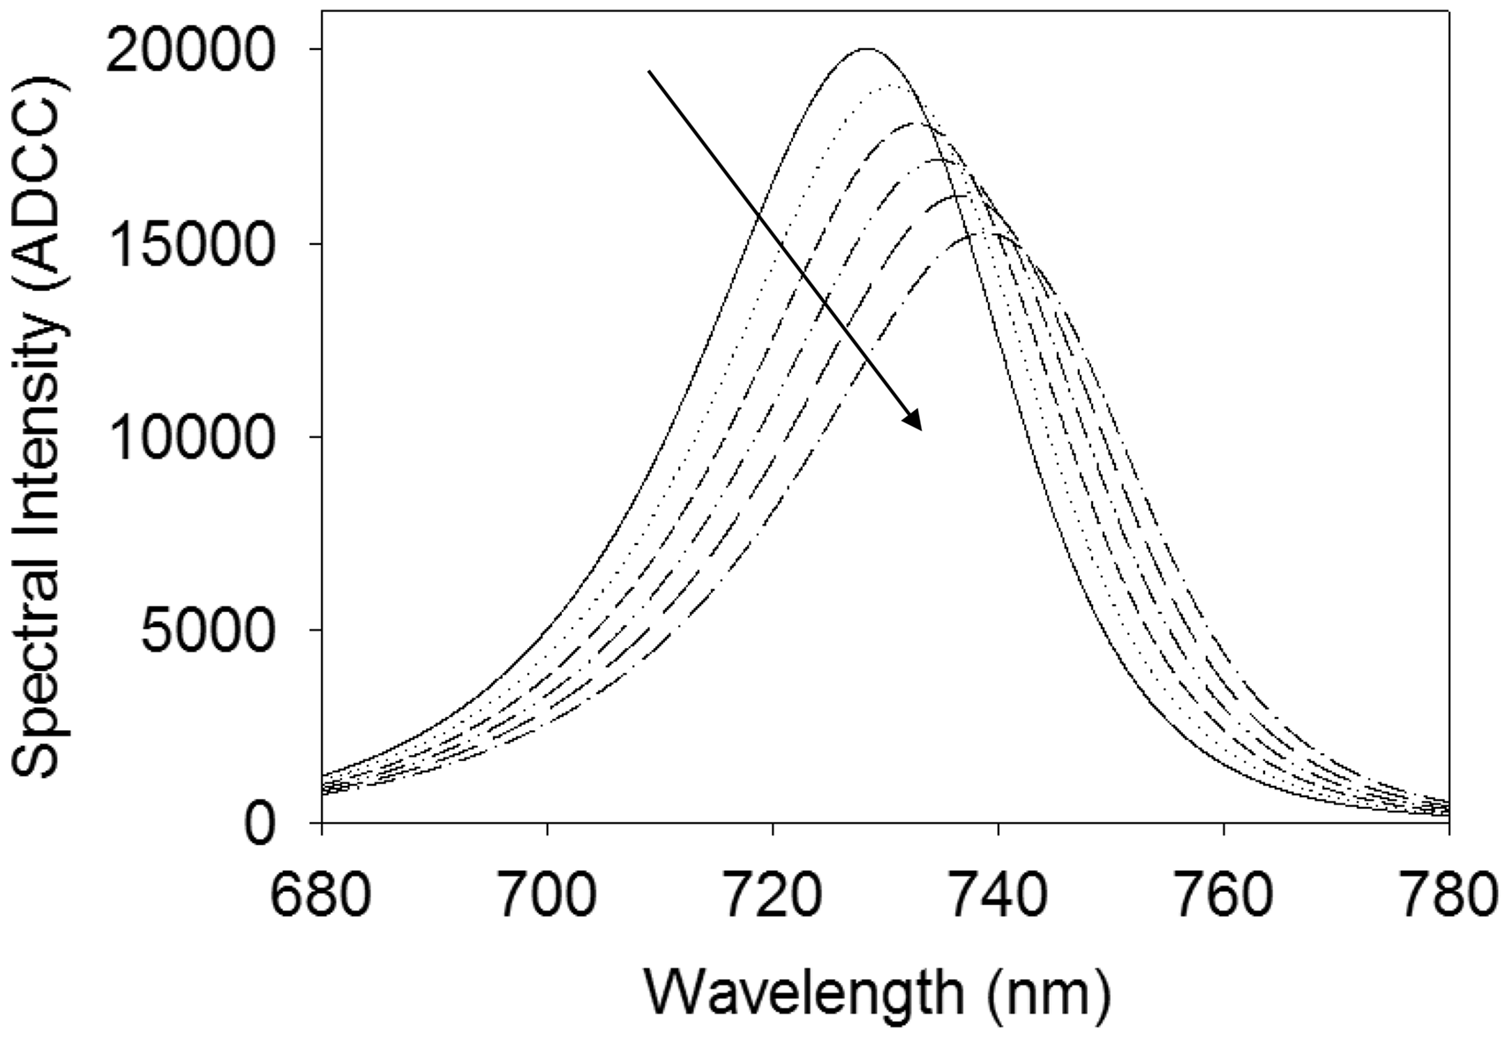
The decrease in LED output intensity with increase in temperature was described slightly better by an exponential relation (as per equation (1)) than a linear one (e.g. R2 = 0.9998 and 0.9933, respectively for the SMB940-100-02-I, a result representative of all LEDs tested, data not shown).
Exercise 3 – Effect of environmental temperature on an LED-based instrument
The DA instrument has three LEDs each of two wavelengths. The two sets pulsed alternately, each for a period of approximately 115 ms, during which time a slight increase in the peak wavelength ∼0.5 nm occurred, presumably due to LED warm up (data not shown). There was a 2–3 nm difference in peak wavelength between the individual LEDs of each set (data not shown). As expected, as ambient temperature was increased, the peak wavelength shifted to longer wavelengths, although the shift was slightly smaller (∼0.18 nm ℃−1) than noted in Exercise 2. Temperature increase was also associated with a decrease in the IAD Index readings of the instrument (Figure 4). Referencing the unit at the temperature prevailing during the sample scan was expected to remove any impact that temperature intensity changes had on the estimation of absorbance. However, referencing did not decrease the change in IAD (Figure 4), presumably due to the impact of change in the peak emission wavelength, relative to the absorbance of chlorophyll.
DA Meter IAD index (absorbance difference between 670 nm and 720 nm) measurement of fruit (at two positions) with the instrument at various operating temperatures. The solid markers are of two mango fruit at two locations with the instrument referenced at 23℃ only. The clear markers are of two apple fruit at two locations with the instrument referenced at each temperature setting. Fruit temperature was constant at 23℃.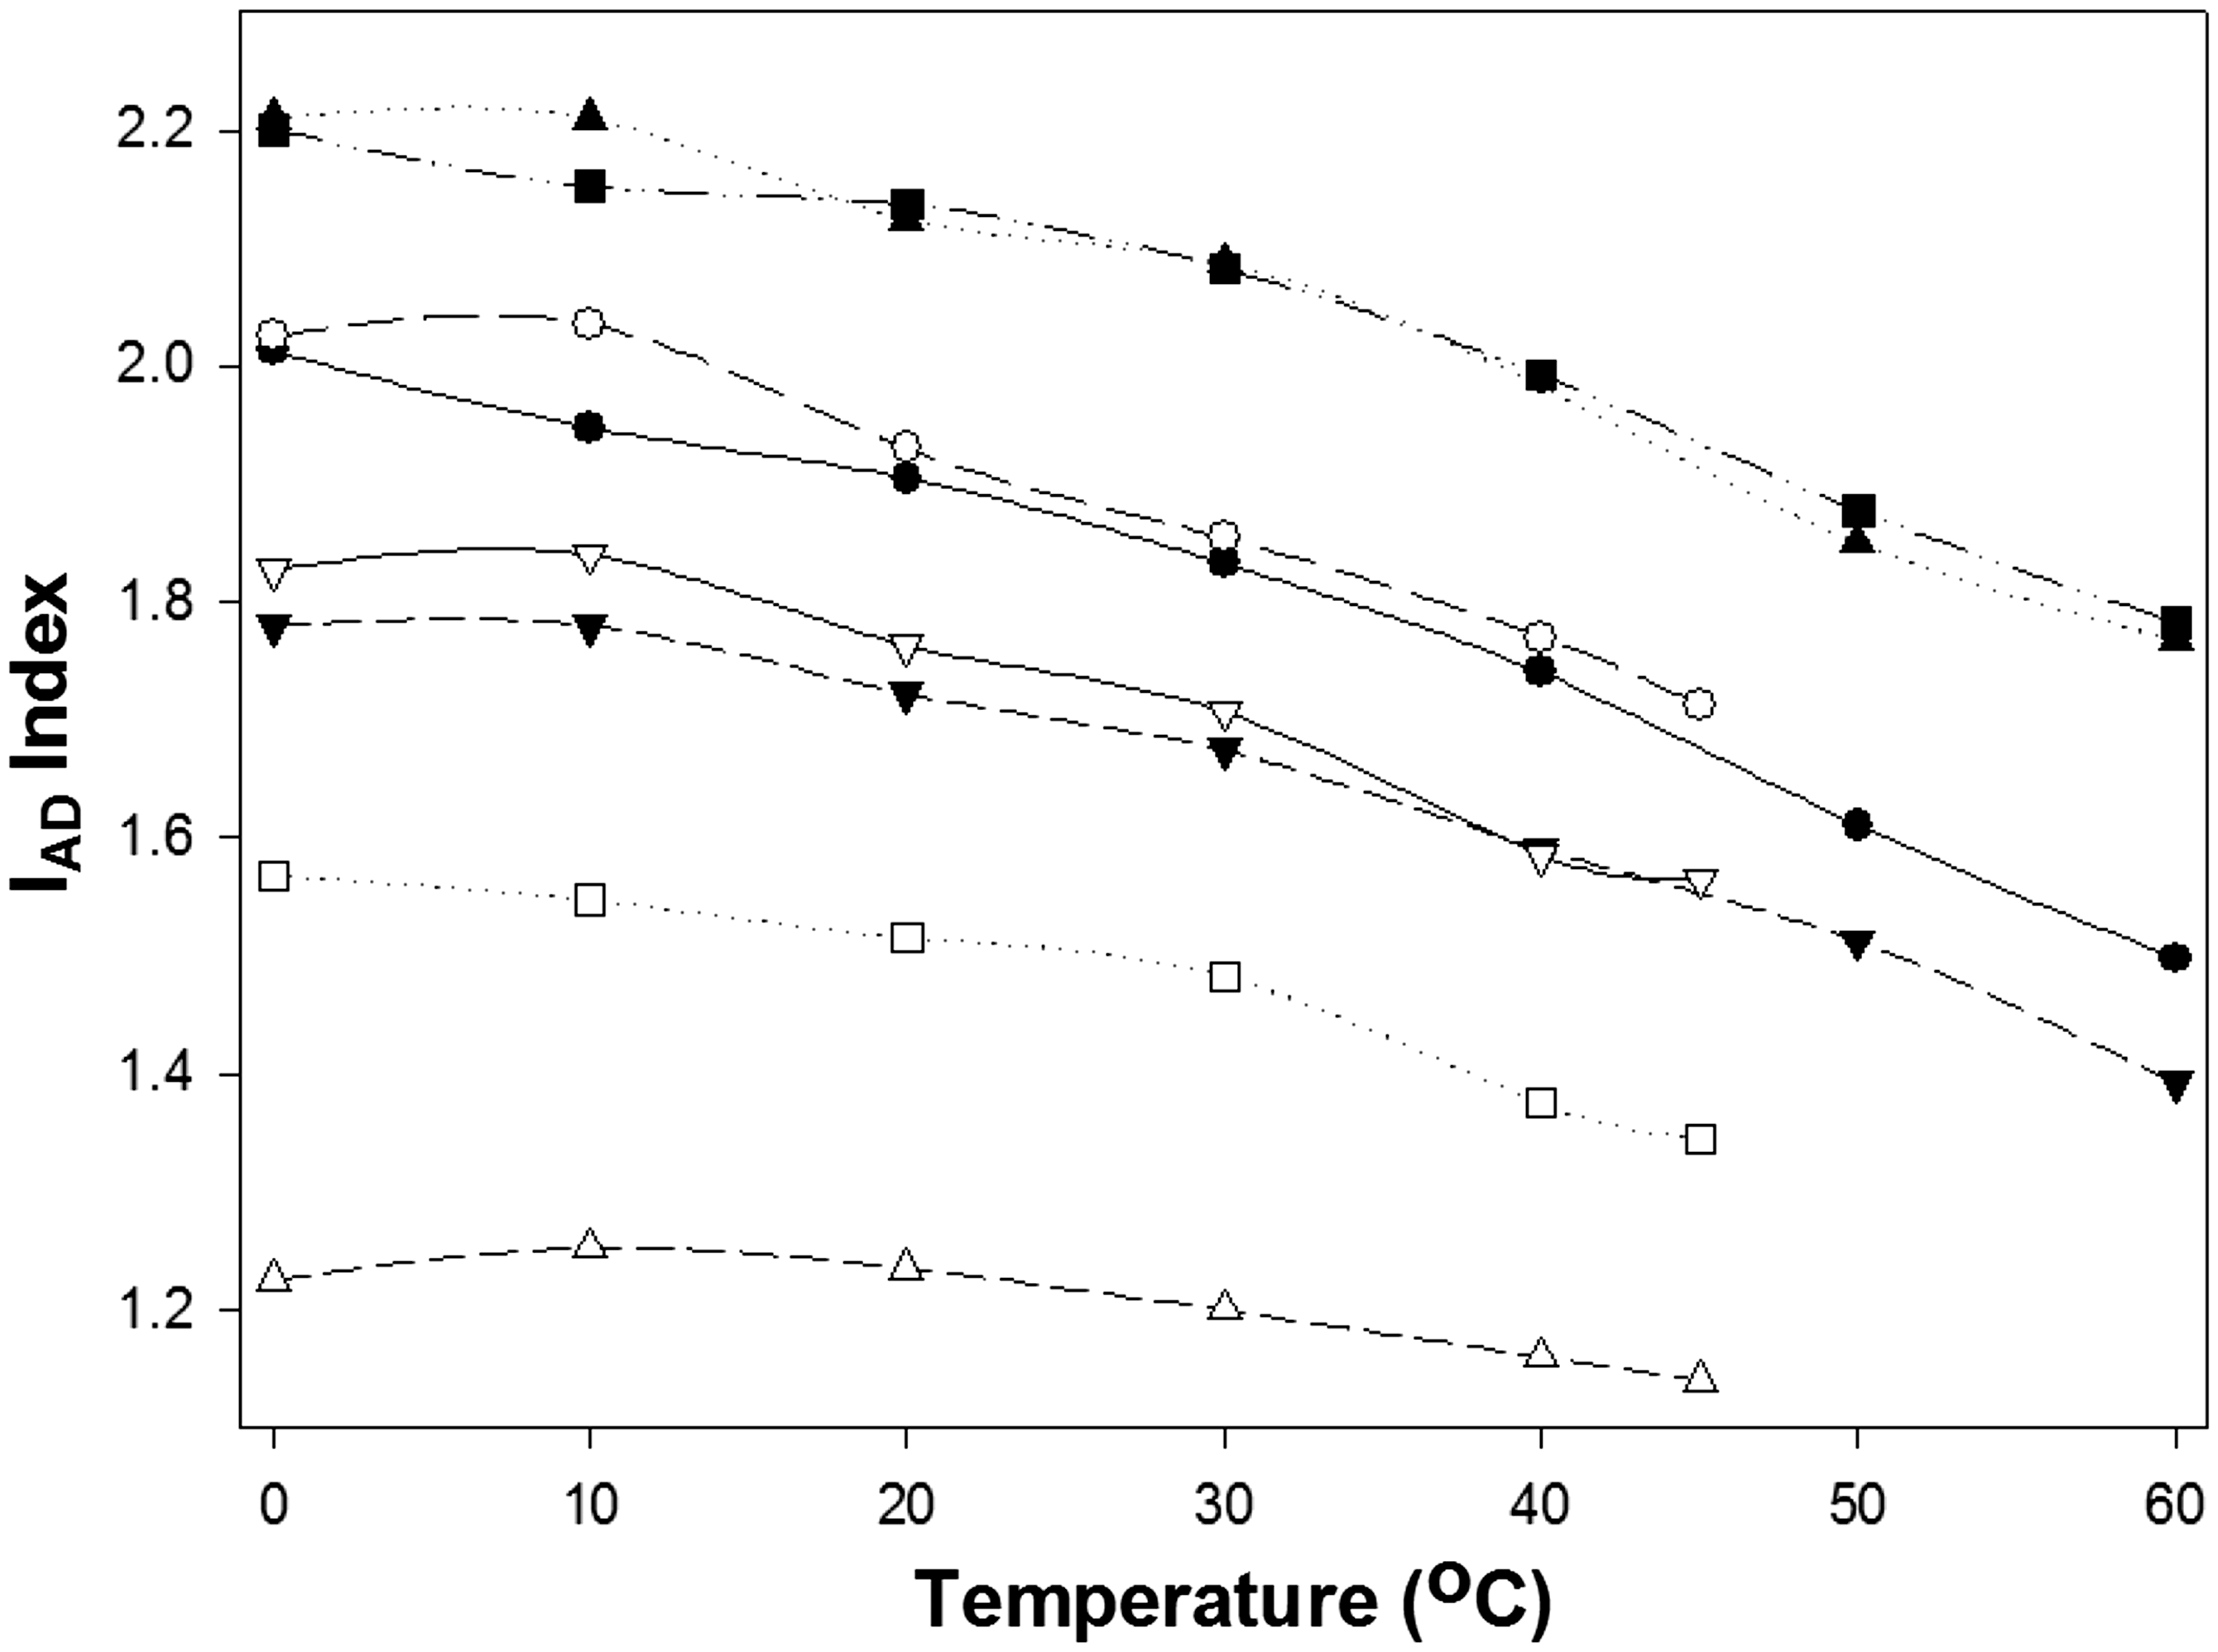
In the IAD index, the 670 nm reading is associated with chlorophyll, whilst 720 nm is used for normalisation. In an interactance spectrum of mango fruit, the chlorophyll peak can be centred at between 668 nm and 676 nm, dependent on sample (data not shown). The peak is relatively narrow, with 16–31 nm between peak maximum and the red edge. The red edge is the wavelength at the maximum derivative of right shoulder of peak (point of inflection), at 691–701 nm. A shift in the wavelength used in assessment of the chlorophyll peak can thus be expected to impact the IAD index value.
A shift in LED-operating temperature of 10℃ invoked a shift of approximately 2 nm in peak wavelength. The effect of wavelength shift on the IAD index was calculated using spectra of mango fruit, incrementing the wavelengths used for the index from 670 nm and 720 nm by up to 12 nm (representing approximately a 0–60℃ change in LED temperature). The calculated index changed by 0.02–0.16 units (Figure 5).
Change in calculated IAD index (absorbance difference between 670 nm and 720 nm) of 14 mango fruit with shift in wavelength (λ) compared (A670+λ–A720+λ), taken from full spectrum absorbance measurements. A 10℃ increase in temperature gives approximately a 2 nm increase in peak wavelength.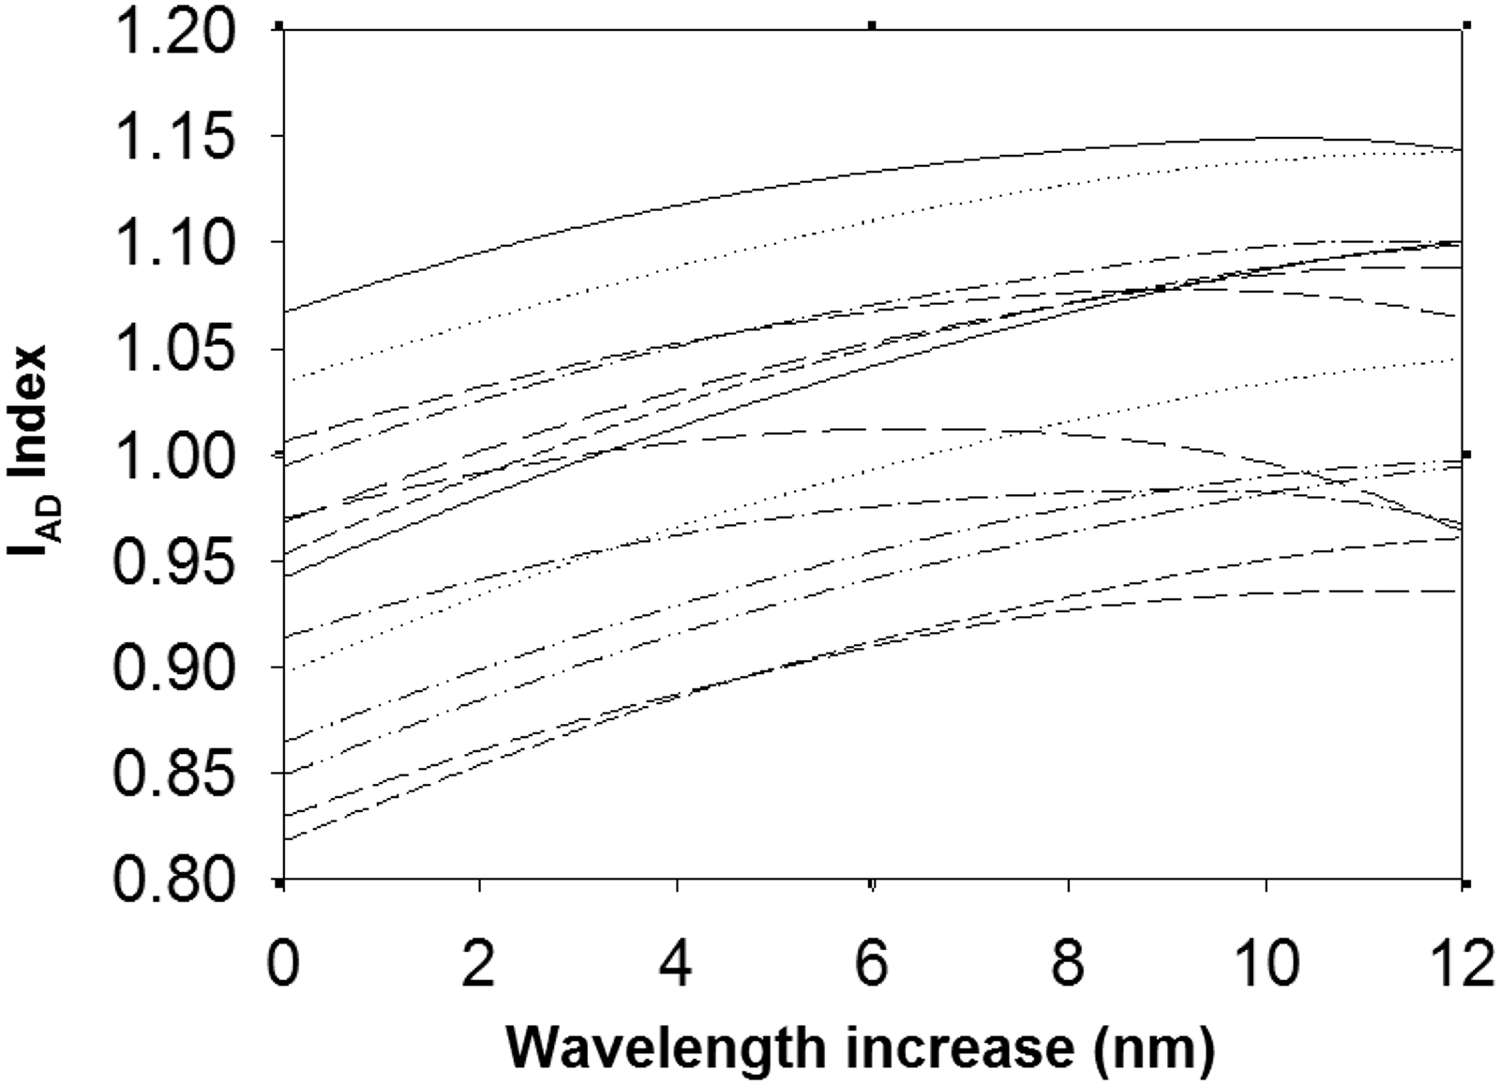
The pattern of change of the calculated IAD index with increased temperature/wavelength (Figure 5) was different to that observed with the DA Meter (Figure 4). The calculated index was based on the difference between A670 and A720 measured using the Zeiss MMS1 spectrometer, which has an FWHM of approximately 10 nm. The DA Meter LEDs have approximately 50 nm FWHM wide peaks and thus in practice, IAD measurements for 670 and 720 nm will be based on overlapping wavelengths.
Implications to instrument design
Change in LED intensity and spectral profile, as caused by changes in temperature due to LED warm up or environmental temperature, will obviously impact the performance of a spectroscopic system employing these units as an illumination source. For instrumentation development use of empirically determined LED characteristics is advisable, rather than use of the approximate specifications provided by the manufacturer.
Several measures are recommended. A ‘burn in’ period should be utilised for all LEDs. In an ‘avoidance’ strategy, as Dasgupta et al. 20 suggested, stability of the light output could be achieved using a resistor in combination with a negative temperature coefficient thermistor. To combat long-term output instability, it was suggested that the LED be driven with photometric feedback whilst maintaining the photosensor at constant temperature (e.g. using a temperature sensor and Peltier heating). The commercial Methanalyzer (Alpha-Omega Power Technologies LLC, Albuquerque, NM, USA) uses such a circuit. 20 For continuously operating instruments, a warm-up time of 6 s should be established to ensure wavelength and intensity stability. An alternate avoidance strategy involves the use of interference filters to maintain spectral bandwidth, however, intensity changes would still need to be accommodated, either mathematically or via re-referencing. In an ‘adaptation’ strategy, change in illumination intensity and spectral quality could be mitigated by re-referencing. Alternately, the observed changes in peak wavelength and relative intensity are explicable in terms of forward current and temperature and thus predictable if current and temperature are known. Change in illumination intensity and spectral quality could thus be addressed by modelling, given knowledge of current and temperature.
Footnotes
Declaration of conflicting interests
The author(s) declared no potential conflicts of interest with respect to the research, authorship, and/or publication of this article.
Funding
The author(s) received no financial support for the research, authorship, and/or publication of this article.