
Abstract
Toluene swell or equilibrium swelling is universally used by rubber factories to measure the degree of crosslink of their compounded or prevulcanized latices at different stages of production. To apply near infrared spectroscopy for rapid and accurate quality control, spectral acquisition of prevulcanized latex, thin film and thick film was performed using a Fourier transform near infrared spectrometer in diffuse reflection mode across the wavenumber range of 12,500–3600 cm−1. For prevulcanized latex an effective model was developed using partial least squares regression with preprocessing (first derivative + straight line subtraction method). The coefficient of determination (r2), root mean square error of cross validation and bias of the validation set were 0.71, 3.93% and −0.005%, respectively. For the thin film model the r2, root mean square error of cross validation and bias were 0.65, 4.01% and −0.028%, respectively. Whereas for the thick film model the r2, root mean square error of cross validation and bias were 0.70, 4.00% and −0.006%, respectively. Three models including prevulcanized latex, thin film and thick film were validated by 23 unknown samples, providing standard error of prediction and bias of 5.357 and 2.494, 4.565 and 1.001 and 3.641 and −0.961%, respectively, for prevulcanized latex, thin film and thick film. The model developed for the thick film spectra gave the best results.
Keywords
Introduction
Natural rubber latex is a stable colloidal dispersion of polymeric materials (latex particles) in an aqueous medium. 1 Latex or rubber products, without vulcanization, suffer severely from poor physical properties, poor resistance to light and swelling in solvents, and above all are susceptible to extreme temperatures, 2 becoming sticky in hot weather and hard when cold.
The discovery of vulcanization by Charles Goodyear in 1839 was a milestone in the history of the rubber industry. As supply of rubber from the wild Hevea brasiliensis trees of the Amazon Valley was inconsistent, plantation rubber 3 was begun in Malaya in 1877, spreading throughout south-east Asia and other parts of the world where millions of people’s livelihoods depended on it.
Almost all rubber products require vulcanization. Vulcanization increases elasticity while decreasing plasticity. The process is brought about by the linking of macromolecules at their reactive sites. The cross-linking of rubber is also referred to as curing. In particular, the modulus, hardness, elastic properties, resistance to swelling, etc. are considerably modified during the progress of vulcanization. 4 In short, vulcanization converts raw rubber molecules into a useful network by the formation of crosslinks. The properties of rubber vulcanizate are determined by the state of cure. 5 But it should be noted that the properties of vulcanizate are not functions of crosslink density only. They are also affected by the types of crosslink, nature of polymer and types and amount of filler incorporated into the products.
In most latex processes the compounded latices are matured, either partially or completely and stored before use. Most compounded latices contain dithiocarbamates (accelerators) which can cause a measure of crosslinking in the rubber during maturation. The extent of crosslinking depends on storage conditions and also on the nature and amount of curatives present. The production of prevulcanized (PV) latices may be regarded as a special form of maturation and both processes require a means of measuring the extent of vulcanization of latex because of the influence it has on the processing behaviour of latex product properties. 6 An intriguing part of latex technology is that latex can be vulcanized in the liquid state and then used to form a deposit of vulcanized rubber without further curing. 7
Toluene swell (TS) or equilibrium swelling values are determined by immersing a thin latex film in the solvent, usually toluene, and measuring the increase in linear dimensions at equilibrium. The advantages of the swelling tests are that the results are directly related to the crosslink density and are also quite reproducible. Its disadvantages are that it is a relatively slow procedure since reliable measurements can only be made at equilibrium. The time taken to reach equilibrium is greatly dependent on the thickness of the latex film used. The total time for the test, including drying of the film is about 1 h or more. 6 The procedure is time consuming and requires a skilled technician. As a possible alternative, near infrared spectroscopy measures the interactions between the electromagnetic radiation in the NIR region (700–2500 nm) and is a measure of the molecular structure of materials. The fundamental absorptions occurring in the infrared region extend to the shorter wavelengths as overtones and combinations. NIR spectroscopy once calibrated enables properties to be obtained in minutes with a repeatability and reproducibility equivalent to most reference methods and not prone to subjective operator errors. The method is environmentally friendly as no chemical is used and the instruments are simple to install and operate with little or no sample preparation. NIR spectroscopy has been applied to many types of agricultural products as well as application to field and concentrated natural rubber latices. Cornish et al. 8 used NIR spectroscopy for the rapid quantification of latex in both wet and dried Parthenium argentatum (guayule) homogenate and purified latex samples. The coefficients of determination (R2) for correlations between the measured rubber content and the NIR predicted rubber content were 0.92 and 0.83 for the dry and wet samples, respectively. For several years NIR has been applied widely to studies of natural rubber latex. Sirisomboon et al. 9 and Hock and Sirisomboon 10 used this technique to evaluate the dry rubber content of latex. Narongwongwattana et al., 11 Sirisomboon et al. 12 and Narongwongwattana et al. 13 were equally successful in using NIR spectroscopy to determine the volatile fatty acid number, apparent viscosity and alkalinity of latices, respectively. TS or equilibrium swelling of a vulcanized rubber in a solvent is dependent on the density of the crosslinks, the nature of the solvent and the rubber. With a given rubber–solvent system, the equilibrium swelling value becomes a measure of the crosslink density of the vulcanizate. Accurate degrees of crosslink have to be predetermined before being put on the production line so as to get the final products of the highest quality. Rubbers that have passed the peak of the curve are said to be ‘reverted’. Reversion is the breaking of the chemical bonds or crosslinks.
The objective of this research was to conduct a study on the application of NIR spectroscopy to predict the crosslink density of natural rubber latex compound via the TS test to facilitate quality and process control in the production factory. The models were developed using NIR spectra collected from PV latices, thin films and thick films. The use of thin and thick latex films was to simulate the manufacture of condoms and examination gloves which were the two main dipped products made from natural rubber latex.
Materials and methods
Sample preparation
Samples of compounded natural rubber latex for the experiment were sourced from the factory of the Thai Rubber Latex Corporation (Thailand) Public Company Limited in the Nongyai district, Chonburi province, Thailand. A total of seven batches of 100 tonnes each of PV natural rubber latex were prepared over a year at the factory from the latex concentrates produced from the freshly tapped field latices that the smallholders in Chonburi and its vicinities supplied to the factory. Three samples were drawn from each tank at different levels (upper, middle and lower) of the tank each week for eight weeks (total nine times) commencing from the date of production. The PV latices included three grades of different moduli, i.e. low, medium and high modulus (LM, MM and HM, respectively). PV latices are classified into grades based on their moduli of elasticity. The variations of modulus are the results of changes in crosslink densities within the latex particles. For unaged latex film after 30 days of maturation, the typical modulus values at 700% elongation of LM, MM and HM are 7–11, 11–15 and 15–18 MPa, respectively. In total, 157 samples were collected from the seven production lots with different crosslink densities over a period of about a year with the exception of some weeks due to public holidays and other circumstances.
The 24 unknown PV latex samples were collected in a similar manner as the 157 samples for calibration modelling. This was done six months later with one sample not considered due to error in the reference test, hence only 23 unknown samples were available for validation.
NIR measurement
Acquisition of NIR spectra was performed at the laboratory of the Near Infrared Spectroscopy Research Center for Agricultural Product and Food (www.nirsresearch.com) at the Department of Agricultural Engineering, Faculty of Engineering, King Mongkut’s Institute of Technology, Ladkrabang, Bangkok, Thailand. A FT-NIR Spectrometer (MPA, Bruker, Ettlingen, Germany) was used to scan the samples in the wavenumber range of 12,500–3600 cm−1 and with 16 cm−1 resolution. Background references (gold plate) were done before scanning the samples. The scanning was done at room temperature (25 ± 2℃). The latex samples were put into a sample vial (quartz, base diameter 42.5 mm and height 53.0 mm) and scanned in diffuse reflectance mode with the integrating sphere. For the scanning experiment of thin and thick films, aluminium plates (width 9 cm, length 22 cm and thickness 0.5 mm) were dipped into the latex and dried. In the case of the thick film, it was first dipped into coagulant (5% calcium chloride solution) and dried prior to dipping into the latex, whereas for thin film, it was a straight dipped without coagulant. Both thin film and thick film were dried in an oven at 70℃ for 5 min and 1 h, respectively. They were then scanned using the FT-NIR spectrometer by placing on the integrating sphere (2.3 cm in diameter). The absorbance values were recorded using log 1/R.
Analysis of TS by the reference method
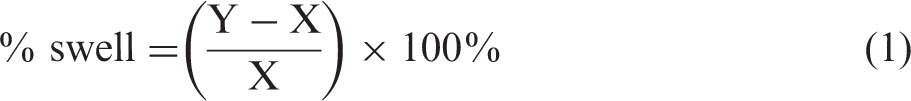
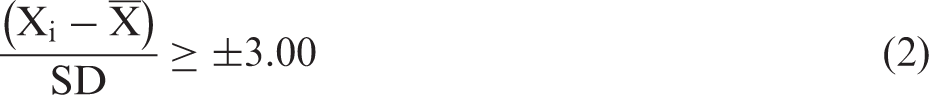
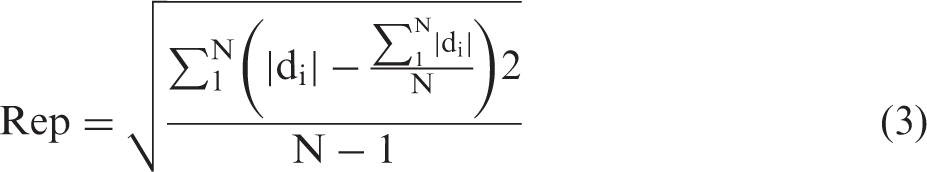
The TS method as in Figure 1 is normally used for measuring the crosslink density of compounded or PV latex and its products. A few drops of black water-based ink were added into the latex and poured on a clean, level glass plate and spread evenly on the plate using a k-bar (see Figure 1(a)). The plate was left to dry by blowing gently with a fan for about half an hour. When dried, it was thinly powdered with talc and punched with a die cutter. The cut disc of rubber film was immersed in about 20 ml toluene in a Petri dish and the increase in linear dimensions at equilibrium (usually 15 min) measured from a graph paper placed below the dish. The percentage TS was calculated from equation (1)
(a) Spreading PV latex on a glass plate to dry, (b) cut dried film with circular die cutter, (c) cut-out test pieces, (d) sample soaked in toluene and the swelled diameter determined from graph paper and (e) thin film and thick film.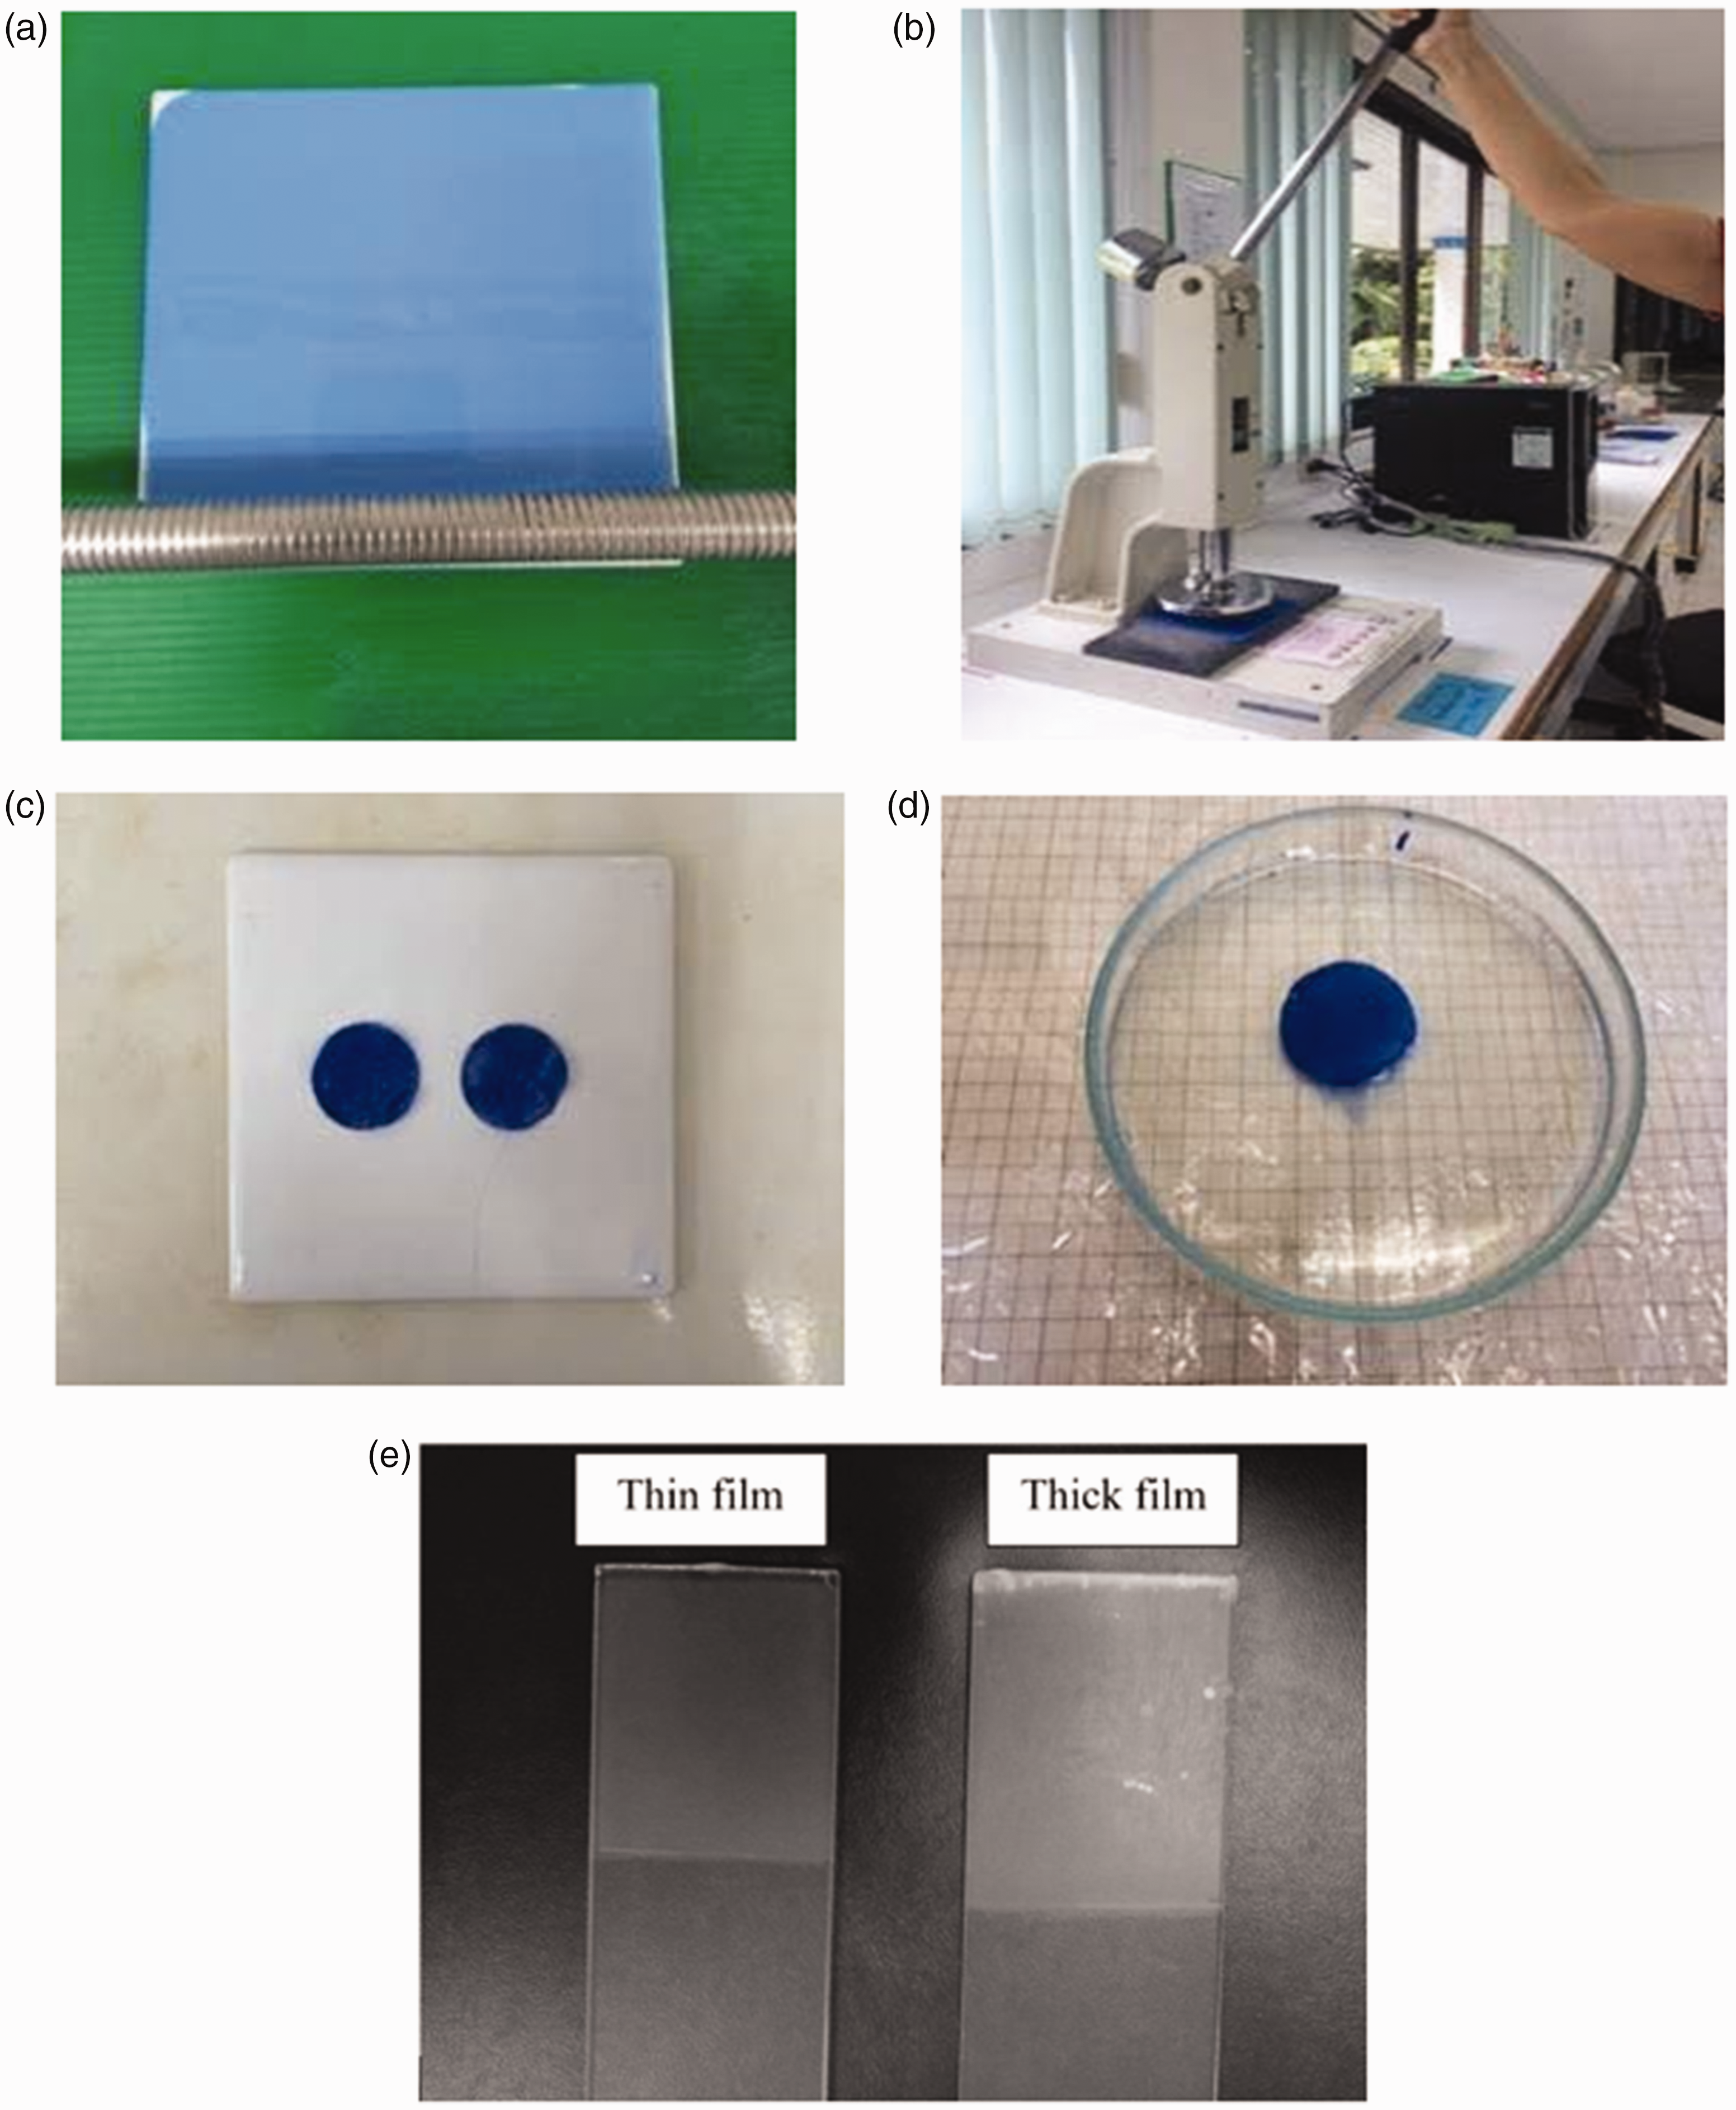
The variation in percentage swell with crosslink density, for conventionally cured natural rubber in toluene, may be broadly described as follows 7
Unvulcanized rubber = 160%,
Lightly vulcanized = 100–160%,
Moderately vulcanized = 80–100%, and
Fully vulcanized = 75%
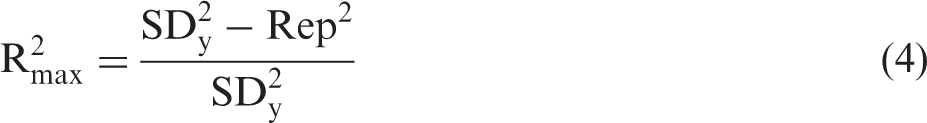
The outlier of TS of compounded latices were determined by the following equation
The precision of the TS of the compounded latices was obtained using the repeatability (Rep) value
14
or the laboratory standard error as in equation (3)
Modelling
The calibration equations for TS determination were developed using partial least squares (PLS) regression. The relationship between the PV latex spectra, thin film spectra and thick film spectra and their correspondings were used for model development. The NIR models were built from the calibration functions using the QUANT module in the OPUS software (version 7.0, Bruker Optiks, Ettlingen, Germany). The spectral preprocessing included constant offset elimination, straight line subtraction, vector normalization, min–max normalization, multiplicative scatter correction (MSC), first derivatives, second derivatives, first derivatives +straight line subtraction, first derivatives + vector normalization and first derivatives + MSC. The processing condition for the derivative was Savitzky–Golay with the segment size of 17 points and polynomial order 2.
The objective of selecting the data preprocessing method was to model the spectra such that the PLS algorithm could establish a good correlation between spectra and concentration data. For subtraction of a constant offset method, the linear baseline shifts are eliminated. In subtraction of a straight line, a linear tilt of the baseline shift is eliminated. In the case of vector normalization method, it is used to eliminate the influence of different optical path lengths in case of transmission measurements and min–max normalization is comparable to vector normalization. The MSC method is often used for measurements in diffuse reflection. As for the first derivative method, by calculating the first derivative, the signals with steep edges get more emphasis than relatively flat bands whereas in second derivative, even the extremely flat structures can be evaluated. 16
The total samples were validated by leave-three-out cross validation. The effective models were selected with the lowest root mean square error of cross validation (RMSECV), which represented the number of factors, wavenumber range, pretreatment method, regression coefficient plot and X-loading plots. The accuracy of PLS models was determined with the statistical terms of the coefficient of determination of prediction set (r2), RMSECV, ratio of prediction to deviation (RPD) and bias.
Results and discussion
Latex, thin film and thick film spectra
Raw PV latex, thin film and thick film spectra obtained from FT-NIR are shown in Figure 2(a) to (c), respectively, where the wavenumber between 5840 and 5620 cm−1 (1712–1780 nm) clearly corresponded to the functional group of C–H methyl first overtone of CH3.13,14 They are components of the isoprene unit of rubber.9,11 Based on the established data from Workman and Weyer,
17
the obvious peaks at about 5823 cm−1 (1717 nm) was due to functional group C–H methylene for hydrocarbons, 5230 cm−1(1912 nm) due to P–OH phosphate (.P–OH) for phosphate, 4613 cm−1(2168 nm) due to CONH2 for proteins and 4335 cm−1 (2307 nm) due to C–H methylene associated with linear aliphatic hydrocarbon.
(a) Raw PV spectra, (b) thin film spectra and (c) thick film spectra.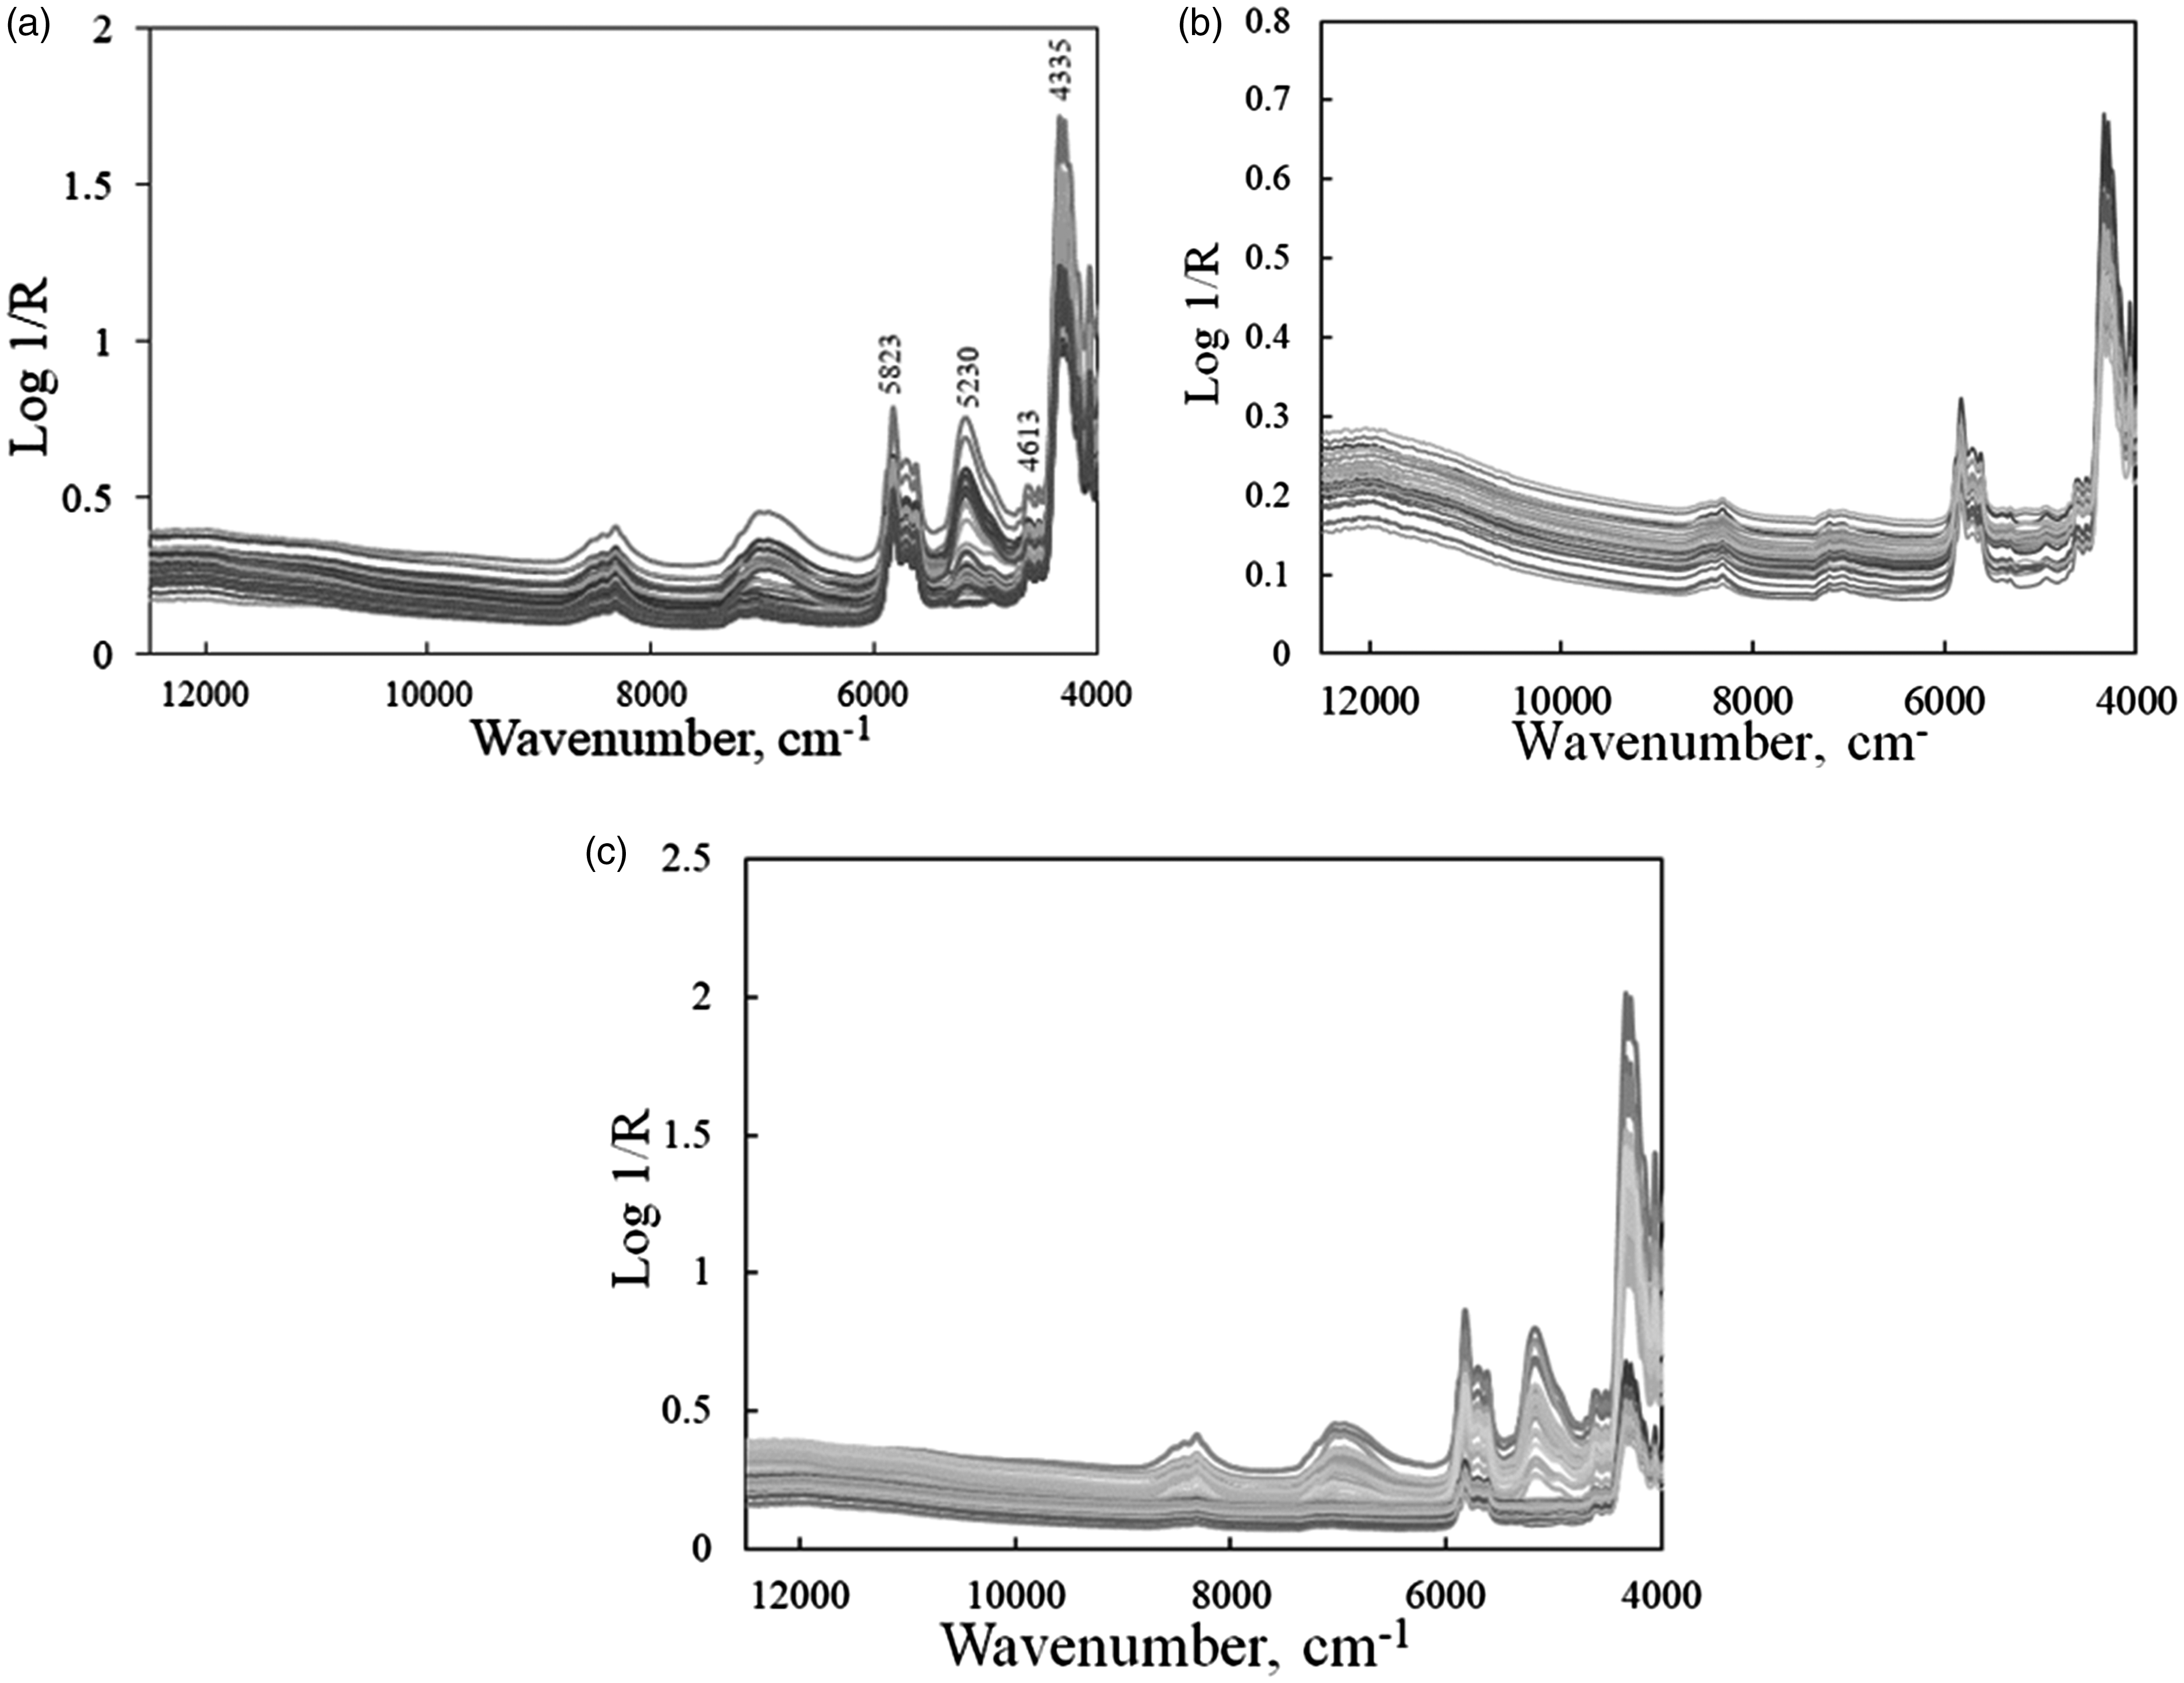
Reference data
Cross link density of prevulcanized natural rubber latex measured over a period of eight weeks using toluene swell (TS) method.
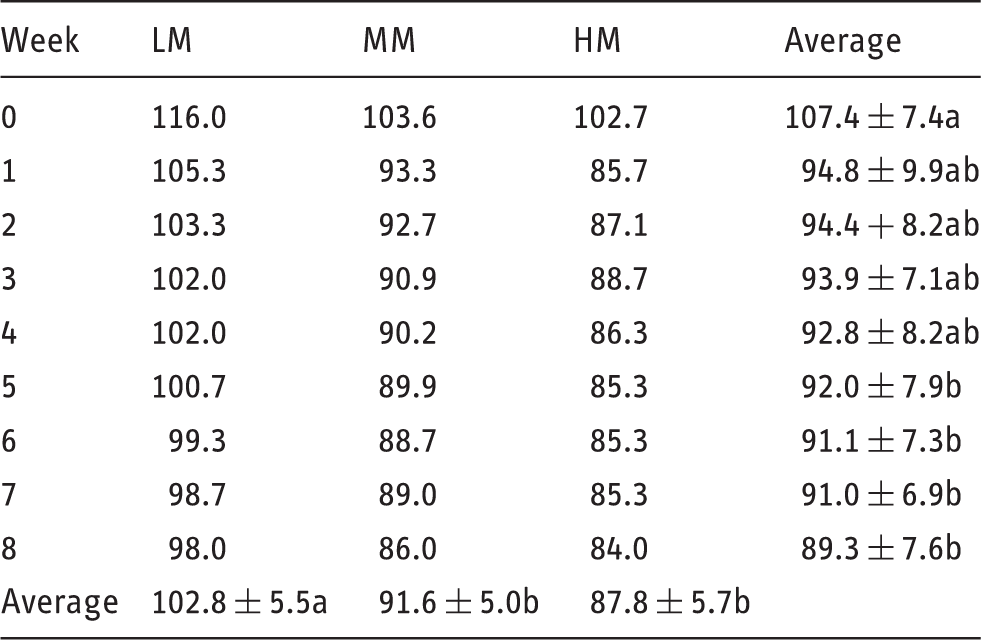
HM: high modulus; LM: low modulus, MM: medium modulus.
Different letters in the same column and row indicated that they were significantly different at p > 0.05 by the Duncan's multiple range test.
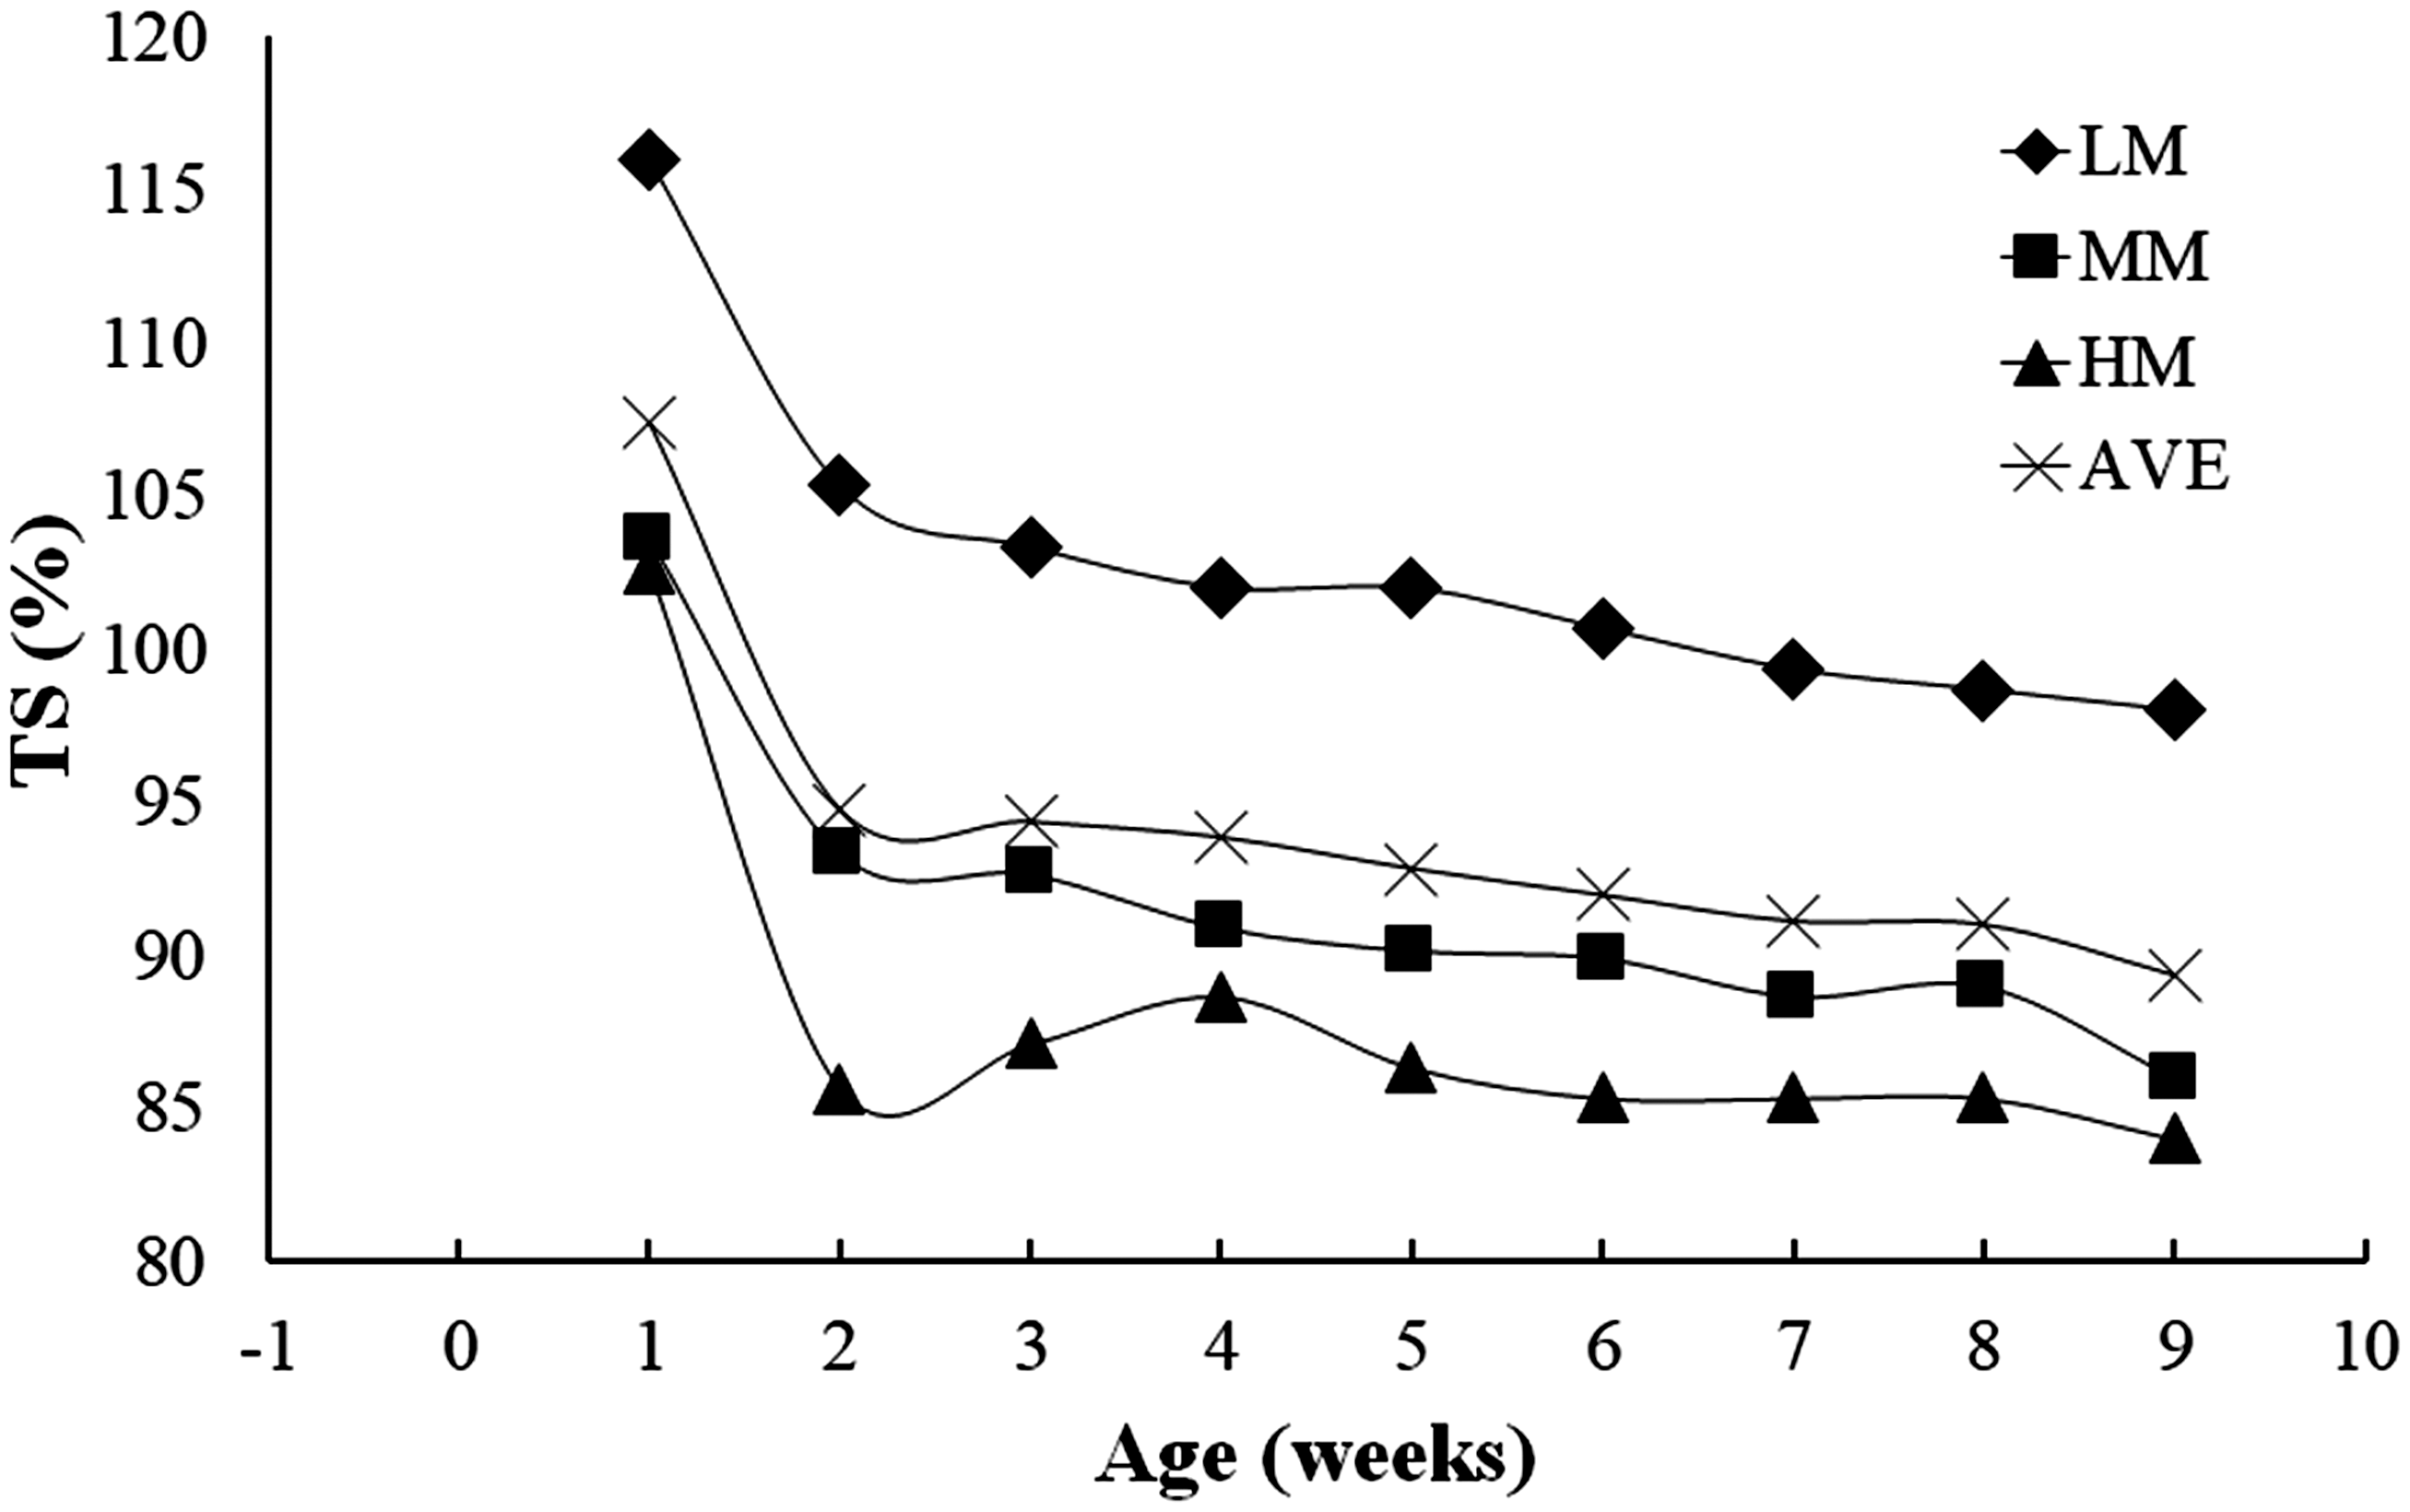
Variation of TS with the age of PV latices. HM: high modulus; LM: low modulus, MM: medium modulus; TS: toluene swell.
The cohesive mechanism of the polymer becomes stronger as the crosslinking increases, whereas the solvating power of the solvent remains constant. Therefore, a crosslinked high polymer substance is not dissolved but merely swelled, and the swelling decreases with increasing crosslinking. Thus, HM has more crosslinks than MM, and MM has more cross links than LM. It appeared that most of the cross links were formed within the first week of production as shown by the average graph (Figure 3) of the three grades of PV latices. The speed of crosslink formation was influenced by the external temperature of the environment. As the experiments were carried out over a period of a year the variation of temperatures could be quite substantial.
Statistical data of cross link density measured by TS which was used to optimize the PLS model and measured TS of the unknown sample set.
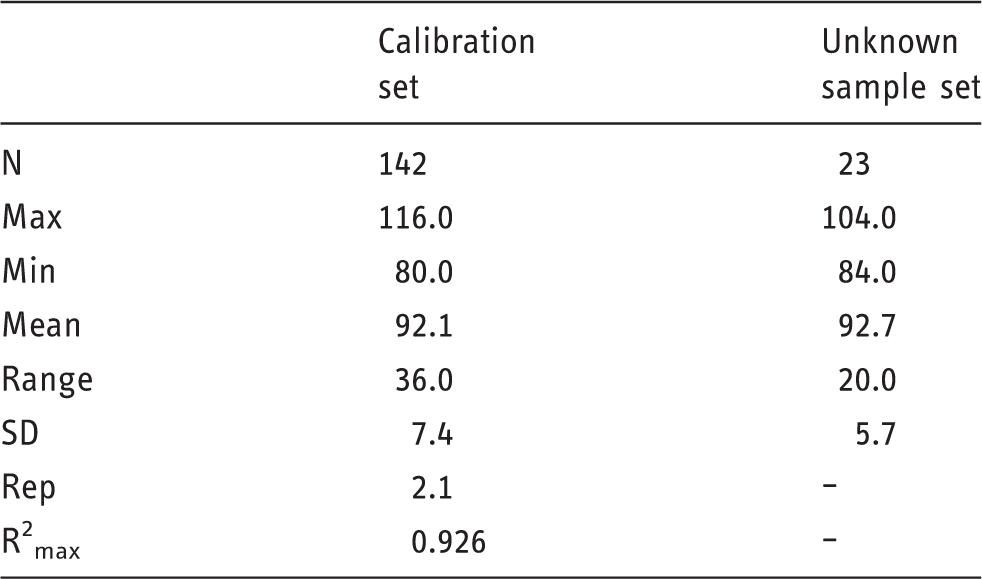
Max: maximum value; Mean: average value; Min: minimum value; N: number of samples; Rep: repeatability; R2max: maximum coefficient of determination; SD: standard deviation; TS: toluene swell.
NIR spectroscopy equations for TS
Results of the partial least squares regression models for determination of TS predicted via PV latex, thin film and thick film.
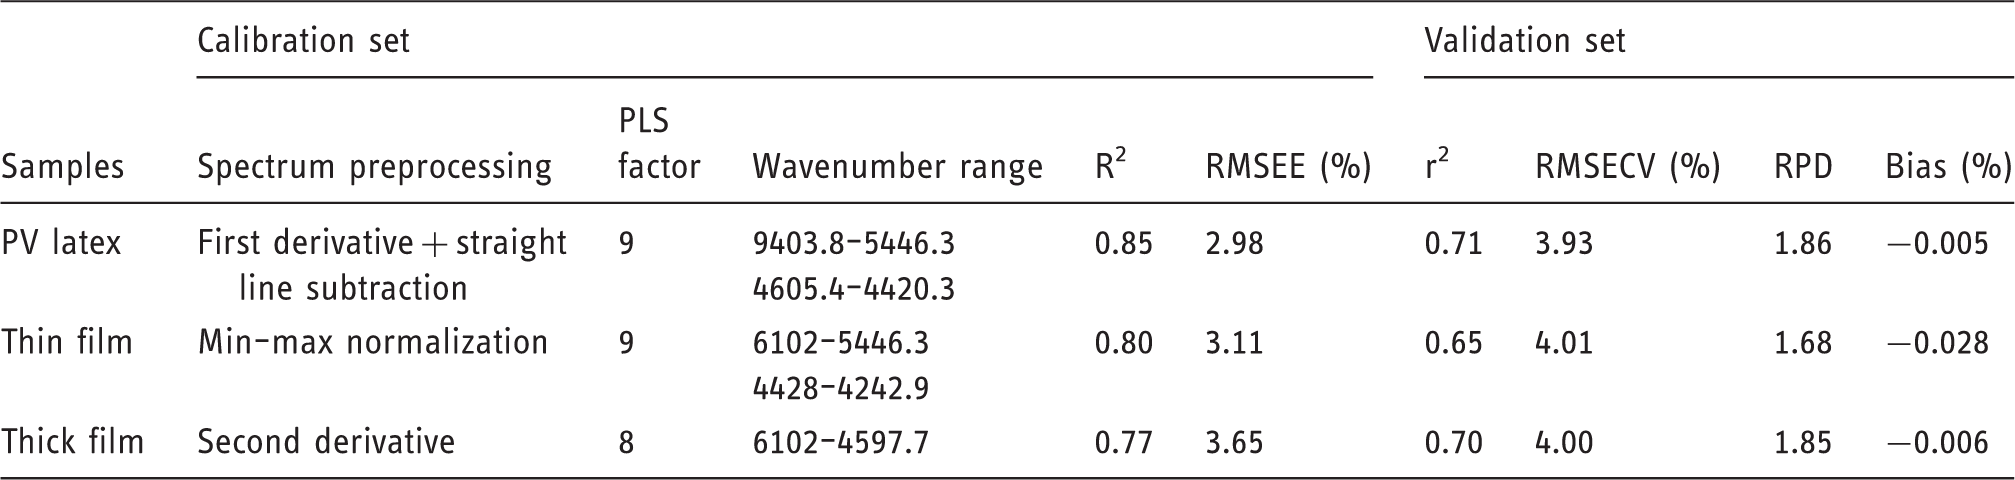
PLS: partial least squares; PV: prevulcanized; RMSECV: root mean square error of cross validation; RMSEE: root mean square error of estimation; RPD: ratio of prediction to deviation; TS: toluene swell.
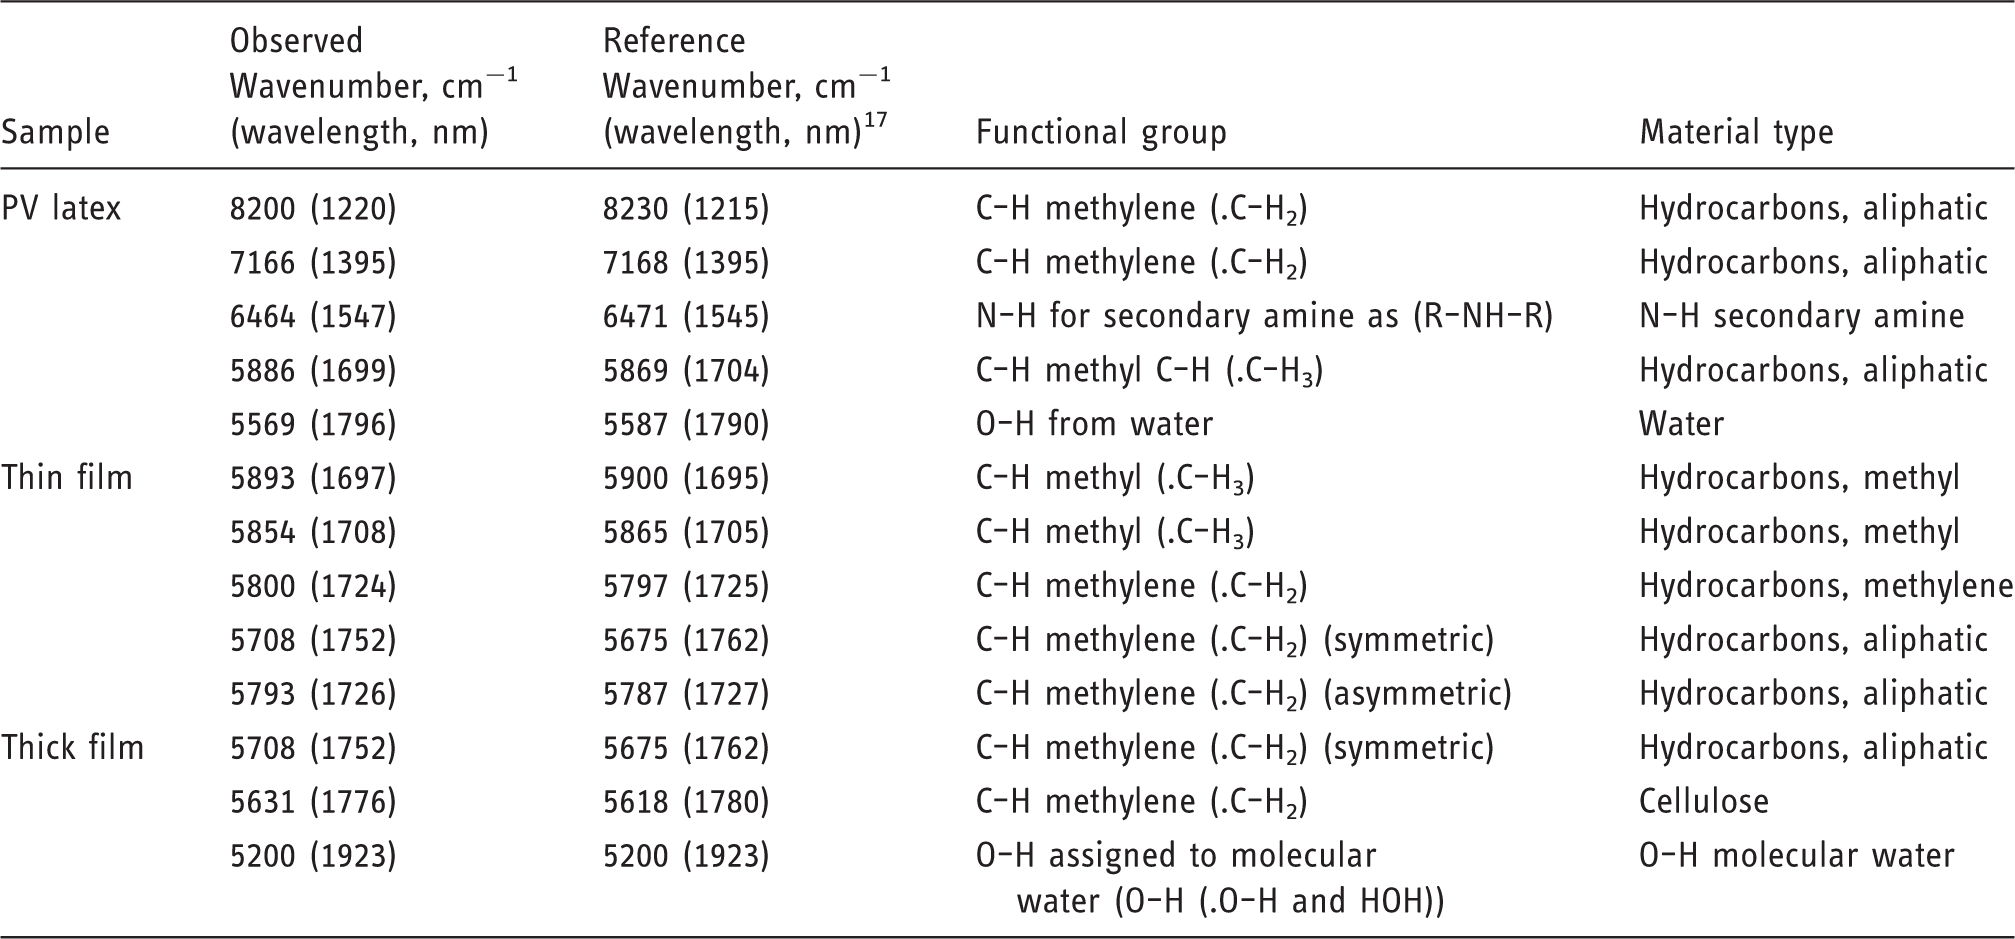
The pretreated spectra, regression coefficient plot and X-loading weight plots of PV latex, thin film and thick film were demonstrated in Figure 4(a) to (c), respectively. If their values were high at any wavenumber, it meant that the vibration band at that wavenumber gave strong influences to the model prediction. Table 4 lists the high absorption bands obtained from the pretreated NIR spectra referenced to established data from Workman and Weyer.
17
An aliphatic compound is an organic compound containing carbon and hydrogen joined together in straight chains, branched chains or non-aromatic rings. The isoprene units of natural rubber were linked together in a straight chain as cis-1,4 polyisoprene which consists of functional groups of methyl, CH3 and methylene, CH2. Cellulose could be present naturally or might derive from some of the sugars. Secondary amine might refer to the accelerators added in the compound. Water bands were apparent at around 5587 cm−1 (1790 nm) and 5230 cm−1 (1923 nm) for PV latex, almost nil in the thin film and some in the thick film, possibly due to absorption of atmospheric moisture because the thick film used a coagulant (CaCl2) which is a deliquescent substance. It was confirmed that the PV latex model and thick film model used the water band in the modelling.
(a) First derivative +straight line subtraction spectra, regression coefficient and X-loading of TS of PV natural rubber latex; (b) Min–Max normalization spectra, regression coefficient and X-loading of TS of thin film; (c) second derivative spectra, regression coefficient and X-loading of TS of thick film. High absorption bands obtained from the pretreated NIR spectra comparing against the established data from Workman and Weyer.
17
NIR: near infrared; PV: prevulcanized.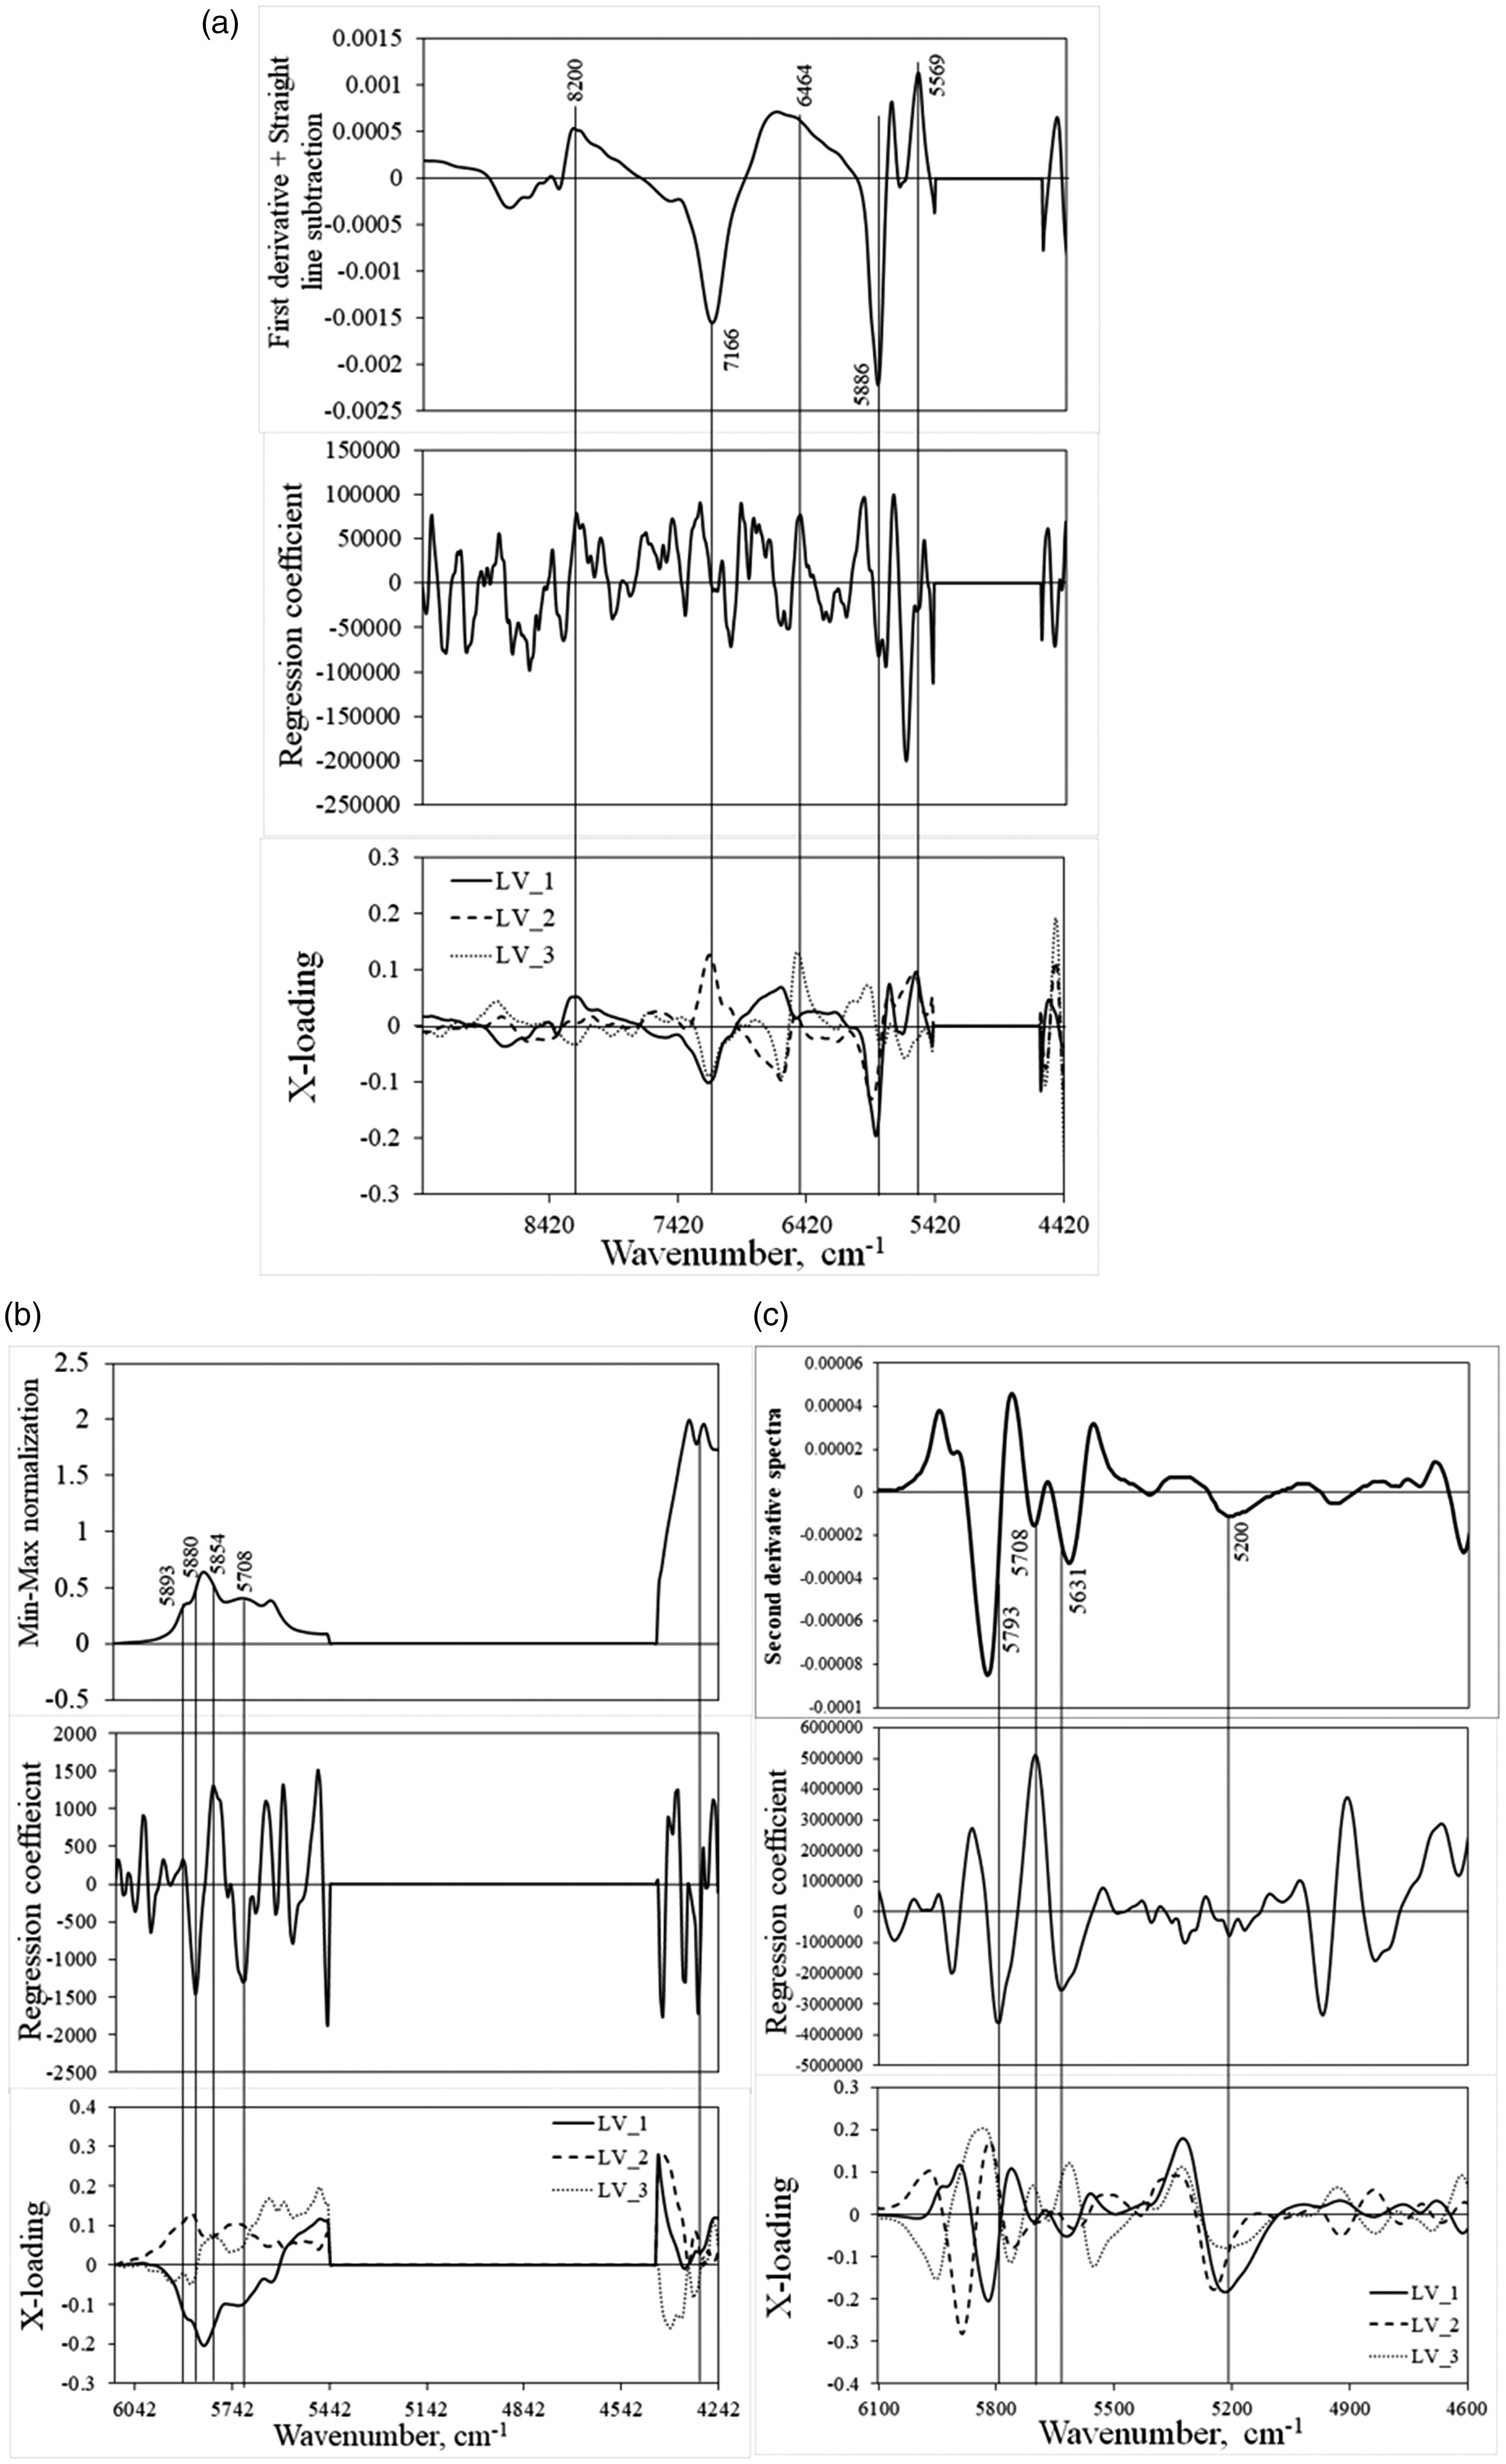
Results of the prediction of TS by using unknown samples of PV latex model, thin model and thick film models.
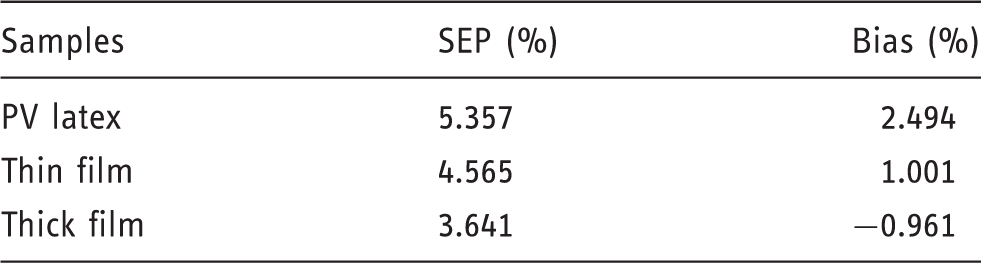
PV: prevulcanized; SEP: standard error of prediction; TS: toluene swell.
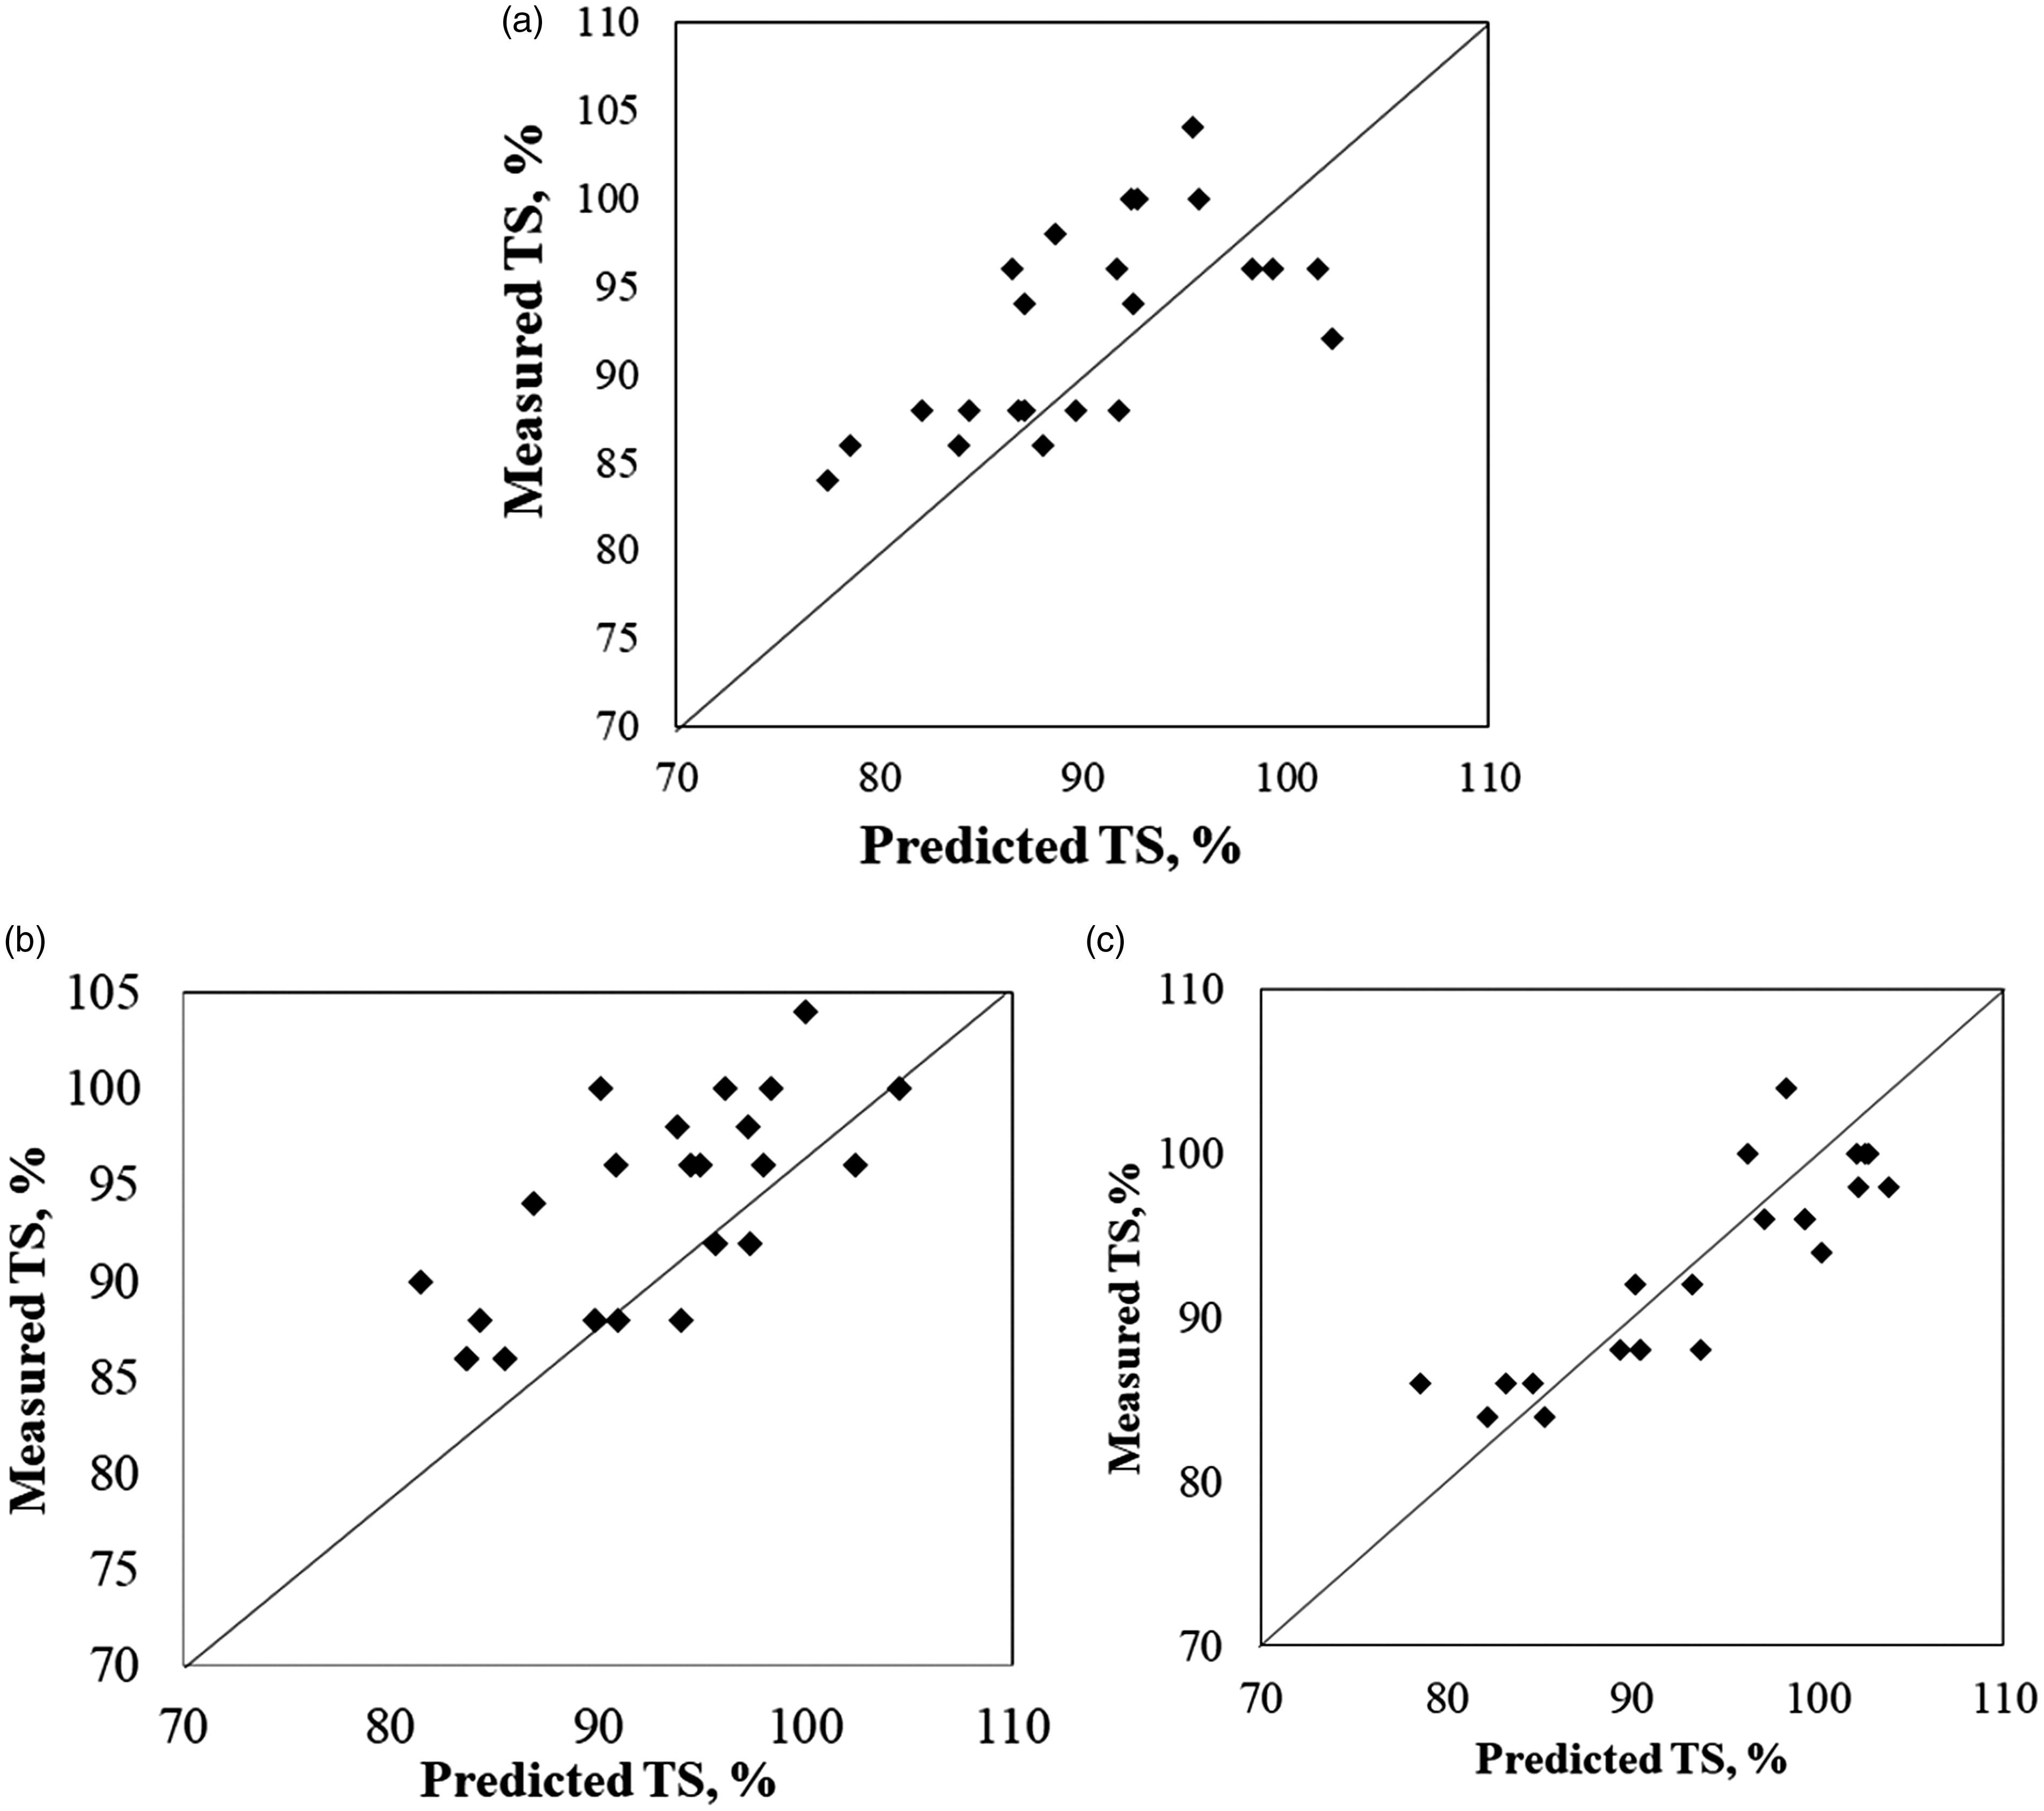
Scatter plot between measured and predicted values of unknown sample of evaluated TS for (a) PV latex, (b) thin film and (c) thick film. TS: toluene swell.
It can be seen that the PLS model for thick film gave the best performance for determining the TS, and not so good for thin film model and worst for PV latex model. The thick films have a longer effective path length than the thin films and therefore have stronger absorbance due to increased interaction between the radiation and the rubber matrix, leading to greater accuracy of the calibration.
Rubber particles are made up of mainly hydrocarbon, phospholipids and protein. On hydrolysis of phospholipids, phosphate is produced naturally. Also during the production of latex concentrate, additional phosphate is added to the field latex in the form of diammonium hydrogen phosphate to precipitate out the excess magnesium in the latex as sludge. Certain antigenic proteins in the latex can cause severe allergic reaction to some users of natural rubber latex products like gloves and as such a high level of protein in latex is undesirable.
Natural rubber molecules are made up of very large number of repeated isoprene (C5H8) units and the isoprene units were essential for the crosslink formation with sulphur in the process of vulcanization which linked up the isoprene units. Hence the occurrence of crosslink densities depended on the absorbance bands of CH3 and CH2 which are the functional groups of rubber. As NIR was unable to detect C–S bonds, which were the crosslinks between the isoprene units, then the C–H bonds were used to indicate the presence of cross links as latent relationship with C–S bonds in NIR spectroscopy.
Conclusions
The density of crosslink is an indication of the degree of cure and hence the properties of the latex products. TS, based on the Flory–Rehner equation, is the standard method used in the rubber industry requiring skilled analysts and the use of toluene which is objectionable because of its toxicity effects. The procedure is quite time consuming and involves subjective determinations which may vary with each analyst.
The linear equilibrium swelling value of a latex film in a solvent such as toluene provides an accurate measure of the crosslink density but this is a slow test, since some hours are required for the film to dry and then reach equilibrium in the solvent.
The majority of crosslinks occurred within the first week of preparation of the PV latices. From weeks 2 to 4, the crosslinking rate slowed and eventually plateaued from weeks 5 to 8. HM samples had the most crosslinks followed by MM with the least crosslinks being present in the LM grade. NIR calibrations developed for measuring the crosslink density of PV latex and latex films showed it was suitable for screening. Calibration models validated with an independent test set gave the best performance for the thick film model. The bond vibration of CH3, CH2, cellulose, phosphate, proteins and water were significant absorbances in the loading.
The rapidity of testing (<5 min/sample) by NIR would allow a factory to increase the frequency of monitoring the process resulting in improvement of the quality of products being manufactured. This technique would be useful for industrial purposes and is currently being evaluated for routine analysis in the PV latex compounding factory.
Footnotes
Acknowledgements
The authors gratefully acknowledge the latex samples support of Thai Rubber Latex Corporation (Thailand) Public Company Limited throughout this research. Their gratitude goes to the staff of the R&D laboratory for the assistance in preparing the prevulcanized latex samples. They also wish to thank NIRS Research Center for Agricultural Product and Food (![]() ), KMITL for providing the NIR spectrometers used in this research.
), KMITL for providing the NIR spectrometers used in this research.
Declaration of conflicting interests
The author(s) declared no potential conflicts of interest with respect to the research, authorship, and/or publication of this article.
Funding
The author(s) disclosed receipt of the following financial support for the research, authorship, and/or publication of this article: The authors are particularly indebted to Thailand Research Fund for the financial support (Grant number RDG5950011) without which this research would not have been possible.