
Abstract
In the process of fermenting rice vinegar, the concentration of acetic acid and ethanol concentration must be measured for monitoring of the total concentration. Near infrared spectroscopy has been used to rapidly monitor the concentration of acetic acid and ethanol concentration daily during 10 cycles of the fermentation process. The model was developed using partial least squares regression. For predicting concentration of acetic acid with near infrared spectroscopy, the coefficient of determination (R2), root mean square error of calibration, root mean square error of cross validation, ratio of standard error of validation to standard deviation, and bias was 0.96, 2.30 g L−1, 2.44 g L−1, 1.11 g L−1, and 5.56, respectively. For ethanol concentration, the value of R2, root mean square error of calibration, root mean square error of cross validation, bias and ratio of prediction to deviation were predicted to be 0.94, 3.15 g L−1, 2.73 g L−1, −0.40 g L−1, and 4.04, respectively. However, both models provided fair performance when tested with an external set of samples, indicating that the models could be applied for rough screening.
Keywords
Introduction
Vinegar, a popular flavor enhancer and condiment, can be produced from the fermentation of various sources such as rice, corn, fruit, or sugar using microorganisms (or yeasts). The first step of the process yields alcohol, which is later mixed with bacteria to produce the final product of vinegar. The same process occurs in rice vinegar production. The process needs regular monitoring of the acetic acid concentration (AAC) and ethanol concentration (ETC) to optimize the total concentration (TC) needed which is 8.0. Normally, AAC is determined by titration, while ETC is analyzed by Ebulliometer as a standard method. These methods, however, are time-consuming and have limited practicality for use in a continuous processing plant. Therefore, rapid and accurate techniques are required which leads to the potential use of near infrared (NIR) spectroscopy. NIR spectroscopy is also an environmentally friendly method, as no chemicals are needed. Ji-yong et al. reported the rapid detection of total acid content and classified different types of vinegar based on NIR spectroscopy and least-squares support vector machine classification. 1 Ouyang et al. showed the real-time monitoring of process parameters in rice wine fermentation by a portable spectral analytical system combined with multivariate analysis. 2 Liu et al. reported the comparison of calibrations for the determination of the soluble solids content and the pH of rice vinegars using visible and short-wave NIR spectroscopy. 3 Sáiz-Abajo et al. reported the prediction of organic acids and other quality parameters of wine vinegar by NIR spectroscopy, 4 while Yano et al. reported the prediction of the concentrations of ethanol and acetic acid in the culture broth of a rice vinegar fermentation using a monochromator NIR system accompanied with multiple linear regression (MLR). 5 Although literature exists on the prediction of acetic acid and ETC of a rice vinegar fermentation using NIR spectroscopy by MLR, no information is available on the daily monitoring of acetic acid and ETC of rice vinegar fermentation using NIR spectroscopy by partial least squares (PLS) regression. The PLS regression calibrations should provide better prediction performance because all spectral wavelengths would be used for determination and would allow for less multicollinearity among the latent variables. The aim of this study was to develop PLS regression calibrations using Fourier-transform (FT) NIR spectroscopy for the daily monitoring of acetic acid and ETC in the internal Venturi injector bioreactor of rice vinegar. Models were developed through 10 cycles of the fermentation process in this experiment. The off-line protocol developed could save time to measure acetic acid and ETC and reduce sample loss.
Materials and methods
Sample preparation and fermentation
Rice vinegar was prepared from sticky rice in the Laboratory of Fermentation Technology, Faculty of Agro-Industry, King Mongkut’s Institute of Technology Ladkrabang (KMITL), Bangkok, Thailand, and used as the raw material for acetification in the internal Venturi injector bioreactor. 6 The inoculums preparation was as followed 6 : The high-acid tolerant strain of Acetobacter aceti WK was used in this study. The acetic acid bacteria (AAB) starter was cultured under aeration of 4.5 L min−1 for seven days at 30 ± 1℃ in a complex medium (Merck, Darmstadt, Germany) composed of (per liter of water) 50 g glucose, 5 g yeast extract, 0.2 g Mg2SO4.7H2O and 0.5 g (NH4)2HPO4. The ETC and AAC in rice wine were 110 ± 1.5 g L−1 and 2.5 ± 0.4 g L−1 respectively, while AAC in the vinegar was 80 ± 0.8 g L−1. This was standardized by adjusting the ETC and AAC to give a target TC of 35 ± 1 g L−1 ETC and 45 ± 1 g L−1 AAC for a TC of 80 g L−1. Every morning at around 9 a.m., the two samples were collected from two bioreactors. The fermentation was followed for 75 days. It took about 7–10 days for a single fermented rice to vinegar cycle process with a total of 10 cycles of the fermentation being performed.
NIR spectroscopy
Acquisition of NIR spectra was performed using a FT-NIR spectrometer (MPA, Bruker Optics, Ettlingen, Germany). The range used for scanning was between 12,500 and 4000 cm−1 (800–2500 nm) with a resolution of 16 cm−1. Samples were scanned 32 times to obtain one average spectrum. Before every single scanning the samples, a reference material made of gold was scanned for background. Each sample was transferred into a quartz-glass vial of 22.0 mm diameter and 48.0 mm height, as a measurement cell. Then the sample was covered with a transflection plate with standoff gap 0.1 mm made from aluminum which provided a full optical path length of 0.2 mm and scanned. All scanning was conducted in an air-conditioned room at a temperature of 25.0 ± 2.0℃ while maintaining the temperature of sample storage at 0 ± 1℃ to prevent bacteria. This is because bacteria in vinegar can change ethanol to acetic acid very rapidly. The bioreactor was at the Laboratory of Fermentation Technology, Faculty of Agro-Industry, KMITL, and the FT-NIR spectrometer was at the Near Infrared Spectroscopy Research Center for Agricultural Product and Food, Faculty of Engineering, KMITL. It took 10 min to move the sample. For this reason, the sample was kept at 0℃ to stop bacterial growth.
Determination of AAC and ETC
AAC was determined by acid-base titration with 0.1 mol−1 NaOH using phenolphthalein as an indicator. ETC was analyzed by Ebulliometer (Dujardin Salleron, Paris, France). 6
Determination of outlier of the reference data
Before developing the calibration model, potential outliers of in the reference data were identified using the following the Z-score equation (1)

Spectrum preprocessing and NIR spectroscopic modeling
Calibrations for the prediction of acetic acid and ETC in rice vinegar fermented bioreactor were developed by PLS regression using QUANT-2 (Bruker Optics, Ettlingen, Germany). The software provided different spectral data preprocessing techniques including constant offset elimination, straight line subtraction, vector normalization, min–max normalization, multiplicative scattering correction (MSC), first derivative, second derivative, first derivative + straight line subtraction, first derivative + vector normalization, and first derivative + MSC. However, the vector normalization and MSC were selected for calibration because the spectra had effected by the multiple scattered which caused the tilting and baseline shift. The spectra used were either raw spectra or preprocessed spectra using the above-mentioned techniques before making the model. The sample data were run in ascending order and the samples were randomly separated into calibration set and test set by the ratio of 7:3 by the software where 30% of the data were assigned for the validation set and 70% for the calibration set. The data range of the calibration set covered those of the validation set. The model performance was determined by the coefficient of determination (R2), root mean square error of calibration (RMSEC), root mean squared error of prediction (RMSEP), ratio of prediction to deviation (RPD), and bias. The optimum model was then validated using the unknown set of 45 samples by predicting the samples with the models developed and comparing the r2, RMSEP, bias, and RPD.
Results and discussion
Spectrum analysis
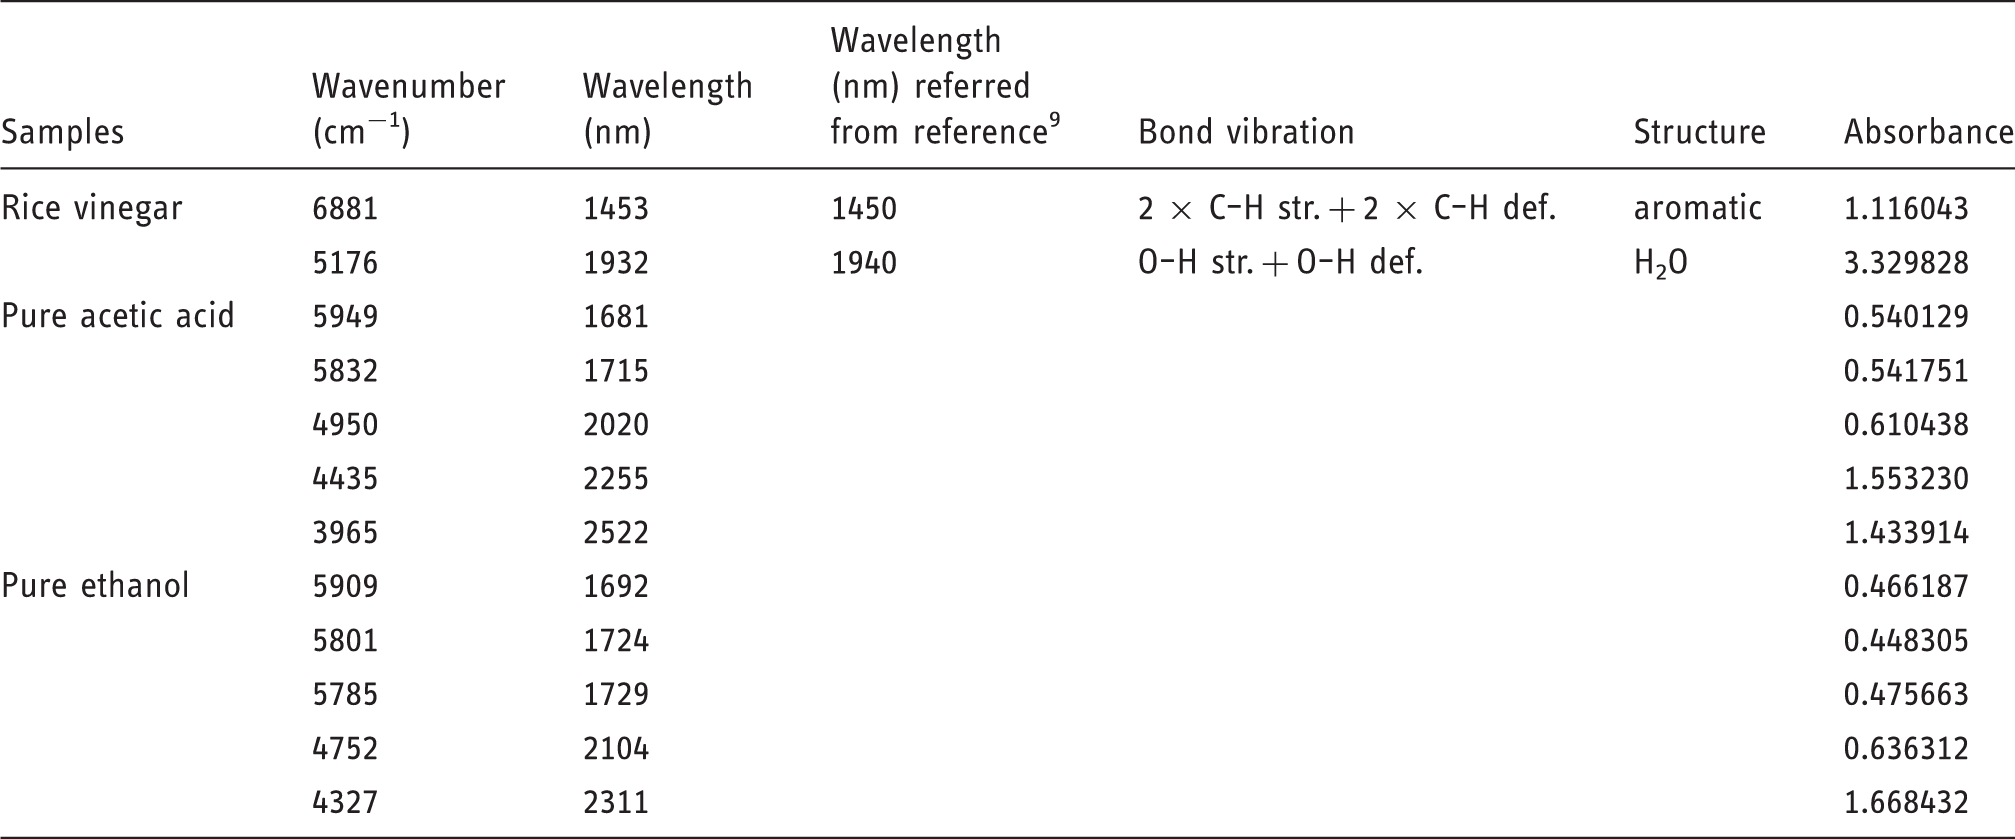
Figure 1 shows the spectra of rice vinegar, 99.85% acetic acid and 99.5% ethanol in the spectral range 12,500–3600 cm−1 (800–2778 nm). Table 1 shows the dominant absorption bands and the corresponding vibration of the spectra. However, some wavenumber ranges could not be used because the spectrum was saturated, particularly in the region of the water absorbance due to the path length being too long. Subsequently, the full range of spectra of samples was subjected for PLS modeling and the saturated regions were not selected by the software for modeling. The absorbance was higher in the 3000–4000 wavenumber region and contained noise. The software did not select the noisy area or the water band of combination vibration.
The average spectra of rice vinegar, 99.85% acetic acid and 99.5% ethanol. The dominant absorption bands and the corresponding vibration of the spectrum of rice vinegar, pure acetic acid and pure ethanol.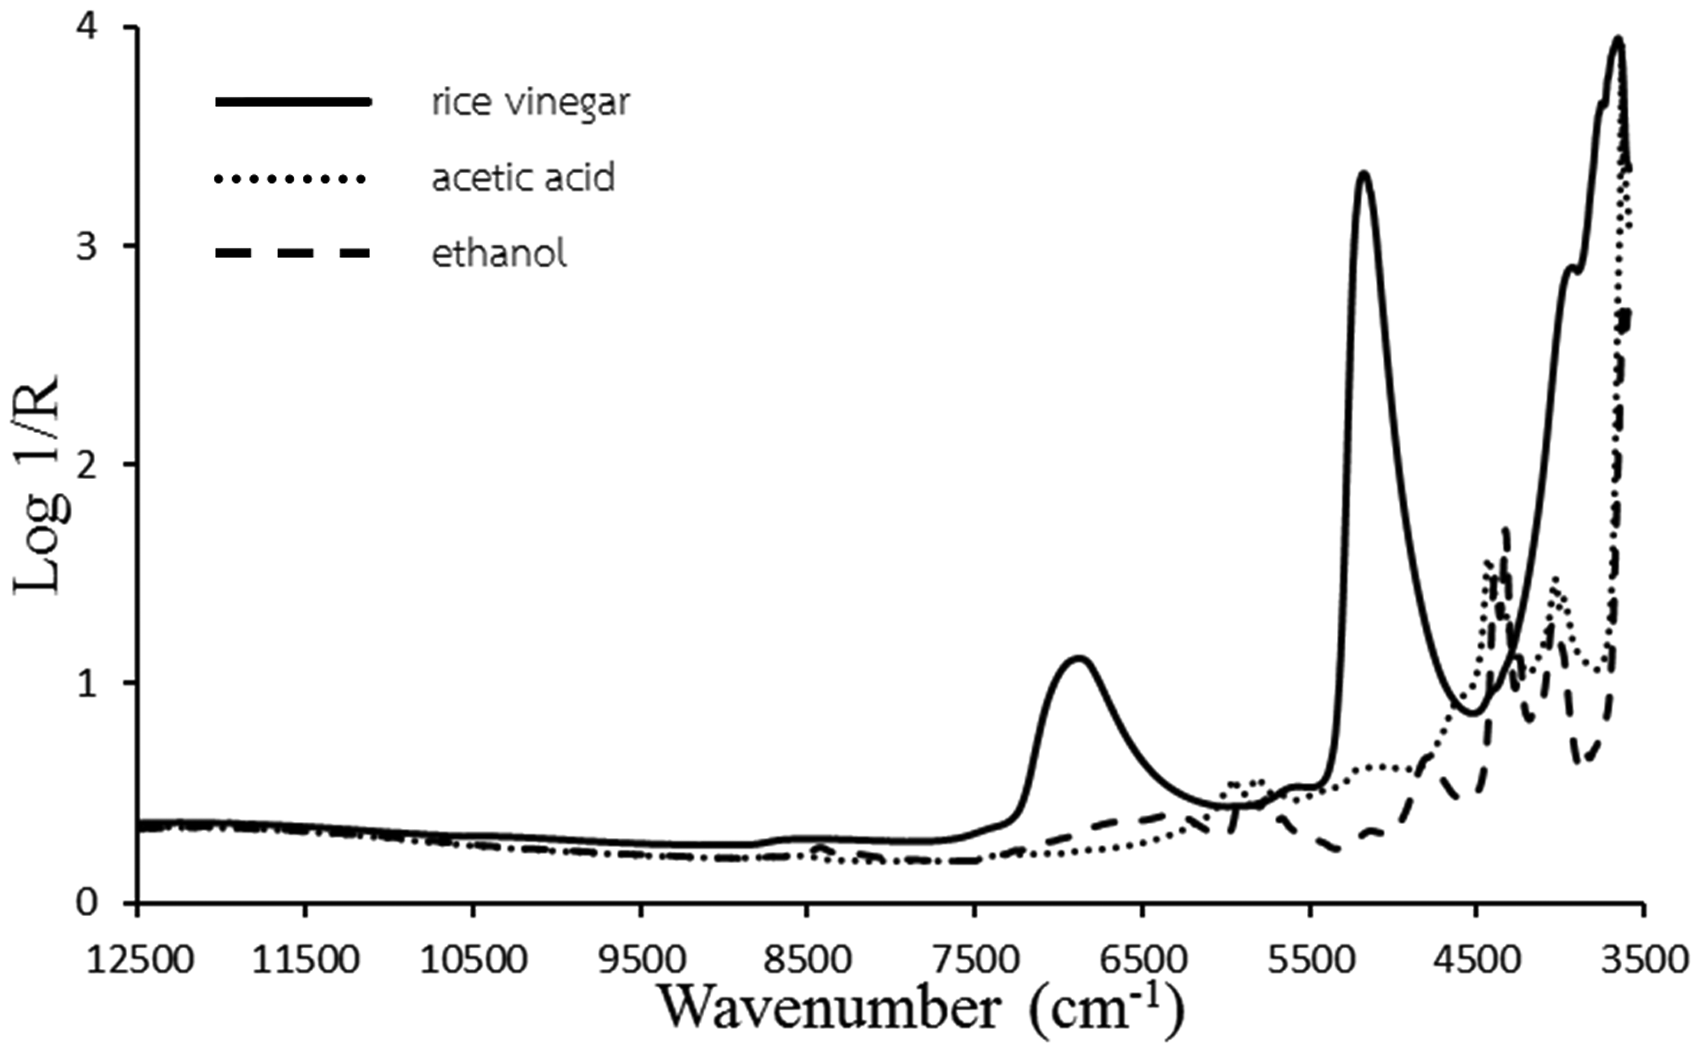
Data of the models
The statistical data of AAC and ETC for PLS regression modeling.
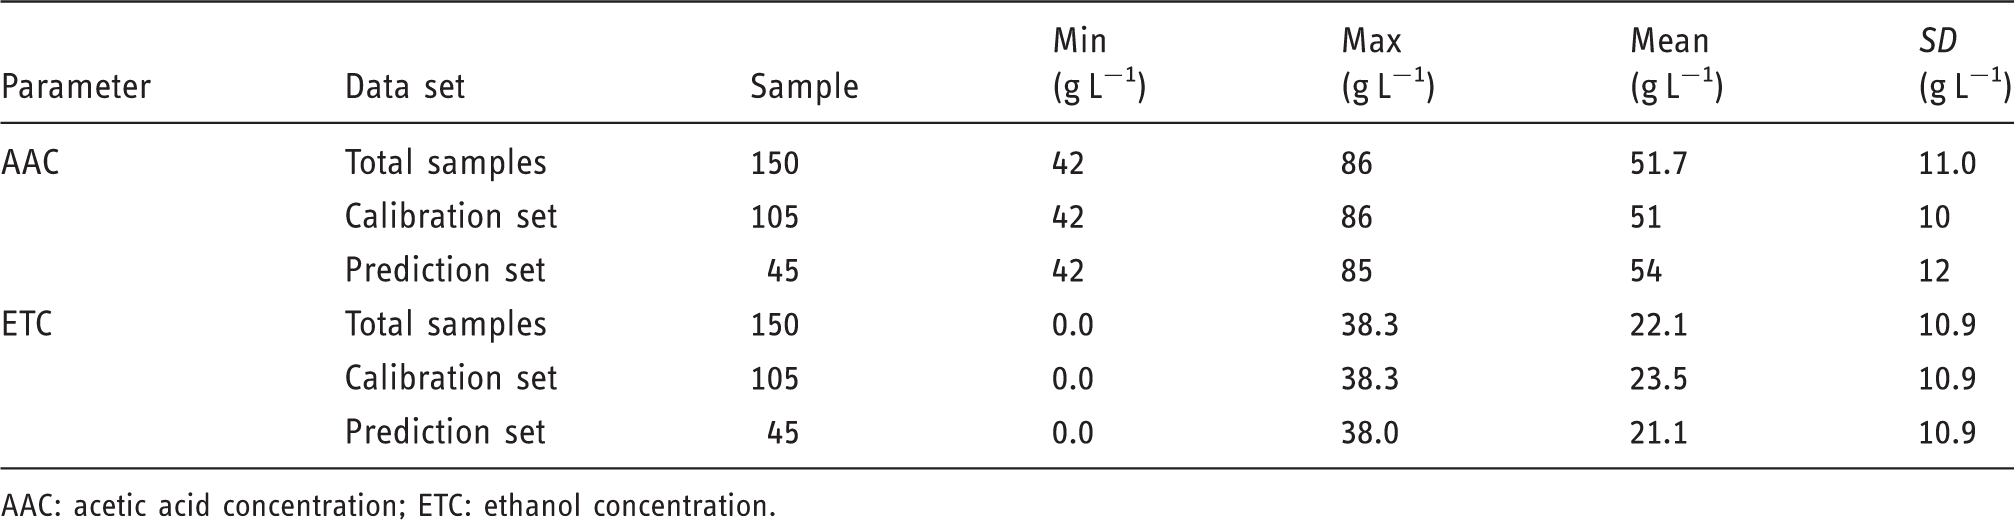
AAC: acetic acid concentration; ETC: ethanol concentration.
Model for AAC
Figure 2 shows preprocessing spectra by MSC of rice vinegar for AAC modeling. Figure 3(a) shows the comparison of AAC predicted values and measured values of the calibration set and the test set. Table 3 shows the PLS analysis of the model for AAC. The model used wavenumber at 9403.8–6094.3 and 4605.4–4242.9 cm−1 with five factors being required. The calibration set had a value of R2 of 0.95 and RMSEC of 2.30 g L−1. The validation set had a value of r2 of 0.96, RMSEP of 2.44 g L−1, bias of 1.11 g L−1 and RPD of 5.6. Williams
8
recommended that r2 values between 0.92 and 0.96 could be used for most applications including quality assurance and process monitoring and that the RPD between 5.0 and 6.4 could be used for good screening.
Multiplicative scattering correction (MSC) preprocessing spectra of one fermented cycle samples of rice vinegar for AAC model. graph of AAC model (a) Scatter plots (b) X-loading weight plot, and (c) the expanded region from 5000 to 4000 cm−1. Result of PLS regression modeling for AAC and ETC. AAC: acetic acid concentration; ETC: ethanol concentration; PLS: partial least squares; RMSECL: root mean square error of calibration; RMSECV: root mean square error of cross validation; RPD: ratio of prediction to deviation.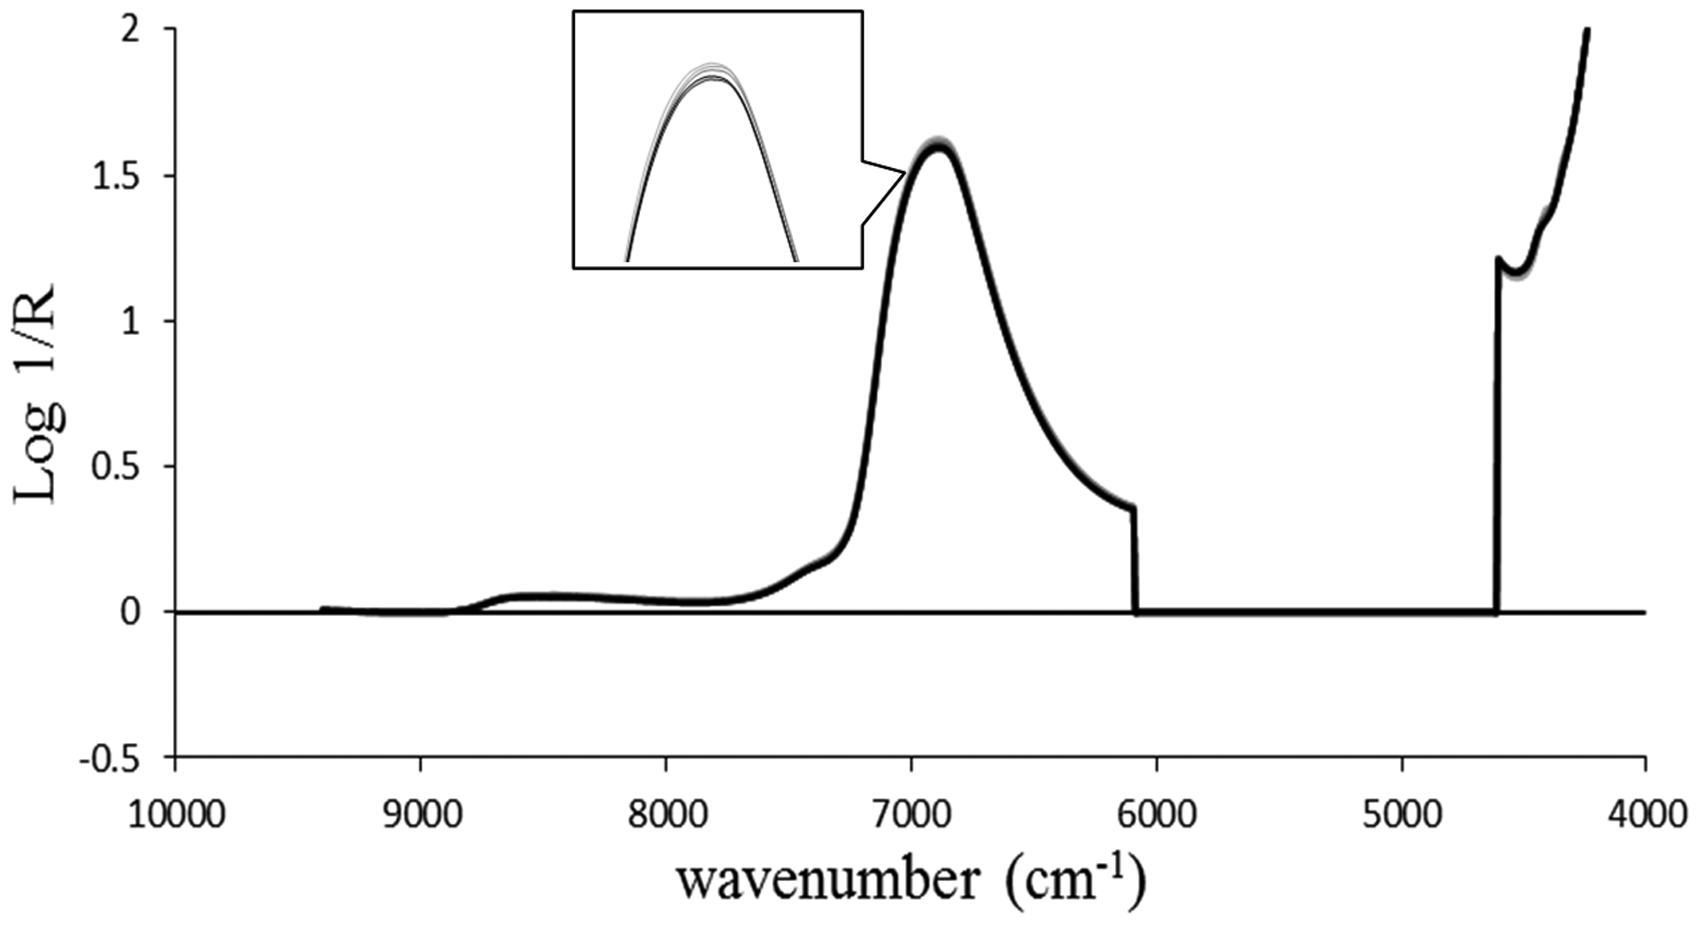
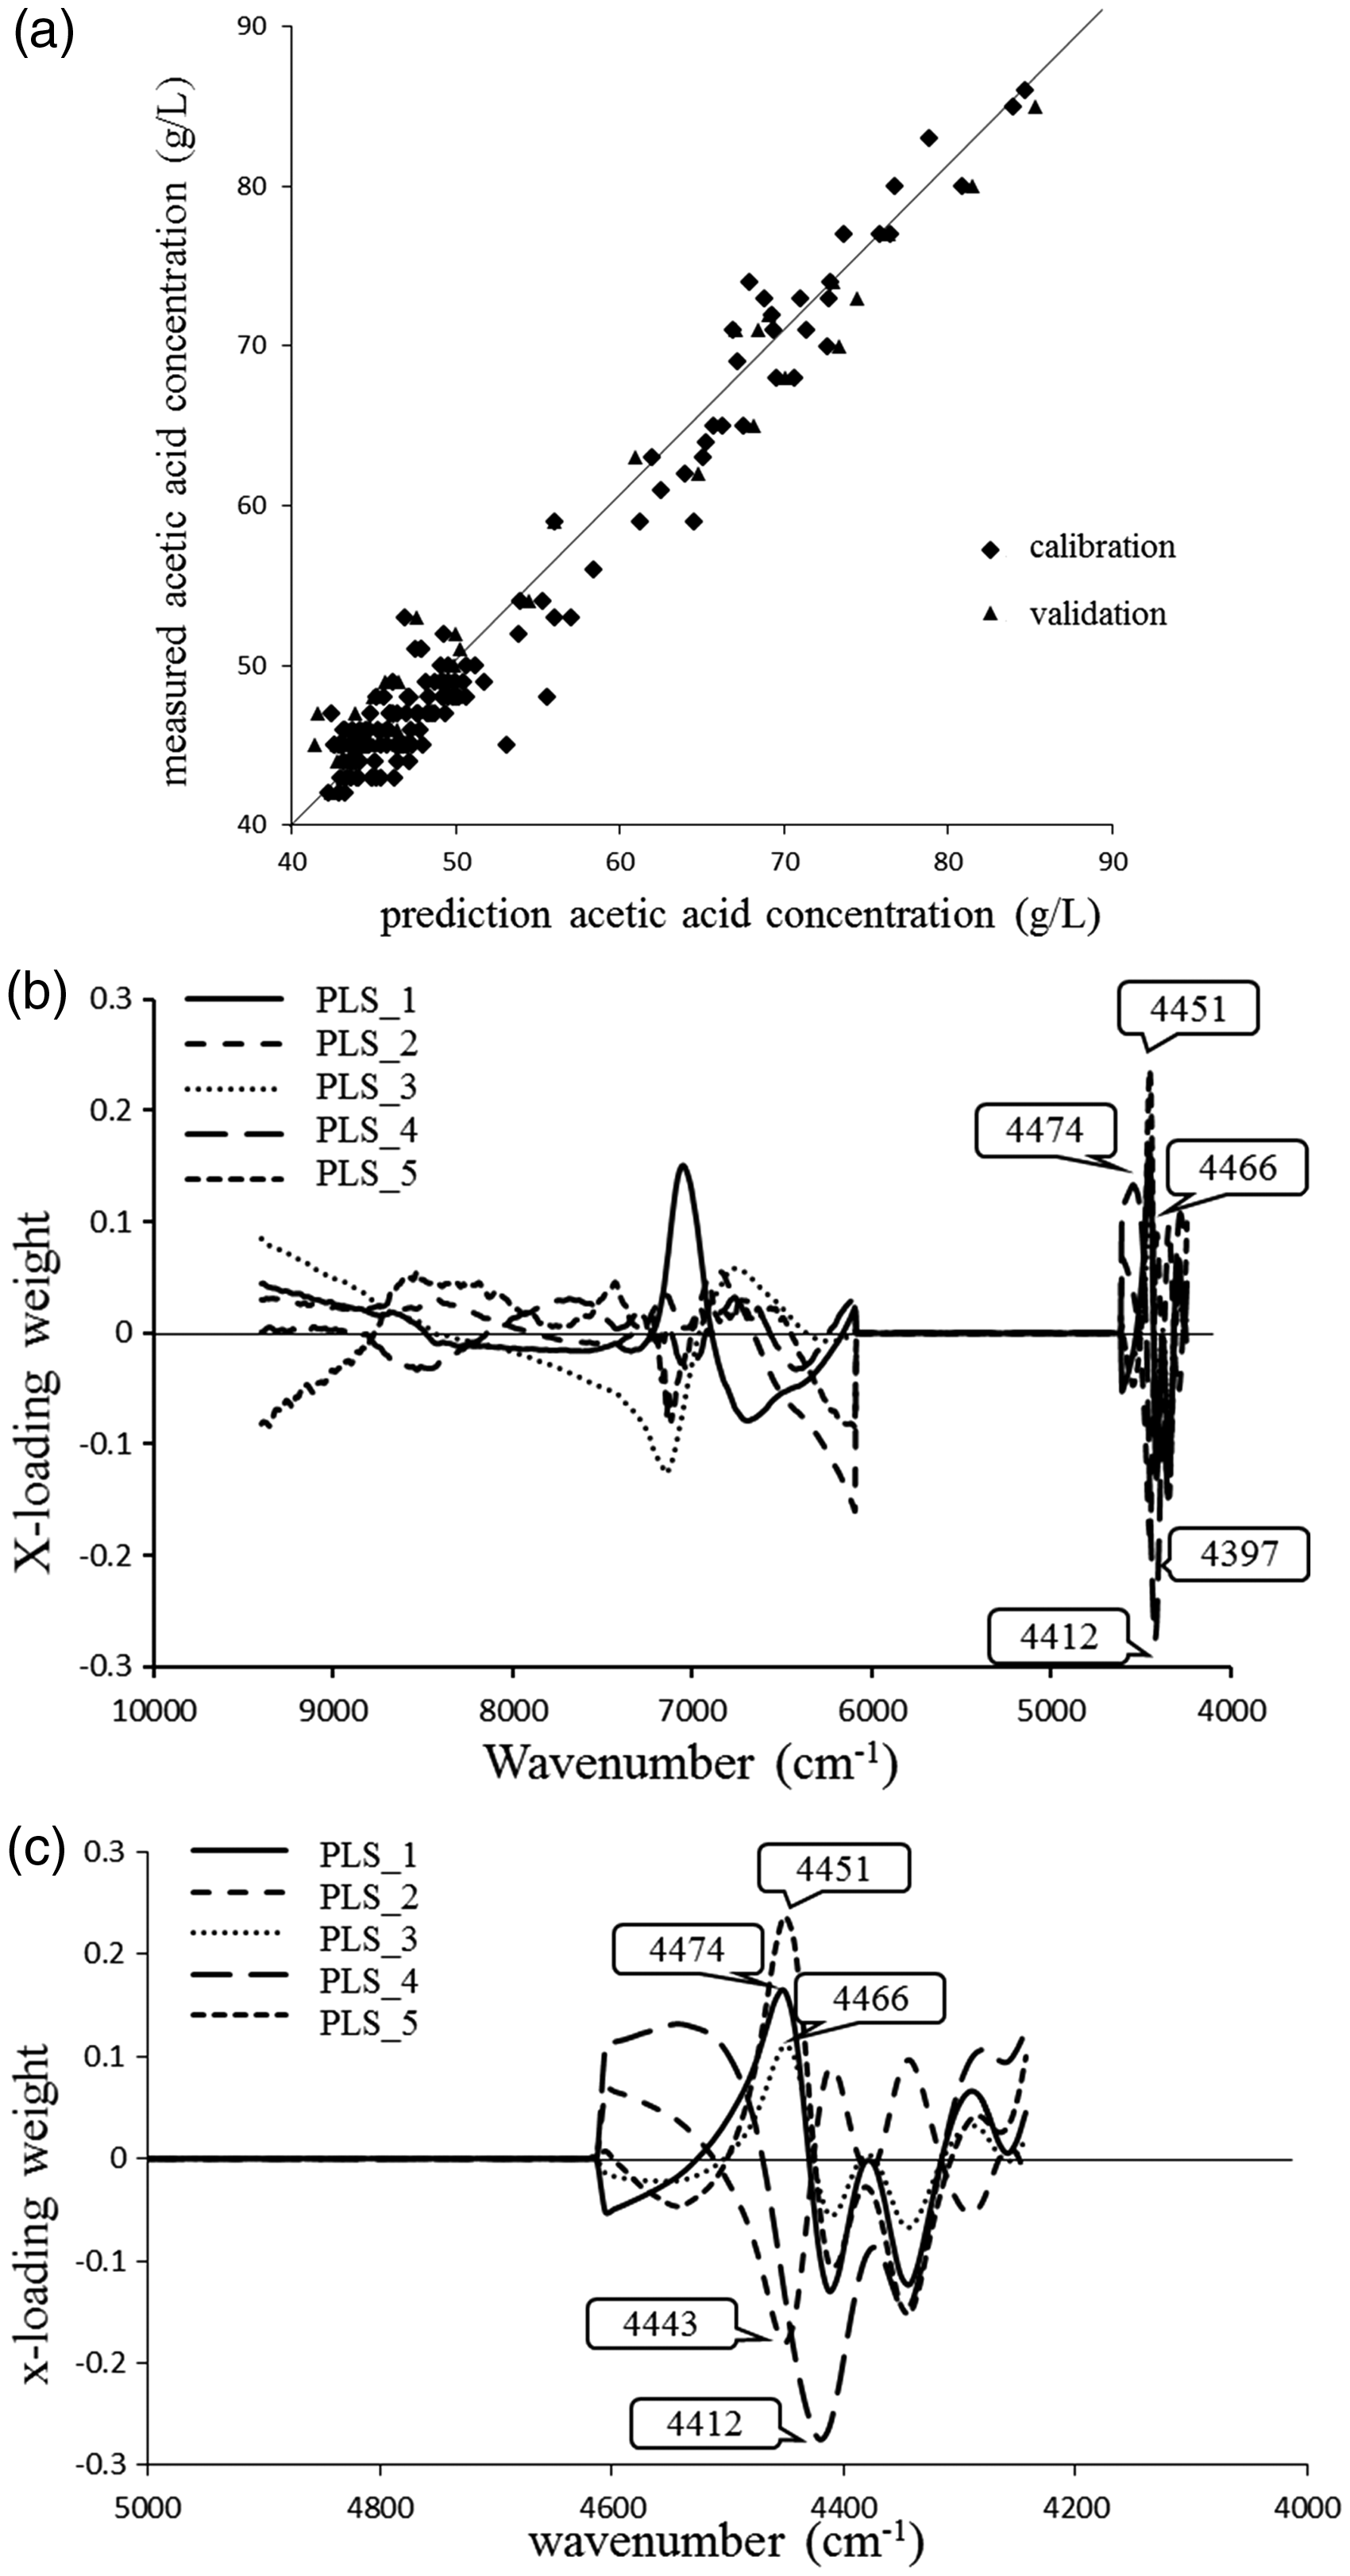
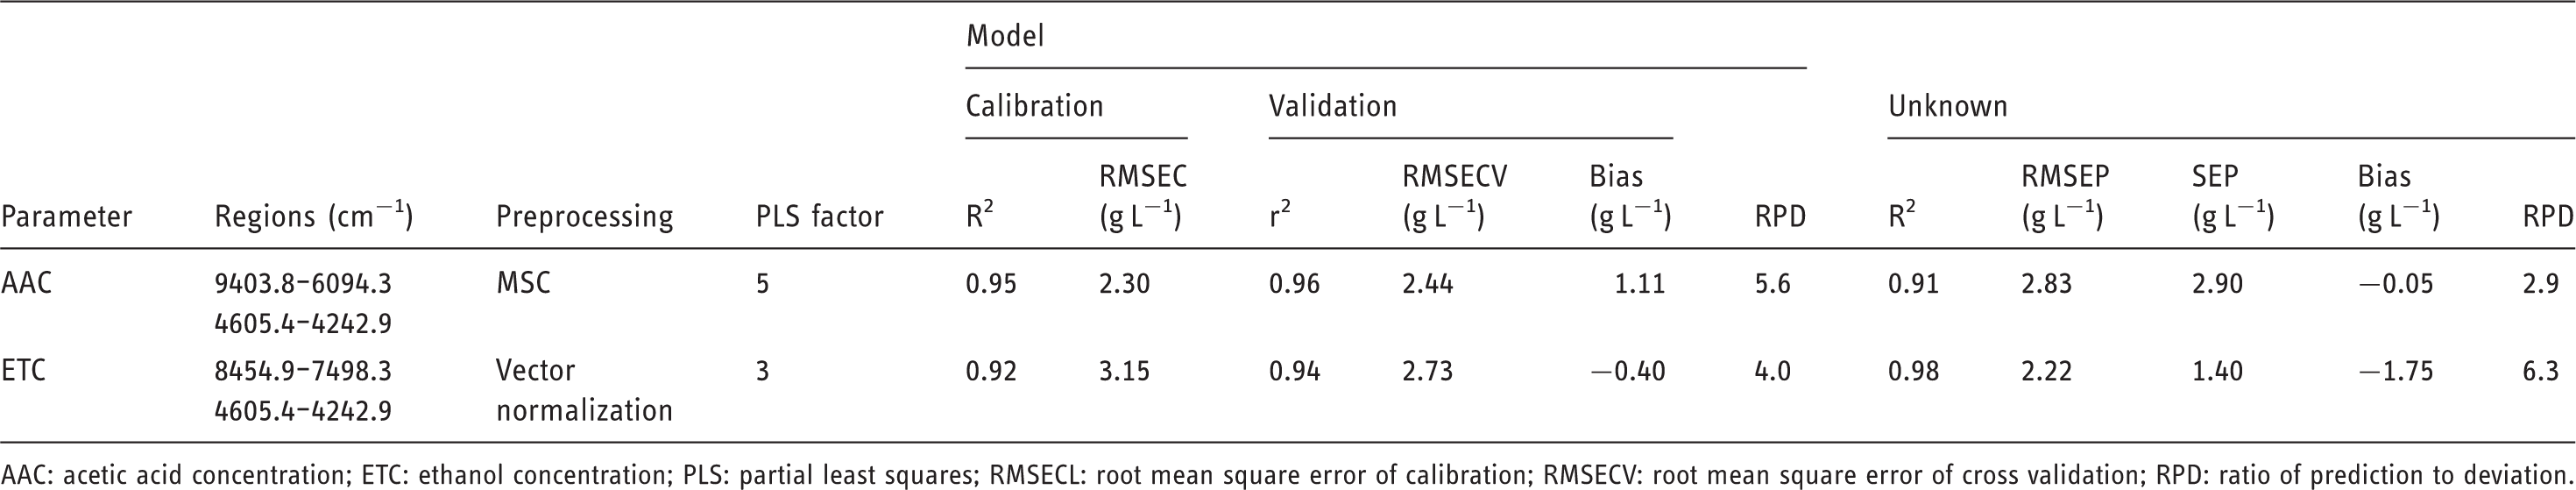
Table 4 shows the absorption bands of regression coefficient spectra and X-loading weight spectra and their bond vibration of the model for AAC. Figure 3(b) and (c) show the X-loading weight plots of first three PLS factors and the expansion of the plots at 5000-4000 cm-1 where the dominant peaks were, respectively.
Model of ETC
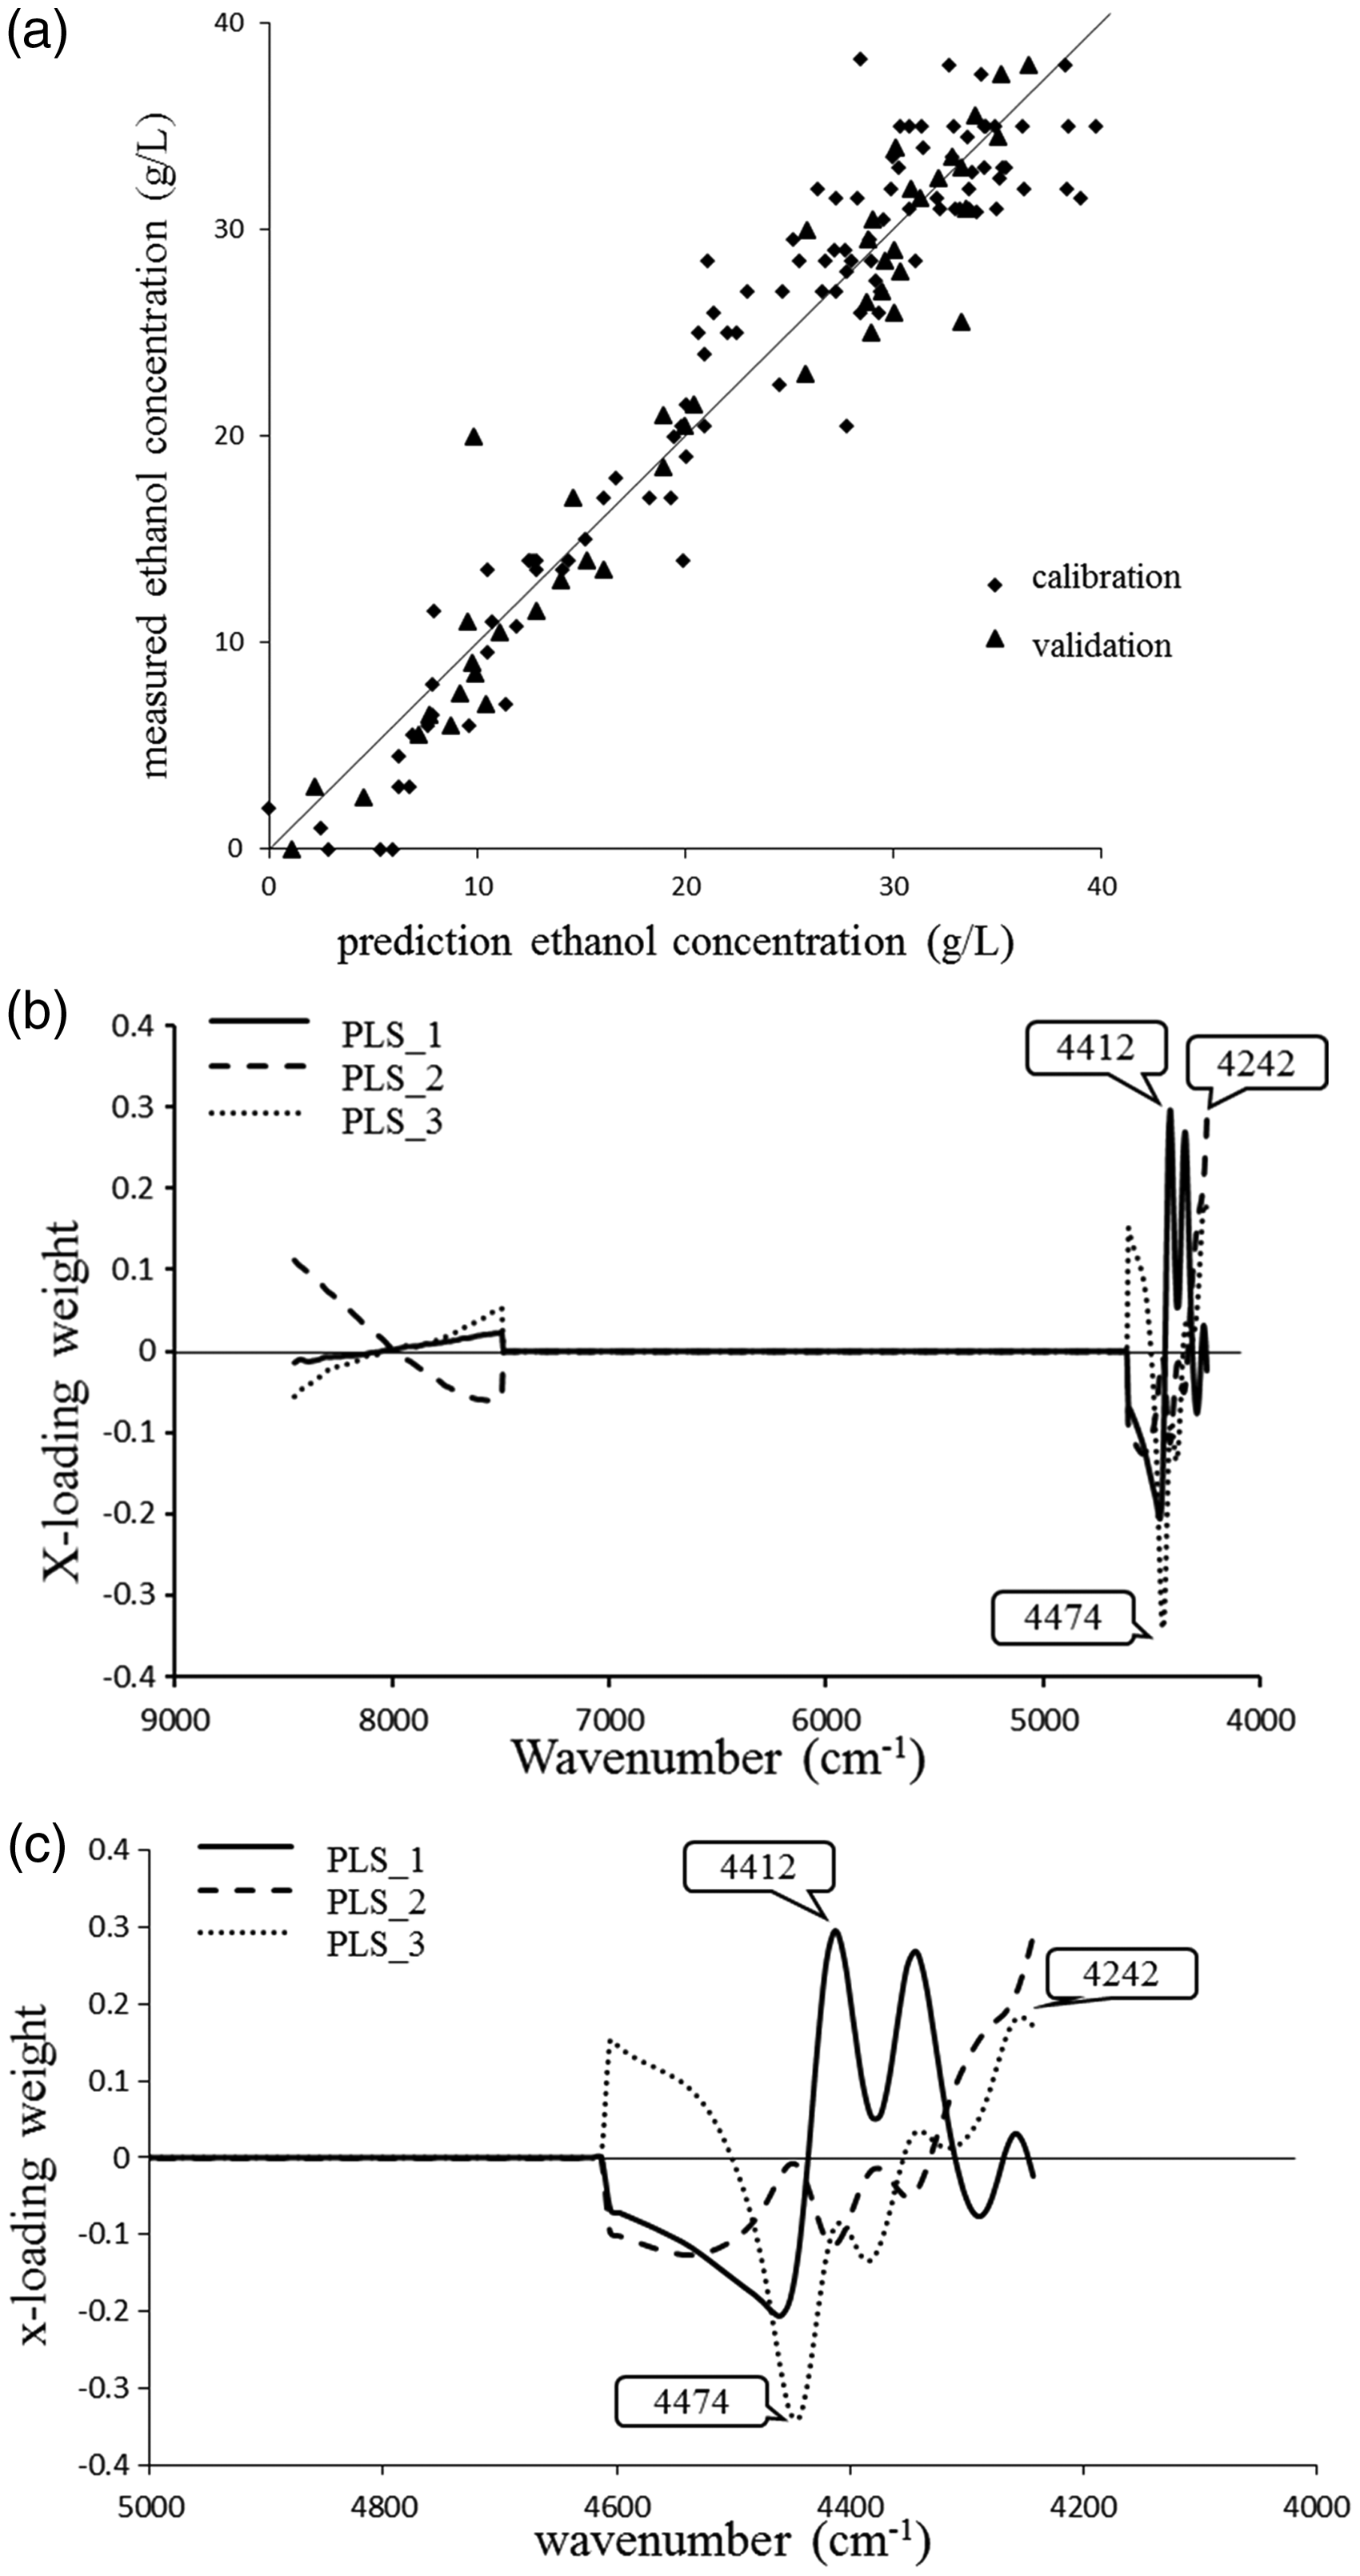
Figure 4 shows the vector normalization preprocessing spectrum of a rice vinegar for ETC modeling. Figure 5(a) shows the comparison of ETC-predicted values and measured values of the calibration set and the test set. Table 3 shows the PLS analysis of the model for ETC. The model used wavenumber at 8454.9–7498.3 and 4605.4–4242.9 cm−1 with three PLS factors. The calibration had a value of R2 of 0.92 and an RMSEC of 3.15 g L−1. The validation model provided r2 of 0.94, RMSEP of 2.73 g L−1, bias of −0.40 g L−1 and RPD was 4.0. Williams
8
recommended that RPD values between 3.1 and 4.9 could be used for screening.
Vector normalization preprocessing spectra of one fermented cycle samples of rice vinegar sample of ETC model. Graph of ETC model (a) Scatter plots, (b) X-loading weight plot, and (c) the expanded region from 5000 to 4000 cm−1.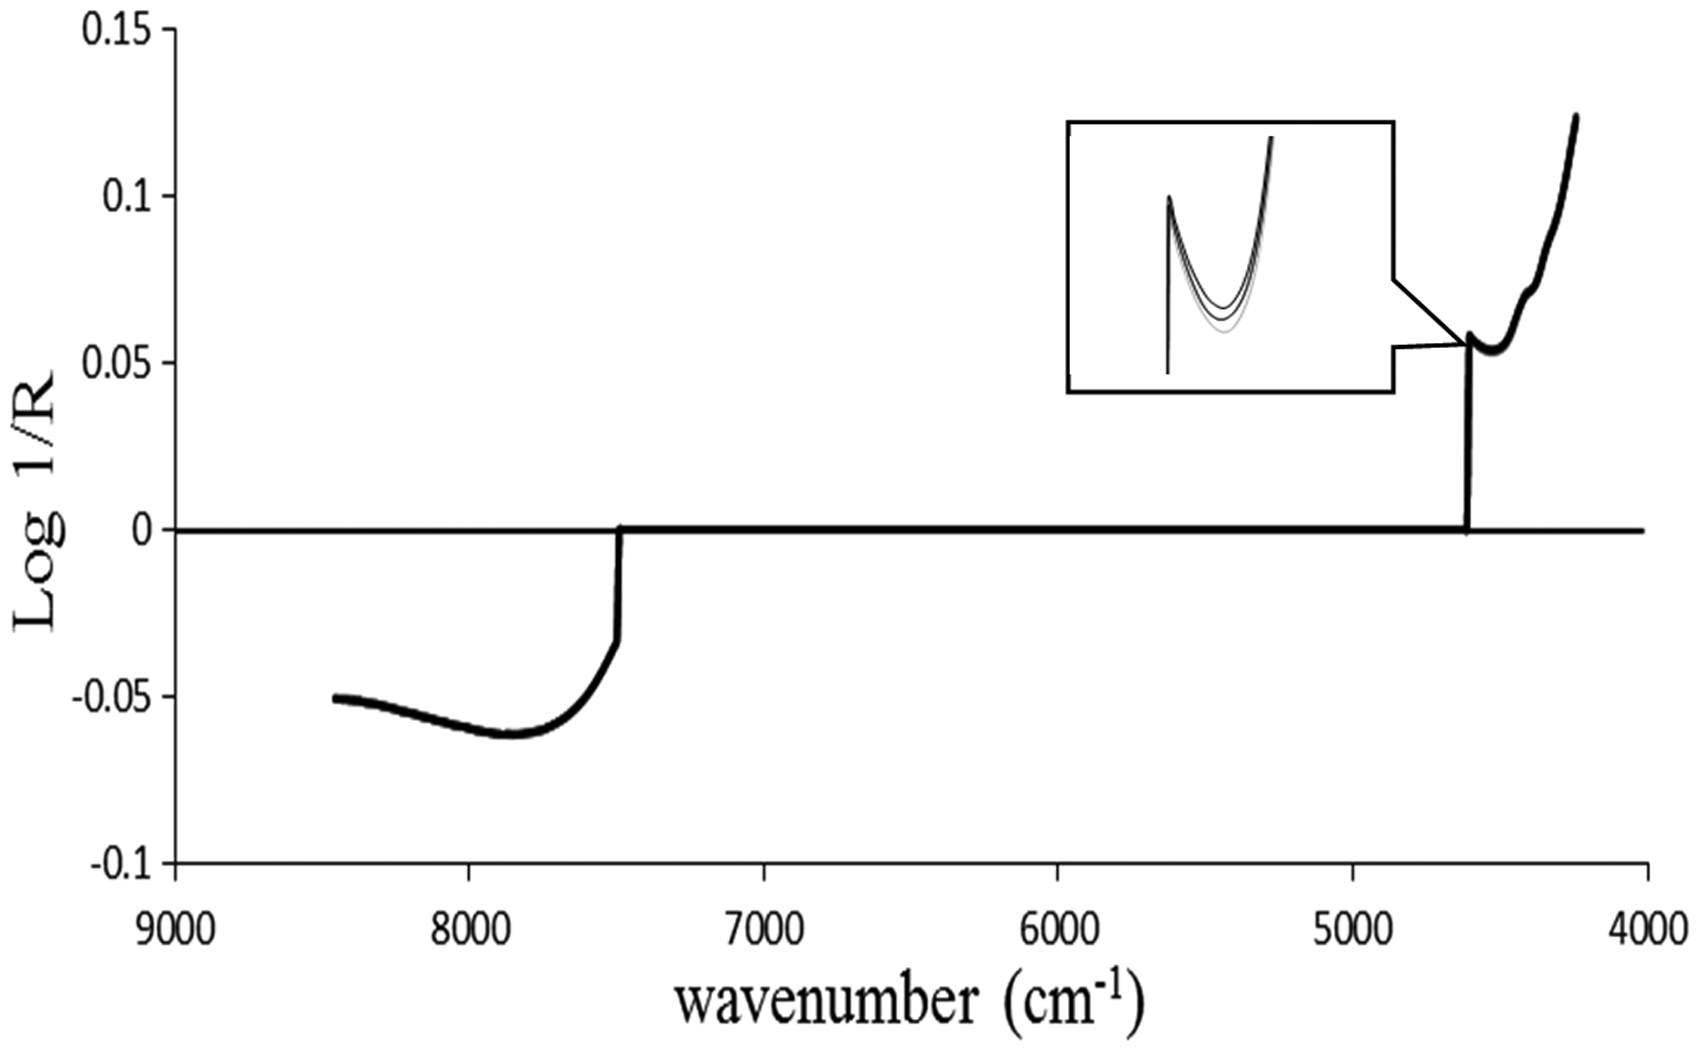
The absorption bands of regression coefficient spectra and X-loading weight spectra and their bond vibration of the model for AAC and ETC.
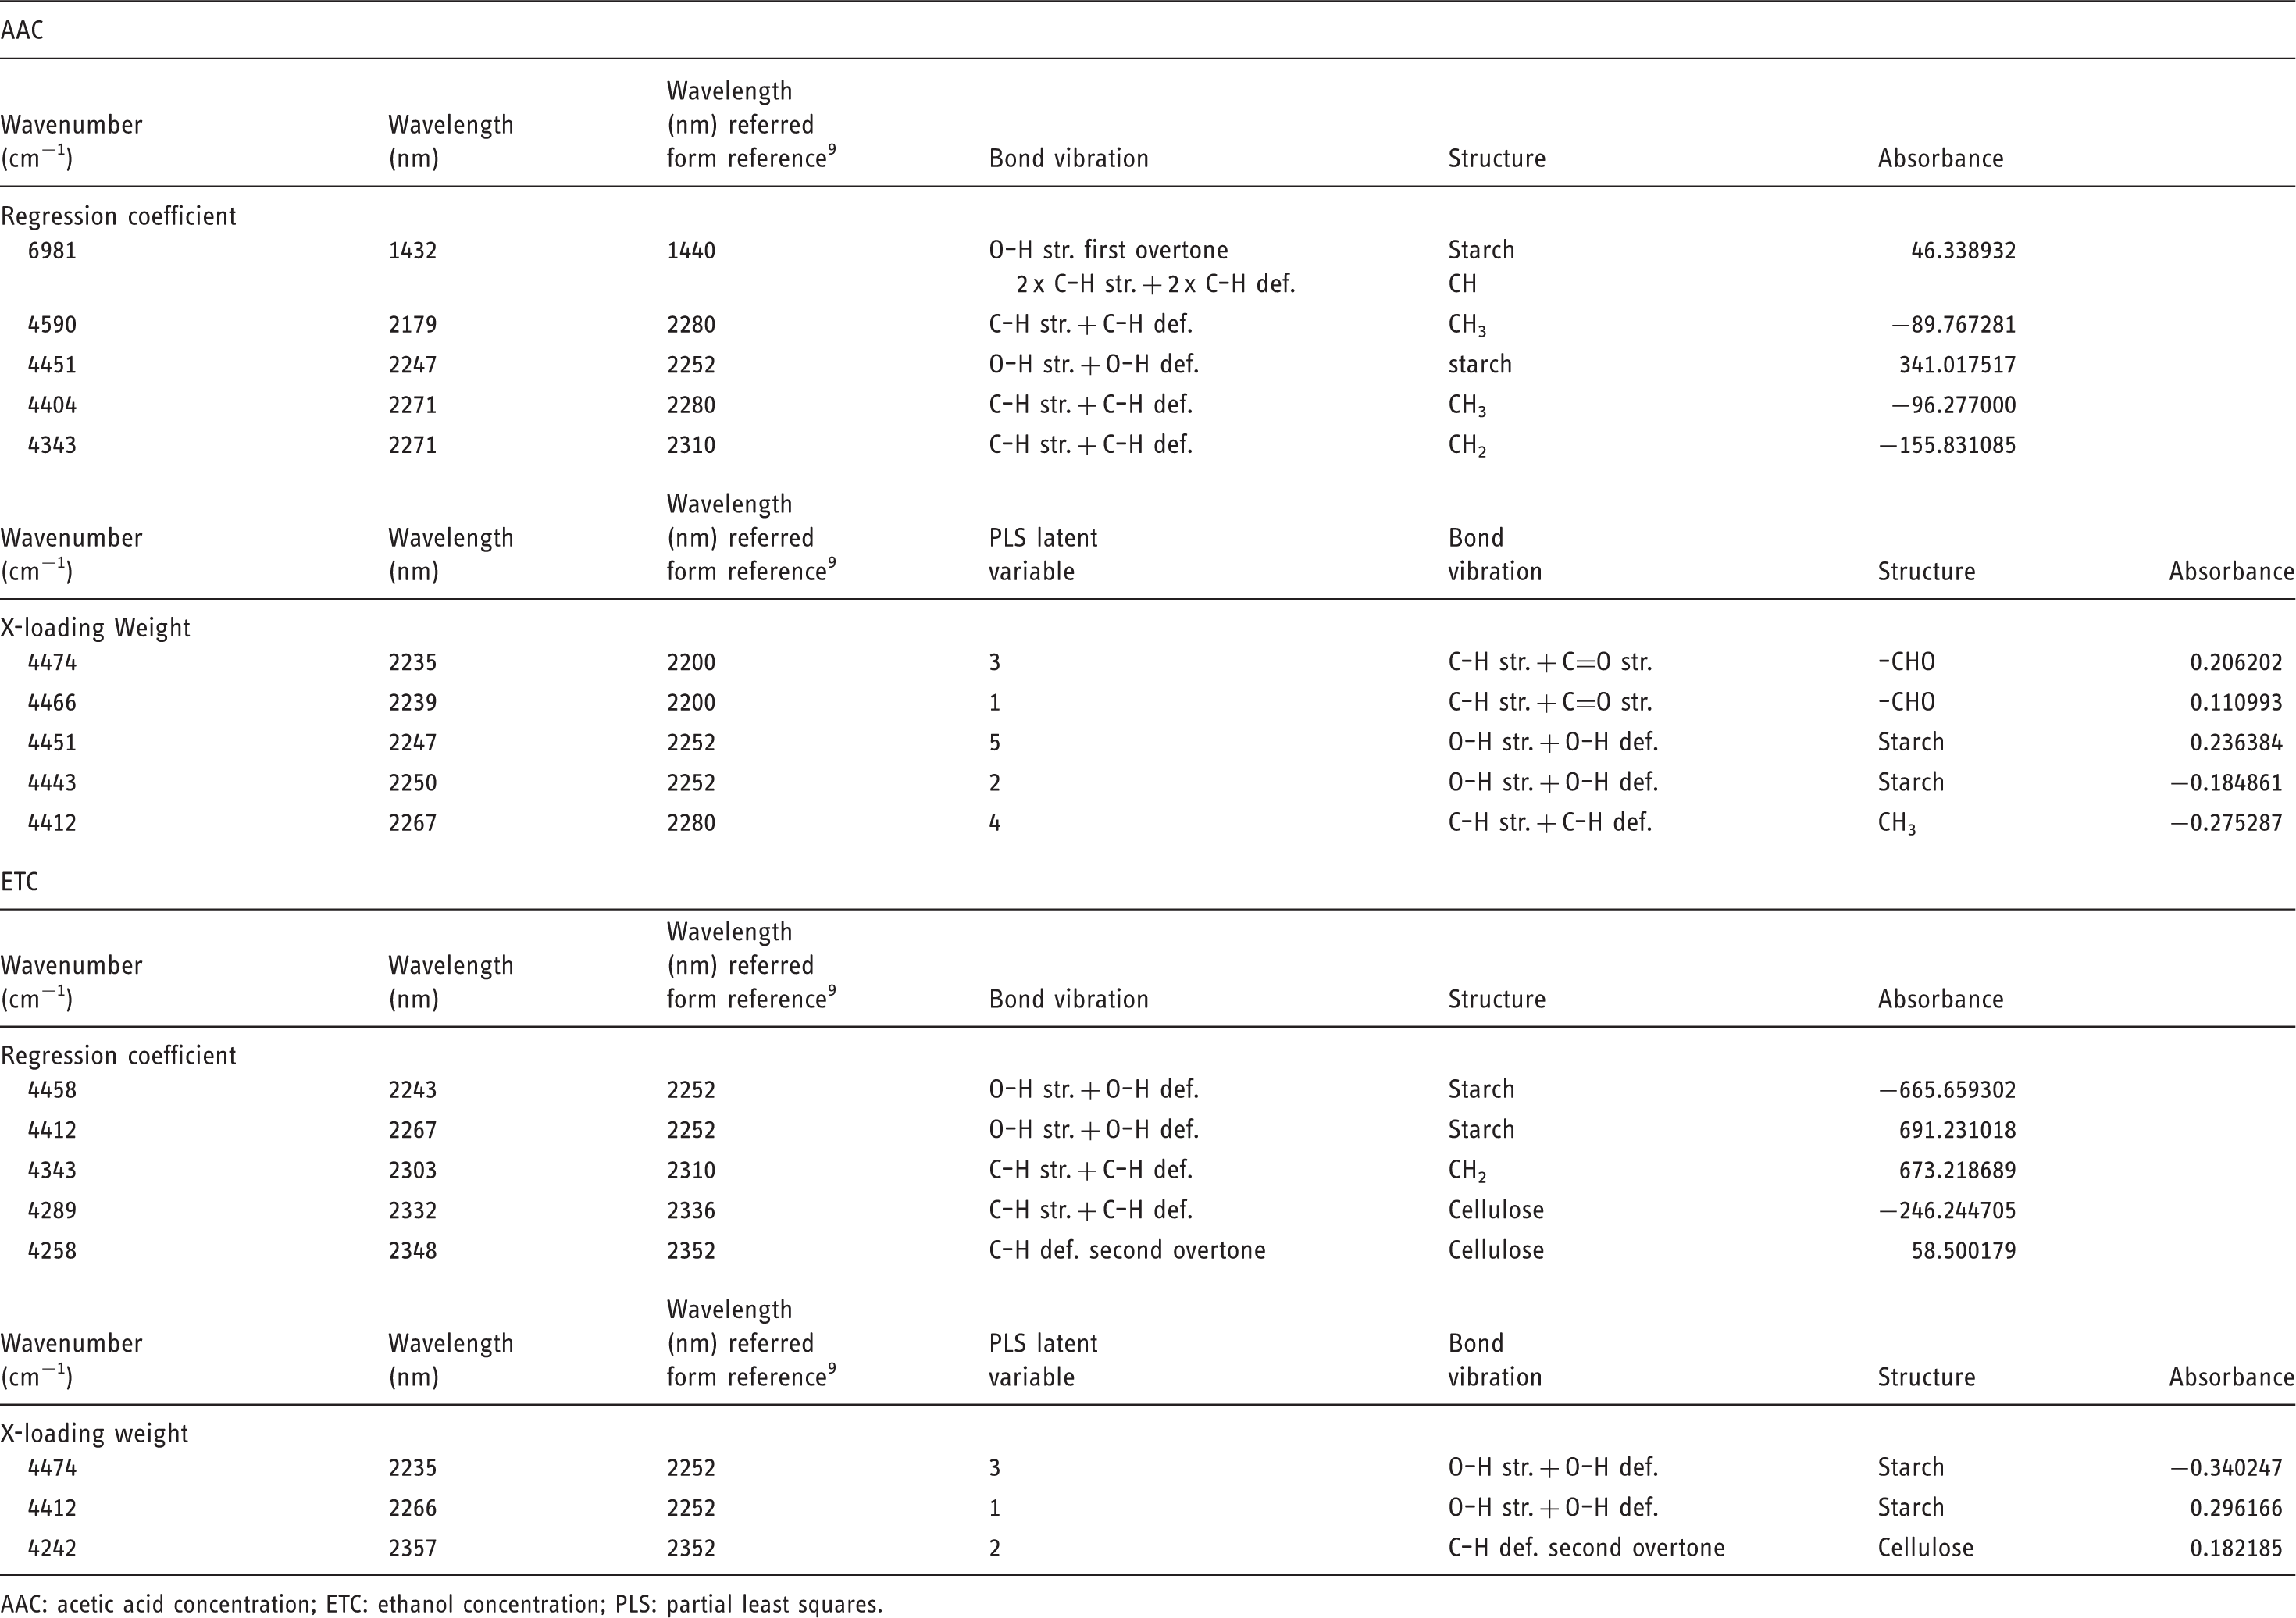
AAC: acetic acid concentration; ETC: ethanol concentration; PLS: partial least squares.
Validation by unknown samples
Figure 6(a) shows the scatter plot of prediction of an unknown by model for AAC and Figure 6(b) by model for ETC. Table 2 shows the PLS regression analysis result of predicted unknown for AAC and ETC. For AAC, the r2 was 0.91, RMSEP was 2.83 g L−1, SEP was 2.90 g L−1, bias was −0.051 g L−1, and RPD was 2.9. For the model of ETC, r2 was 0.98, RMSEP was 2.22 g L−1, SEP was 1.49 g L−1, bias was −1.75 g L−1 and RPD was 6.3. The r2 of the ETC of the unknown sample was higher than the model, because the ethanol data of unknown samples were within the range of the data of the calibration set and the data of the calibration set was a good representative sample of future data from the fermentation cycles. The RPD of the AAC of the unknown sample however was lower than the model, since the SEP was higher due to larger variation of the samples.
Scatter plot of prediction of unknown by model (a) for AAC and (b) for ETC.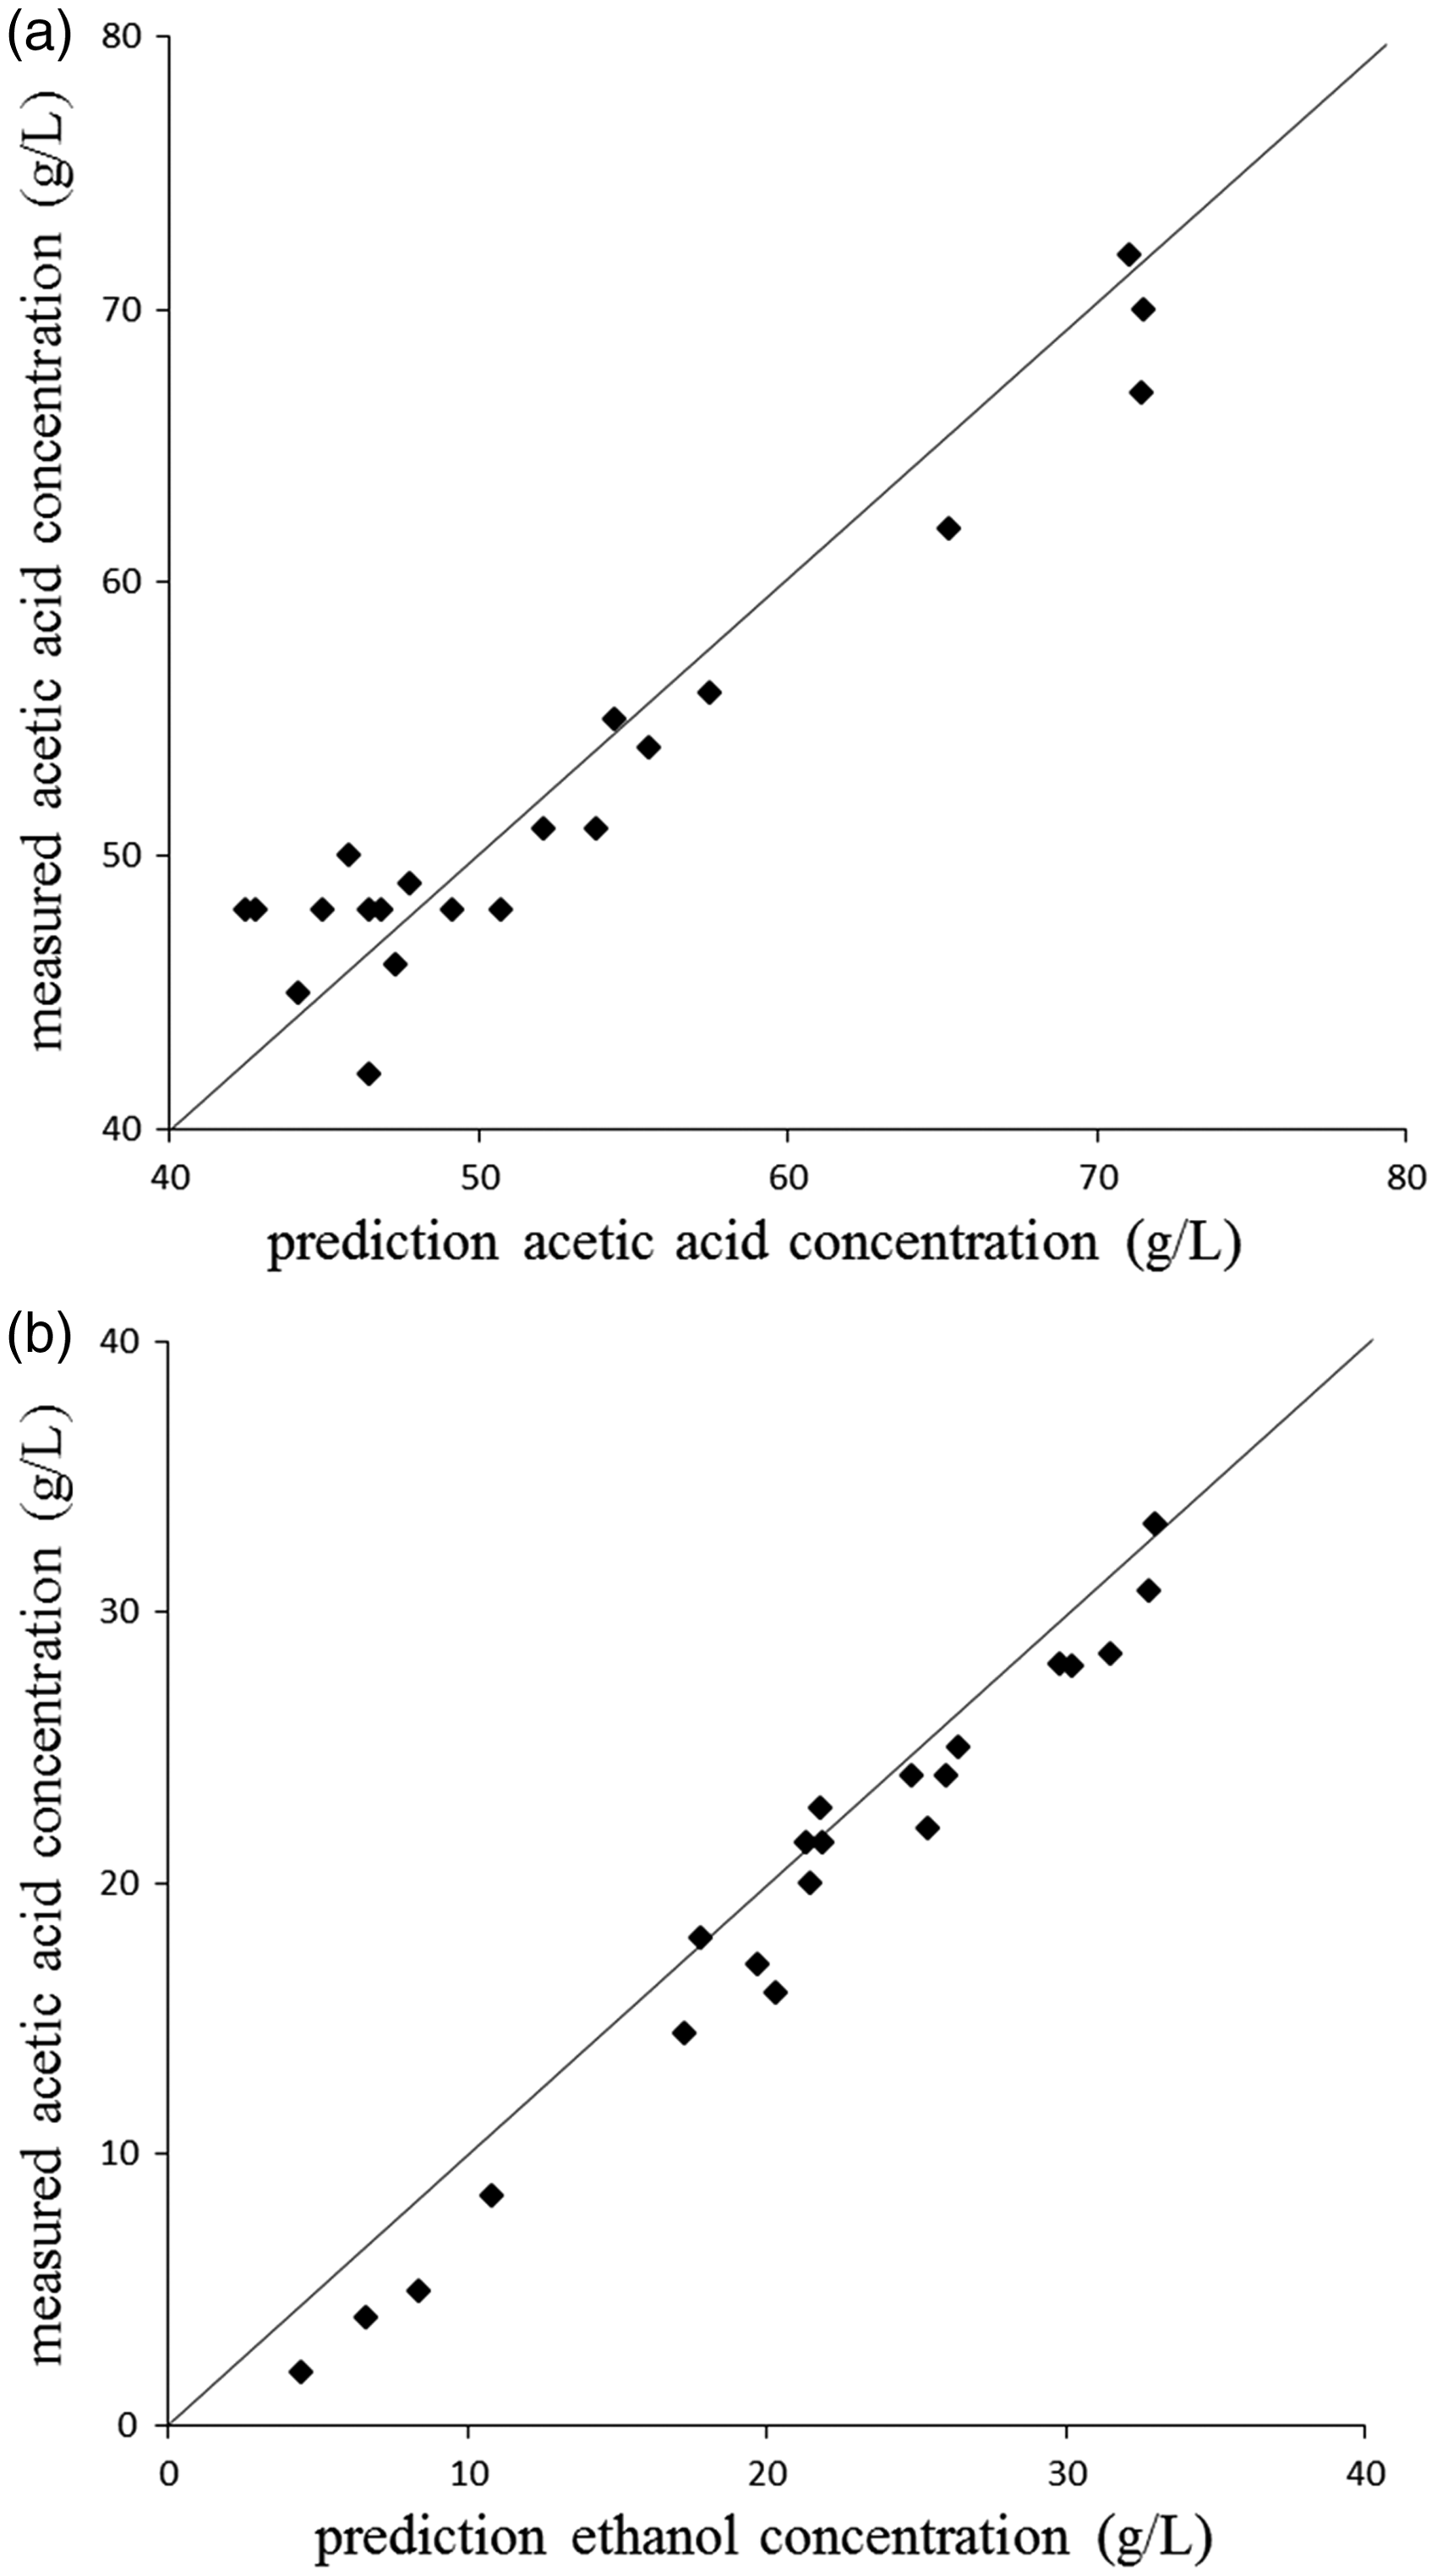
The range of acetic acid of each cycle was 45–80 g L−1 and that of ethanol was 0–35 g L−1. For AAC, the error was 3.5% of the maximum value of total samples and for the ETC, it was 6.3% which was acceptable for rough screening.
Comparison with other research
Yano et al. 5 reported the MLR prediction of the concentrations of ethanol and acetic acid in the culture broth of a rice vinegar fermentation using NIR spectrophotometer. They found that the r2 was 0.998 and that SEC was 0.37 g L−1 for ETC, and that r2 was 0.88 and SEC was 0.39 g L−1 for AAC, however the SEP was not reported. For the model for ETC in this research, the r2 was 0.94 and SEP was 1.40 g L−1, while for the model for AAC, the r2 was 0.96 and SEP was 2.90 g L−1. The results are different for the two studies because the range of concentrations is totally different. In this study the range of AAC was 45.0–80.0 g L−1 while that of Yano et al. was 66.9–109 g L−1. The range of ETC was 0.0–35.0 g L−1 while that of Yano was 5.7–34.8 g L−1. In addition the experiment conducted here used data which was monitored daily throughout 10 cycles of the fermentation process of two bioreactors. It was indicated that the models were for AAC and ETC daily monitoring process.
Conclusions
The model for daily monitoring of AAC and ETC developed using FT-NIR spectroscopy accompanied by PLS regression gave fair results from the r2, which indicated that the models could be applied for rough screening and process monitoring. NIR spectroscopy could be a simple and time saving method for the monitoring of AAC and ETC in rice vinegar.
Footnotes
Acknowledgements
The authors appreciate the Near Infrared Spectroscopy Research Center for Agricultural Product and Food (![]() ) at King Mongkut's Institute of Technology Ladkrabang, Bangkok, Thailand, for instrument support, and the Laboratory of Fermentation Technology, Faculty of Agro-Industry, King Mongkut’s Institute of Technology Ladkrabang. Bangkok, Thailand, for samples and reference test measurements.
) at King Mongkut's Institute of Technology Ladkrabang, Bangkok, Thailand, for instrument support, and the Laboratory of Fermentation Technology, Faculty of Agro-Industry, King Mongkut’s Institute of Technology Ladkrabang. Bangkok, Thailand, for samples and reference test measurements.
Declaration of conflicting interests
The author(s) declared no potential conflicts of interest with respect to the research, authorship, and/or publication of this article.
Funding
The author(s) received no financial support for the research, authorship, and/or publication of this article.