
Abstract
This paper reports the use of near infrared and mid-infrared spectroscopy to detect the presence and quantity of eggs of the gastrointestinal nematode Haemonchus contortus in sheep faeces. Haemonchus contortus eggs were quantified in dried, finely ground sheep faeces and in moist, coarsely ground faeces using near infrared and mid-infrared bench top spectrometers and a portable near infrared spectrometer. When Haemonchus contortus eggs were presented without faecal medium, it was found that the wavelength region of 1880–2100 nm was most important for detection. Broad classes of chemical properties found in the near infrared region were identified for dried Haemonchus contortus eggs using a mid-infrared spectrometer. However, when Haemonchus contortus eggs were mixed into the complex matrix of sheep faeces, the development of a robust calibration model for egg detection proved to be challenging (R2 < 0.47). The reliability of this method, if used for the detection of Haemonchus contortus eggs in the field, may be further limited by variations in egg species, faecal moisture content, faecal composition and particle size. Nevertheless, this is the first report identifying near infrared bands for Haemonchus contortus eggs and provides valuable information for future studies towards a spectroscopy-based method for detection of gastrointestinal nematodes.
Introduction
Gastrointestinal nematode or worm infections cause an estimated loss of up to 13% of the production value of sheep due to reductions in live weight, wool and milk yield as compared to nematode-free animals. 1 In Australia, gastrointestinal worms cost the sheep industry over A$436 million per annum, 2 and they reduce wool production by 16% on average.3–5 Heavy infestations with highly pathogenic species, such as the haemophagous worm Haemonchus contortus, commonly known as Barber’s pole worm, can lead to significant blood loss and sheep death if not promptly treated.6,7
For effective on-farm nematode management, sheep producers must consider how to optimize anthelmintic treatment times to minimize disease and production loss, maximize labour efficiency and discourage the development of anthelmintic resistance. The method most commonly used for monitoring gastrointestinal worm infections is faecal worm egg count (FWEC), which usually involves sending faecal samples to a diagnostic laboratory for microscopic quantification of worm eggs in faeces. 8 Although FWECs can be conducted on farm, the procedure is time consuming and requires parasitological expertise for accurate results. Furthermore, FWEC tests are unreliable and have been reported to show high variability between subsamples.9,10 Most FWECs are conducted in commercial diagnostic laboratories, and the turn-around time between receiving the samples and the return of the diagnostic result may be seven days, which can result in an inconvenient and potentially dangerous delay in the administration of anthelmintic treatments to infected sheep. 8 Timely diagnosis of gastrointestinal worm infections is therefore crucial for effective disease control and may assist in slowing the development of anthelmintic resistance in the worms.11,12
In regions where H. contortus predominates, the FAMACHA© system of scoring levels of anaemia in sheep can be used as an alternative to, or in conjunction with, FWEC monitoring. 12 To obtain accurate assessments and interpretations, it is essential that producers are trained by a qualified instructor and that they frequently monitor sheep during the peak H. contortus season. In recognition of the need for a rapid diagnostic tool, the FECPAK™ method was developed in New Zealand, with an improved version introduced later, FECPAK G2™.13,14 This method requires laborious steps of filtration to separate worm eggs from faeces and a trained operator for accurate interpretation of the results.
Infrared (IR) spectroscopy can be a valuable tool for quickly determining various chemical attributes of target samples while providing the same information as conventional methods. IR spectroscopy, such as near infrared (NIR) spectroscopy and Fourier-transform infrared (FTIR) spectroscopy, has gained popularity as methods for nutritional and classification analysis using animal faeces. These methods are rapid, non-invasive and cost effective in nature. 15 Previous studies have demonstrated the potential of IR spectroscopy using convenient portable devices for determining nutrient composition of unprocessed faecal samples.16–18 The use of NIR spectroscopy with livestock faeces has also been tested for determining parasite infestation in other studies both through measuring the presence of blood and detecting chemical changes associated with stress.19,20 These reports suggest the potential of IR spectroscopy as a rapid, cost-effective and non-invasive diagnostic tool for diagnosing worm burdens in sheep on-farm. To date, there are no published reports of the use of this technology to characterize gastrointestinal worm eggs in sheep faeces.
This study was conducted with the aim of determining the potential of NIR and/or mid-IR spectroscopy as quantitative diagnostic tools for detecting H. contortus eggs in sheep faeces.
Materials and methods
Experimental design
To determine whether IR spectroscopy can detect H. contortus eggs, three experiments were conducted to assess the eggs under various conditions. Figure 1 displays an overview of the experimental design for this study. H. contortus eggs were first characterized in water using NIR spectroscopy, and the mid-IR spectra for dried H. contortus eggs were subsequently measured. Upon identification of potential absorbance bands associated with H. contortus eggs, NIR spectra from H. contortus eggs in moist and dried sheep faeces were analysed.
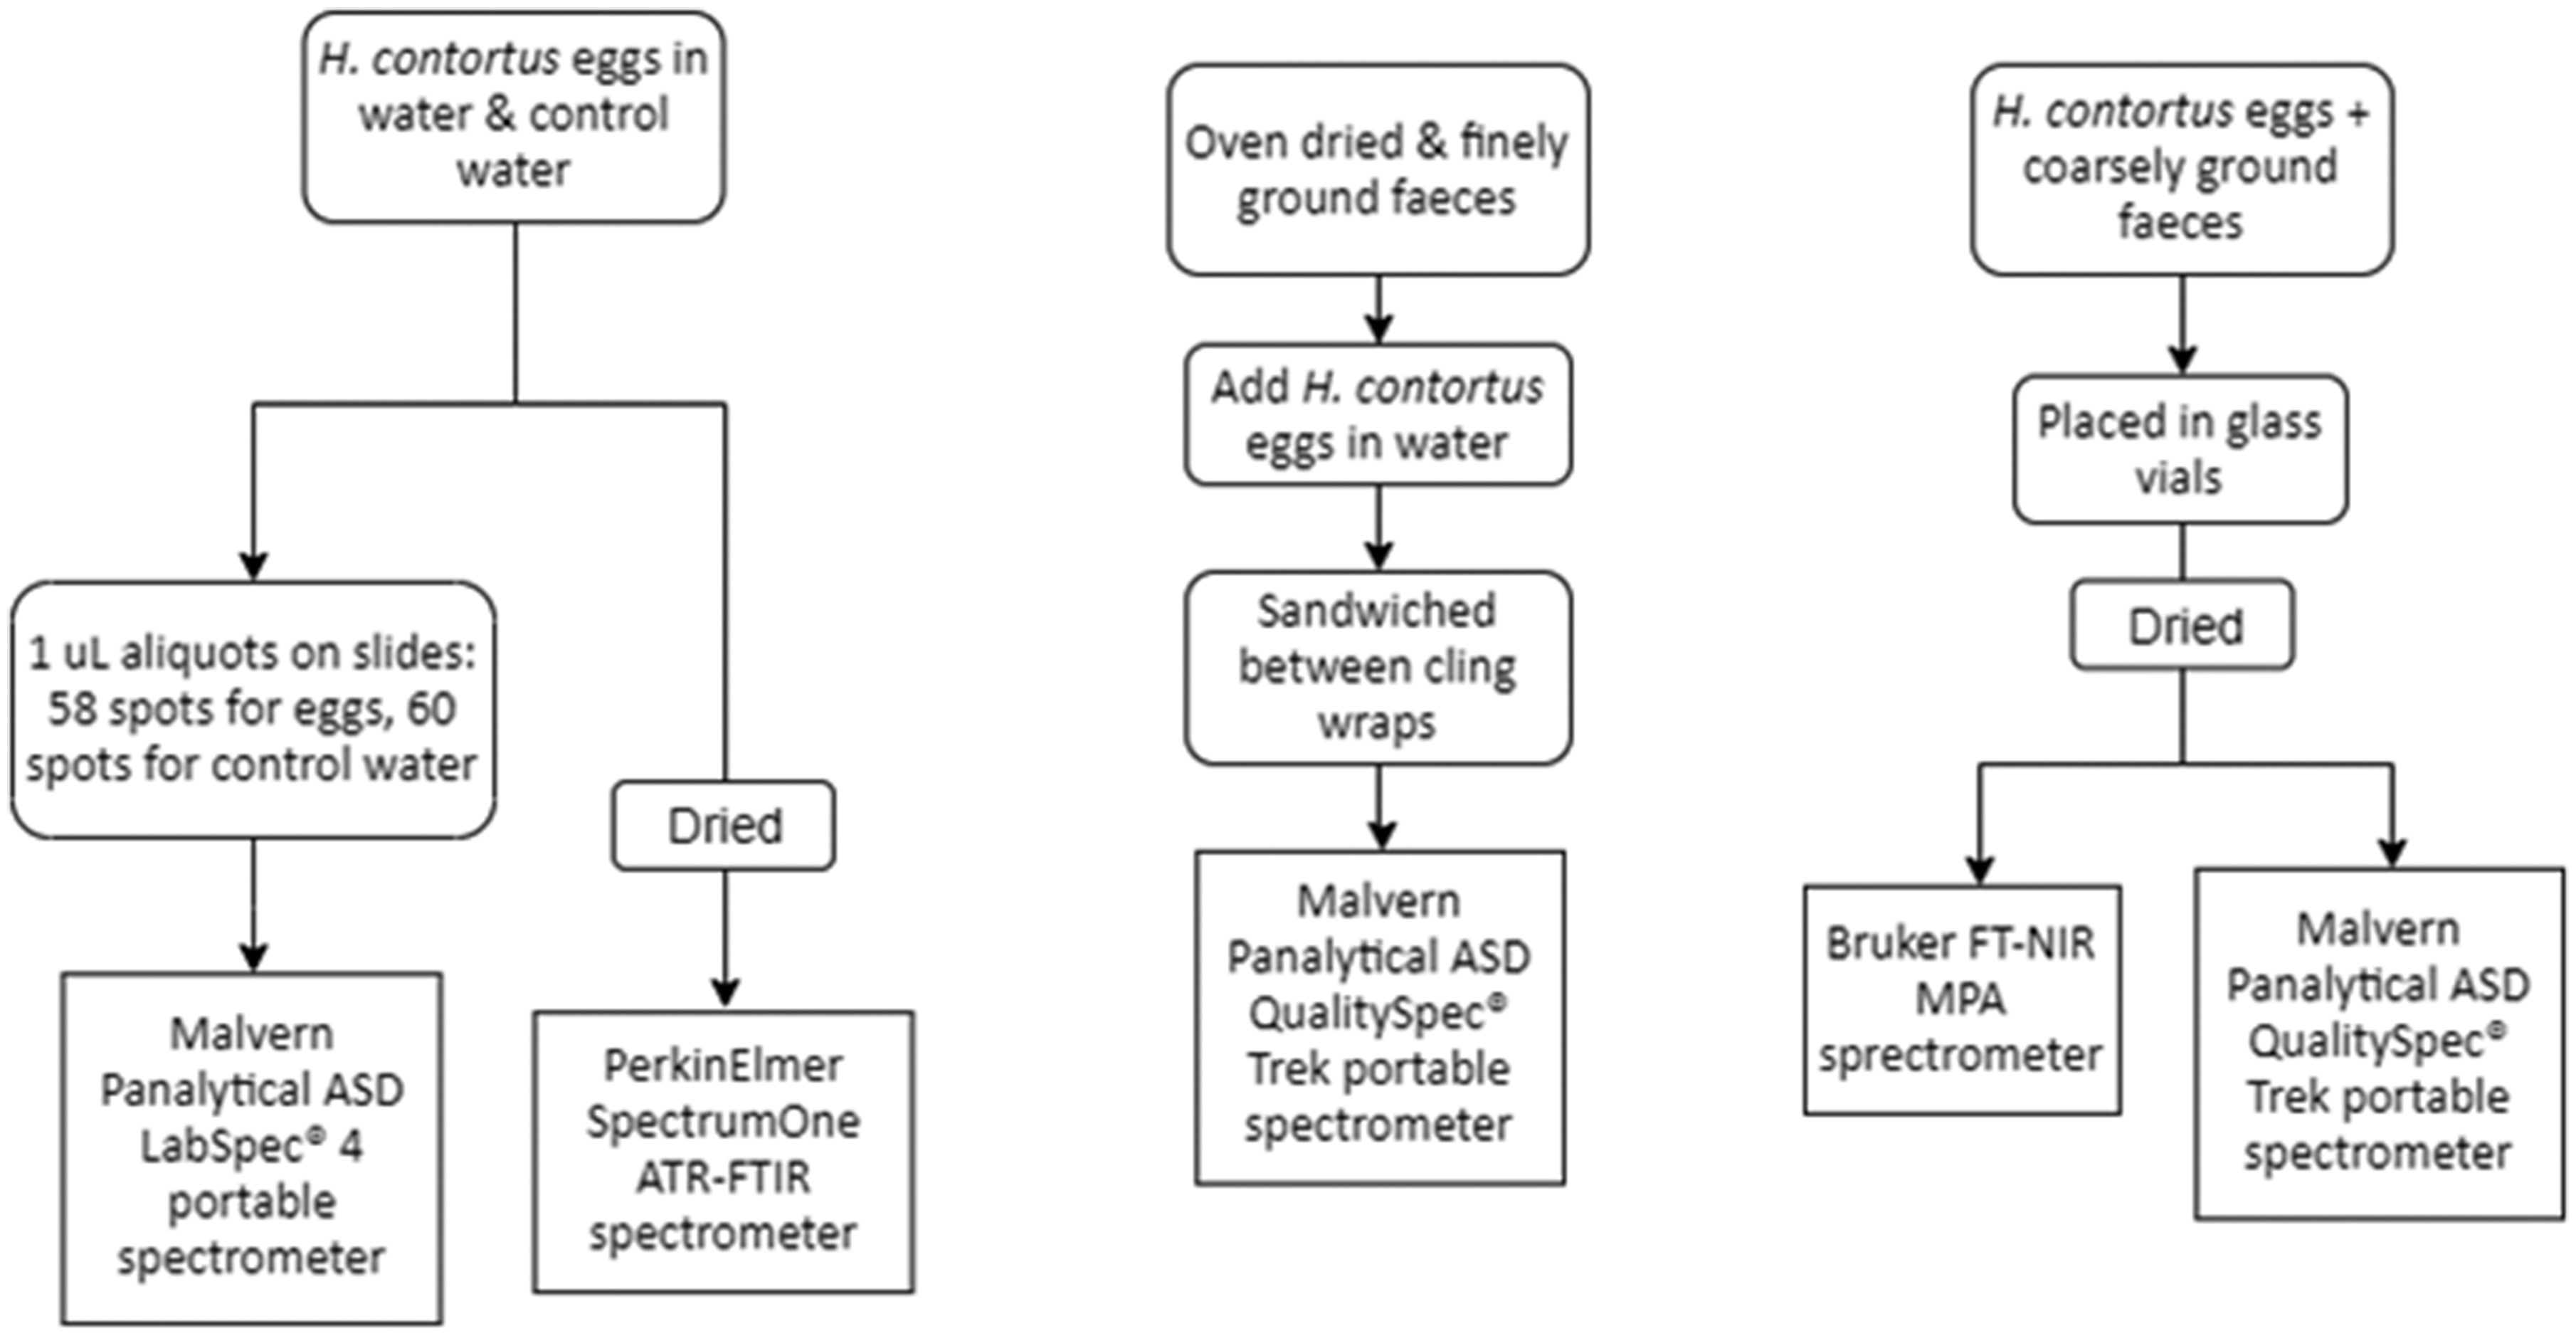
Flowchart of experimental design.
Faeces and H. contortus eggs preparation
Faecal samples were collected from two sheep for the experiments described here. One sheep (Sheep 1) was maintained without any nematode infection; the other (Sheep 2) was infected with worms from the Kirby isolate of H. contortus. 21 The sheep were housed at the Commonwealth Scientific and Industrial Research Organization (CSIRO) FD McMaster Laboratory at Armidale, NSW. All animal procedures were approved by the FD McMaster Animal Ethics Committee (Animal Ethics Approval Number AEC 18/09). Faeces were collected overnight into faecal collection bags over several days. The collected samples were then placed into sealed plastic bags, sent by overnight courier to the CSIRO laboratory in Brisbane and stored at –20°C in a freezer until analysed. The absence of infection in Sheep 1 was confirmed by FWEC, and the samples taken from this sheep were subsequently spiked with known quantities of H. contortus eggs or used as uninfected control samples throughout the study.
H. contortus eggs (Kirby 1982 strain) were extracted from faecal samples of Sheep 2 using standard protocols as described by Kotze et al. 22 Briefly, eggs were recovered by passing infected sheep faeces suspended in water through a series of fine sieves (250 µm followed by 75 µm), before centrifugation with a two-step sucrose gradient (10 and 25% sucrose). Eggs were recovered from the interface of the two sucrose layers and washed over a 25 µm sieve with distilled water to remove the sucrose. The eggs were then treated with a mild bleach solution (0.02% w/v) for 10 min to prevent bacterial growth, followed by thorough washing with distilled water. The eggs were stored at a concentration of approximately 8000 eggs/mL in distilled water at 4°C until used in experiments.
H. contortus eggs in water suspension
Sample preparation
H. contortus eggs were prepared for NIR measurements by pipetting 58 1-µL ‘spots’ of stock H. contortus eggs in water at a concentration of 8000 eggs/mL onto glass slides. Control samples were prepared by pipetting 60 spots containing 1 µL of distilled water onto glass slides. Samples on the slides were scanned with an NIR spectrometer within 20 min of pipetting to avoid drying of the samples.
Concentrated H. contortus eggs were then measured using a mid-IR spectrometer by adding 4 mL of a H. contortus egg solution containing approximately 8000 eggs/mL to a 2 mL Eppendorf tube. Concentrated nematode eggs were prepared by allowing eggs to settle to the bottom of the tube and removing excess water after each addition of 1 mL of egg solution (∼20 min each). The water that was removed (‘control water’) was used as a blank control for mid-IR measurement and was checked by microscopy for the presence of eggs prior to use. Tubes containing eggs were dried within a glass chamber attached to a vacuum desiccator for one week.
Faecal control samples for attenuated total reflection (ATR)–FTIR measurement were prepared by drying 1 g of clean faeces within an uncovered glass vial (25 mm × 54 mm × 20 mm) in an oven at 60°C for 48 h. Samples were then immediately capped with a rubber stopper to prevent any moisture absorption and allowed to cool to ambient temperature within a glass chamber attached to a vacuum desiccator before ATR–FTIR measurement.
Spectral acquisition
NIR spectra of the H. contortus spots prepared on glass slides were obtained using a semi-portable LabSpec 4 (Malvern Panalytical ASD, Malvern, UK) attached to an external 2-mm bifurcated fibre optic cable probe equipped with six illumination fibres (600 microns) surrounding a single collection fibre (600 micron) for reflective measurement. Spectral data were measured within the region of 350–2500 nm at a sampling increment of 1 nm. Each spectrum was acquired using an average of 20 scans within a 2-mm spot size for each 1-µL ‘spot’. The glass slide was placed on a white Teflon reference panel during spectra measurement.
Mid-IR spectra of the dried pellet containing highly concentrated H. contortus eggs were acquired using a Perkin-Elmer Spectrum 100 spectrometer (Perkin-Elmer, Waltham, MA, USA) fitted with a Perkin-Elmer UATR single bounce ATR diamond crystal. Concentrated H. contortus eggs were analysed as a dried pellet and clamped directly onto the diamond crystal for spectral analysis. Spectral data were obtained in the wavelength range of 10,000–3000 cm−1 with 32 scans per spectrum at 1 cm−1 intervals for both concentrated H. contortus eggs (5000 eggs per gram) and sheep faeces without eggs (control).
H. contortus eggs in moist faeces
Sample preparation
Frozen faecal samples were thawed and dried in an incubator until constant weight at 60°C before milling to 1 mm particle size using a Retsch ZM200 mill (Retsch GmbH, Haan, Germany). Four ‘slabs’ of faeces spiked with H. contortus eggs were prepared, with each slab consisting of 50 g ground faeces mixed with 70 mL H. contortus eggs suspended in water, and the control sample containing 70 mL distilled water. The concentrations of H. contortus eggs for each slab were approximately 5000, 1250, 625 and 0 (control) eggs/g (epg) of faeces, respectively. Samples were thoroughly mixed by hand and rolled out to form a slab (approximately 21 × 30 × 0.2 cm) sandwiched between two pieces of polyethylene films (Woolworths Homebrand, Australia) to prevent samples drying out and minimize the chance of cross-contamination during NIR measurements. As this experiment was conducted to determine the potential of detecting H. contortus eggs in moist faeces in the field, it was carried out without further drying of the samples.
Spectral acquisition
The NIR spectra were obtained using a QualitySpec® Trek (QST) portable spectrometer (Malvern Panalytical ASD, Malvern, UK). To prevent measurement of environment light scattering, each sample ‘slab’ was scanned in direct contact with the window of the QST spectrometer (Figure 2). Spectra were obtained within the spectral range 350–2500 nm, with data resolution of 1 nm. An integrated internal light source was used to reduce the effects of stray light during measurement. As egg distribution was not homogenous through the slabs, each slab was scanned at 100 random locations chosen on the basis of a randomized list generated using Microsoft Excel (2016). The spectra collected for each slab were averaged for PCA.
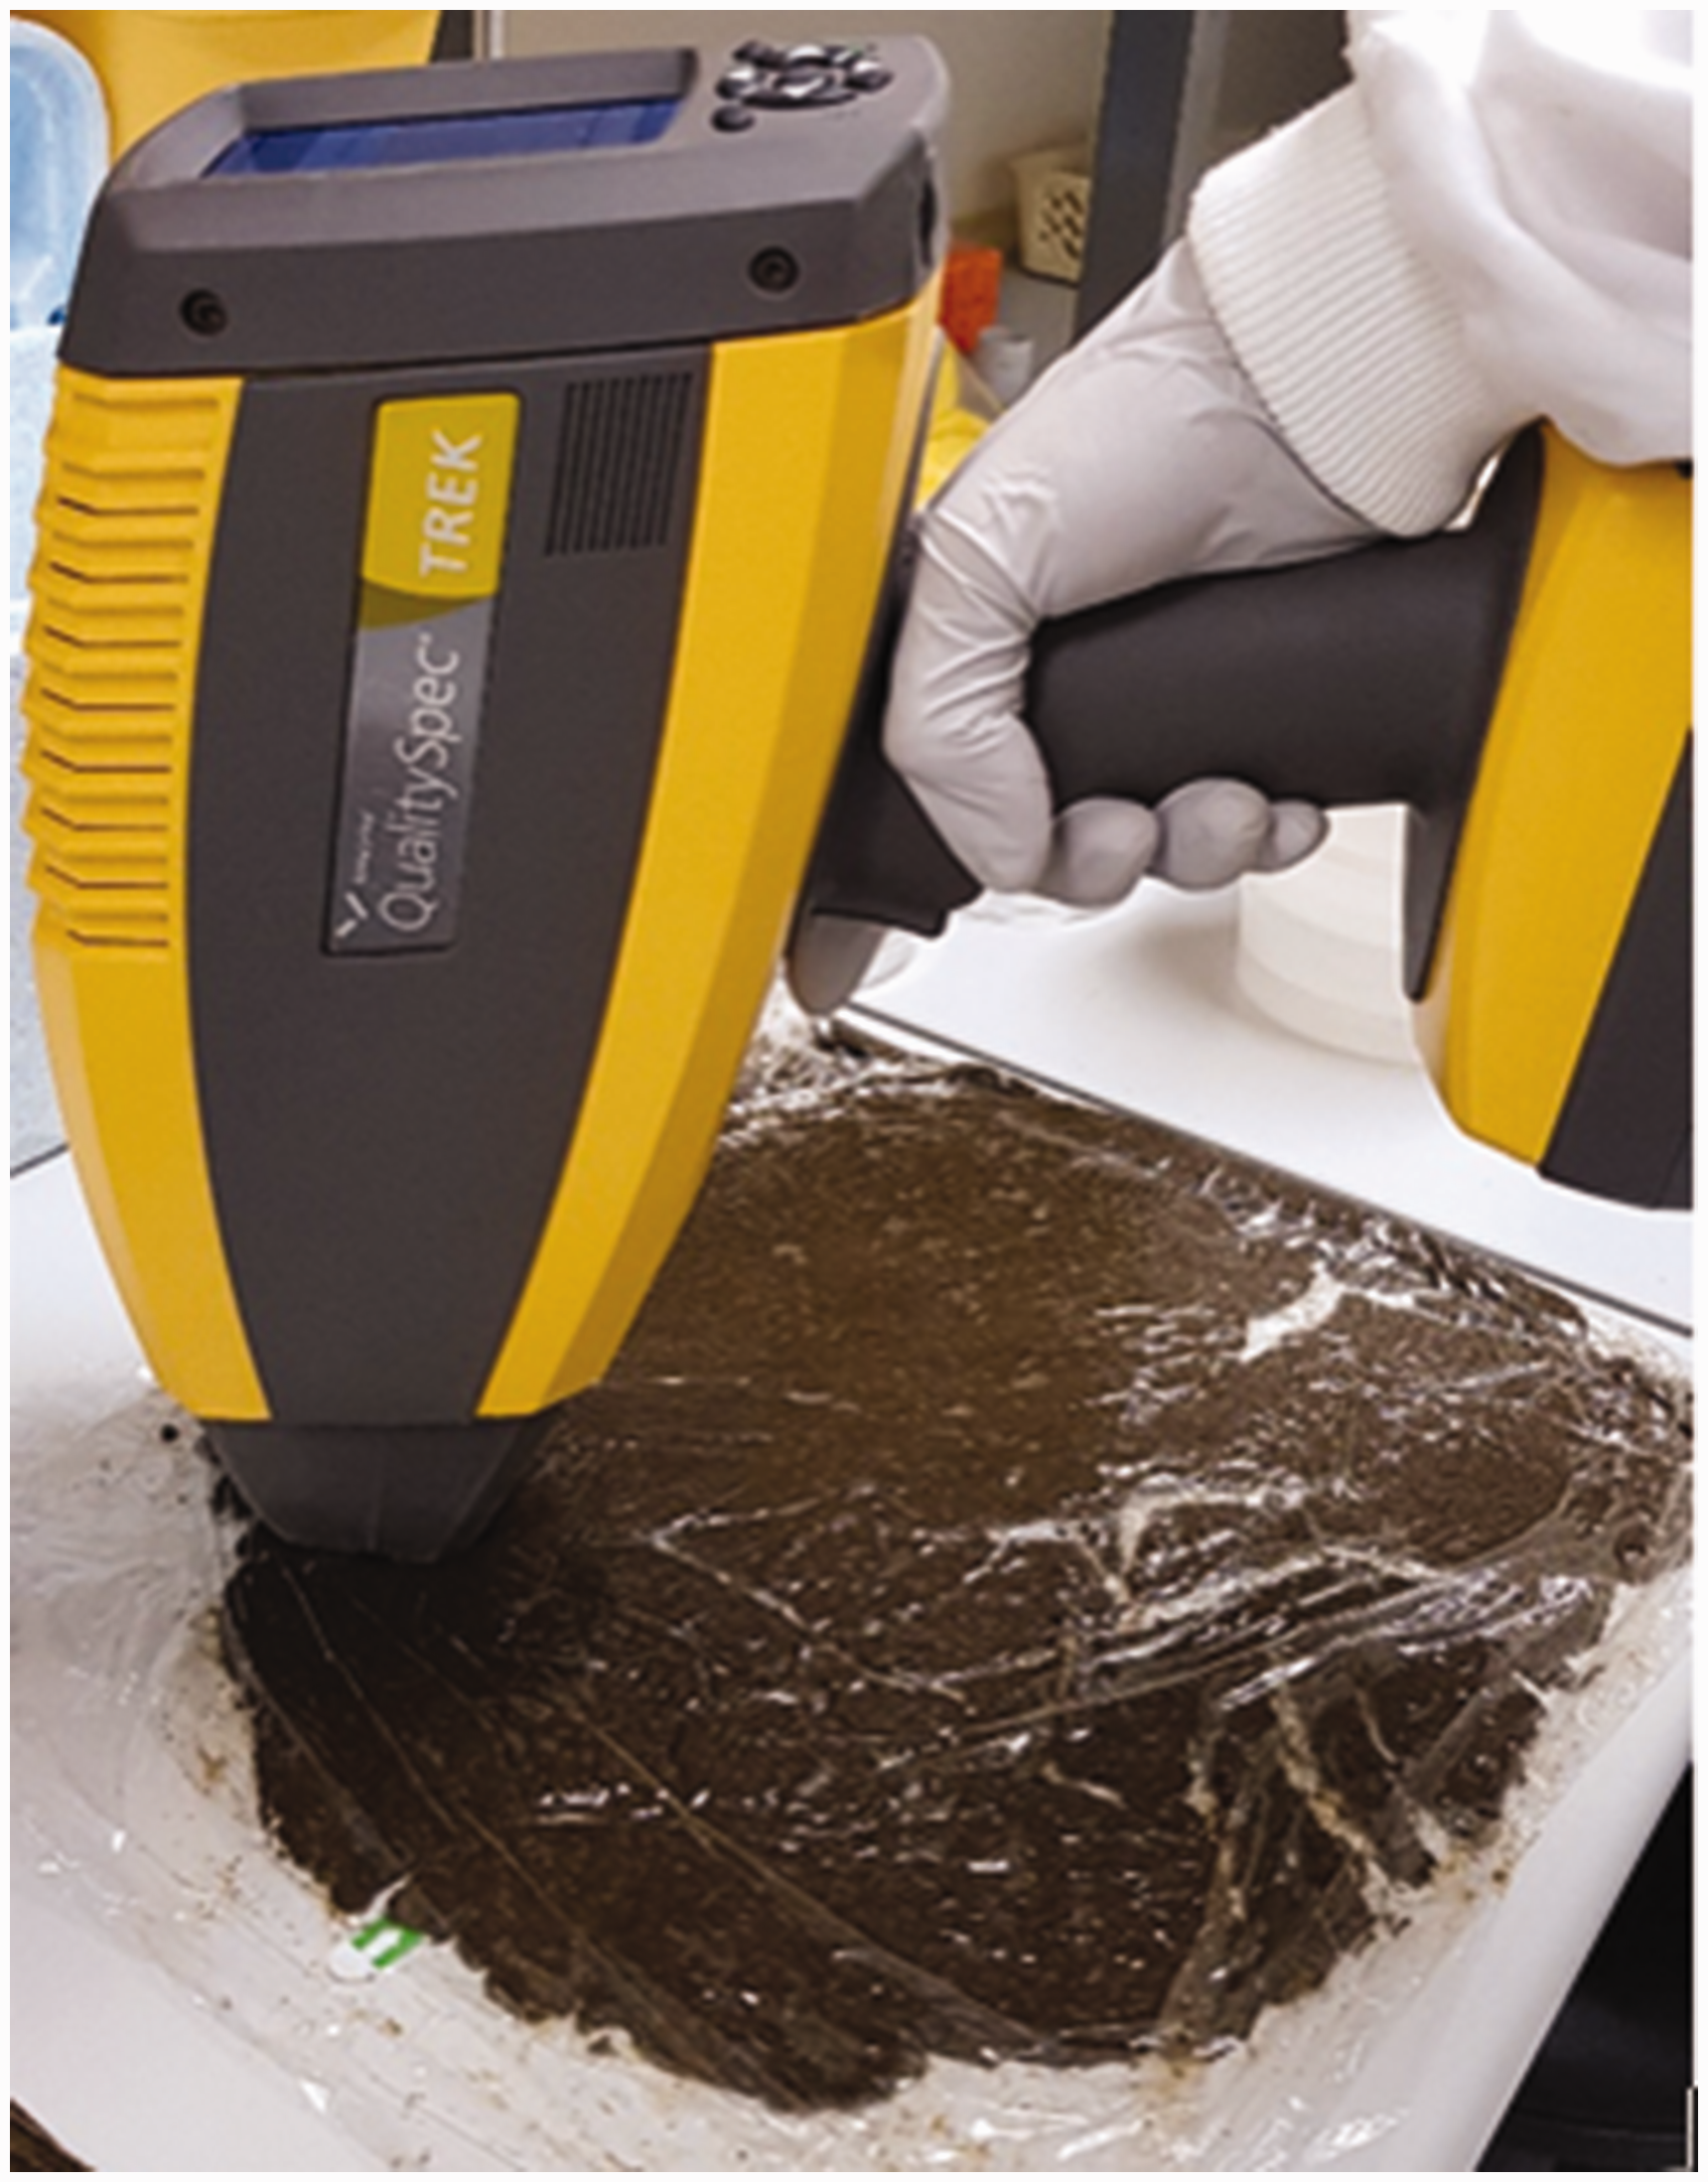
NIR spectra acquisition of H. contortus eggs in moist faeces measured as a ‘slab’ using the Malvern Panalytical QualitySpec Trek.
H. contortus eggs in dried faeces
Sample preparation
Frozen, clean faecal samples were allowed to thaw for at least 30 min before grinding in a food processor until all faeces were homogenized. Samples (1 g) were then placed into glass vials (25 mm × 54 mm × 20 mm), along with 100 µL of H. contortus eggs solution prepared by two-fold serial dilution to give concentrations of approximately 5000, 2500, 1250, 625, 313 and 156 epg. Control samples consisted of 100 µL of control water (section ‘Sample preparation’) was added to faecal samples. For each egg concentration, 50 subsamples in glass vials were prepared for NIR scans. To ensure even distribution of eggs in faeces, all samples were mixed for 30 s using a spatula. All samples were dried within the glass vials in an incubator for 48 h at 60°C. Prior to acquisition of NIR spectra, samples were removed from the incubator, and each glass vial was immediately capped with a rubber seal and placed in a desiccator for at least 1 h to cool to ambient temperature.
Spectral acquisition
NIR spectra for H. contortus eggs in faeces were obtained using a Bruker MPA FT-NIR spectrometer (Bruker Optik GmbH, Ettlingen, Germany). Each spectrum was the average of 32 scans and was collected between 12,500 and 3500 cm−1 (equivalent to ca. 800–2857 nm), at a sampling increment of 7.7 cm−1. Upon initial investigation, it was determined that the spectra above 10,000 cm−1 were irrelevant for the analysis; and data were therefore analysed in the range 10,000–4000 cm−1 (1000–2500 nm).
To test the potential of the QST portable spectrometer as an on-farm diagnostic tool, NIR measurements of H. contortus eggs in faeces were repeated with the QST. Samples within glass vials were scanned from the bottom of the glass vials, which were held by a retort stand to ensure the stability of the sample during measurement (Figure 3). Forty samples from each concentration and controls were allocated for the development of the calibration model, while random block internal cross validation was used to obtain the optimum number of factors. The calibration model was built using a total of 273 samples, following the removal of seven outliers.
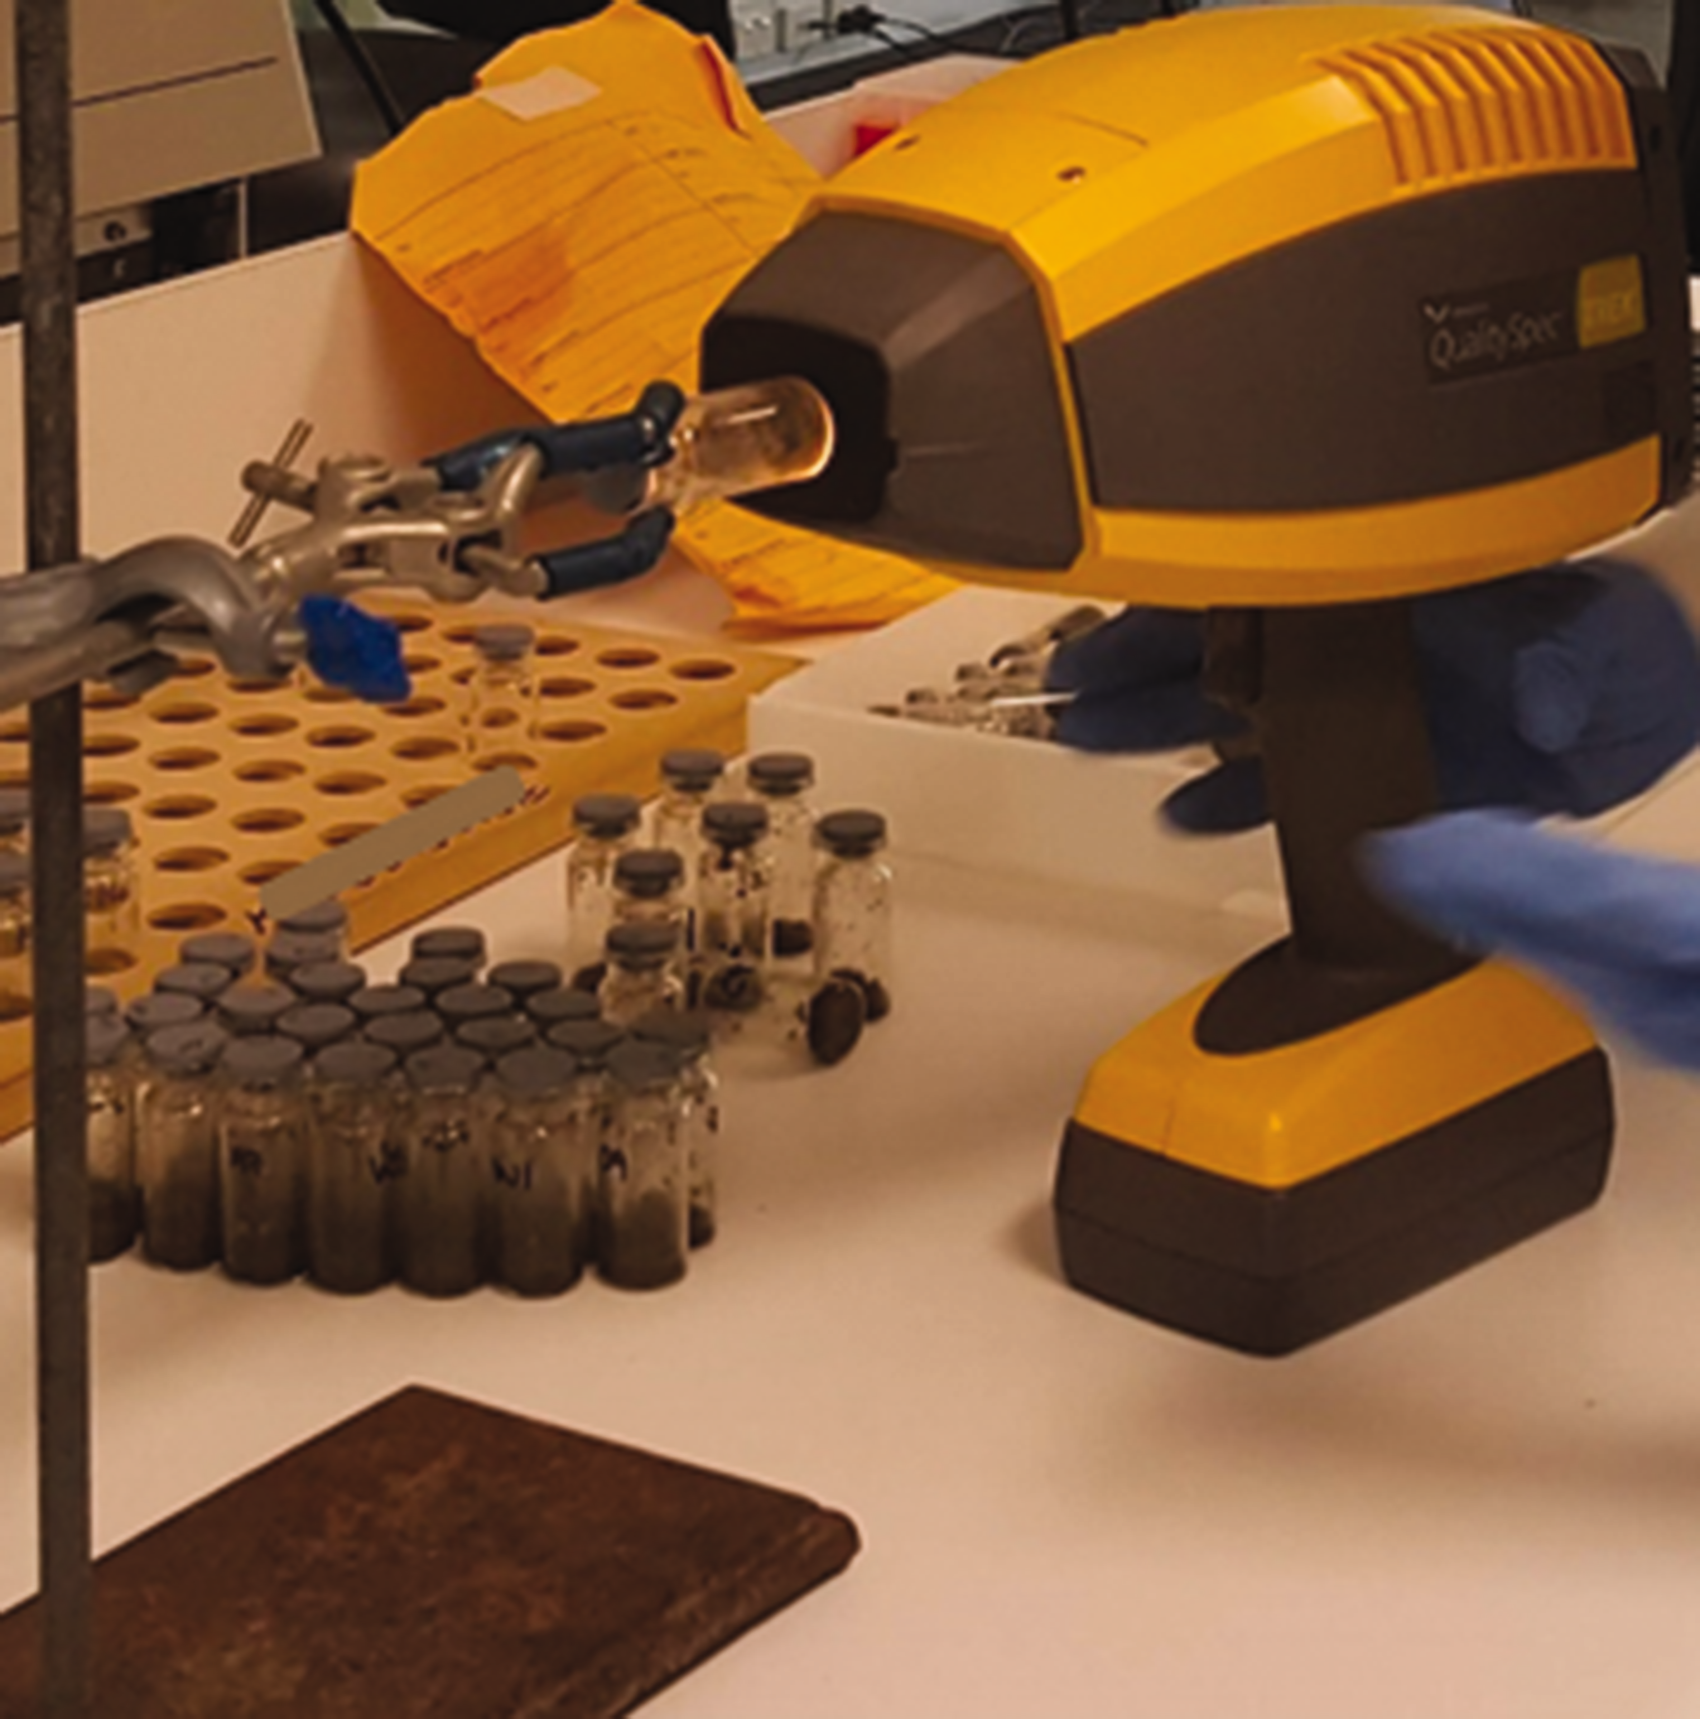
NIR spectra acquisition of dried faecal sample containing H. contortus eggs in a sealed glass tube using the Malvern Panalytical QualitySpec Trek portable spectrometer.
Chemometric methods
Data analysis was performed using The Unscrambler X (v. 10.5.1; CAMO Software A/S, Oslo, Norway). Spectral data collected from the LabSpec 4 and the portable QST were transformed to absorbance prior to data pre-treatments. Exploratory analysis was conducted using principal component analysis (PCA), and outliers were identified and removed using Hotelling T2 statistics for all experiments. Samples which showed extreme observations in spectra, leverage and residual means (obtained from PCA) compared to other samples were considered outliers and removed from the calibration models. 23 Loading plots from PCA were analysed to identify significant absorbance bands associated with H. contortus eggs. For H. contortus eggs in faeces, the concentration of eggs (epg) was transformed using the formula ln(FWEC + 100) (LnFWEC) to normalize the distribution of data before analysis. Partial least squares (PLS) regression with randomized blocks of cross validation was used to develop calibration models for H. contortus eggs in faeces. For each randomized cross validation, 20 segments were used with 13 samples included per segment. The coefficient of determination for correlation in calibration (R 2 cal), root-mean-square error of calibration (RMSEC), coefficient of determination for correlation in cross validation (r 2 cv) and the root-mean-square error of cross validation (RMSECV) were used to assess the model performance.
Wavelength selection
Wavelength region selections were based on previous studies of sheep faecal analysis with NIR spectroscopy24–26 and results obtained from the study of H. contortus eggs in water suspension. Wavelength regions with the highest r 2 cv, with the lowest RMSECV and the lowest number of factors, were selected as the best regions for analysis for each specific spectrometer.
Data pre-processing and enhancement
To obtain the most robust calibration models, several pre-processing techniques were applied to the raw spectra. Spectral data collected using LabSpec 4 were pre-treated with multiplicative scattering correction (MSC). Datasets collected for H. contortus eggs in faeces were pre-treated using MSC, standard normal variate (SNV), mean normalizing, SNV-detrending (SNV-DT) and Savitzky–Golay smoothing using first derivative with polynomial order 2 and 21 smoothing points (QST data), and Savitzky-Golay first derivative order, polynomial order 2 and 13 smoothing points (Bruker MPA data).
Results and discussion
H. contortus in water suspension
The raw absorbance spectra for H. contortus eggs in water collected using the LabSpec 4 were dominated by water, with bands at around 1450 and 1930 nm 27 (Figure 4). PCA identified that there were three principal components (PCs) explaining 100% of the variation. PC-1 showed that 97% of the total variance observed consisted of bands at 1450, 1880 and 2030 nm (Figure 5). Previous studies have shown that bands at approximately 1880 nm correspond to fatty acids 28 and 2023 nm correspond to N–H bond in amides. 29 Among the bands found in PC-2 that accounted for 2% of the total variance observed, only the peaks at 1450 and 1930 nm were previously identified as water. The loading plot from PC-3 (1% of total variance observed) appeared to be a mirror image of PC-1 with a shift of peak from 2030 to 2080 nm. These results suggest that NIR spectroscopy has the ability to distinguish H. contortus eggs from the control samples in the region of 1880–2100 nm.
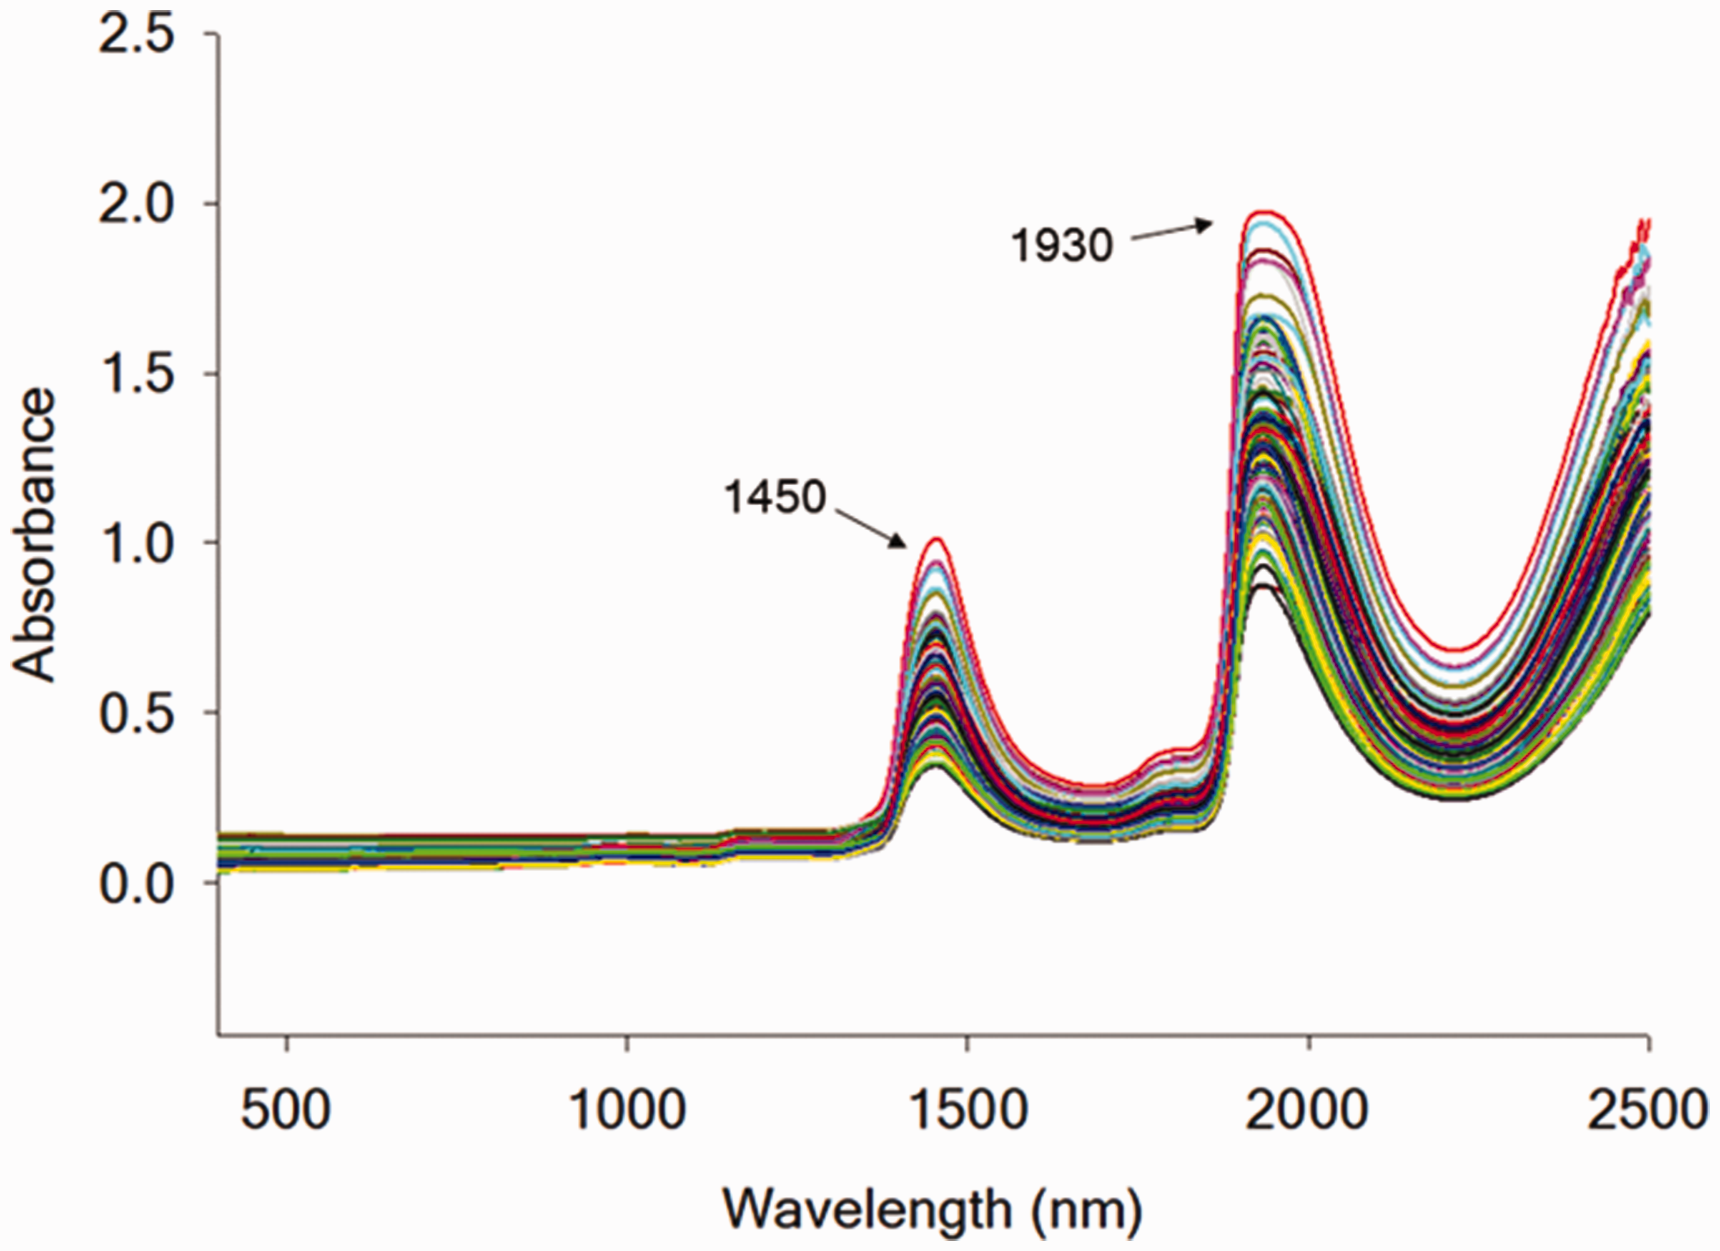
Raw NIR absorbance spectra for H. contortus eggs in water on glass slides measured using LabSpec 4.
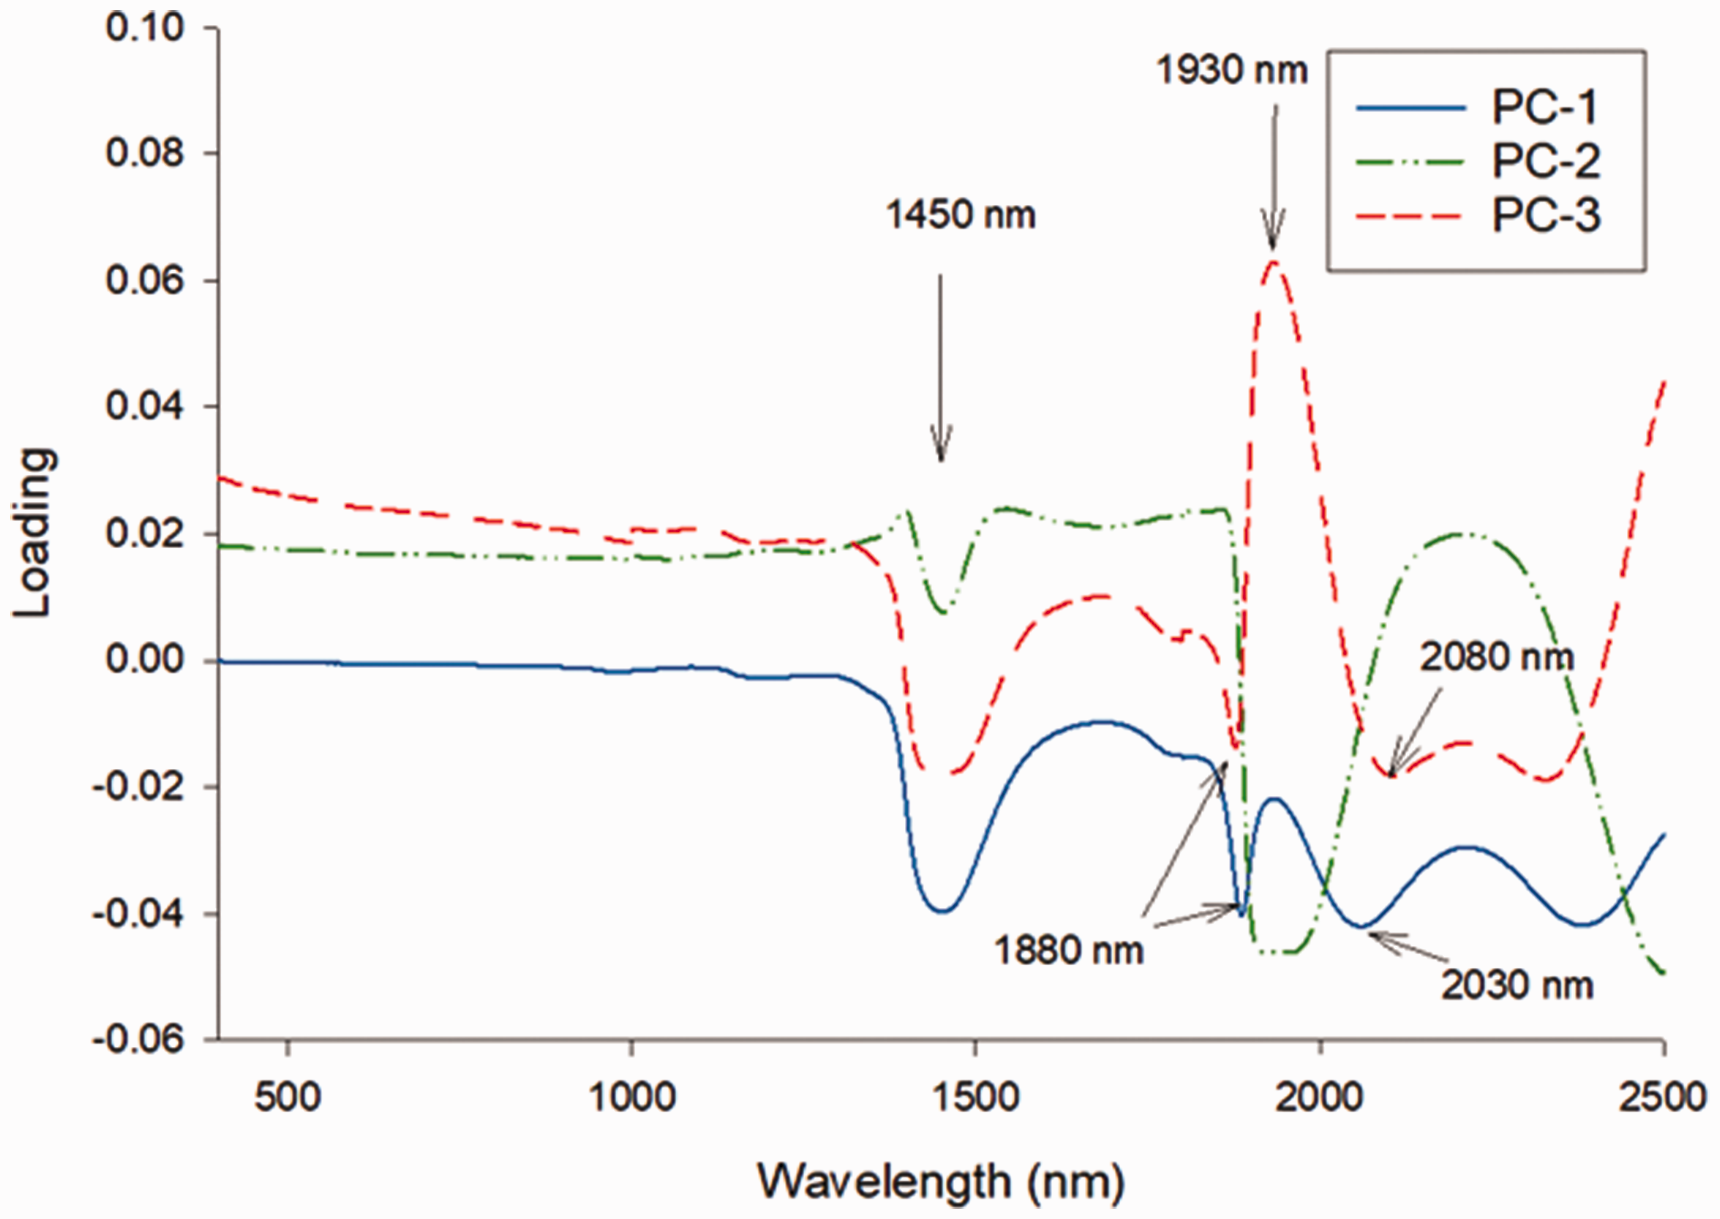
Loading plot from PCA of multiplicative scattering corrected NIR absorbance spectra for H. contortus eggs in water showing PC1, PC2 and PC3, which accounted for 97, 2 and 1% of the total variance observed, respectively. Bands at 1450 and 1930 nm were associated with –OH bonds in water, while bands at 1880, 2030 and 2080 nm may be associated with H. contortus eggs. Spectra were acquired using LabSpec 4.
To assess this hypothesis, PCA of the MSC-treated spectra acquired with LabSpec 4 was performed within the wavelength region of 1880–2100 nm. The scores plot of PC-1 (99%) and PC-2 (1%) showed spectral difference between H. contortus eggs in water and control water (Figure 6). Although there are some samples that overlapped between the two groups, suggesting spectral similarities, the majority of the samples showed spectral differences between the groups indicating that the difference is likely due to the presence of eggs.
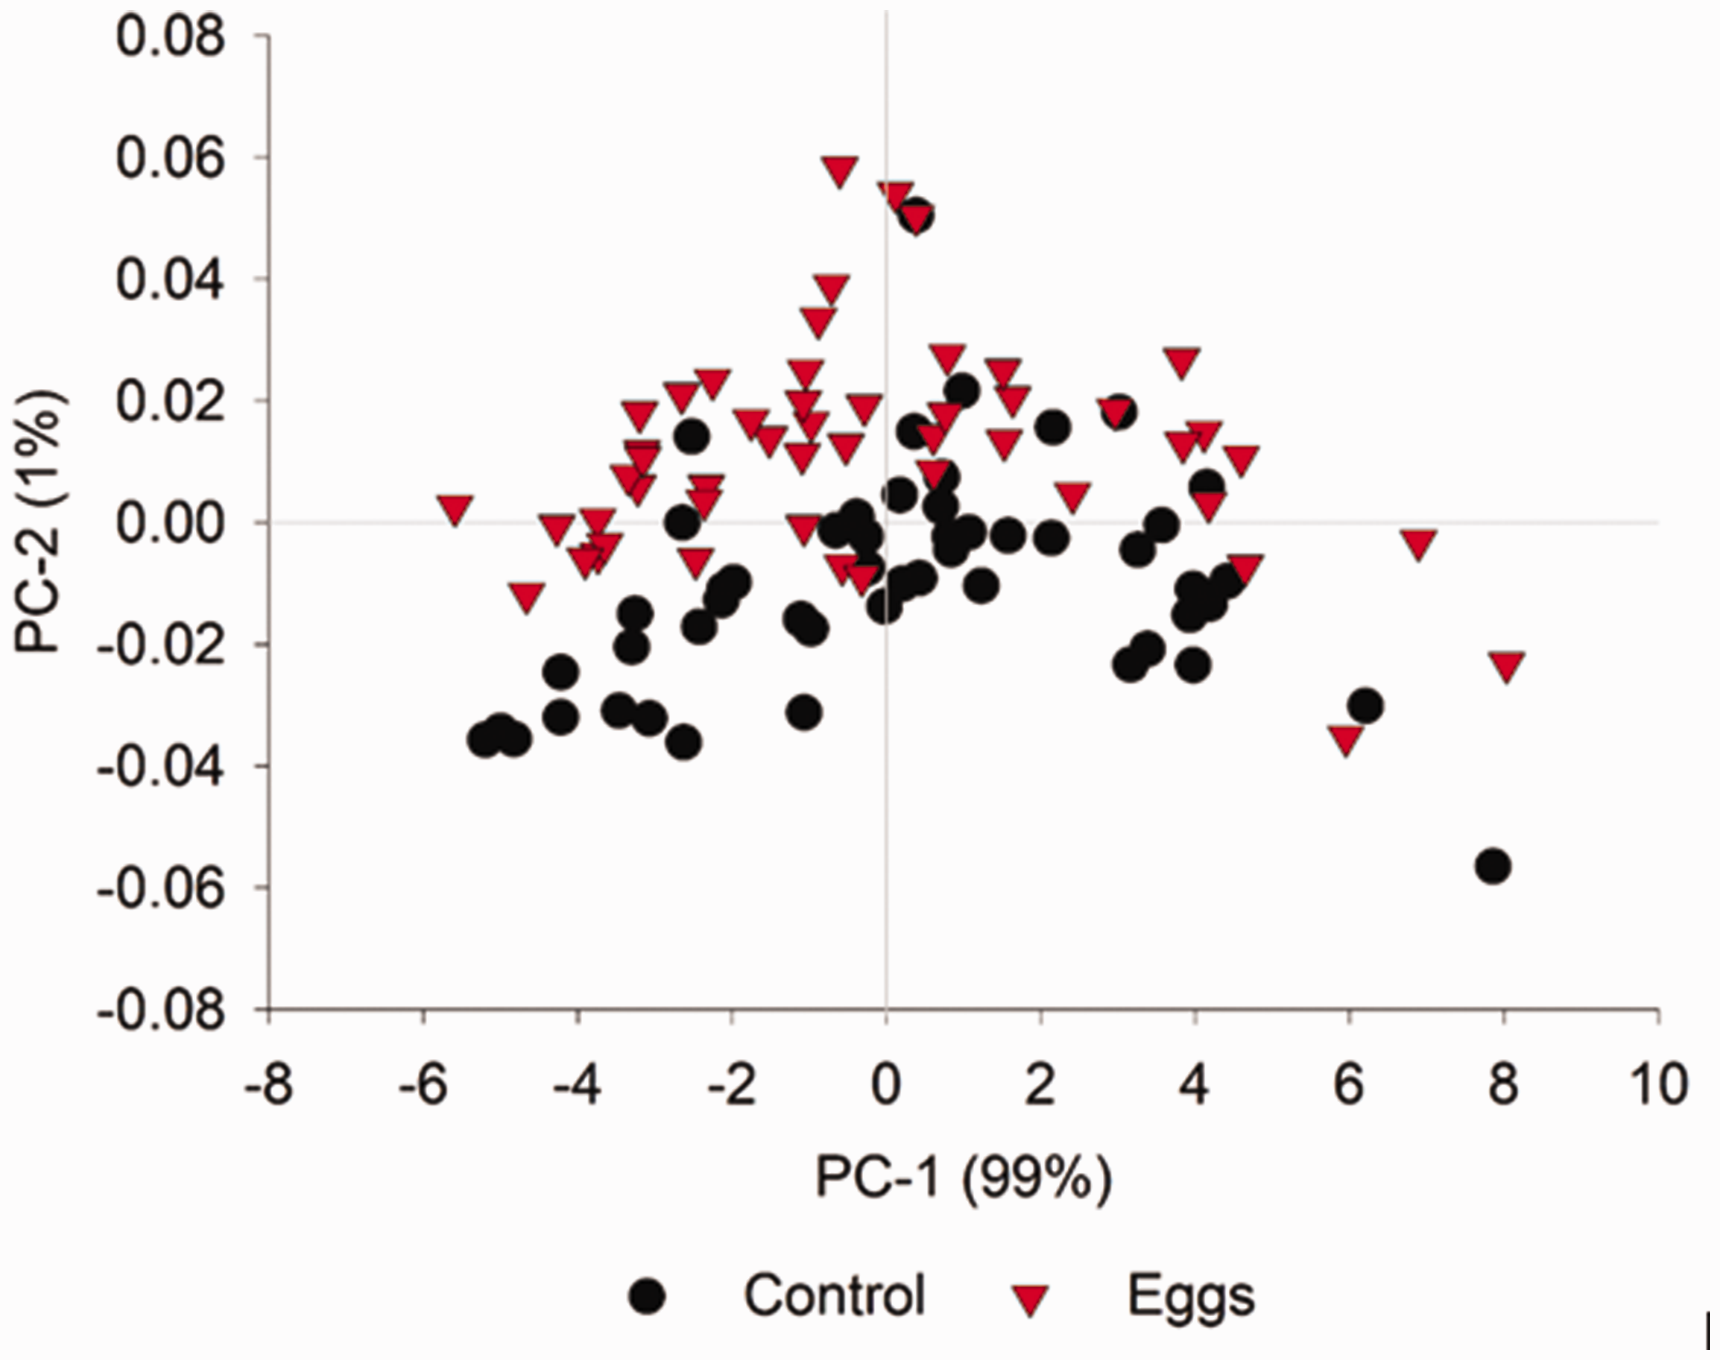
Score plot of PCA showing the first and second PC obtained from the multiplicative scattering corrected NIR spectra of H. contortus eggs in water and control water without eggs within the wavelength range of 1880–2100 nm. Triangles represent H. contortus eggs in water, circles represent control water without eggs. Spectra were acquired using LabSpec 4.
Figure 7 shows the mid-IR spectra for dried H. contortus eggs, clean sheep faeces (containing no eggs), and the resulting spectra after subtracting faeces-only spectra. As the H. contortus eggs from this study were filtered from sheep faeces, small traces of faecal material in the egg samples were unavoidably present when measured with ATR–FTIR. This resulted in the H. contortus egg spectra resembling the spectra of typical animal faeces previously published.30,31 Therefore, spectra associated with faeces were manually subtracted from the dried H. contortus egg data. Due to the difference in moisture content, absorbance for dried H. contortus eggs was higher than that observed for dried clean faeces. Hence, bands corresponding to animal faeces were still visible even after the faecal spectra were removed. However, circled bands in Figure 7 have not been previously identified as faecal material, suggesting that they may correspond to dried H. contortus eggs. It was previously found that the bands at 2957 cm−1, 1396 cm−1 and 965 cm−1 corresponded to fatty acids,32,33 while the peak at 1081 cm−1 corresponded to glycogen. 34 It has been demonstrated that the cell wall of H. contortus eggs consists of an outer trilaminate vitelline layer, which is mostly protein, a medial chitinous layer and a basal lipid layer. 35 These findings are in line with the broad classes of chemical properties identified in this study for H. contortus eggs using NIR spectroscopy.
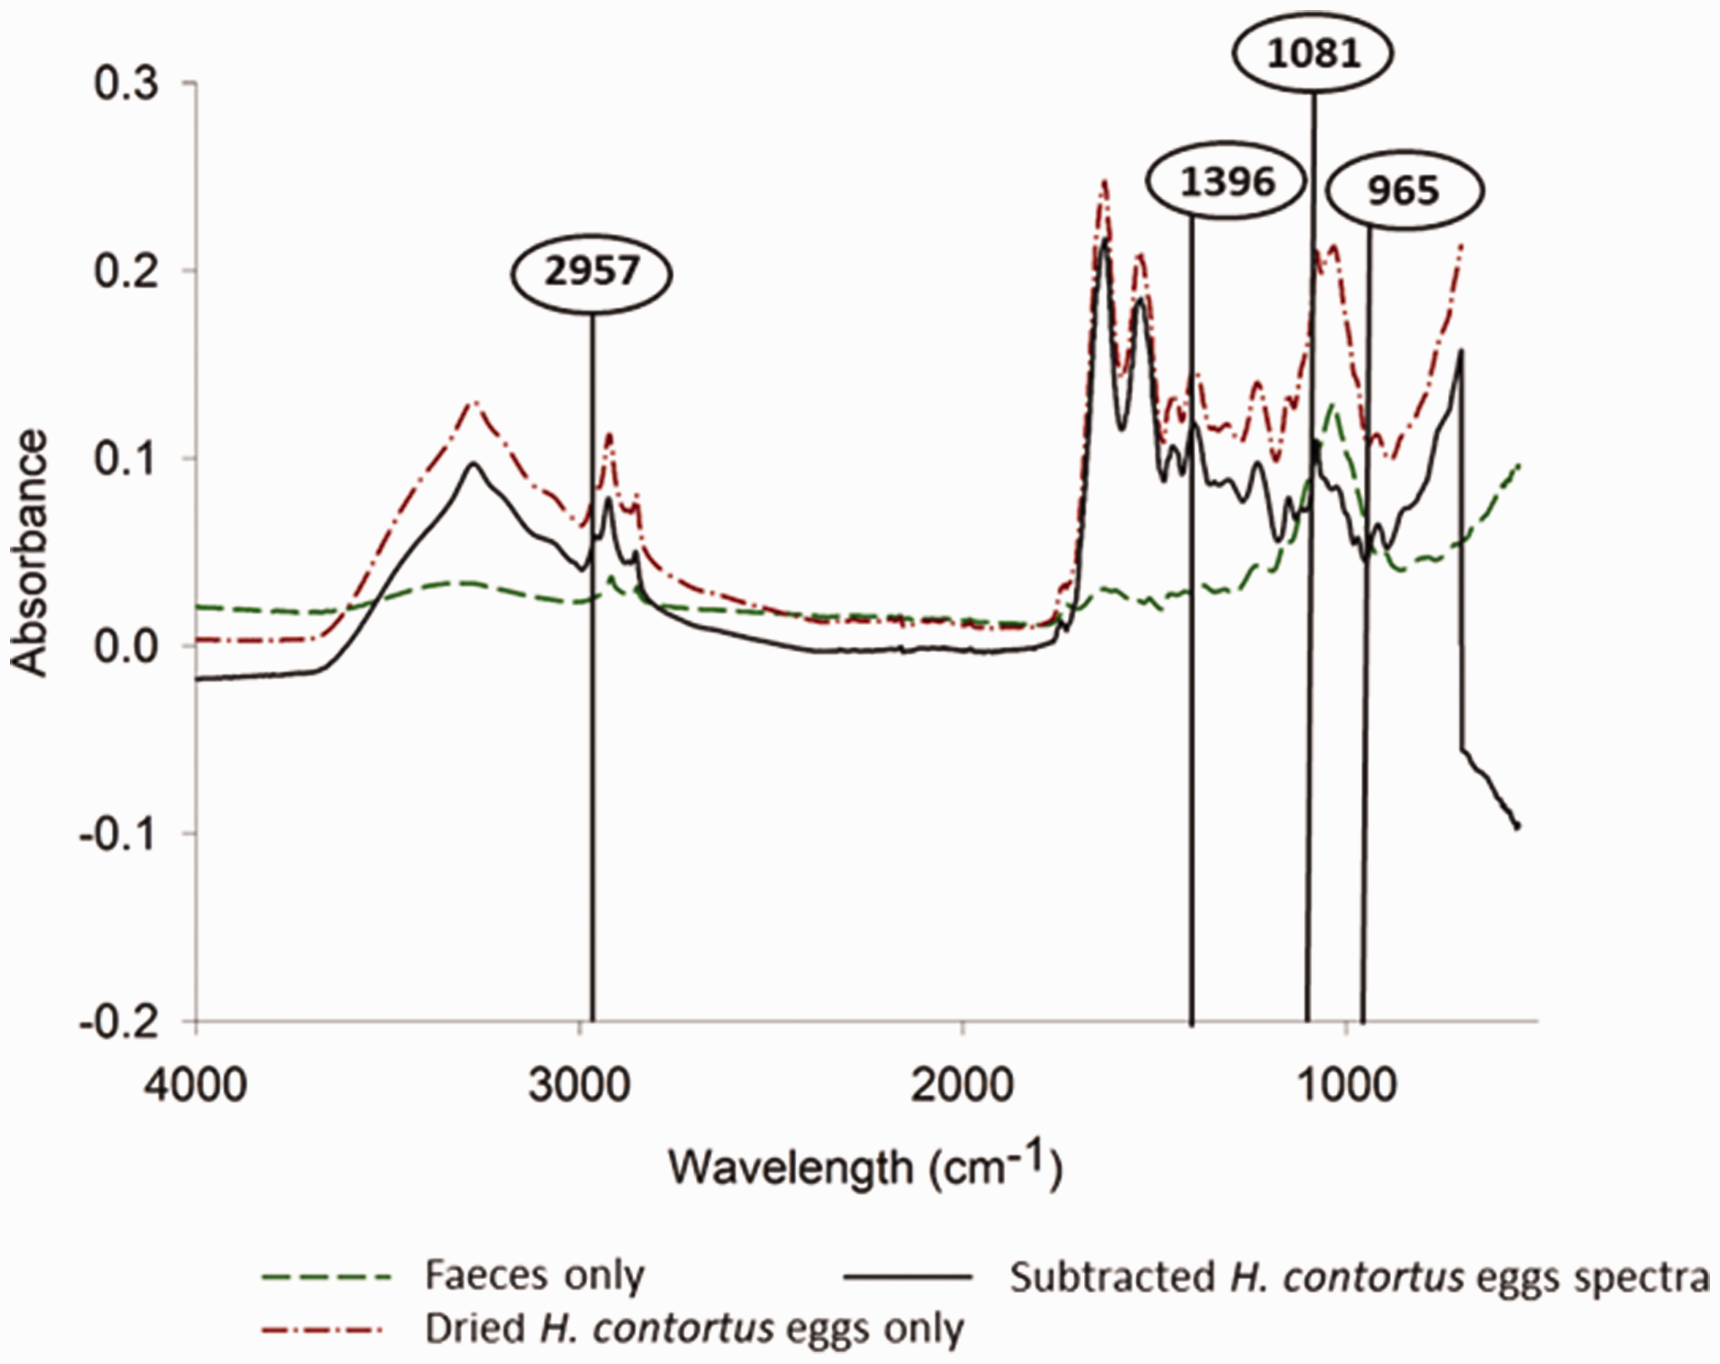
Plot of mid-IR spectra measured using ATR–FTIR spectroscopy for dried H. contortus eggs, sheep faeces only and resulting spectra of dried H. contortus eggs subtracted from faeces only. Circled wavenumbers showed potential bands associated with H. contortus eggs.
H. contortus eggs in moist faeces
NIR spectroscopy was used in this experiment to detect and quantify H. contortus eggs at various concentrations in moist sheep faeces. In a commercial sheep flock, FWEC above 1000 epg in moist faeces typically warrant immediate anthelmintic treatment, while at FWEC of 500–600 epg, the decision to provide anthelmintic treatment will depend on a range of factors associated with individual farm management and climatic conditions. 36 For this study, a more conservative threshold for anthelmintic treatment was set at 650 epg, and counts with <650 epg were regarded as mild infection, not needing immediate treatment and requiring further consideration of other factors. The averaged raw spectra of ground faeces containing various concentrations of H. contortus eggs scanned as a slab are shown in Figure 8. Given that the eggs were scanned in moist faeces, two large bands around 1450 and 1930 nm of the NIR region are present which correspond to the –OH bonds in water.
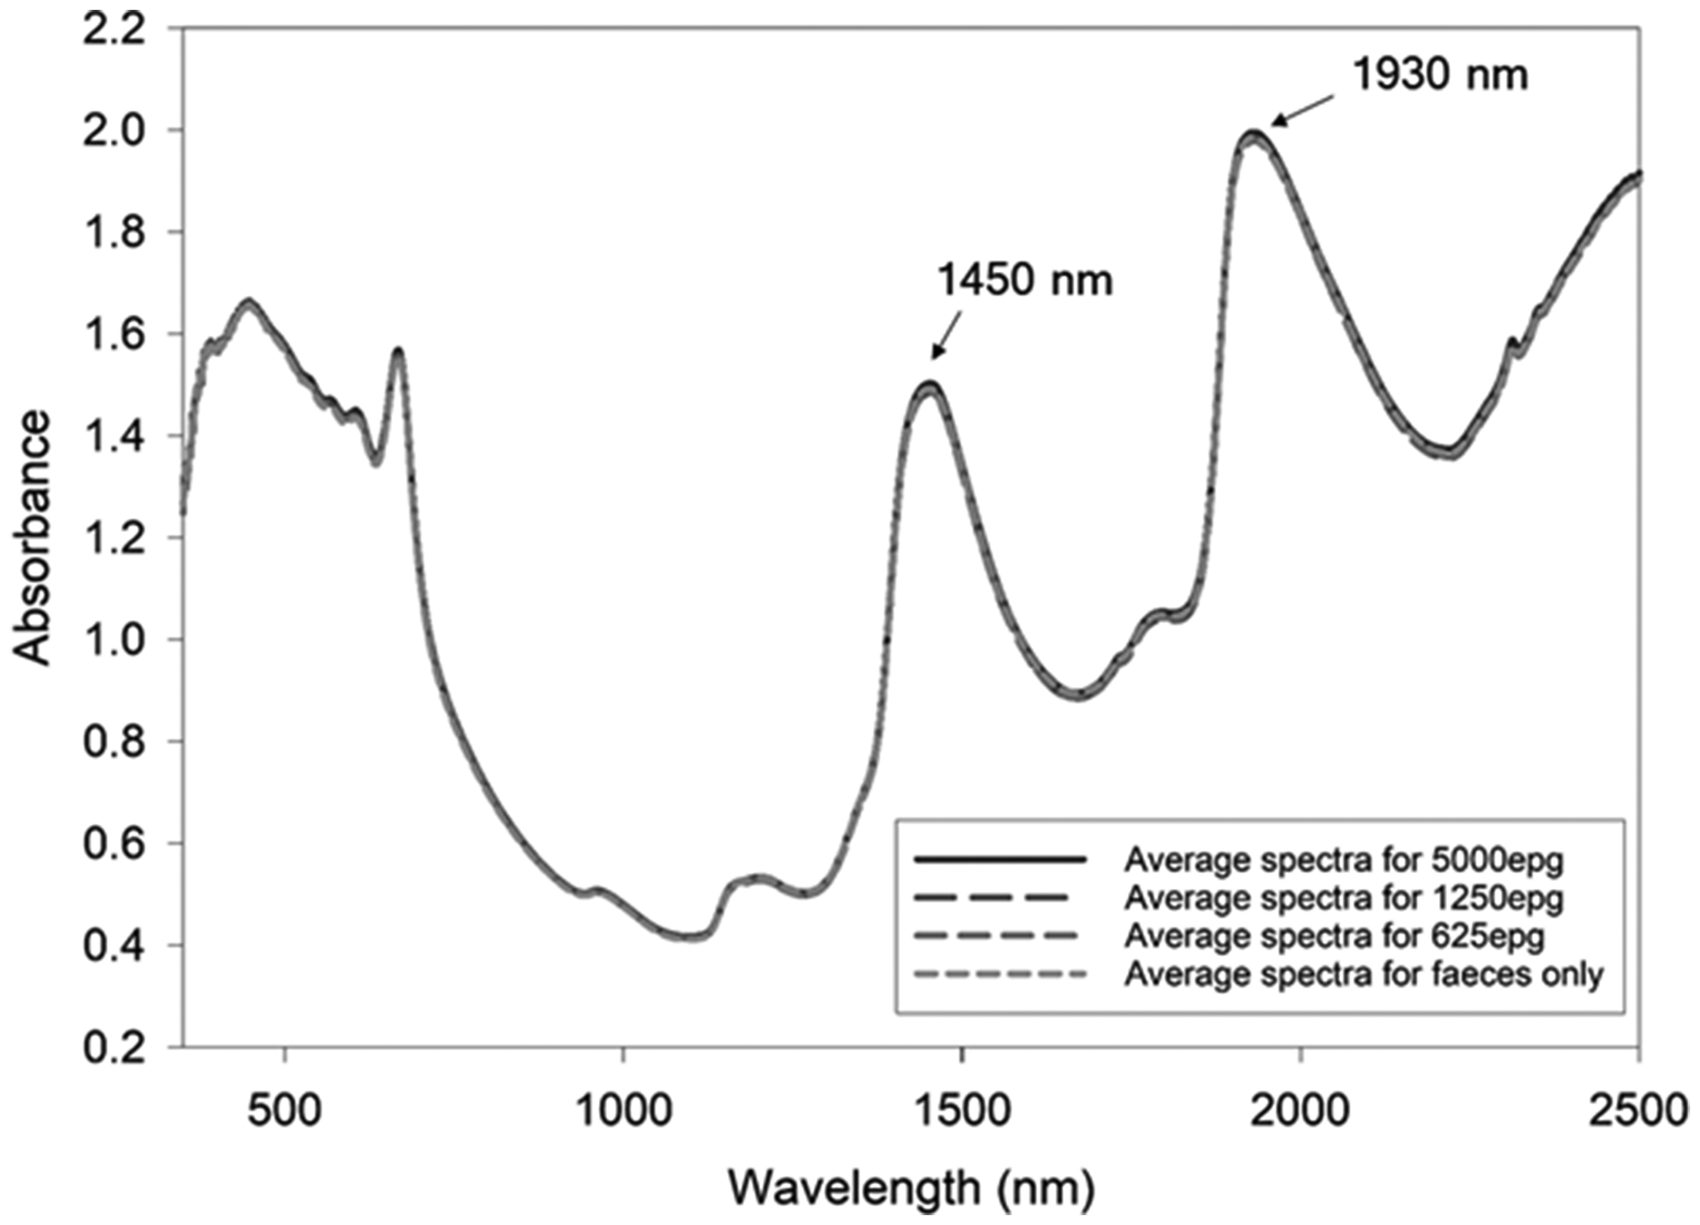
Raw average spectra profile of moist, ground sheep faeces containing 0–5000 epg of H. contortus eggs scanned as a ‘slab’ using the Malvern Panalytical QualitySpec Trek spectrometer. Bands at 1450 and 1930 nm correspond to the –OH bond in water.
The averaged NIR spectra for the samples were further pre-processed using MSC filtering and analysed by PCA to determine the spectral difference between samples. Figure 9 shows the score and loading plot of PC-1 (78%) versus PC-2 (18%) for the MSC-treated average spectra acquired using the QST spectrometer for H. contortus eggs at different concentrations within a slab. The score plot shows clear separation between the averaged spectra. However, no useful information relating to H. contortus eggs was identified in the loading plot. Since the H. contortus eggs were scanned in moist faeces, the presence of moisture in varying amounts could have caused shifts in bands and masked important features in faecal samples.37–39
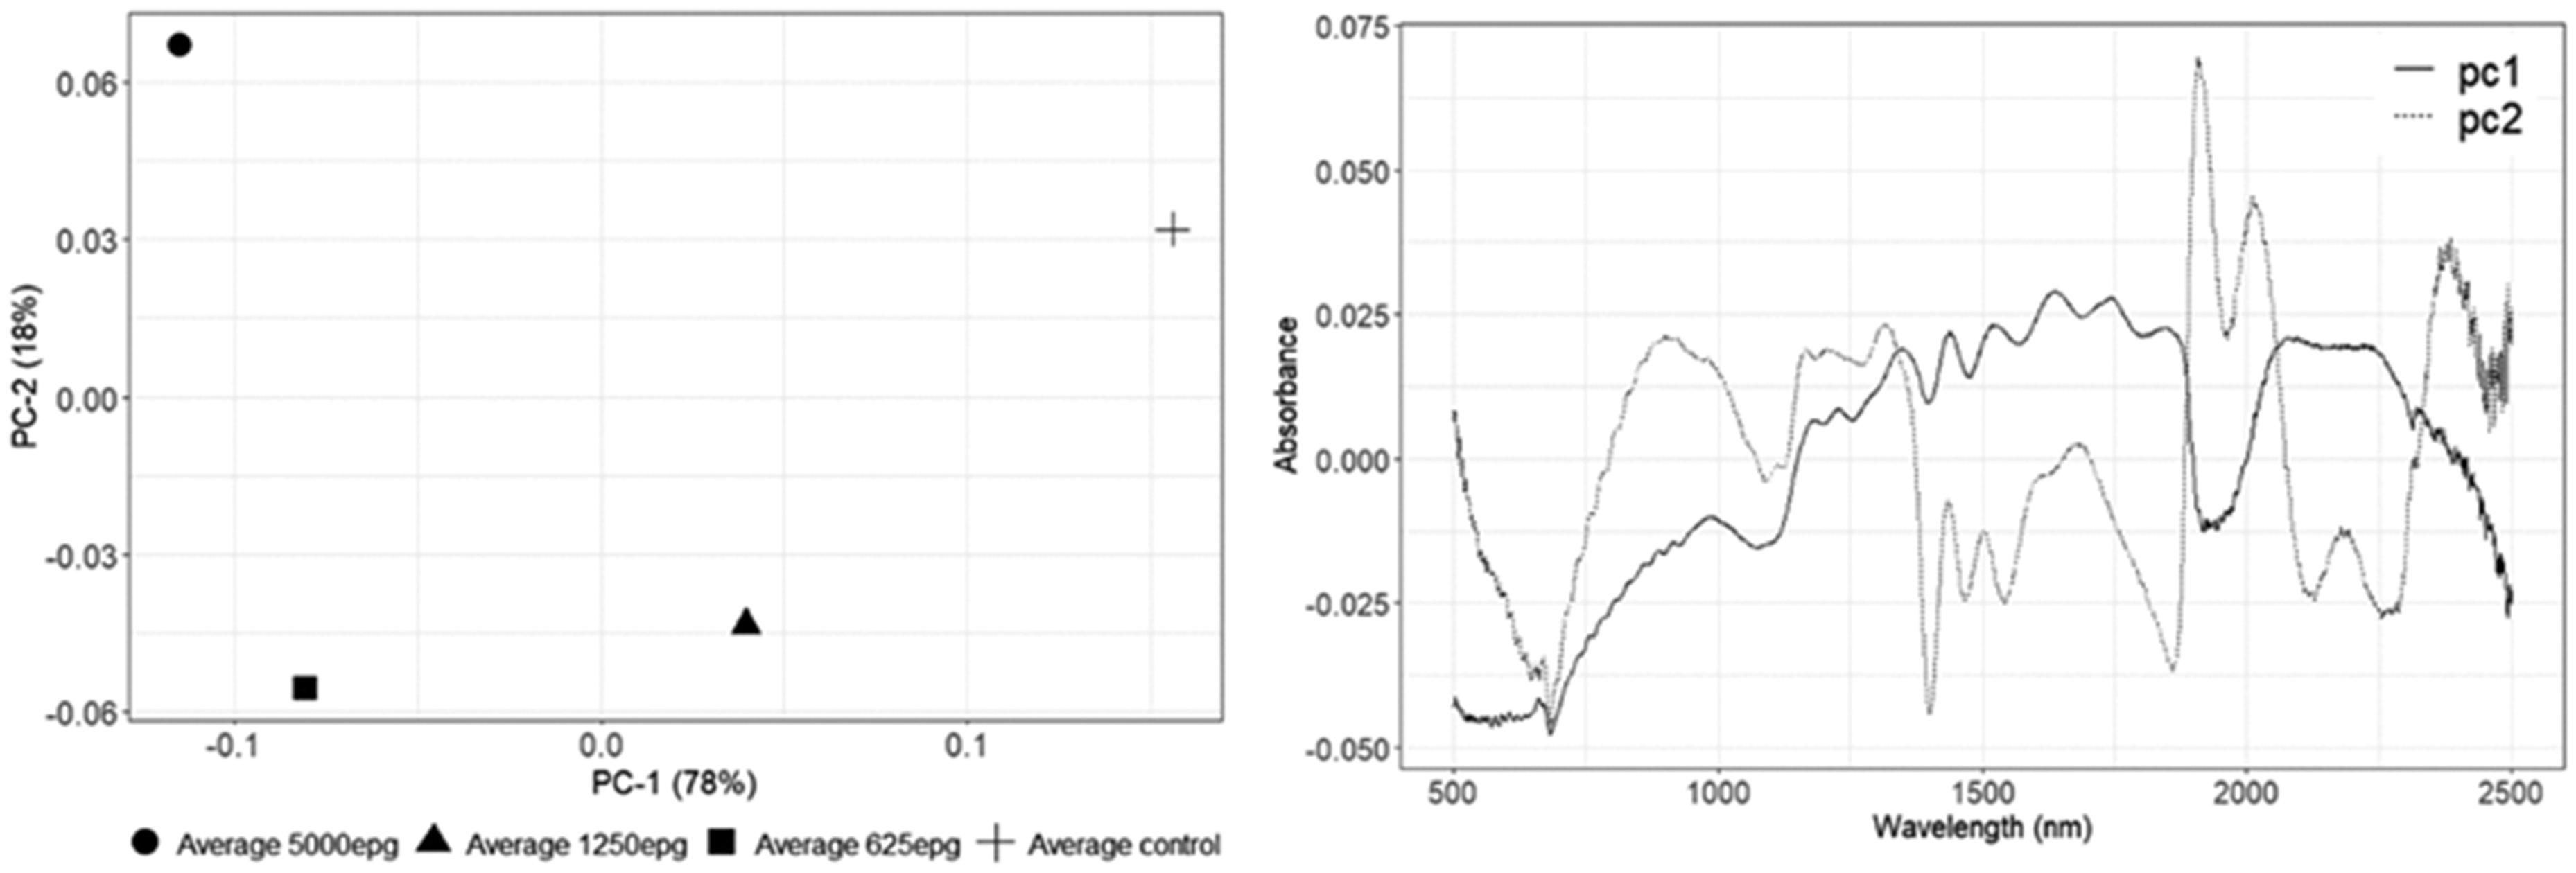
Scores plot (left) and loading plot (right) of PCA showing the first and second principal components obtained from the averaged multiplicative scattering corrected NIR spectra of 0–5000 epg H. contortus eggs scanned in moist, ground sheep faeces within the wavelength range of 500–2500 nm. Spectra were acquired using the Malvern Panalytical QualitySpec Trek spectrometer.
H. contortus eggs in dried faeces
In an attempt to minimize the strong influence of the –OH bond from water, we used ground faeces containing various concentrations of H. contortus eggs that were dried prior to NIR measurements. Due to the low signal-to-noise ratio for samples measured with the Bruker MPA spectrometer, calibration models were built for the regions between 10,000 and 4000 cm−1 (1000–2500 nm).
Various pre-processing methods were analysed using PLS regression to obtain the best calibration model for the data collected. Tables 1 and 2 summarize these results with the optimum number of factors, R 2 cal, RMSEC, r 2 cv and RMSECV for samples measured with the Bruker MPA instrument and the QST, respectively. Of the pre-processing methods tested, SNV–DT produced the calibration model with the highest R 2 cal (R 2 cal < 0.47) and the lowest standard error (RMSEC < 0.92 transformed epg, equivalent to <103 epg). Bands previously identified in the ‘H. contortus in water suspension’ section that were not correlated to water bands (∼1890, 1905 and 2030 nm) appeared from the fourth factor loadings onwards, where the impacts of variances observed were less than 10% (Figure 10). The majority of the variance observed for the models established was explained by the –OH bonds in water observed in the first factor loading. Overall, the calibration regression values were poor (R 2 cal ≤ 0.47) for all pre-processing methods at the different various wavelength regions measured using the two different NIR spectrometers.
The results for calibration and cross-validation models for the prediction of LnFWEC in dried and ground sheep faeces performed with various pre-processing methods at different wavelength regions.
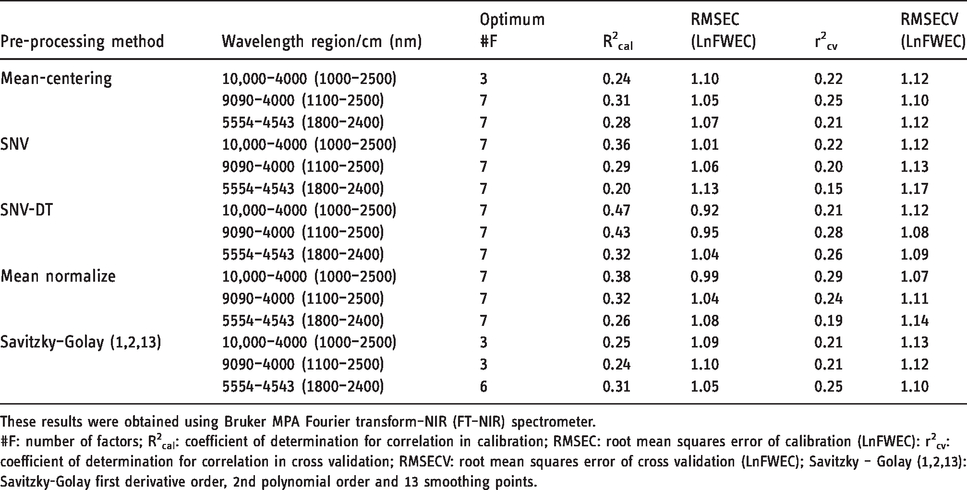
These results were obtained using Bruker MPA Fourier transform–NIR (FT–NIR) spectrometer.
#F: number of factors; R 2 cal: coefficient of determination for correlation in calibration; RMSEC: root mean squares error of calibration (LnFWEC): r 2 cv: coefficient of determination for correlation in cross validation; RMSECV: root mean squares error of cross validation (LnFWEC); Savitzky – Golay (1,2,13): Savitzky-Golay first derivative order, 2nd polynomial order and 13 smoothing points.
The results for calibration and cross-validation models for the prediction of LnFWEC in dried and ground sheep faeces performed with various pre-processing methods at different wavelengths.
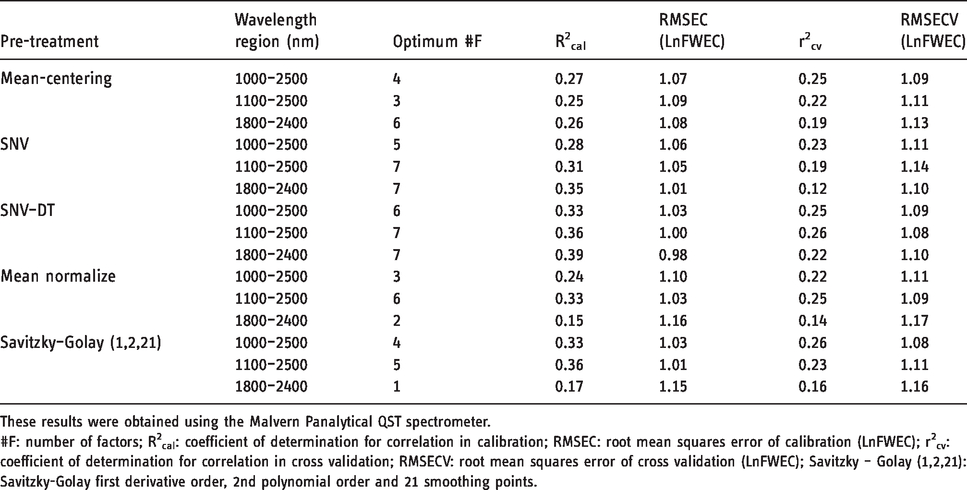
These results were obtained using the Malvern Panalytical QST spectrometer.
#F: number of factors; R 2 cal: coefficient of determination for correlation in calibration; RMSEC: root mean squares error of calibration (LnFWEC); r 2 cv: coefficient of determination for correlation in cross validation; RMSECV: root mean squares error of cross validation (LnFWEC); Savitzky – Golay (1,2,21): Savitzky-Golay first derivative order, 2nd polynomial order and 21 smoothing points.
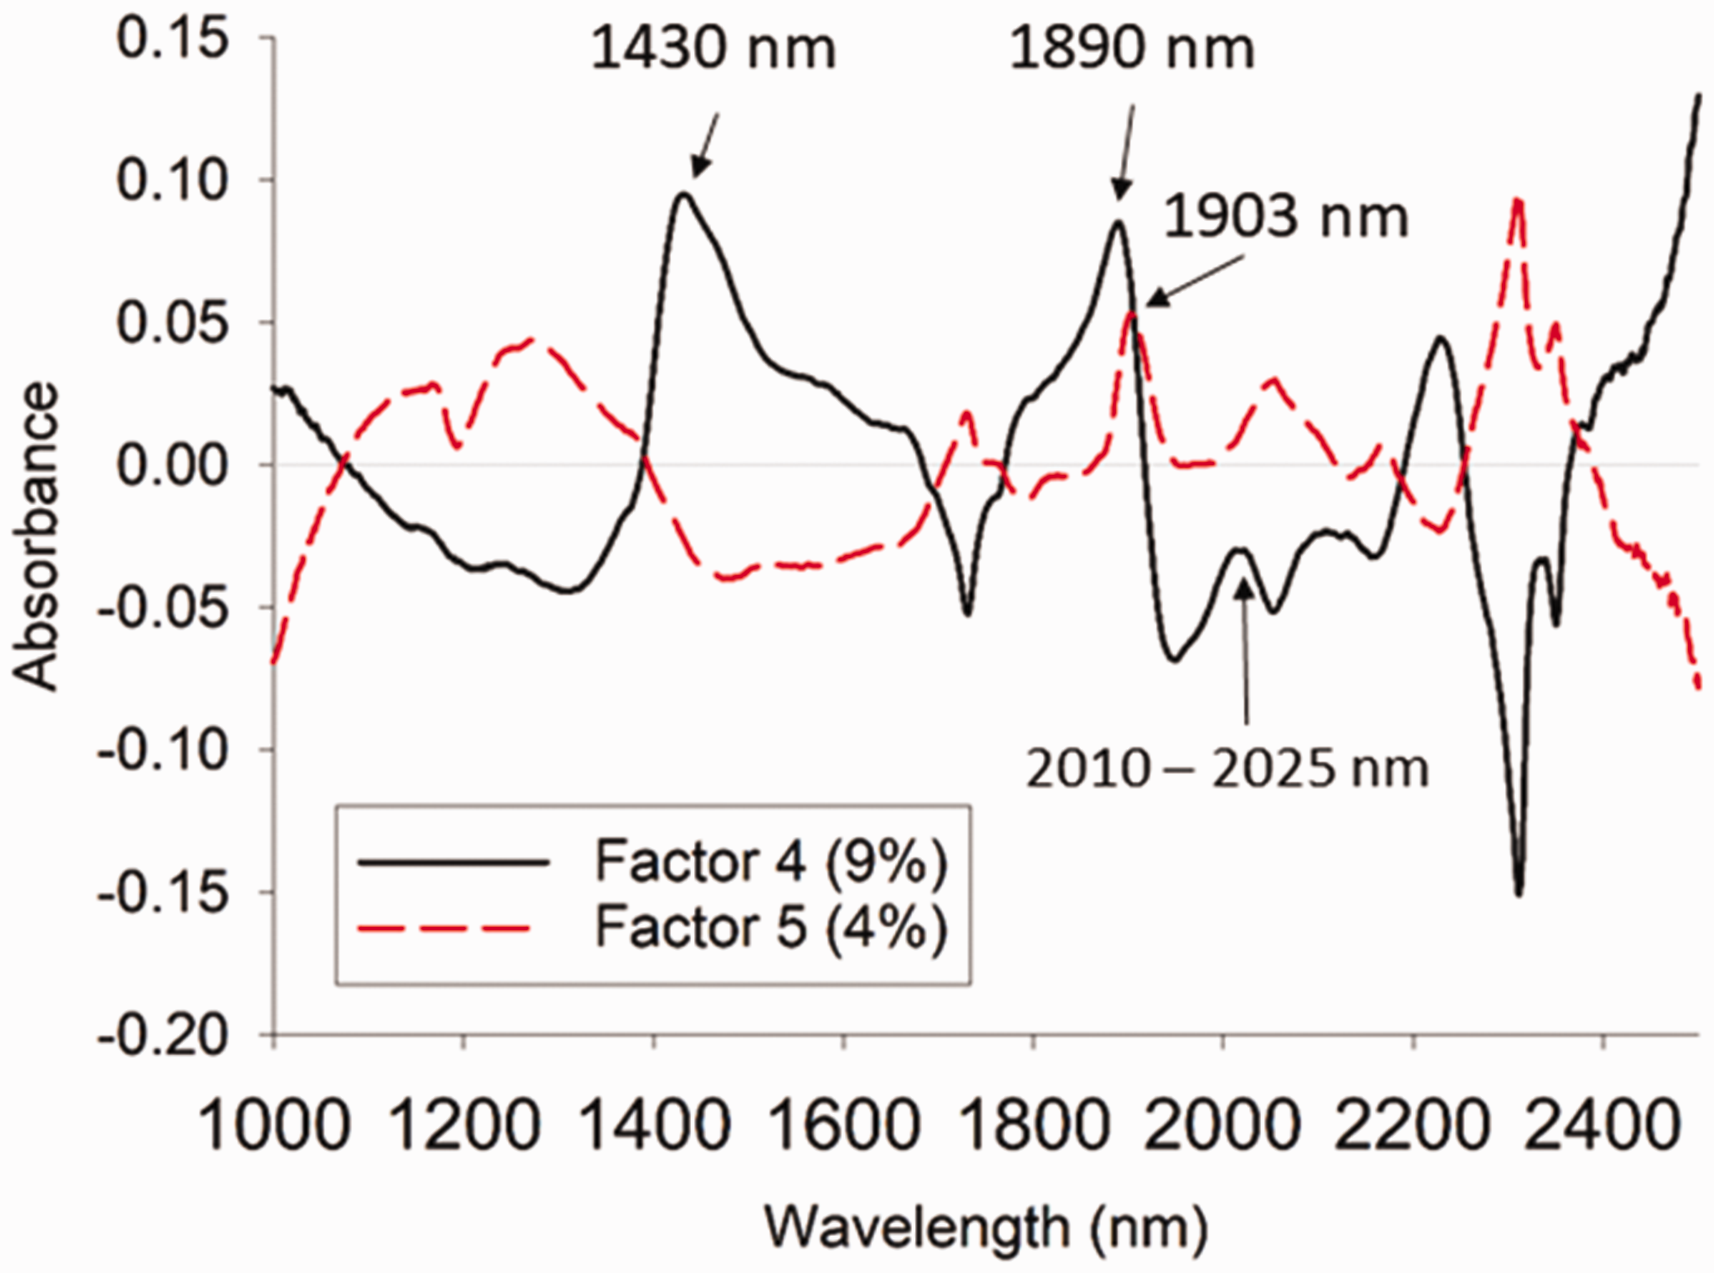
Loadings plot of SNV – detrend spectra showing major absorbance peaks of water (∼1430 and 2230 nm) and potential bands of H. contortus eggs (∼1890 and 2010–2025 nm) generated from PLS regression for faecal samples containing various concentrations of H. contortus eggs within the region of 1000–2500 nm.
Due to the complex matrix of faecal samples, both the Bruker MPA and the portable QST NIR spectrometers failed to produce reliable calibration models when H. contortus eggs were added into sheep faeces. It was found that the R 2 cal improved as the optimum factor number was increased above seven factors. However, loading plots from all calibration models indicated that models developed using four factors or more included a higher percentage of background noise, and RMSEC values were higher than values reported in Tables 1 and 2, which compromises the value of the models. A peak at approximately 1880 nm was observed in all calibration models, indicating that the NIR spectroscopy has the potential to identify H. contortus eggs in sheep faeces. However, this peak accounted for less than 2% of the total variance observed for the models. This suggests that the small variations observed for different concentrations of H. contortus eggs may be overshadowed by the large heterogeneities in faecal material originating from factors other than H. contortus eggs, such as diet components, water and/or environmental factors. This appeared to limit the ability of NIR spectroscopy to provide accurate quantification of nematode eggs in sheep faeces for practical application. Calibration models were also built with focus on the egg region (1800–2400 nm), but prediction accuracies did not show any improvement using this analysis.
Conclusion
Efficient detection of gastrointestinal worm infections in livestock is crucial for the implementation of optimal control programs and especially for the timely administration of anthelmintic treatments. In addition to maintaining animal health, optimal timing of targeted anthelmintic administration is necessary to minimize further selection for drug resistance in worm populations. The currently used method of quantifying H. contortus infections in sheep by counting eggs using microscopy is tedious and requires specialist expertise. NIR spectroscopy represents a faster and potentially more accurate alternative for diagnosing gastrointestinal nematode infections. Results from this study showed that both NIR and mid-IR spectroscopies were able to detect bands corresponding to functional chemical groups of the H. contortus eggs when the eggs were presented in water. However, when the H. contortus eggs were combined within the complex matrix of sheep faeces at concentrations representative of infection burdens on farm, 36 NIR spectroscopy failed to produce a robust calibration model. These results suggest that the spectral signals from eggs may be overshadowed by the signals of other materials within sheep faeces, such as dietary components. Hence, while we have demonstrated for the first time that NIR spectroscopy can detect H. contortus eggs in water, the potential of this method for field use appears to be limited by variations in faecal composition, faecal moisture and the particle size of faecal materials. Given these limitations, other spectroscopic and sample preparation methods that may be able to give more accurate predictions of nematode infestation levels should be explored.
Footnotes
Authors’ Note
Glen P Fox is also affiliated with Department of Food Science and Technology, University of California, Davis, CA, USA.
Acknowledgements
The authors gratefully acknowledge Drs Peter Hunt and Marielle Babineau at the CSIRO FD McMaster laboratory, Armidale, NSW, for kindly supplying the faecal samples used in the present study. They also thank Malvern Panalytical ASD Goetz instrument support program for the availability of the QualitySpec Trek instrument.
Declaration of conflicting interests
The author(s) declared no potential conflicts of interest with respect to the research, authorship, and/or publication of this article.
Funding
The author(s) disclosed receipt of the following financial support for the research, authorship, and/or publication of this article: EK was supported by The University of Queensland Peel Fellowship during the conduct of this work.