
Abstract
Spectroscopy provides a new proxy for reconstructing prehistoric raw-material procurement, mobility, and inter-settlement interaction, through linking archaeological stone tools to specific quarry sources. In this paper, spectral responses have been analyzed using chemometric methods, particularly principal component analysis (PCA) and t-distribution stochastic neighbour embedding (t-SNE), to capture meaningful differences between quartz and quartzite raw materials and to analyse possible relationships between archaeological stone tool assemblages and quarries. Field adapted near infrared reflectance (NIR) spectroscopy and X-ray fluorescence (XRF) instruments have been used to analyse prehistoric quartz and quartzite quarries in inland Västerbotten (Sweden), and the collected spectral data were compared with tool assemblages from curated archaeological collections. Despite challenges inherent to field sampling, the combined spectroscopic approach reliably differentiates raw material groups, demonstrating its suitability for archaeological prospection and excavation. These findings underscore the value of integrating spectroscopy into routine fieldwork, providing a modern analytical toolkit that expands the interpretive potential of archaeological fieldwork.
Introduction
The study of raw material use in archaeology provides a fundamental basis for interpreting past technological strategies, mobility patterns, and systems of resource organisation. Patterns of raw-material selection and tool production represents cultural preferences, functional requirements, and the spatial distribution of accessible geological resources.1,2 Identifying and characterising the geological origins of lithic materials enables reconstruction of procurement strategies, evaluation of territorial behaviour and assessment of the scale and organisation of exchange networks. 3 Raw-material studies therefore contribute not only to technological analyses but also to broader anthropological questions concerning knowledge transmission, technological organisation, cultural identity and the choices these represent. 4
Recent analytical developments in petrography, X-ray fluorescence (XRF), and near infrared (NIR) spectroscopy, have substantially improved the precision with which lithic materials can be classified and traced.5–8 The application of non-invasive spectroscopy in archaeology is becoming increasingly common.9,10 However, previous research has primarily addressed the geochemistry of stone tool assemblages in relation to their spatial and temporal distribution.5,11 Although spectroscopic methods have been applied to prehistoric stone materials in provenance studies, these have concentrated predominantly on chert and obsidian materials and their geological sources.6,7,12–16
In the context of prehistoric northern Sweden, quartz and quartzite were of considerable importance as raw materials, as indicated by their intensive use in tool production. This article focuses on the use of quartz and quartzite as raw materials in the inland of Västerbotten, Sweden (Figure 1), from the Mesolithic (7000–4200 BCE) through the Neolithic (4200–2000 BCE) and into the Epi-Neolithic (2000 BCE–800 CE).17,18 Overview of the Malgomaj and Vojm lake area in the northwest with the Ångerman River drainage southeast. Archaeological sites and quarries are plotted (L-number in database, Swedish Open Cultural Heritage).
Spectroscopic analyses of quarries and artefact materials have been conducted, as a proxy for past human movement patterns and/or interactions. The ability to assign prehistoric stone tools to specific geological sources and/or classify the raw material used for toolmaking, based on chemical composition, represents a significant advancement in reconstructing mobility, procurement strategies, and intra- and inter-group interactions. For such analyses to be effective in field settings, portable and robust instrumentation is essential, as potential quarry sites must be analyzed in the field. A necessary preliminary step is therefore to evaluate whether spectroscopic methods can reliably classify quartz and quartzite when comparing field and laboratory results. Once the methodology is validated, broader questions regarding prehistoric survival strategies can be addressed. In this way, spectroscopic analysis offers the potential to employ geo-chemistry as a proxy for multiple aspects of prehistoric human behaviour.
The study area (Figure 1) is located in the pre-mountainous woodland area in Västerbotten, Sweden. The geology of the Scandinavian Mountain range was formed through a collision between the plates of Svecofennian orogeny and North American craton, roughly 500 million years ago,19,20 during which the North American craton pushed part of the sea bed on to the Svecofennian orogeny, resulting in a “folding” action of the North American craton that would become the Scandinavian Caledonides, covering a large part of what we now know as Norway and parts of Western Sweden.
20
This folding resulted in variations of the bedrock, in the form of striations in a North-Northeastern to South-Southwestern orientation (Figure 2). Later glaciation periods would erode the mountain range to their current rounded form and redistributed rock-materials including crushed materials (moraine deposits), blocks and boulder erratics, south-eastwards along the river valleys towards the lowlands.21–24 Sourcing dispersed raw materials obviously will be challenging. Geological map of the study area, highlighting significant geological features of the Scandinavian Caledonides and the Svecofennian orogeny. Main categories of geological information are presented to show the Southwest to Northeast striations caused during the creation of the Scandinavian Caledonides (to the west). The full complexity of geology in this area can be found in 25.
Objective
The objective of this study is to investigate source provenance and material interrelations of archaeological stone tools on a local scale (quartz and quartzites), with the broader aim of reconstructing prehistoric raw-material procurement, mobility patterns, and human interaction and exchange. Near infrared reflectance spectroscopy was applied to classify materials based on their spectral characteristics, and XRF was used as a complementary technique to analyze elemental composition.
By classifying geological samples according to their chemical and spectral signatures and relating these patterns to the respective archaeological site/sites, this study explores how spectroscopic methods can identify connections, not visible to the naked eye and/or disconnects between archaeological sites and identify temporal and spatial variation in material use. Furthermore, in this study the applicability and limitations of portable spectroscopic instruments in both field and laboratory settings is discussed.
In this paper we address the challenges of spectroscopic in situ analyses of archaeological quartz and quartzite quarries as opposed to laboratory conditions. Additionally, the ways in which spectroscopic methods can contribute to archaeological interpretations of spatial and stratigraphic patterns in quartz and quartzite tool distributions are explored.
Materials & methods
A complete listing of samples used. Sites with the same L-number (as in database, Swedish Open Cultural Heritage) are in some instances considered as one site with multiple erratic boulders, the boulders have been divided into subcategories (as is the case for L1937:3913-2), in order to differentiate different erratic boulders.
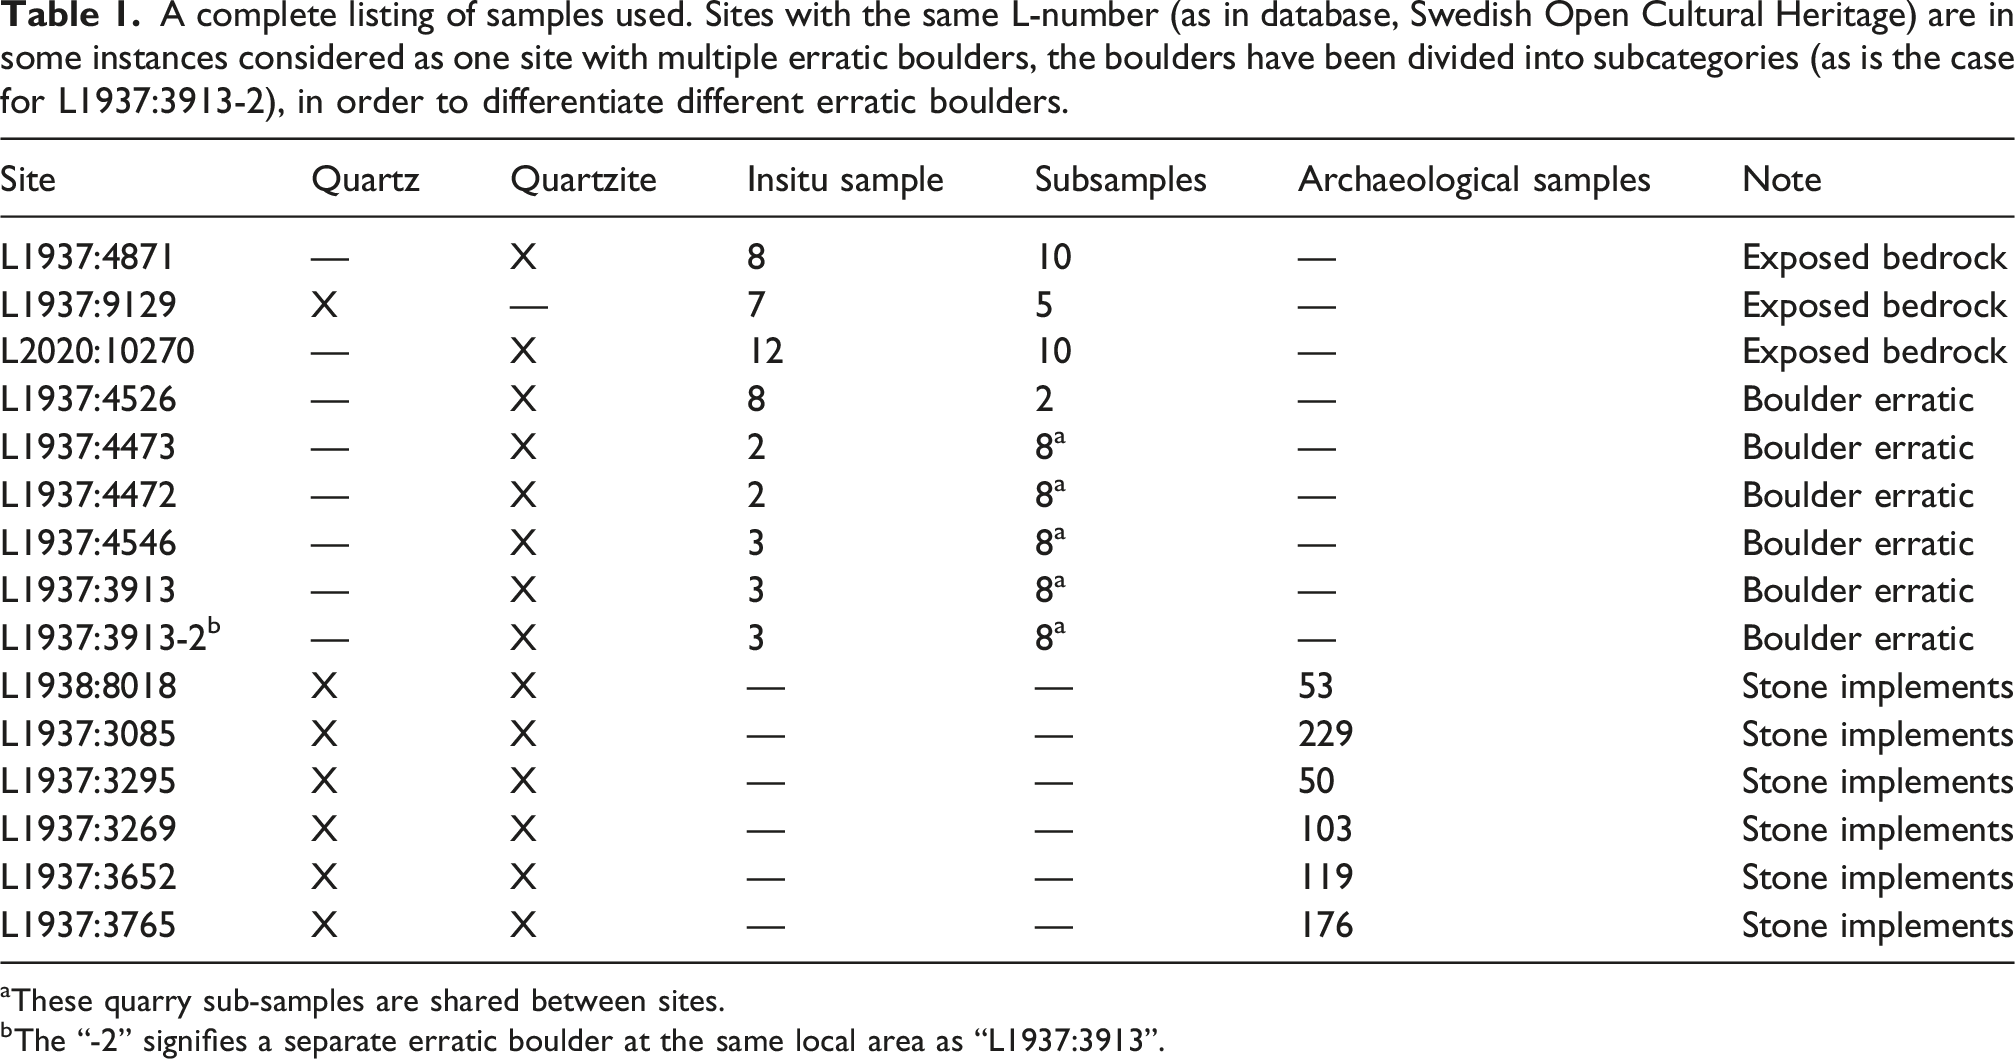
aThese quarry sub-samples are shared between sites.
bThe “-2” signifies a separate erratic boulder at the same local area as “L1937:3913”.
Added to the data set above are 730 archaeological artefact objects retrieved during earlier excavations (referred to as the Archaeological Samples), stored at the Västerbotten Museum, Umeå, Sweden (Table 1). From these, five readings per object were acquired using MicroNIR (3650 readings in total).
Near infrared reflectance spectroscopy
NIR spectra were acquired with a MicroNIR 1700 ES spectrometer equipped with a 4 mm × 5 mm spot sensor and a sample contact surface with a diameter of 15 mm (Viavi Solutions Inc, Chandler, AZ, United States), operating over the wavelength range of 908–1676 nm with a 128 pixel array and a bandwidth of 1.2%. The MicroNIR 1700 ES supports a spectral resolution of <3 nm and a standard deviation of wavelength placement within ∼ 1 nm. Dark current and white reference were both collected at 5 min intervals during data acquisition, using a protected VIAVI 99% reflectance (R99) spectralon standard. The instrument records reflected radiation as intensity values at discrete wavelengths, which were converted to absorbance by normalization to the reference intensity (n/R). Spectral data below 1000 nm were removed due to high noise levels and to prevent colour-related information from influencing the modelling.
The MicroNIR 1700 ES probe is designed for measurements on flat surfaces, which necessitates shielding the instrument from direct sunlight during fieldwork, as rock surfaces are seldom perfectly planar. In addition, the small measurement spot of the MicroNIR detector requires multiple readings when analysing larger artefacts or surfaces to obtain a representative spectrum. A composite sampling strategy was therefore adopted, as this approach effectively captures the average spectral signature of a specimen and reduces variation arising from intra-sample.25,26 Composite sampling involves combining several smaller sub-samples taken from different parts of a material into a single representative measurement. 25 To emulate this sampling strategy without physically homogenizing the artefacts, each archaeological, reference and quarry sub-sample sample was scanned five times, and the resulting spectra were averaged to produce one composite spectrum per sample. 27 This also reduces the impact of any missing or corrupted individual scans. In contrast, each in situ quarry observation was acquired in a single measurement, allowing assessment of surface heterogeneity across exposed quarry faces. 28
Surface conditions such as moisture, erosion, and biological growth (e.g., lichens) can significantly affect the quality and interpretability of NIR measurements collected in the field. Surface moisture can attenuate or obscure diagnostic absorption features by increasing overall reflectance variability and introducing water-related bands, potentially masking the intrinsic chemical signals of the sample. Physical and chemical erosion can modify surface texture and mineral exposure, causing spectra to deviate from those of unaffected material. In such cases it is advisable to sample areas with an obvious break or overhang, if possible. Similarly, lichens and other biological material can introduce organic absorption features and can physically obscure the sample material, resulting in mixed or non-representative spectra. Although such effects can often be mitigated through careful cleaning or preprocessing, these constitute an inherent challenge in field-based NIR spectroscopy and should be considered when interpreting the resulting data.
X-ray fluorescence (XRF)
Elemental analyses were conducted using a Thermo Scientific Niton XL5 XRF analyzer (Waltham, MA, USA) equipped with an 8 mm spot sensor. For the purpose of this study, the mining mode calibration as provided by the supplier was used. 29 The integration time was set to 160s and a standardised calibration sample (Alloy: AA 6061, Part Number: 195-020 G) provided by the XRF supplier was consulted at regular intervals. XRF operates by irradiating samples with X-rays, which eject inner-shell electrons from constituent atoms. When outer-shell electrons transition to fill these vacancies, they emit characteristic fluorescent X-rays with energies specific to each element. The instrument detects and quantifies these X-rays, enabling determination of elemental composition based on the energies and intensities of the characteristic fluorescence peaks. 30
Due to a greater penetration depth relative to NIR, XRF measurements provide compositional data from approximately 1 cm beneath the sample surface, corresponding to an effective sampling volume of ∼1 cm3. Each archaeological and quarry sub-sample was measured once. For quarry in situ samples, XRF measurements were followed directly by NIR scans at the same location, allowing direct comparisons of chemical and spectroscopic signatures while accounting for local surface variations.
Chemometrics and data preprocessing
Spectral preprocessing and multivariate analyses were conducted in Evince software (Prediktera, Umeå, Sweden). 31 Prior to modelling, mean-centering was applied to the NIR dataset. By subtracting the global mean from each variable, mean-centering ensuring that variance beyond the mean structure is captured in the principal components. 32 Mean-centering effectively enhances interpretability by preventing the mean structure from dominating the projection and emphasizing patterns related to sample variability.32,33 Specimens were assigned to classes based on consistent patterns observed in the t-SNE analysis and supported by PCA results. These class assignments were exploratory and not part of a formal classification algorithm.
To minimize the influence of large elemental concentrations dominating the PCA scores of the XRF dataset, Unit Variance (UV) scaling was applied. This scaling approach divides each variable by its standard deviation, ensuring equal variance across all elements and enhancing detection of underlying relationships. 34
Due to the large amount of noise in the raw NIR spectra, a second-derivative Savitzky-Golay (SG) transformation was applied with a second order polynomial, and a symmetric window of 15 points on either side of the transformed point. The SG filter works well for spectral data (such as NIR) because it smooths high-frequency noise while preserving spectral shape features like peak height and width. 35 This is achieved by fitting a local polynomial to the data within a moving window and replacing each point with the calculated derivative at the centre of that window. As the transformation models the underlying spectral signal rather than simply averaging neighbouring points, it retains analytical characteristics such as peak shape and amplitude that are essential for subsequent multivariate analysis. 36
Dimensional reduction
Principal component analysis (PCA) was used to reduce data dimensionality and to facilitate exploration and interpretation. 37 In addition, t-distributed stochastic neighbour embedding (t-SNE) was applied in 3 dimensions, using a perplexity value of 10, as a nonlinear alternative for visualizing complex relationships. Unlike PCA, t-SNE preserves local similarity structures by embedding data into two or three dimensions based on probability distributions. 38 This approach enhances the visual expression of clusters and neighbourhood relationships, although it may obscure global structure, meaning that the relative positioning of clusters in the resulting score plots is arbitrary. 39
Outliers and exclusion methodology
NIR samples exhibiting extreme absorbance values (absorbance > 1.7 equivalent of ≈2% in absolute reflectance) were excluded from the dataset, as such measurements contain limited analytical information and may introduce bias into subsequent modelling. Removing spectra with excessive absorption also helped reduce noise and improve the reliability of downstream interpretation. For the XRF dataset, variables with concentrations consistently below the detection limit were removed from further analysis. Outlier detection and sample exclusion were carried out through exploratory data analysis using Evince software.
Results
The 108 XRF measurements (Figure 3) showed a largely homogeneous dataset, with some outliers that were subsequently excluded from further PC-modelling. In addition, one reading (L1937:4526:1-2) displayed extreme elemental concentrations and was identified as an outlier and was removed from the dataset (Figure 3) to prevent distortion of model outcomes. Boxplots (percentile) of Ca, Sr, Ti, Zr, V, Sn of the XRF-quarry measurements. Some outliers may be observed such as L1937:4526:1-2 that exhibits extreme values in several elements.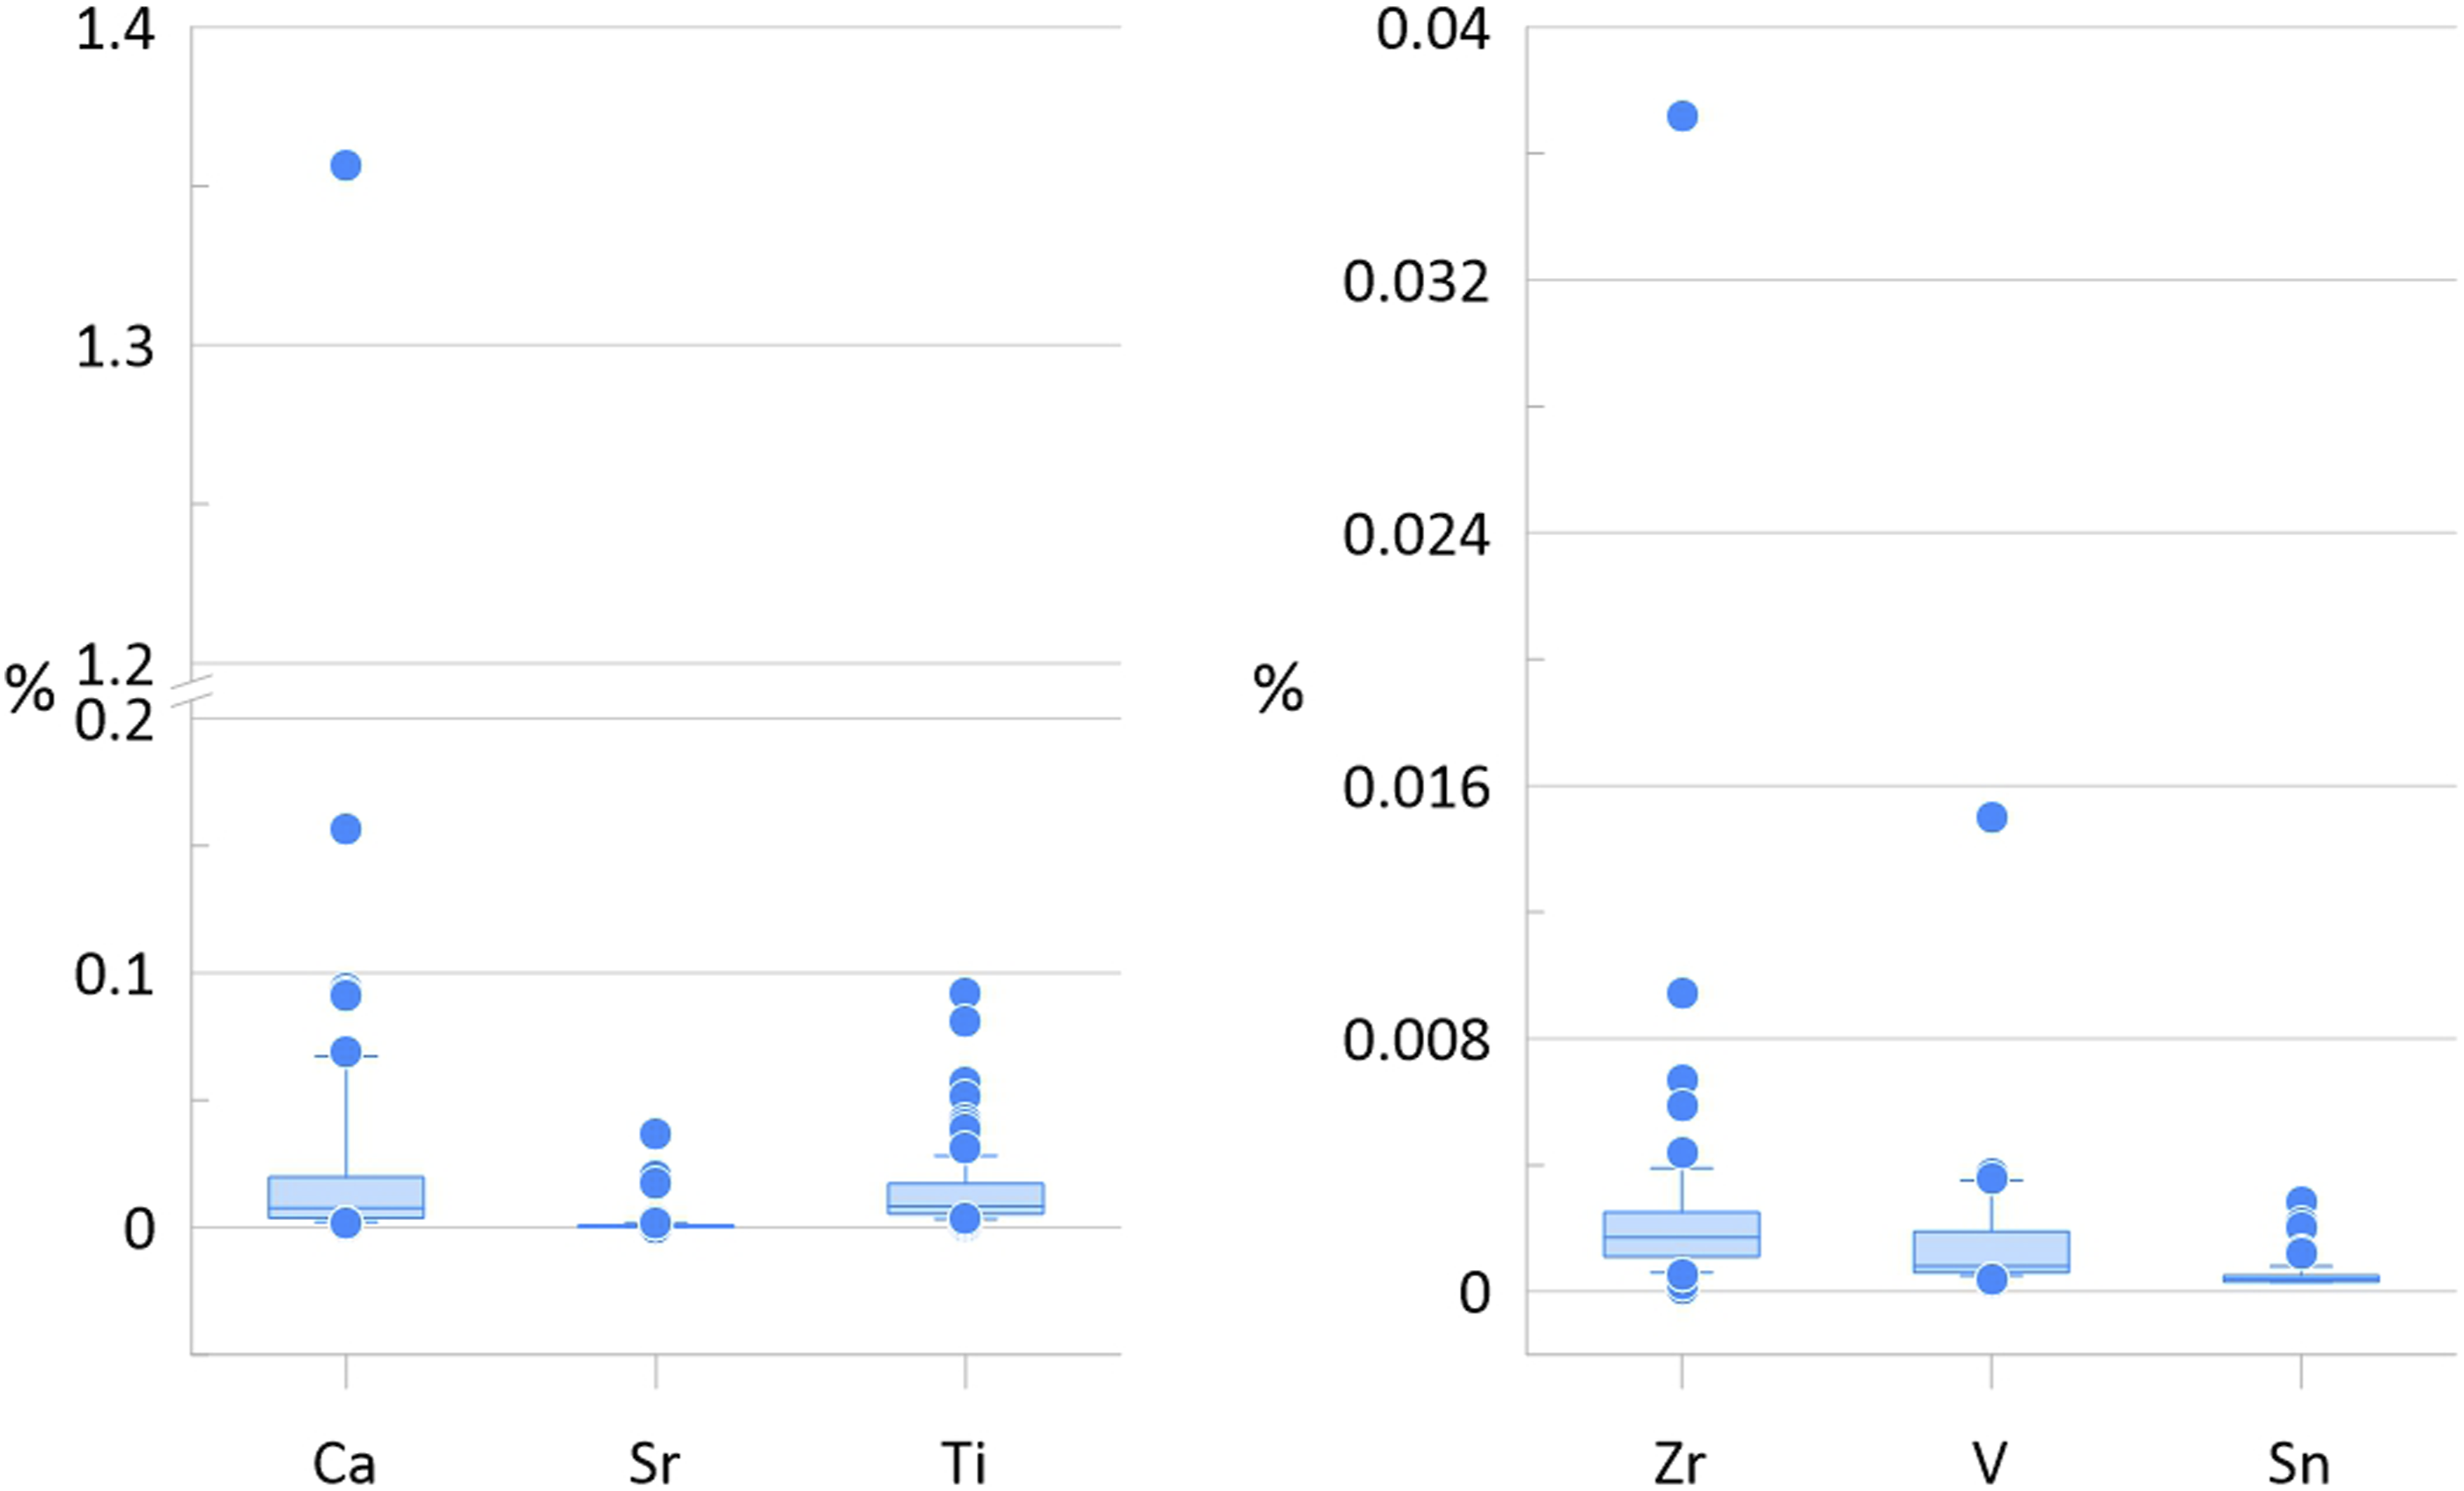
The extreme elemental values exhibited by the boulder erratic sample L1937:4526:1-2 likely resulted from the instrument measuring a sulfidic vein within the analysed specimen, explaining its divergence from the other readings derived from this quarry. Deviations related to the L1937:4526 quarry, shown in the XRF-derived PCA (Figure 4), may indicate that this “quarry” consists of five separate boulder erratics of potentially different geological origins. The boulder erratic samples L1937:3913.8, L1937:3913-2.11 and L1937:4526, which group with samples from the L1937:9129 quarry (exposed bedrock), were likely measured on quartz-rich veins within these erratics. This is consistent with L1937:9129 indeed being a quartz quarry. PCA bi-plot (scores and loadings) based on the XRF data from the in situ samples from the quarries, showing tight groupings of the quarries with some exceptions related to the 1153 site. PC1 and 2 can be seen to account for a comparatively small amount of the total variance in the dataset.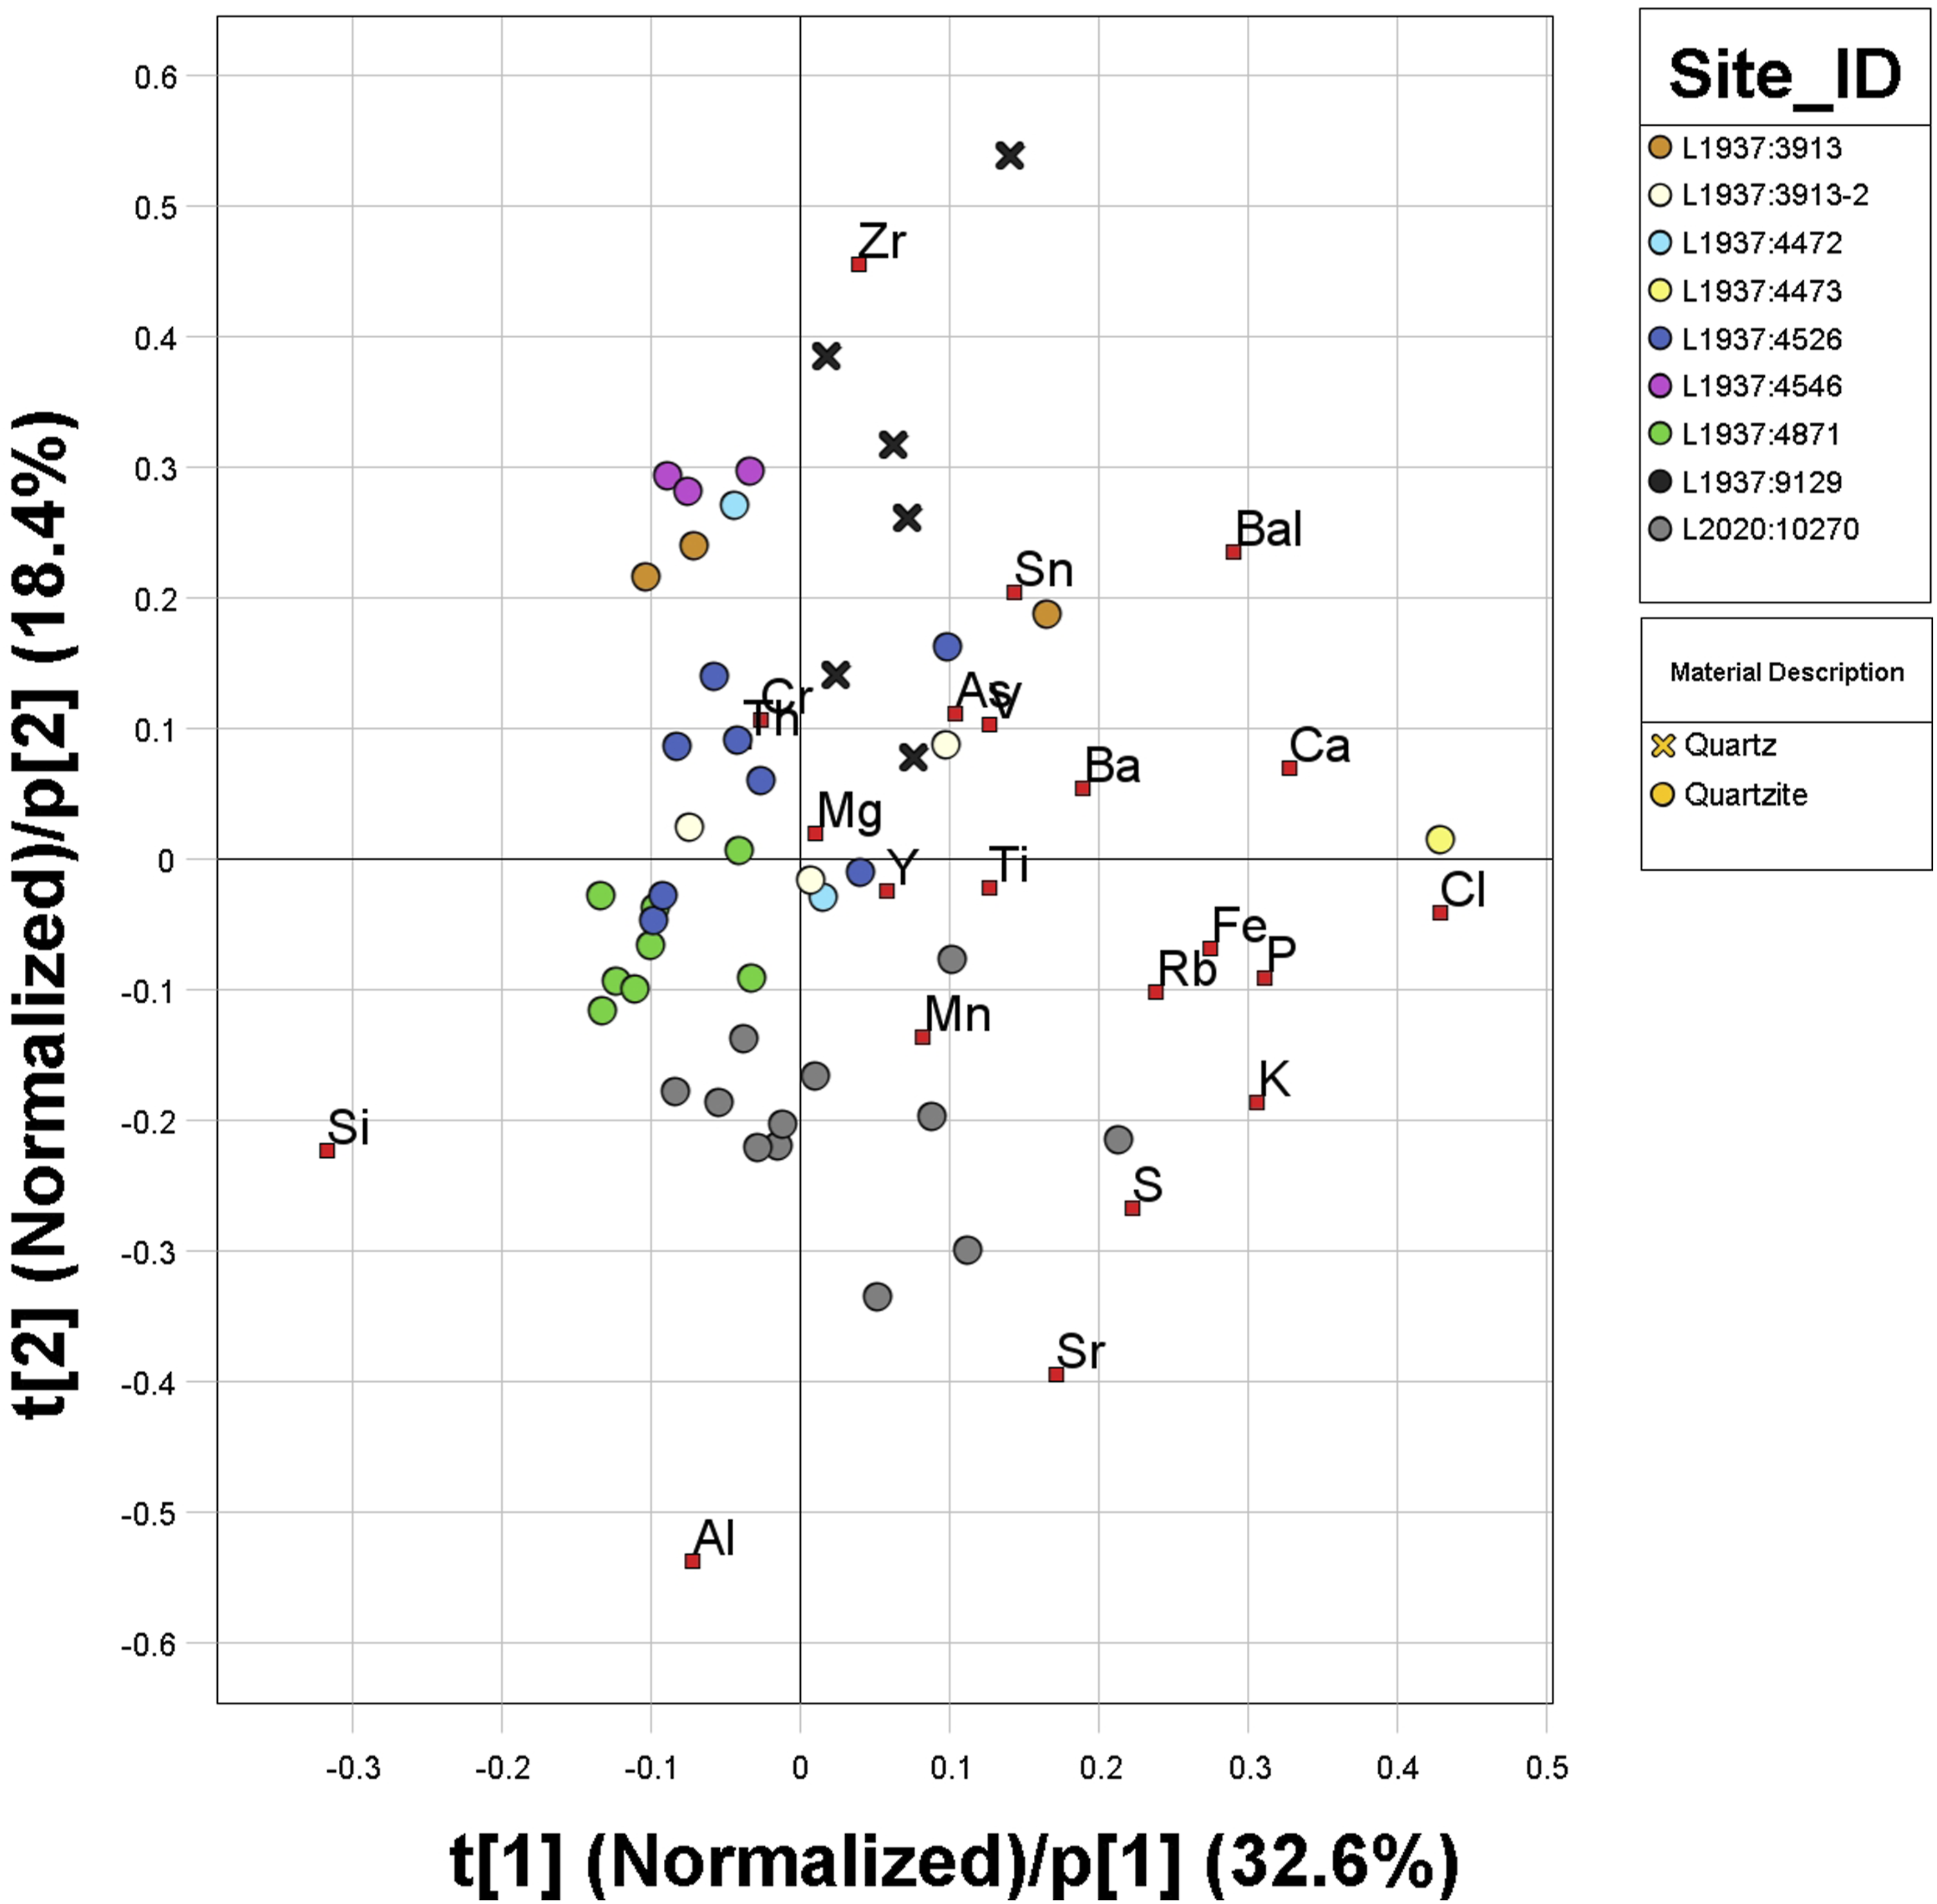
A PCA model was developed on the remaining XRF data. The PCA score plot (Figure 4), PC 1 (32,6%) versus PC2 (18,4%), shows a relationship characterized by elevated Si and Al, both bed rock forming elements. The loadings show negative p1 and p2 values for Si, whereas Zr, with strong positive p2, pulls quartz in this direction as opposed to quartzite.
Several quartz samples from quarry site L1937:9129, and to a lesser extent the main group of sites L1937:3919, L1937:4472 and L1937:4546, exhibited high Zr and Rb content. Notably, L1937:3913-2 does not group with the other objects from the same general area (i.e. L1937:4472, L1937:4546 and L1937:3913). Overall, most objects group according to quarry affiliation as seen in the score plot (Figure 4). Object L1937:4472-1-2 with strong positive p1 values, did not conform to any of the groupings in the PCA score plot. Additionally, readings from quarry L1937:3913 ranged closely with the main group from quarry L1937:4546 exhibiting slight negative p1 values and positive p2 values. However, readings L1937:3913.8, L1937:3913-2.11 and L1937:4526.1.2-1, showed positive p1 and p2 values aligning closer to readings from quartz quarry L1937:9129 in the score plot.
The PCA models for both XRF (Figure 5) and NIR datasets (Figure 6) show less than 50% variance explained by the first component. For chemically homogeneous materials such as quartz and quartzite (Figure 3), this is expected.34,36 This should be viewed as an indication of the trends in the data being nonlinear, providing a relatively high amount of information in the lower dimensions. In the case of XRF the low explanatory power in the PCA could also be explained by the variance being spread out over multiple overlapping element peaks.
34
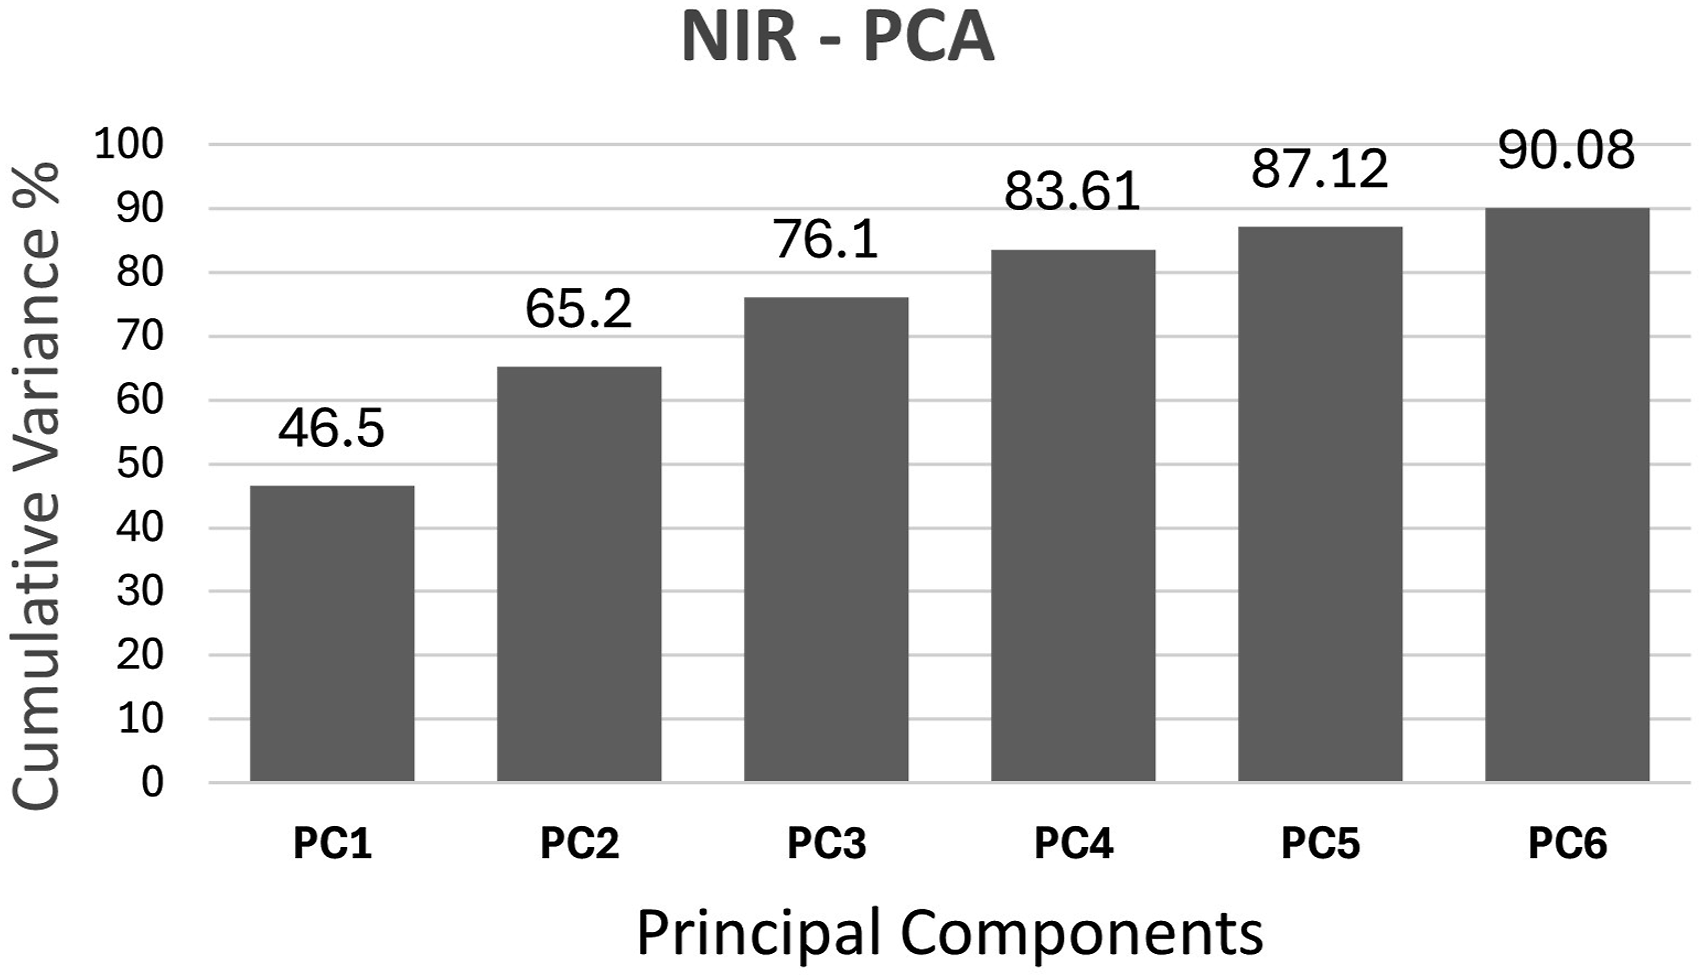
Despite low variance in PC1 and PC2, higher components (8 or less in the case of the NIR dataset) capture >90% of the cumulative variance in both datasets (Figures 5 and 6), confirming that the models maintain enough analytical data to show trends within the dataset.40,41 Cumulative variance in the PCA model based on XRF data from in situ samples. Cumulative variance in the PCA model based on NIR data from the archaeological, in situ and sub- samples.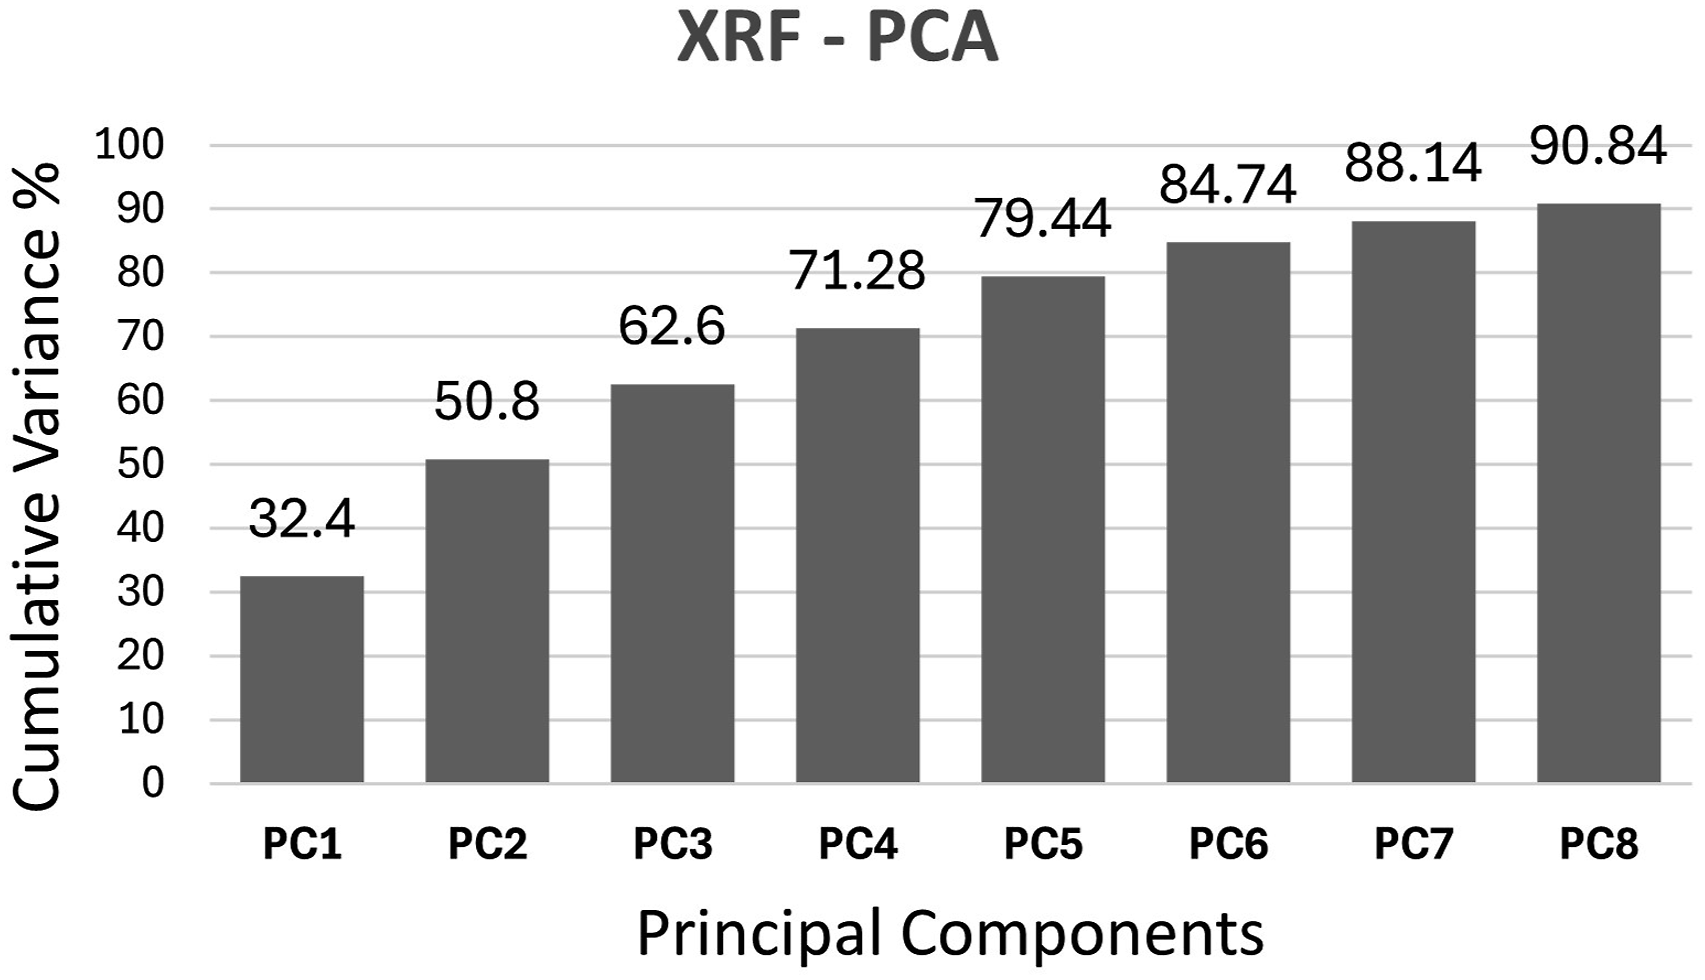
Based on visual inspection of patterns in the PCA score plots derived from the NIR data, the objects were tentatively assigned to different classes. This assessment was based on the three-dimensional PCA representation using PC1, PC2, and PC3 (Figure 7). The PCA scores revealed a pattern in which five distinct groupings radiated outward from the centre of the plot, providing an initial basis for class differentiation. Subsequently, these groups were labelled A-F. 3D PCA score plot showing PC1, PC2 and PC3, based on NIR data from all archaeological, in situ and sub-samples. Micro-NIR classes designated A-F shown according to coulor in the score plot, is based on the t-SNE analysis and can be seen to correlate to trends in the PCA where some of the t-SNE groupings emanate outwards from the center of the plot.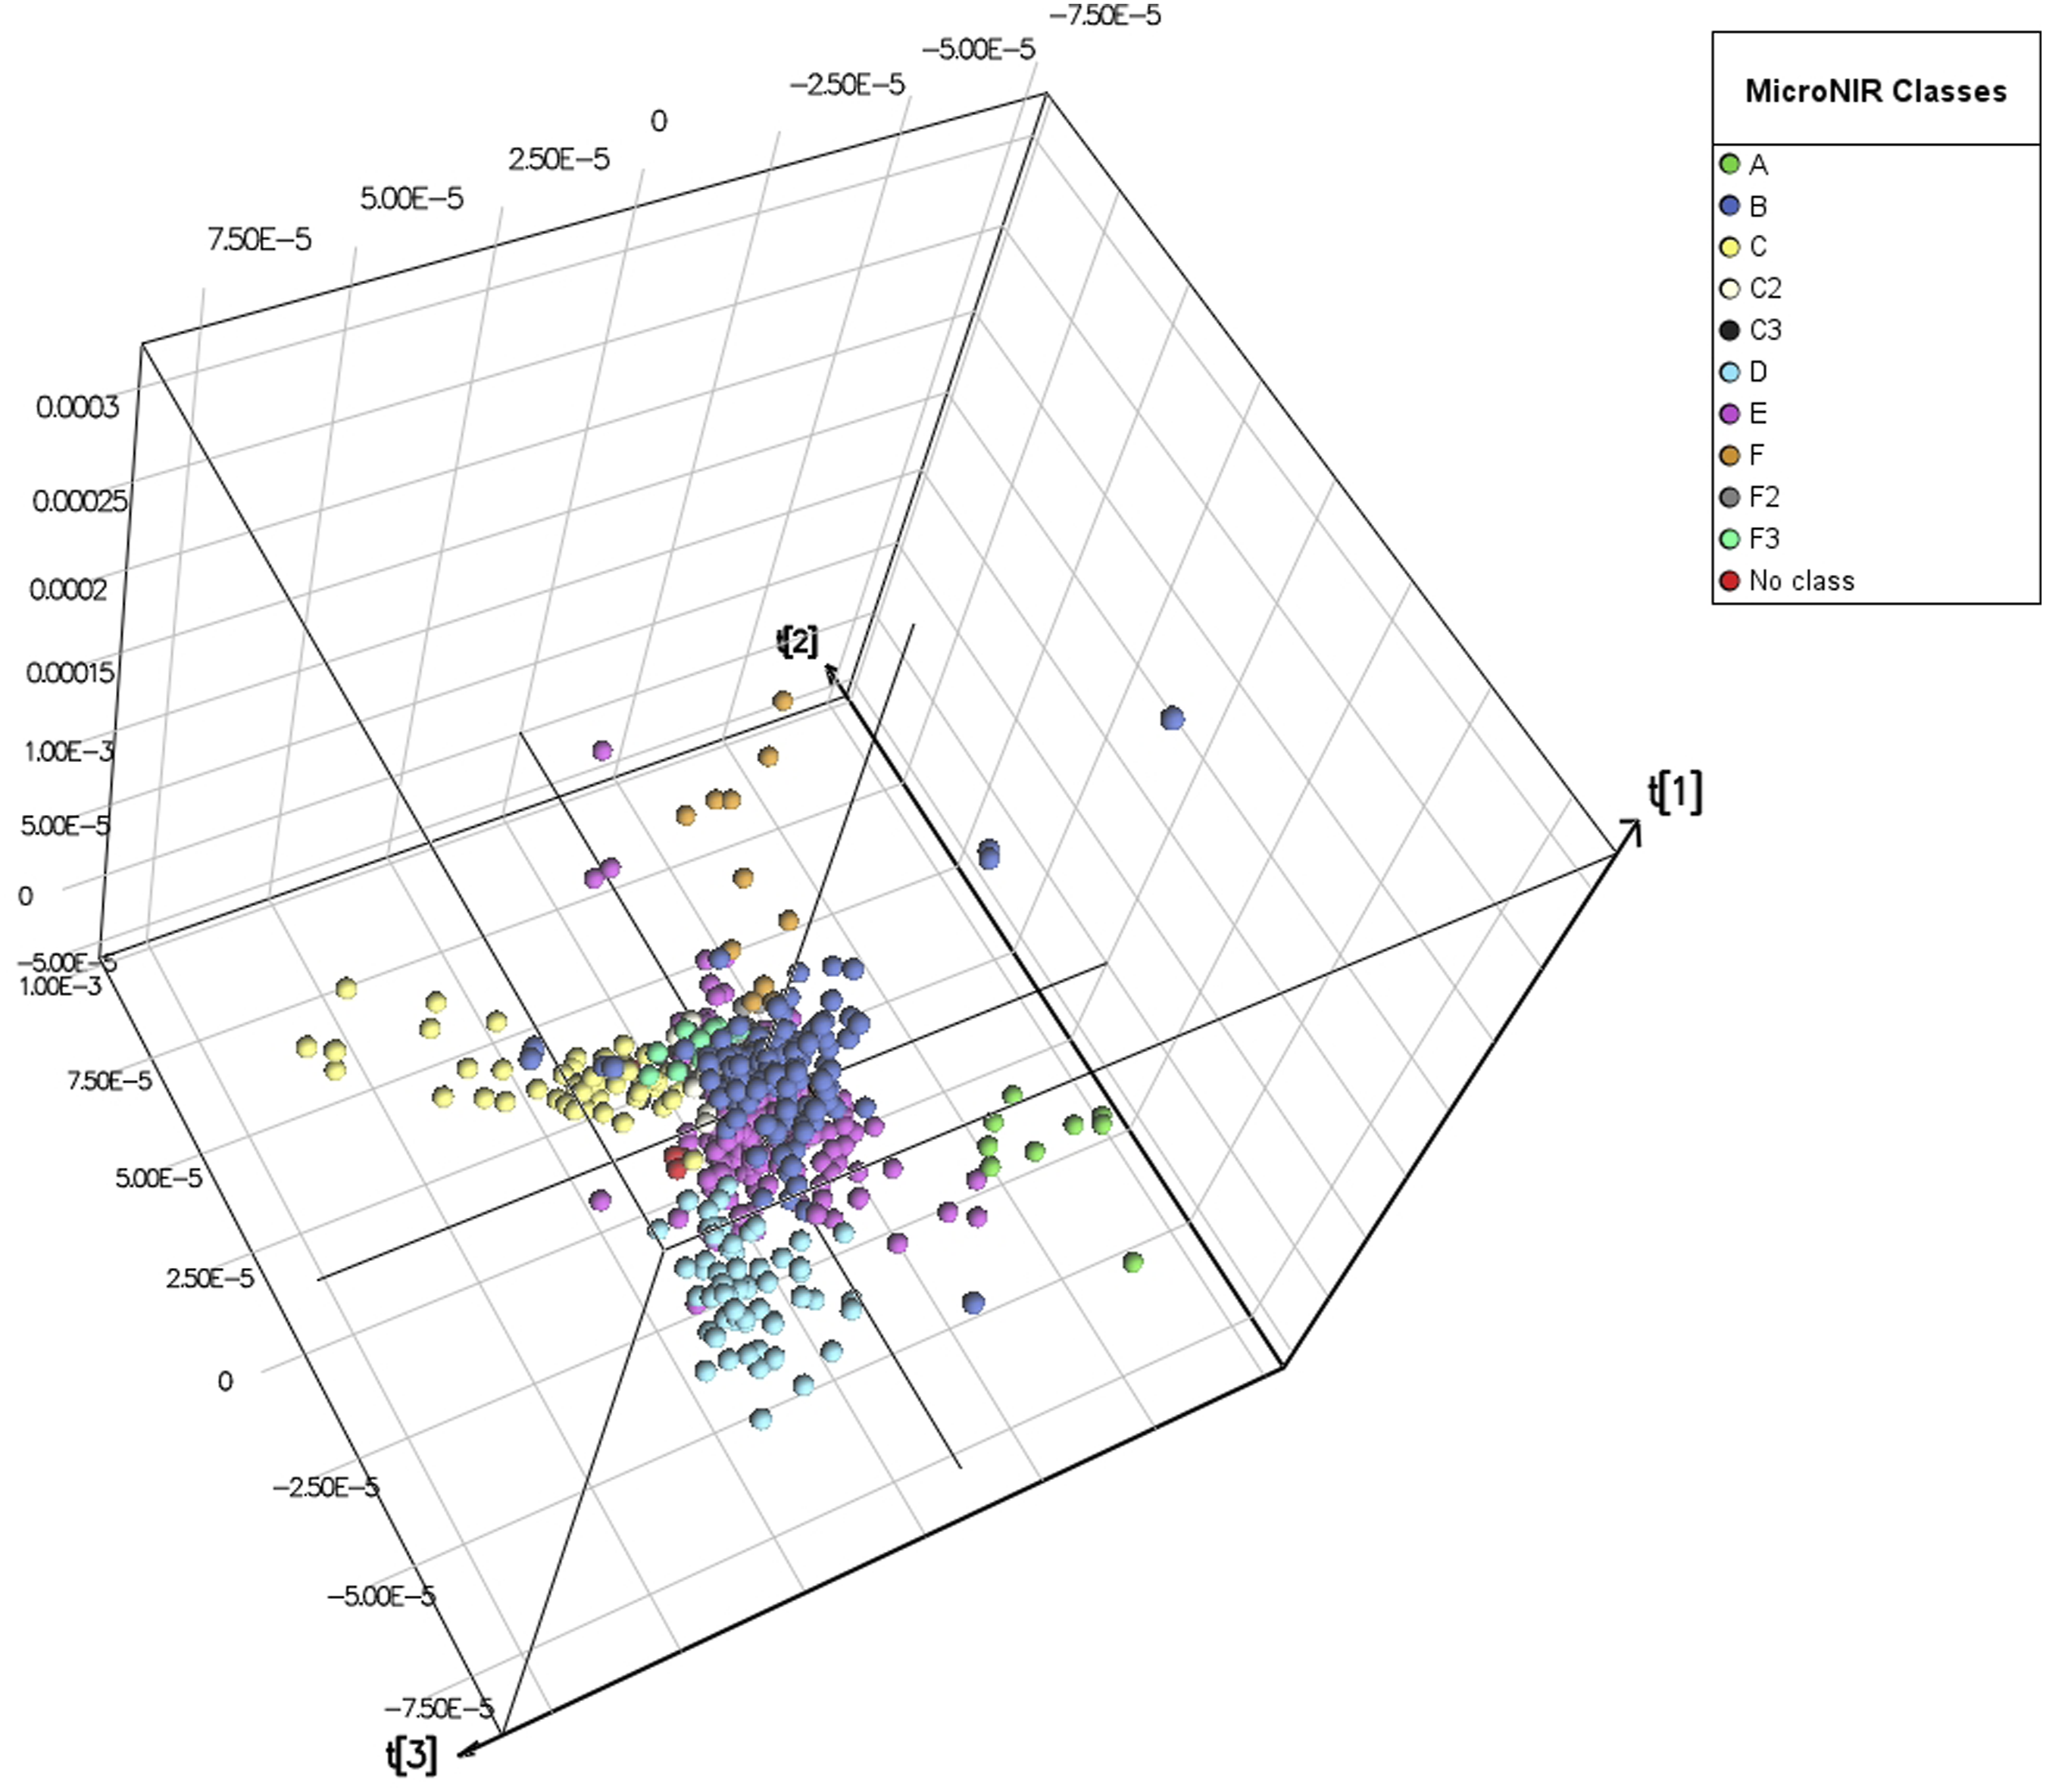
To further explore the underlying structure of the dataset, a t-SNE model was generated to enhance separation among the preliminary PCA-derived groupings and to support a more robust definition of sample classes (Figure 8). The t-SNE analysis performed using three factors; however, a sufficient two-dimensional projection is shown (Figure 8). This configuration allowed the relationships observed in the first and second dimensions to be compared with those present in the third, helping to evaluate potential overlap in higher-dimensional space. t-SNE score plot showing t[1] and t[2], with identified groupings in colour and sites as points. Note that global distances of groupings are arbitrary, any overlap of clusters has been accounted for by comparison with t[3].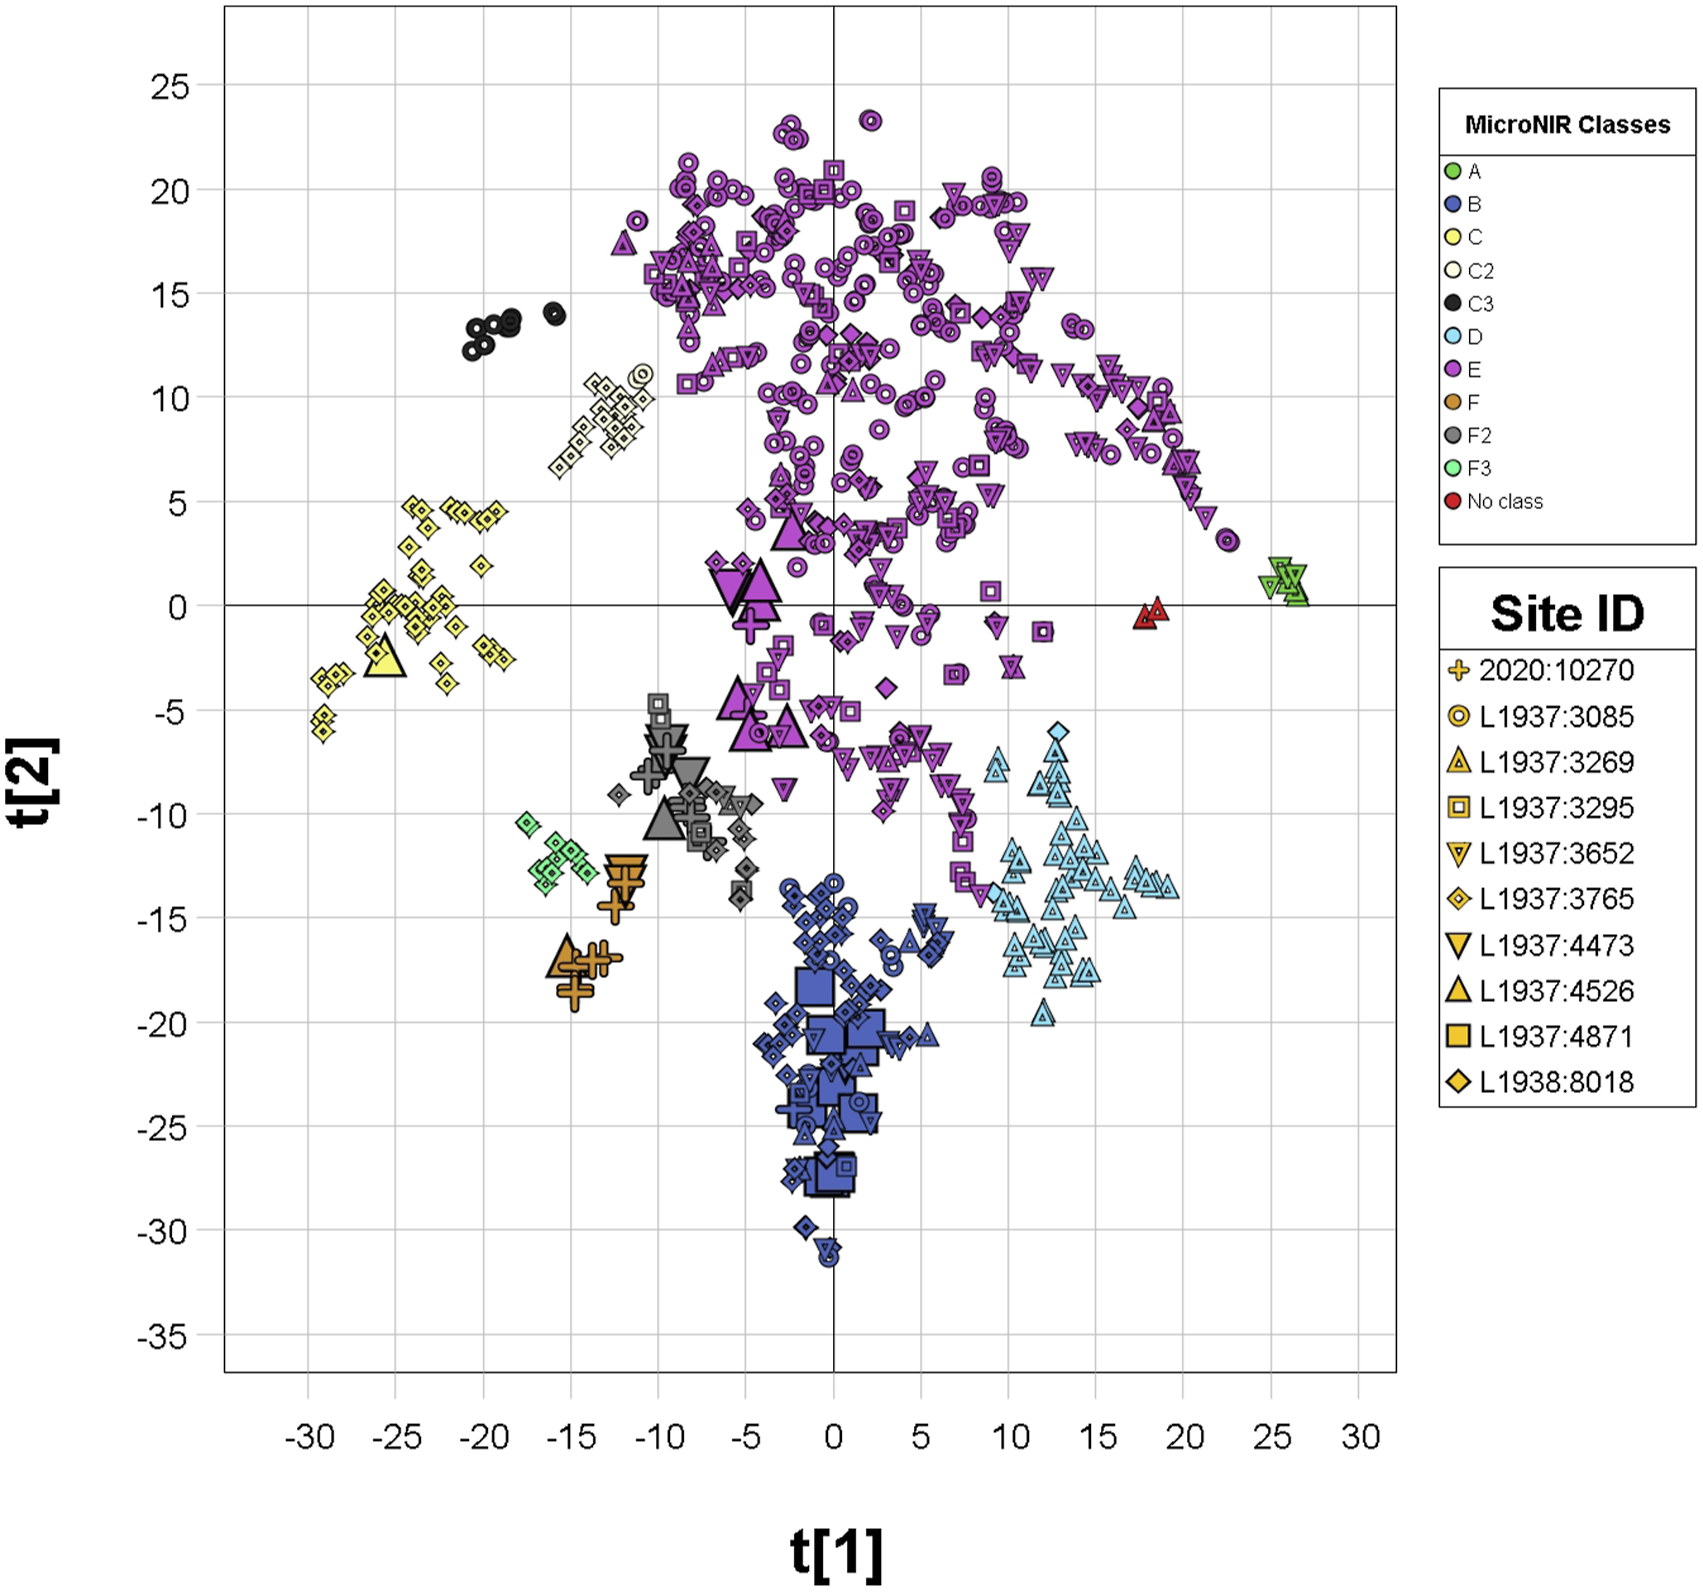
The proposed groupings and resulting classifications were examined by overlaying the samples site affiliations onto the t-SNE score plot, enabling comparison between the data-driven classes and their corresponding topographic distributions.
The PCA score plot (Figure 4) showed general agreement with the class assignments derived from the t-SNE analysis. When site information was superimposed onto the t-SNE representation (Figure 8), a strong relationship between site location and grouping distribution was observed. Classes C, C2, and F3 occurred exclusively at site L1937:3765, with the exception of two objects from L1937:3085 that fell within class C2. Class D was dominated by objects from L1937:3269, with only two samples from L1938:8018 sharing this classification. Class A included objects from both L1937:3652 and L1937:3269, while class C3 comprised only of samples from L1937:3085. Notably, in situ readings from the L1937:4871 quarry and related sub-samples exhibited a strong association with class B.
Although class C, C2 and C3 were initially interpreted as a single group in the PCA model, the t-SNE analysis (Figure 8) revealed clear separation among them. Similarly, classes F, F2 and F3 were first grouped together in the PCA results but resolved into three separate groupings in the t-SNE analysis. Further examination of the mean spectra for each grouping (Figure 9), displays distinct features in each class, clearly showing material differences. Savitzky‐Golay second derivative mean spectra of the ten t-SNE classes, (d2A/dl2; l: wavelength, A: absorbance) showing diagnostic peaks within the NIR spectra. Noticeably several spectral peaks (1088, 1094, 1137 & 1199 nm) occur within the 1000–1200 nm region, indicating the occurrence of Fe2+. Peaks falling withing the 1300–1400 nm region (1329 & 1336 nm) is indicative of the second overtone region of O-H bands, along with peaks at 1459, 1466, 1509, 1534, 1571, 1602 & 1608, related to OH/H2O content, common in metamorphic rock materials such as quartzites.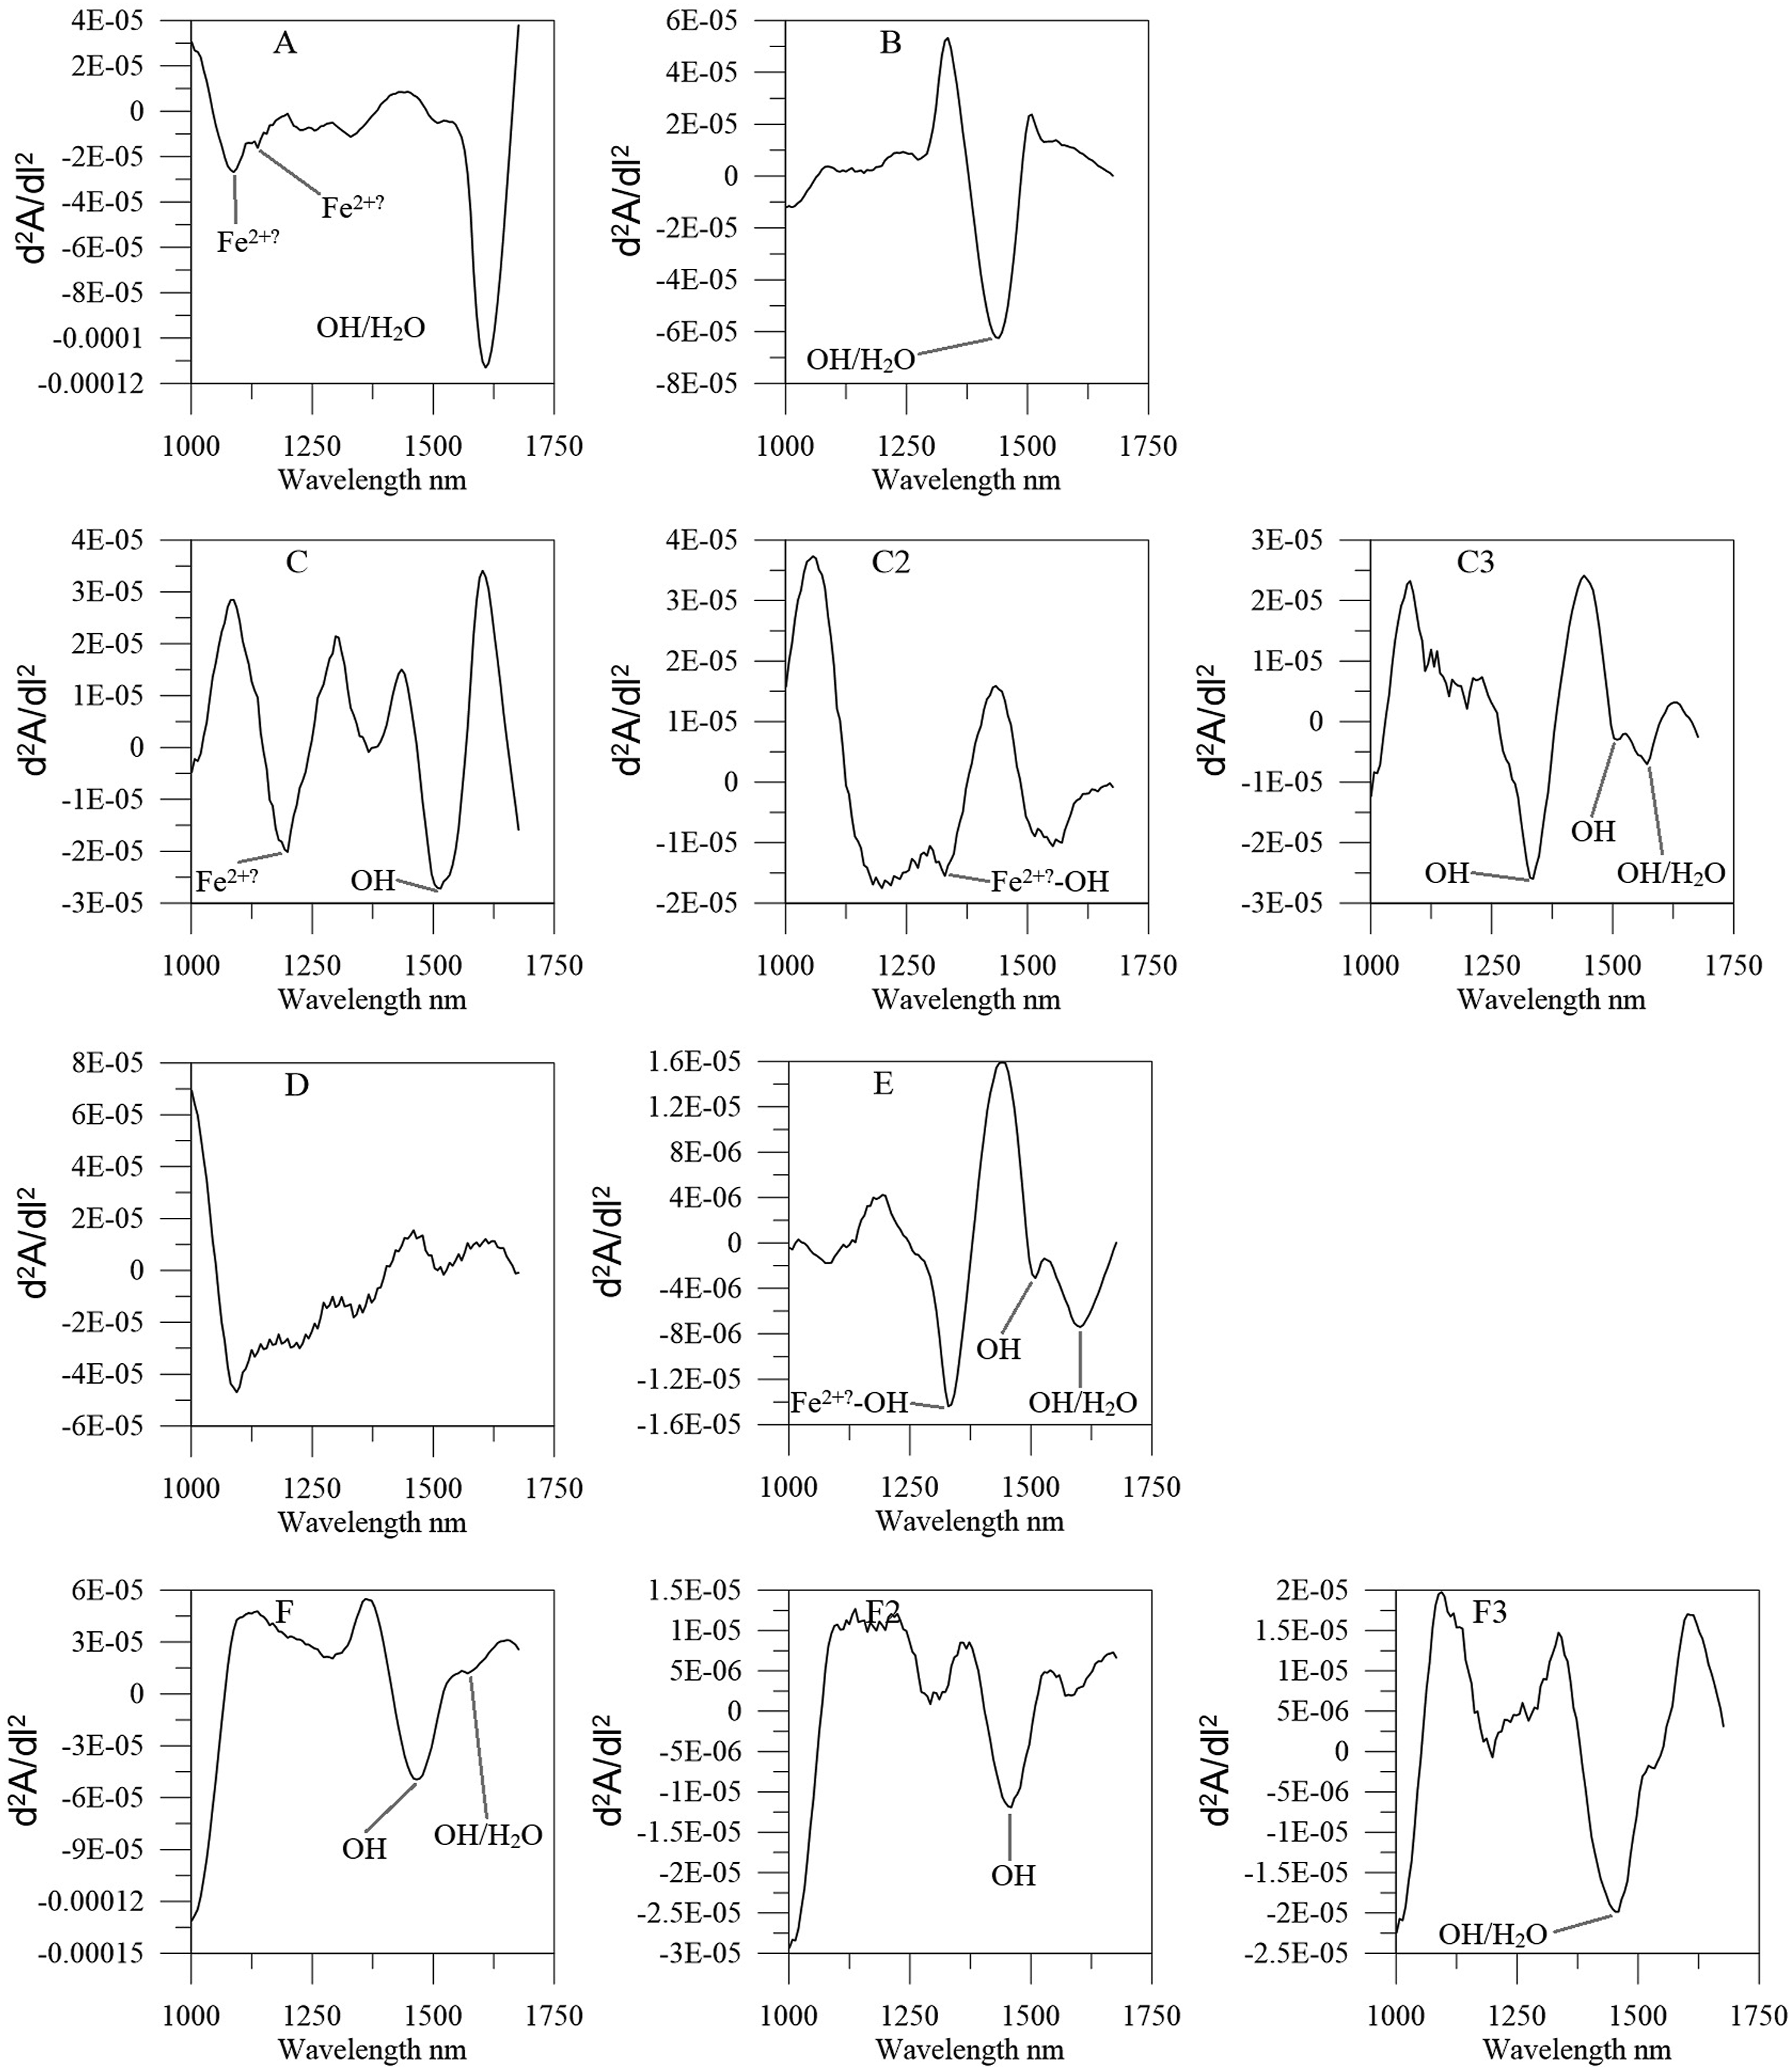
In Figure 9, Savitzky-Golay second derivative spectra are shown for the ten t-SNE classes, where large negative peaks indicate wavelengths of great diagnostic importance. Classes A, B C, D, E and F each display distinct spectral responses. Contrary to this, the main group C does not share spectral resemblance with either C2 and C3. Group F, F2 and F3 have common spectral characteristics with main features at around 1460 nm.
Inspection of the class-mean NIR spectra (Figure 9) reveals several distinct features that permit discrimination between the defined classes. Prominent bands at 1329 and 1336 nm occur within the ∼1300–1400 nm second-overtone region, consistent with vibrational overtones of O–H functional groups. Additional features observed at 1459, 1466, 1509, 1534, 1571, 1602, and 1608 nm are attributed to O–H and molecular H2O-related overtones and combination bands, indicating varying degrees of hydration among the classes. 42
In the class A, feature bands at 1088 and 1137 nm are evident and are attributed to Fe2+ electronic transitions, commonly interpreted as spin-allowed crystal field absorptions in Fe2+-bearing silicates. These bands have been widely reported in the NIR spectra of olivine and pyroxene and are characteristic of iron-rich igneous and metamorphic mineral assemblages, although minor overlap with weak overtone features cannot be excluded. Furthermore, absorptions at 1137 and 1199 nm observed in selected classes provide additional evidence for variable Fe2+ content across the class-mean spectra.42,43 Class F with a peak at 1466 nm likely represents the same mineralogical family as Class F2 with a peak at 1459 nm, possibly with minor compositional or grain-size variations affecting band position. Comparing classes F and F2 to F3, suggests that class F3 represents a local variation of Class F or F2, possibly affected by a more progressed metamorphosis. Class C3 could be interpreted as an advanced metamorphose variant of Class C, possibly related to an increased alteration or Fe/Mg substitution due to local conditions. Because of a lack of recognizable bands in the mean spectra of class C2, this may represent a poorly defined form of quartzite dominated by unaltered or spectrally inactive lithologies like quartz. 44 It is possible that with a broader spectral range and higher spectral resolution, will improve diagnostic information could be acquired from class C2.
The noise primarily affecting the C2 and D groups in Figure 9, and to a lesser degree F2 and F3, may contribute to the low explained variance in the higher order principal components. Notably, the noise in the F2 and F3 classes are below the zero line and as such does not affect the relevant diagnostic peaks relevant for identification of elements in the objects.
Discussion
The results of the PCA of the XRF geochemical data demonstrate clear patterns of quarry level separation among the sourced objects. In particular, quarries L1937:3912 and L1937:3913-2 could be distinguished from each other (Figure 4), despite their immediate spatial proximity in the landscape. Furthermore, samples from L1937:3913-2 exhibit a strong geochemical affiliation with those from quarries L1339:4526 and L1939:4871 in the PCA score plot (Figure 4). The XRF results also reveal that quarry L2020:10270 does not align with any of the other identified quarry groupings in the score plot. This distinct geochemical signature may prove valuable for future provenance studies of stone implements in the region. Consequently, any artifacts manufactured from this raw material can be directly linked to this specific source, which can now be reliably identified using XRF analysis.
The PCA of the NIR data (Figure 7) showed a complex, but useful grouping as it offered valuable insights into the material characteristics of the objects. The interpretation of the PCA score plot is complicated because of considerable overlap in the object groupings that only becomes apparent when presented in 3-dimensions. The clear patterns radiating outward from the centre of the plot shows the overall homogeneity of the dataset. However, slight variations in chemical composition and the presence of inclusions within the rock matrix result in subtle trends. These trends are expressed as radiating groupings extending along multiple PC dimensions. This observation is consistent with the relatively low variance expressed in the higher principal components, which likely indicates the presence of several overlapping yet meaningful compositional patterns within the dataset.
The overlay of site-association metadata onto the t-SNE results provides strong support for the interpretation that the visually identified groupings show meaningful structure in the data. In addition, constructing the t-SNE model using three factors demonstrates that these groupings remain coherent along the third dimension, indicating that the observed clusters are not anomalies of two-dimensional projection but represent stable patterns in the higher-dimensional space. Examination of the material classes within the t-SNE score plot (Figure 8) shows that site L1973:3765 displays a distinct pattern of raw material use compared to the other sites. The occurrence of raw material classes C, C2 and F3 is unique to this site. Similarly, site L1973:3269 exhibits a strong association with raw material class D. These site-specific patterns may be related to exploitation of specific localized raw material sources for these sites. Another possible interpretation is that the raw materials observed at sites L1973:3765 and L1973:3269 indicates their use as recurring seasonal basecamps over an extended period. The large variation in raw materials compared to the other sites, may show shifts in procurement strategies or changes catchment-areas over time. Despite these site-specific differences, a shared characteristic is evident across all archaeological sites included in the study, namely the consistent presence of raw material class E within the assemblages. This recurring pattern may indicate a common procurement tradition or shared mobility practices, possibly suggesting the presence of a single group of people (or closely related groups) occupying the area periodically, potentially on a seasonal basis. This distribution pattern may also show the presence of widely dispersed moraine materials across the landscape, which would result in a large and diffuse potential catchment area rather than a single localized source. Additionally, Class B material is present at all analyzed archaeological sites. This class shows a strong association with quarry L1937:4871 (Figure 8), an exposed bedrock quarry, suggesting a potential geographic linkage between the archaeological assemblages and this quarry location. However, this association should be interpreted cautiously, as the primary distribution of this material may extend across a broad region, potentially spanning 50 km or more from Southwest to Northeast (Figure 2). Consequently, Class B may represent a widely distributed lithology rather than a uniquely local source, and the inferred quarry connection remains provisional, pending further verification.
The Savitzky–Golay second derivative NIR mean spectra (Figure 9) emphasize diagnostically important wavelengths and reveal clear spectral differentiation among most t-SNE classes. Distinct spectral responses are observed for classes A, B, C, D, E, and F. The main group C shows limited spectral similarity to C2 and C3, indicating compositional heterogeneity between these groups. Classes F, F2, and F3 share prominent absorptions near ∼1460 nm, suggesting a common mineralogical affinity. The mean spectra display absorption bands at ∼1329–1336 nm, corresponding to second-overtone O–H stretching vibrations, and a series of features between ∼1459 nm and ∼1608 nm attributed to O–H and molecular H2O overtones and combination bands. Variations in the intensity and position of these bands relates to differing hydration states and degrees of alteration among the classes. Class A and D is further distinguished by bands at ∼1088 nm and 1137 nm, characteristic of Fe2+ crystal field transitions in silicate minerals, indicating a relatively Fe-rich material. Additional features at ∼1137 nm and ∼1199 nm in classes A and C, suggests Fe2+ present in the minerals of the analyzed geological material.
The close correspondence between classes F (∼1466 nm) and F2 (∼1459 nm) is likely to show minor compositional or grain-size differences, while F3 may represent a locally modified or more metamorphosed variant of this group. Similarly, class C3 appears to be related to a more altered or metamorphosed expression of Class C. In contrast, the absence of specific diagnostic peaks in Class C2 suggests a quartz-rich, spectrally inactive lithology. The F-F3 and C-C3 classes underline the importance of understanding the geology of the study area, considering that these materials could be local variations of materials from the same origin. The Southwest to Northeast striations in the bedrock of the Scandinavian Caledonides (Figure 2) suggest that these variations of raw material may have a fairly large catchment area along this direction.
The results from the Savitzky-Golay transformed spectra for each t-SNE score group plot (Figure 9) show that there are spectral and chemical differences in material composition between each group. Given that we can identify differences in chemical composition in stone implements, then the spatial spread and variation in this material will be significant and can bring a different and detailed level compared to ocular classifications alone. When the t-SNE clusters (Figure 9) are projected onto the topographical map (Figure 10), a clear spatial pattern emerges. The sites L1938:8018, L1937:3085, L1937:3295, and L1937:3652 exhibit similar material signatures. In contrast, sites L1937:3765 and L1937:3269 display distinct material compositions that differ, both from the aforementioned group, and from each other. The quarry site L1937:4871 was included in the spatial projection to illustrate its strong correspondence with raw material class B. As shown in Figure 10, class B material is present across all sampled sites. Note that sites L1937:3765 and L1937:3652 are located further north along the Ångerman River. The Vojm Lake still exhibit a portion of the raw material from class B, associated with the L1937:4871 quarry further west along the catchment area of the Lake Malgomaj. This indicates either a broad spatial distribution of this raw material class or a naturally widespread occurrence of the source material. Map of the Malgomaj and Vojm Lakes with catchment areas in the Northwest and runoff area, into the Ångerman river in the Southeast. Archaeological sites are marked with pie charts showing the count of objects by class (A–F), also the quartzite quarry of L1937:4871 is included for the sites strong correlation with class B material.
Conclusion
X-ray fluorescence provides reliable results for determining the provenance of quartz and quartzite and has shown to be useful for field-based comparison of stone materials during archaeological excavations. Its primary limitations are the requirement for trained operators and relatively long acquisition times. In contrast, NIR spectroscopy is highly user-friendly, completely safe to operate, and offers rapid, non-destructive measurements suited to large-scale archaeological projects. Although NIR is less chemically specific than XRF, particularly when considering the analytical techniques required for interpreting its spectra, it remains a powerful tool for high-throughput field analysis.
Sampling under laboratory settings should be conducted under controlled conditions. Field sampling, however, poses greater challenges due to variable environmental conditions. Furthermore, field adapted equipment usually has limited wavelength range and resolution but still produces useful information. In this study, field sampling proved to be challenging as moist, growth of lichens add to spectral variation. While such effects can be mitigated, they cannot be fully eliminated. Nonetheless, the non-invasive nature of both NIR and XRF makes them valuable for in situ sampling, and many cases these techniques may represent the only solution. Bringing the lab into the field, documentation and analysis of stone implements could easily be conducted and thus enabling an increased understanding of the archaeological context already in field.
The strong correspondence between the t-SNE clustering results and the associated site affiliation metadata (Figure 8), demonstrates the robustness and validity of the proposed approach. These findings indicate that the combined approach is capable of classifying geological materials at a substantially higher resolution than conventional visual assessment alone. Furthermore, the approach shows significant potential for supporting the interpretation of spatial and temporal patterns within archaeological contexts, thereby providing a quantitative foundation for future site-based analyses.
Supplemental material
Supplemental material - Field spectroscopy in geoarchaeology – A comparative investigation of quartz and quartzite quarries and stone implements
Supplemental material for Field spectroscopy in geoarchaeology – A comparative investigation of quartz and quartzite quarries and stone implements by Mats Gunnar Eriksson, Johan Linderholm, Paul Williams in Journal of Near Infrared Spectroscopy
Footnotes
Acknowledgements
This paper is dedicated to the late Paul Geladi who was advising at an early stage of this project and also for all the positive affirmation all through our cooperation.
Author contributions
Funding
The authors disclosed receipt of the following financial support for the research, authorship, and/or publication of this article: The fieldwork was made possible by a research grant from the JC Kempes Memorial Scholarship Fund.
Declaration of conflicting interests
The authors declared no potential conflicts of interest with respect to the research, authorship, and/or publication of this article.
Supplemental material
Supplemental material for this article is available online.
References
Supplementary Material
Please find the following supplemental material available below.
For Open Access articles published under a Creative Commons License, all supplemental material carries the same license as the article it is associated with.
For non-Open Access articles published, all supplemental material carries a non-exclusive license, and permission requests for re-use of supplemental material or any part of supplemental material shall be sent directly to the copyright owner as specified in the copyright notice associated with the article.