
Abstract
The present study examines the efficiency of 12 public sector banks (PSBs) in ensuring financial inclusion (FI) through the Self-Help Group-Bank Linkage Programme (SHG-BLP). Data envelopment analysis (DEA) is applied for the periods 2011–2012 to 2021–2022 for this purpose. The study incorporated the Charnes, Cooper and Rhodes (CCR) and Banker, Charnes and Cooper (BCC) models. The findings suggest that with the CCR model, two banks, and with the BCC model, five banks are found to be consistently efficient throughout the study period. Furthermore, the Mann–Whitney U test clarifies that, based on mean efficiency under both models, a significant variation exists between the top 50% and bottom 50% of the banks. Additionally, the projection and shortfall analysis indicate that only four out of the 12 banks are efficient. Therefore, the comprehensive information, as an outcome of the study, proposes that the banks which were not found efficient should expand their financial services to the self-help groups (SHGs).
Keywords
Introduction
A significant portion of the global population located in low- and middle-income countries is excluded from formal financial services, resulting in enduring large-scale unemployment and poverty, especially in rural regions (Maity & Sarania, 2017). As of 2021, over 1.4 billion global adult populations are unbanked, of which approximately half are poor women from rural households (World Bank Group, 2022). Under these circumstances, microfinance has become a widely recognized frontier instrument for achieving financial inclusion (FI) for economically and socially excluded rural people (Maity, 2023a, 2023b; Mushtaq & Bruneau, 2019). FI denotes the presence of fair and equal access to essential financial services for every individual via recognized financial institutions, specifically for those who are economically disadvantaged (Demirgüç-Kunt & Singer, 2017; Ozili, 2021). Microfinance programmes will also serve as an important and effective tool for achieving the Sustainable Development Goals (SDGs), devoid of ‘hunger’ and ‘poverty’ (Goals 1 and 2, respectively) by the year 2030 (Patil & Kokate, 2017). Therefore, it is obvious that without direct institutional involvement, accomplishing such goals will become more challenging for the disadvantaged and marginalized sections.
Currently, in India, microfinance activities are carried out by various kinds of microfinance models, but the ‘Self-Help Group-Bank Linkage Programme’ (SHG-BLP) model is the most popular one. This programme was initiated by the National Bank for Agriculture and Rural Development (NABARD) as an experimental plan to connect formal financial institutions (Banks) to self-help groups (SHGs) in 1992. The programme was mainstreamed in 1996 with the assistance of the Reserve Bank of India (RBI) and the government. SHG-BLP provides basic financial services to neglected women in rural settings and is considered an effective instrument and strategy for accelerating FI (Sarania & Maity, 2014). The prime functions performed by the SHG-BLP towards promoting FI are the provision of disbursing loans with low interest, distribution of collateral-free loans, augmenting the petty savings habit, and delivering financial knowledge to the SHG members (Tripathi, 2014; Vasantha et al., 2013). The present scenario of SHG-BLP has reached many milestones; as of 31st March 2023, around 162 million households belonging to approximately 13.4 million SHGs have saving deposits of more than `588.93 billion (NABARD, 2023). Now, this programme has become the largest microfinance initiative in the world based on size and reach (Al-Kubati & Selvaratnam, 2023). In the SHG-BLP, banks and non-governmental organizations (NGOs) made major contributions to expanding and intensifying the initiative (Mohanty, 2013). As banks operate the primary channels of supplying necessary financial services to the excluded groups, their operational efficiency has repercussions on the performance of FI initiatives.
It is essential for the banking industry to be efficient for the economic development of the country (Bhatia et al., 2018; Jiang & He, 2018). In the highly cluttered financial services sector, banks that operate more efficiently have a higher chance to succeed compared to those that operate less efficiently (Tamatam et al., 2019). In addition, the lack of efficiency in the banking industry may result in adverse consequences.
This banking industry is broadly segmented into two divisions: private sector banks (PVBs) and public sector banks (PSBs). However, the PVBs are mostly focused on catering to the needs of urban areas with a motive to attain profit, giving negligible attention to rural areas (Agarwal et al., 2017). Whereas PSBs perform the pivotal position in priority sector lending (PSL) and in making the financial products and services available to economically disadvantaged groups, which ultimately leads to FI. Such dual functions played by the PSBs can be instrumental in achieving greater financial and social development targets (Maity et al., 2022; Martínez-Campillo et al., 2018). Considering this importance, PSBs are the main focus of the present study. Under such circumstances, it is important to shed light on the mechanisms of their operations and the degree of efficiency in the FI initiatives. In this pretext, the ongoing study examines the efficiency of 12 PSBs in attaining the aims of FI through the SHG-BLP.
The remaining parts of the article are structured in the following way. Section 2 focuses on a review of different literature. Section 3 outlines the materials and methods used in the study. Section 4 explains the results and discussion part. The last section, that is, Section 5 draws the conclusion of the study.
Review of Literature
For the purpose of the study, an extensive literature survey has been conducted in two sections, that is, FI through SHG-BLP and the determination of bank efficiency.
FI Through SHG-BLP
In India, the SHG-BLP has turned out to be a prominent and significant microfinance model, considering its unprecedented growth (Patil & Kokate, 2017). It was framed with a focus on mitigating prevalent discrepancies between regulated financial networks and disadvantaged people, as well as offering banking services to them (Saravanan et al., 2024; Tripathi, 2014). In fact, the SHG-BLP initiative has minimized non-institutional borrowing and enhanced the accessibility of organized institutional lending to the impoverished and excluded people of farm households, which leads to a greater extent of FI in comparison to non-participants (Maity & Sarania, 2017; Rangappa et al., 2009). According to Patil and Singh (2020), this programme has played a pivotal role in economic prosperity and FI for the lower class of society, and it has also helped to reduce poverty and boost livelihood opportunities by expanding access to banking facilities. In a similar investigation, Maity (2019) addressed the issues regarding the effects of microfinance programmes led by banks that revolve around the SHGs and their role in income generation, multi-faceted poverty reduction, and opportunities to inculcate financial stability through FI, notably addressing two districts of Assam. The outcome relating to the research indicated that the programmes performed a remarkable position in increasing average income and also creating employment opportunities that will help cope with multi-faceted poverty. These SHG-BLPs also ensure the inclusion of SHG members from a financial point of view. A similar result was also observed in a study by Russel et al. (2024) conducted on the influence of the SHG-BLP on the formal labour market in India, where it was evident that the SHG-BLP model has been successful in inflating employment opportunities, especially for people dwelling in rural regions.
Moreover, Al-Kubati and Selvaratnam (2023) have explored the role of SHG-BLP in creating opportunities for sustainable development while proving how the programme acts as a medium of women’s empowerment in the comparatively marginalized areas of India. The result of the study pointed out that SHG-BLP has been instrumental in empowering women and facilitating entrepreneurship opportunities by helping them acquire the required technical knowledge and gain confidence. All these factors are crucial in securing sustainable development. Another study conducted by Shetty and Pinto (2015) investigated the different levels of FI among members of SHGs in Karnataka with special reference to the SHG-BLP. To facilitate the research, data were collected through an organized questionnaire from 776 SHG members. On top of that, various parametric and non-parametric tests have been employed to decipher them. The t-statistics and Wilcoxon signed rank test results depicted that degrees of FI of members of SHG were notably lower during the pre-SHG-BLP compared to the post-SHG-BLP period. Moreover, the research findings also demonstrated that the SHG-BLP played a crucial position in attaining FI in the studied region. In addition, this programme has been fruitful in alleviating the social exclusion status of the participants (Maity, 2023a, 2023b). Hence, focusing on contemporary issues such as region-based inequalities, encouraging young entrepreneurs, understanding and adopting new technology, and enhancing livelihoods becomes indispensable for ensuring the programme’s effectiveness and functionality and framing a sustainable policy outline (Mohanty, 2013).
In this pretext, the role of banks is crucial, as they provide microfinance to SHGs along with other financial institutions to promote FI (Mukherjee & Chakraborty, 2012; Venkataramany & Bhasin, 2011). Another study by Elayaraja (2020) pointed out that PSBs and regional rural banks (RRBs) stand out as stronger active contributors in the SHG-BLP movement in different Indian states compared to other financial institutions. Therefore, efficient and trustworthy organizations facilitate a long-term strategy to promote sustainable FI (Sibi & Ananth, 2017).
Determination of Bank Efficiency
Insights from prior research investigation evidence that data envelopment analysis (DEA) is a versatile technique that depends upon linear programming, and was widely utilized to estimate the banks’ efficiency (Arshinova, 2011; Bannour et al., 2020; Thanassoulis, 1999; Yang, 2009). The technique generally considers several inputs and outputs to ascertain the relative efficiency of each decision-making unit (DMU) (bank) and recognize inefficient ones. Multiple studies are now being conducted to assess efficiency by applying this methodology. For example, Titko et al. (2014) employed an input-oriented DEA technique to ascertain the efficiency score of 15 Latvian banks according to the variable returns to scale (VRS) assumption. Another study conducted by Aghimien et al. (2016) analyzed the efficiency levels of 43 Gulf Corporation banks throughout the period of 2007–2011. The findings of the research conclude that most of the Gulf Cooperation Council (GCC) banks maintain the utmost level of precision while functioning. Moreover, the research also pointed out that inadequacy in the allocation of resources results from managerial inefficiencies. Similarly, Nigmonov (2010) conducted a study that evaluated the level of efficiency of 23 Uzbek banks while applying the DEA model. The study followed the assumptions of constant returns to scale (CRS) and VRS and considered the period of 3 years from 2004 to 2006. The outcome of the research unveils a decline in the efficiency level of all Uzbek banks over the timeframe of the study. In addition, it was also demonstrated that no considerable variation was identified in relative performance among private, joint stock, and foreign banks. Similarly, Kamarudin et al. (2019) also utilized this DEA method to analyze the degree of revenue efficiency, focusing on Malaysia’s Islamic banking sector. The results indicated that overseas Islamic banks have maintained a better performance compared to the indigenous Malaysian Islamic banks in the context of revenue efficiency. Likewise, Chowdhury et al. (2022) applied the DEA technique to analyze the efficiency of each category of banks in Indonesia from 2013 to 2018. The results of the research highlighted that the performance of the Non-native Islamic Bank superseded the performance of its indigenous Islamic banks pertaining to overall technical efficiency (OTE).
However, Zhu et al. (2021) employed the DEA approach in examining the operational and productivity efficiency of public, private and foreign banks in the context of Pakistan during the time interval of 2006–2017. The outcome exhibited that Indigenous banks had a higher average scale efficiency compared to overseas banks. On the other hand, foreign banks outperformed domestic banks in terms of overall and pure technical efficiency (PTE). Similarly, Grmanová and Ivanová (2018) measured efficiency in the Slovak banking industry by applying the DEA approach. The study results point out that in the Slovak national banking market, the three major banks, including Slovenska Sporitel’na Bank, conveyed much higher efficiency levels than other banks.
Kumar and Dhingra (2016) applied DEA, particularly the Charnes, Cooper and Rhodes (CCR) and Banker, Charnes and Cooper (BCC) approaches, in their study to examine the degree of efficiency in Indian PSBs. The study’s outcome exhibits that solely two banks are considered efficient under the CCR model; however, nine are considered efficient under the BCC model. A similar study by Sangeetha (2020) examined technical efficiency using the DEA approach of 19 PSBs in India. The study’s findings indicate that PSB’s technical efficiency ranges between 97% and 100%. This exhibited that PSBs use more resources than required and achieve the present output level with fewer inputs. Tamatam et al. (2019) employed panel data covered from 2008 to 2017 to assess the relative efficiency of the domestic banking sector in India using the DEA methodology. The research findings indicate that PVBs have higher operational efficiency in comparison to PSBs. However, Ahn and Le (2014) in their research identified potential challenges in measuring bank efficiency while applying the DEA method because of inconsistent input-output specifications. The research analysis reveals that traditional DEA models might not accurately represent bank behaviours and bank performance objectives.
The extensive literature review shows that many studies have applied the DEA method to measure bank efficiency using various input and output variables. After examining these studies, we observed that all these studies focus on the parameters related to the assessment of banks’ financial performance. However, banks are responsible for fulfilling two distinct roles: maintaining strong financial performance and contributing to improving the welfare of society. Therefore, it is crucial to assess how efficiently banks perform in the realm of social banking. There are studies that investigate the effectiveness of banks in promoting FI by considering socio-economic welfare schemes (Agarwala et al., 2023; Maity et al., 2022). However, a major gap in the literature still exists, as not many studies are there delve into the stimulating impact of the banks’ efficiency on FI, especially through the SHG-BLP. This research gap is the motivation behind carrying out the present study.
The objectives of this research study are to analyze the overall technical and PTE of 12 Indian PSBs, engaged in the SHG-BLP scheme over the 11 years considered here. Additionally, the study seeks to identify whether any variation is there in the mean efficiency score between the top and bottom 50% of banks under two different models (CCR and BCC). The study also identifies the projection and shortfall of output.
Based on the research objectives, we have formulated the following hypotheses:
H1: The mean efficiency scores between the top 50% and the bottom 50% of banks under the CCR model does not vary.
H2: The mean efficiency scores between the top 50% and the bottom 50% of banks under the BCC model does not vary.
Materials and Methods
Data
Within the landscape of the Indian banking industry, PSBs play a crucial role in accelerating socio-economic development. In evaluating the efficiency of 12 PSBs in accomplishing social objectives by employing the DEA framework, data have been obtained from secondary sources. These are collected from databases on the Indian economy, the RBI, the status of microfinance in India, and yearly reports of individual banks accessible through the designated official website. The data have been gathered over a time interval of 11 years, from 2011–2012 to 2021–2022, to estimate bank efficiency in promoting FI through SHG-BLP initiatives.
Variable Used in the Study
It is essential to carefully select the different inputs as well as the output variables to reckon efficiency using the DEA framework. A particular batch of four input and three output variables has been determined in the present study by reviewing the available literature. Now, let us examine these particular variables in greater detail:
Common Input Variables.
We chose input variables based on various past literature (Agarwala et al., 2023; Kumar & Dhingra, 2016; Nigmonov, 2010; Saha & Ravisankar, 2000; and others). These are the number of bank branches, the number of automated teller machines (ATMs), operating expenses, and the number of employees of the bank for measuring bank efficiency. Number of bank branches:
The number of bank branches greatly influences the accessibility of financial services. An increased number of bank branches can provide SHGs and marginalized populations with a higher availability of banking services. Having more branches makes it easier for SHG members to acquire banking products such as credit, savings, and other financial needs, which fosters FI at the grassroots level. Number of ATMs:
The number of ATMs is one of the important input variables for measuring bank efficiency within SHG-BLP to promote FI. Especially where there is a lack of physical bank branches, ATMs authorize account holders (SHG members) to proceed with basic banking transactions without assistance from bank personnel. Eventually, more ATMs will play a prominent role in enhancing FI by enhancing financial accessibility, convenience, and trust among SHGs. Operating expenses:
Operational expenses are significant input variables. They have an immediate effect on the allocation of bank resources, expansion of operations, advancements in technology, cost efficiency, workforce participation, quality of services rendered, and others. Advertisement and publicity costs, rent, lighting and stationery, payments to bank employees, administrative costs, and others are the operational costs. Number of employees:
In the SHG-BLP, SHGs are linked to formal financial institutions like banks. A sufficient number of trained bank employees is needed to facilitate SHG members’ awareness of various financial products and services, provide financial assistance to SHGs, conduct educational programmes and workshops, and encourage them to actively participate in mainstream banking activities. Therefore, optimal workforce utilization can successfully promote FI among SHGs.
Common Output Variables.
The common output variables we consider under study are the number of savings accounts linked with the bank, savings deposits within the bank, and loan disbursement by the bank to SHGs. Number of savings accounts linked with the bank:
The number of savings accounts linked to the bank is a crucial output variable factor. A large number of savings accounts linked to the bank through SHGs enhanced better access to formal banking services, encouraged savings habits, assisted financial planning and transactions, increased faith in the banking system, and others, for the members of SHGs. It acts as a bridge to other financial services from the bank. Savings deposits within the bank:
Maintaining savings deposits within the bank by SHGs implies the financial empowerment of SHG members. It indicates that they participate in the formal banking system, build creditworthiness, increase savings habits, and so on. Savings within the bank serve as a safety measure in case of unforeseen circumstances or emergencies, promoting the financial stability of the members. Loan disbursement by the bank:
Bank loan disbursement to SHGs is a significant output variable for evaluating bank efficiency. By increasing loan disbursement, SHGs have enhanced access to credit facilities. The bank efficiently provides financial resources to SHGs to encourage entrepreneurial activities among the members and meet their financial needs. The members utilize these funds for income-generating activities, become more self-sufficient, and reduce poverty.
Methodology
Bank efficiency can be measured in several ways, but DEA has been a widely adopted method (Fethi & Pasiouras, 2010). It is basically a linear programming method that follows a scalar measure to assess the relative efficiency of individual units, described as DMUs (Ohsato & Takahashi, 2015). The DEA method was introduced by Charnes et al. (1978), based on the technical efficiency concept of Farrel (1957), which allows the mechanism for contrasting the efficiency of each DMU with another based on the various inputs and outputs. The objective of this method is to find out the underlying cause of inefficiency and how a DMU can maximize efficiency by improving its functioning (Řepková, 2014; Vassiloglou & Giokas, 1990).
In the present study, the efficiency of individual DMUs has been looked into by employing two models of DEA: the ‘CCR model’ introduced by Charnes et al. (1978) and the ‘BCC model’ introduced by Banker et al. (1984). The CRS assumption used by the CCR model estimates OTE. In contrast, the BCC model uses VRS assumptions to estimate PTE. Under the CRS assumption, large-sized banks generally achieve higher OTE scores by taking advantage of economies of scale (Sapci & Miles, 2019). Their widespread branch network and comprehensive resource base can facilitate greater service delivery and spread the fixed costs across a large output, thus improving efficiency. Despite this, if banks suppress the optimal levels, they may encounter diseconomies of scale and reduce efficiency. However, PTE scores are measured under VRS assumptions, isolating managerial efficiency from scale effects. Empirical evidence argues that bank size has less influence on PTE scores (Onour & Abdalla, 2011). Smaller banks can exhibit higher PTE values by managing resources efficiently, while larger banks may encounter difficulties in sustaining managerial efficiency because of a complex organizational framework. In brief, the scale effect has the potential to raise the OTE score of large banks, but this advantage does not intrinsically yield superior managerial efficiency. Therefore, the present study incorporates both the OTE and PTE scores to obtain a holistic view of bank efficiency.
The models are shown below. Assuming there are n DMUs, each DMU is set up with ‘l’ inputs and g outputs.
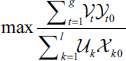
subject to
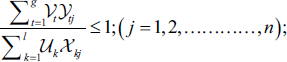

In this equation, k = 1, 2, … l, and t = 1, 2, … g, ytj indicates output t generated by DMU j; xkj implies input k associated with DMU j. vt = weight assigned to output t and uk = weight assigned to input k. To calculate the relative efficiency score of individual DMUs, this is converted to a linear programming problem.

subject to
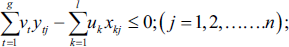


We observed from the various prior studies that they follow an input-oriented technique for evaluating efficiency. In those studies, input may be considered a key decision variable for examining DMUs. Although this perspective might not apply to all organizations, sometimes, in many organizations, the number of resources is fixed, and it is necessary to generate maximum output by utilizing this fixed quantity of resources. In this particular context, the more suitable technique may potentially be output-oriented. The current study has applied the CCR and BCC models to measure the efficiency level of DMUs (12 Indian PSBs) in facilitating FI under the SHG-BLP. An output-oriented technique has been considered in this study to maximize the output with the given level of input.
Prior to applying DEA analysis, we calculate descriptive statistics to comprehend the characteristics of the data. Also carried out an ‘isotonicity test’ on the chosen input and output variables to understand whether these specified variables adhere to the isotonicity assumptions (Golany & Roll, 1989). Using these chosen factors, we have determined the efficiency scores of every single public sector undertakings (PSUs) (DMUs) across the timeframe of 2011–2012 to 2021–2022. Under the study, OTE and PTE scores have been calculated and given ranks based on the mean efficiency score and consistency coefficient (CC). The CC is obtained by dividing the arithmetic mean (AM) by the standard deviation (SD), which serves as a composite measure of mean efficiency and its temporal stability (Agarwala et al., 2023). Therefore, incorporating both measures reflects a more resilient analysis of banks, not just average performance but also how consistently they maintain that performance. The DMUs achieving a score of 1 indicate efficiency, and those with less than 1 indicate inefficiency. Next, we tested the hypothesis using the non-parametric test, that is, Mann–Whitney U test, to know whether a variation exists in the mean efficiency score between the two groups of banks. Further, the projection and shortfall of output have been calculated. To calculate the efficiency score of banks, we used the DEA—Solver, and the Statistical Package for the Social Sciences (SPSS) software was employed to perform non-parametric analysis.
Methodological framework of the study is shown in Figure 1.
Methodological Framework.
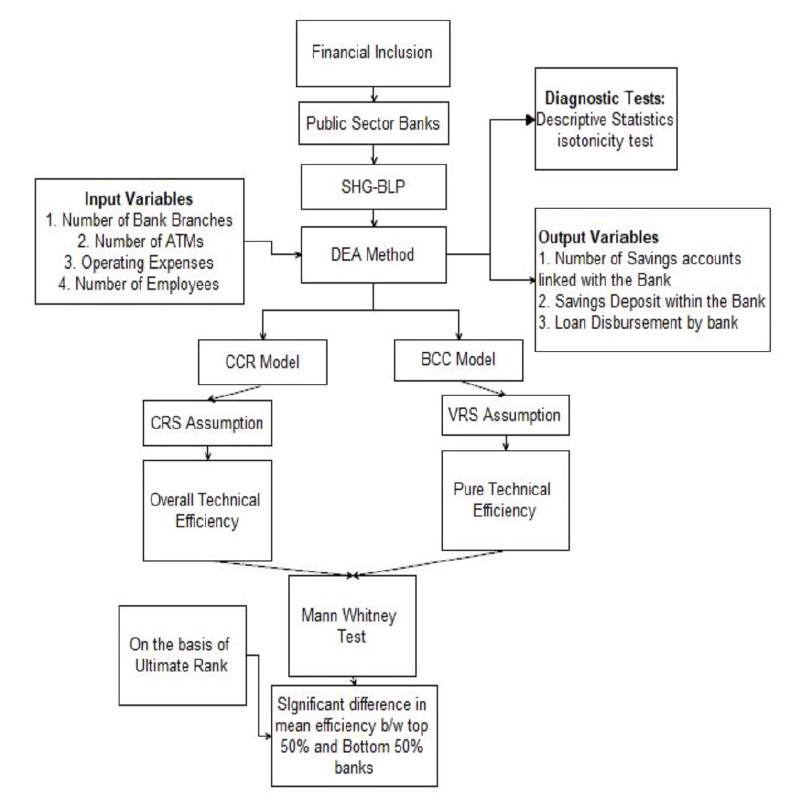
Methodological Framework.
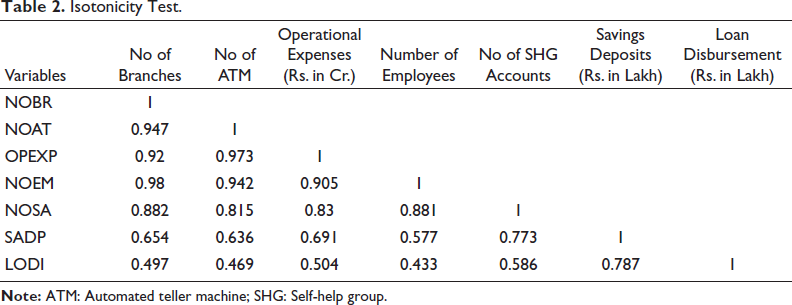
The present study examines the relative efficiency of 12 PSBs for 11 years using the DEA method. Prior to assessing efficiency, we computed descriptive statistics and an isotonicity test. Table 1 shows the descriptive statistics of the data set. The table provides information on the mean, maximum, minimum and SD, in addition to skewness and kurtosis of 132 observations on each of the inputs and outputs. Table 2 demonstrates the isotonicity test. Moreover, to ensure the applicability of the DEA model, the variables must meet the isotonicity assumption suggested by Golony and Roll (1989). Our results unequivocally identify that all the inputs and output variables under study accomplish the isotonicity assumption. A positive correlation exists between each of the inputs and outputs, meaning thereby, decreasing (or increasing) the input variables leads to reducing (or increasing) in the output variables. In addition, according to the guidelines specified by Boussofiane et al. (1991) to achieve an acceptable discriminatory power for the models (CCR and BCC), the product of inputs and outputs must be equal to the number of DMUs. Our study has 12 DMUs, with four inputs and three outputs, which is a multiple of 12. Therefore, our study satisfies the minimum acceptable DMU criteria, confirming the robustness of the model’s validity and the reliability of the research findings.
Descriptive Statistics.
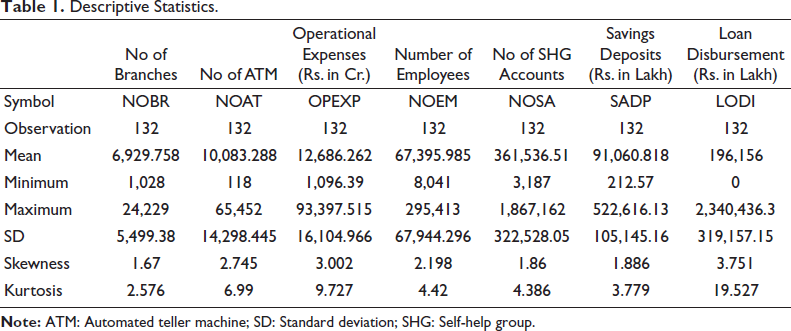
Descriptive Statistics.
Isotonicity Test.
After performing the test for the isotonicity assumption, we proceed to calculate the efficiency scores of each DMU based on the CCR and BCC models. Table 3 depicts the OTE scores from 2011–2012 to 2021–2022 for each DMU. The table reveals that Indian Bank (IB) and United Bank of India (UBI) banks maintained nearly consistent efficiency throughout the years, as evidenced by their exceptionally high mean efficiency scores in the final column. The mean efficiency score of IB is 0.999, while UBI closely followed with 0.997. According to the CCR model, United Commercial Bank (UCO) also maintains an efficiency score of 1 from 2017–2018 to 2020–2021, with a moderately high mean efficiency score of 0.722.
Efficiency Score Overall Technical Efficiency (OTE) of Decision-making Units (DMUs).
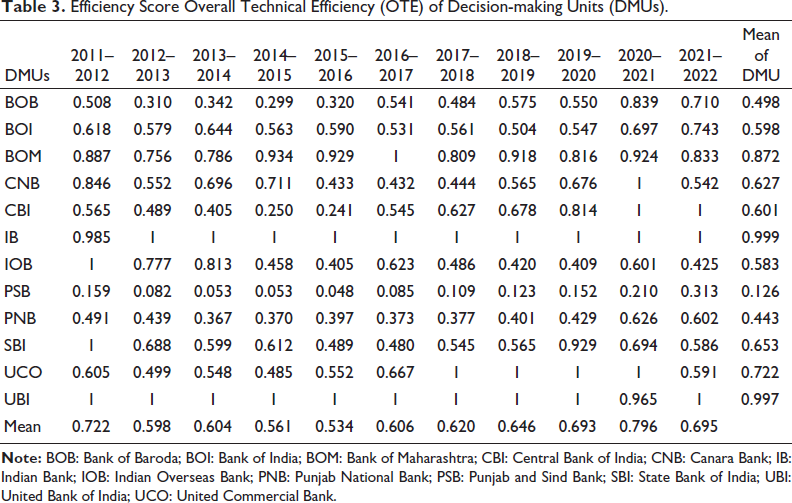
Furthermore, Bank of Maharashtra (BOM) is efficient for only 1 year, but the mean efficiency score is high (0.872). However, PSB depicts a relatively low efficiency score throughout the period, along with a lower mean efficiency score. Figure 2 and the last row of Table 3 present year-wise mean efficiency scores (OTE), which are more or less stable during the observed study period.
Year Wise Mean Efficiency Scores (Overall Technical Efficiency (OTE) and Pure Technical Efficiency (PTE)).
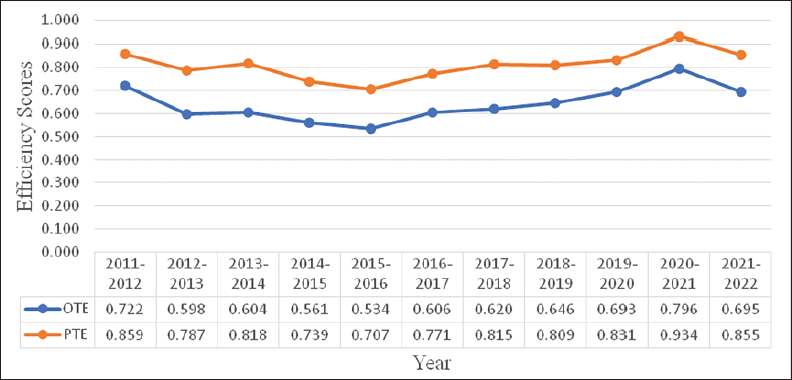
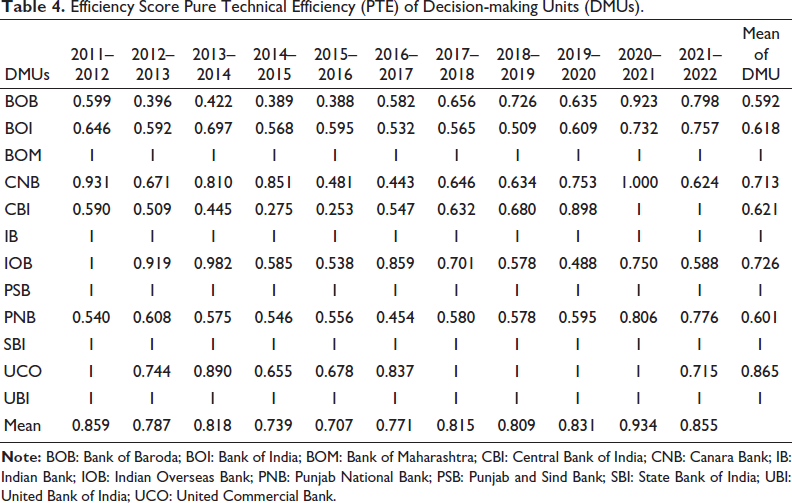
Table 4 presents the PTE scores of individual DMUs from 2011–2012 to 2021–2022. Analysis from the table emphasizes that BOM, IB, PSB, State Bank of India (SBI) and UBI banks have consistently achieved a PTE score of 1 throughout the study period, with their mean efficiency also reaching 1. This consistency illustrates that the banks mentioned above possess the highest level of PTE. Moreover, most banks are efficient in the initial year 2011–2012. On the other hand, the Central Bank of India (CBI) showcases efficiency in the last 2 years, 2020–2021 and 2021–2022, under the BCC model. Similarly, UCO Bank has been consecutively efficient for 4 years, having a mean efficiency score of 0.865. In contrast, Bank of Baroda (BOB)’s PTE scores remained consistently low across the research time frame, except for 2020–2021 and 2021–2022, with its mean efficiency score also being the lowest at 0.592 among all banks. Furthermore, from Figure 2 and the last row of Table 4, it is evident that the year-wise mean efficiency scores (PTE) are apparent, with a maximum (0.934) mean efficiency discerned in 2020–2021 and a minimum (0.707) in 2015–2016.
Efficiency Score Pure Technical Efficiency (PTE) of Decision-making Units (DMUs).
Next, we compute the AM, SD and the CC based on OTE and PTE scores, as depicted in Table 5. The ranking derived from these calculations indicates that IB secured the highest position, UBI second, BOM third, and SBI fourth. Conversely, Punjab National Bank (PNB) ranked in the bottom position based on the AM value. Additionally, ranked according to CC, IB procured the top position, followed by UBI, BOM and Bank of India (BOI), respectively, and PSB achieved the endmost position. In the final analysis from the same table (Table 5), the comprehensive ranking results reveal that IB took first place, UBI took second place, BOM got third place, and PSB received last place.
Measures of Rank Based on Efficiency Scores and Consistency Coefficient.

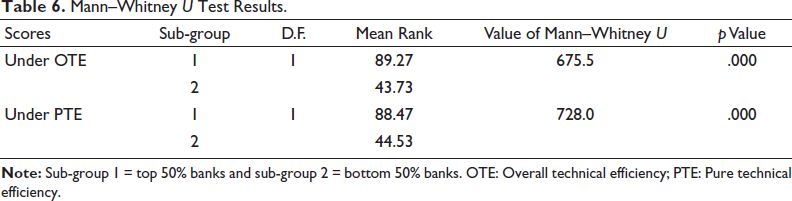
After assessing the efficiency of banks, we categorize them into two groups: the top 50% and the bottom 50%, based on the ultimate ranks. At the outset, it is obvious that the OTE and PTE scores of the top 50 % of banks should be higher than those of the bottom 50%. However, the major issue is to assert whether the disparity between the two groups of banks in OTE and PTE is negligible, which can be overlooked, or whether the difference between the two groups is statistically significant. So, we establish our hypothesis (H0) validity by applying the Maan–Whitney U test. The argument for selecting the test is that the data set does not satisfy the normality assumption. A non-parametric statistical test may be the most suitable option for this circumstance. This test is used to find significant variations in the mean efficiency in the two groups of banks based on the OTE and PTE scores. According to Table 6, the Maan–Whitney U test results reveal that at the 5% level, the variation in the mean efficiency scores between the top 50% and bottom 50% of the banks is significant under the CCR model. Similarly, under the BCC model, there also exists statistically significant variation in the mean efficiency score between the top 50% and bottom 50% of banks. Therefore, H1 and H2 (null hypotheses) are rejected.
Mann–Whitney U Test Results.
So, we find a statistically significant difference in the efficiency level—both OTE and PTE—for the two groups of banks, that is, the top 50% and the bottom 50%. Hence, one pertaining question may arise: Why is the difference in the efficiency level statistically significant, even though both groups of banks belong to the same category of bank, that is, PSB? The answer to this question is that a separate study is required to ascertain the reason for such differences. However, from the present analysis of data, some apparent factors responsible for such differences may be identified. Table 2 shows the degree of correlation between each input and each of the individual outputs. Table 2 exhibits a strong positive correlation (0.83) between operational expenses and the number of SHG accounts, a moderate to strong (0.691) correlation between operational expenses and savings deposits, and also a moderate (0.504) correlation between operational expenses and loan disbursement, which suggests that operational expenses have substantial factors responsible for a statistically significant difference in the two groups.
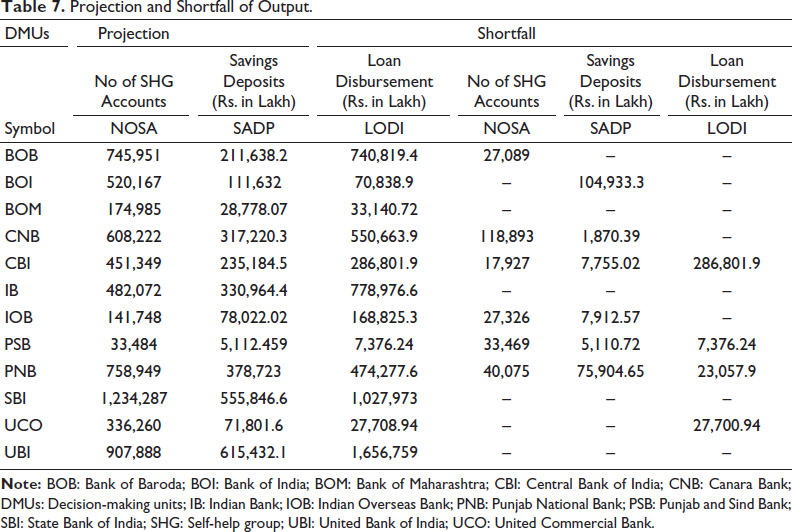
Here, we follow the output-oriented technique to measure efficiency. In this technique, the main target is to maximize output at the given level of input, accomplished by the DMUs. Table 7 displays the projection and shortfall of each DMU. According to Marschall and Flessa (2011), a DMU is considered efficient when it does not have any shortfall in output. Table 7 shows that only four (i.e., IB, UBI, BOM, SBI) banks are efficient among the 12 banks. These banks remain in the top four regarding the ultimate rank of bank efficiency. In our previously mentioned results, it has been observed that there have been significant differences in the mean efficiency between the two groups of banks (i.e., top 50% and bottom 50%). Therefore, the present finding validates that these top four banks are in the top 50% category and are most efficient in facilitating FI through the SHG-BLP.
Projection and Shortfall of Output.
The SHG-BLP is a prominent microfinance model in India. This group-based initiative significantly contributes to fostering FI by linking SHGs to formal financial institutions. Against this backdrop, banks play a significant role in rendering credit support to SHG members, providing financial services, building saving habits, reducing unemployment, curtailing informal lending, enhancing financial literacy, and promoting economic independence. Banks are responsible for achieving the targets of this initiative, making it essential to measure their efficiency.
The current study evaluates the efficiency of 12 PSBs using the DEA approach to identify which banks perform better in achieving FI through the SHG-BLP. An output-oriented approach was employed to calculate OTE and PTE scores using the CCR and BCC models. The analysis reveals that under the CCR model, the IB and UBI are consistently efficient. Under the BCC model, the BOM, IB, PSB, SBI and UBI are consistently efficient throughout the study period, with high mean efficiency scores. Furthermore, in terms of overall ranking, IB ranks the highest, followed by UBI and BOM, and PSB ranks at the bottom. The Mann–Whitney U test was used to check the validation of the hypothesis. The result exhibits a significant variance in the mean efficiency of the top 50% of banks compared to the bottom 50% under both assumptions (CRS and VRS). The projection and shortfall analysis indicate that only four out of the 12 banks are efficient.
The major contribution of the present study is the identification of the relatively poorly performing PSBs. In light of the research findings, it can be asserted that the banks that are not efficient in managing the SHG-BLP contribute less towards promoting FI. These organizations need to strengthen their internal management practices and optimize the scale of operations. However, proving this claim is beyond the scope of the present study. Continuous monitoring of the efficiency aids in detecting the hurdles in the successful operation of this programme, and in taking required action at an early stage to overcome such challenges. Facilitating digital banking services for SHG members will also facilitate financial and social inclusion.
A limitation of our study is that we have only measured the efficiency of PSU. However, PVBs, RRBs, and cooperative banks also participate in the SHG-BLP. Further study is required to understand the broader picture in this context.
Footnotes
Acknowledgements
The authors express their gratitude to the authority of NIT Agartala for providing the necessary infrastructure and resources to carry out the research work smoothly.
Authors Contribution
Indrajit Singha: Contributed to conceiving the idea of the manuscript, forming the methodological design and collection of necessary data; made all the computations and drafted the manuscript.
Debasis Neogi: Contributed to conceptualization of the manuscript, drafting the methodology, critically reviewing and editing the manuscript.
Declaration of Conflicting Interests
The authors declared no potential conflicts of interest with respect to the research, authorship and/or publication of this article.
Ethical Declaration
The authors abide by all the ethics involved in this academic work and have not submitted it to any other journal.
Funding
The authors received no financial support for the research, authorship and/or publication of this article.
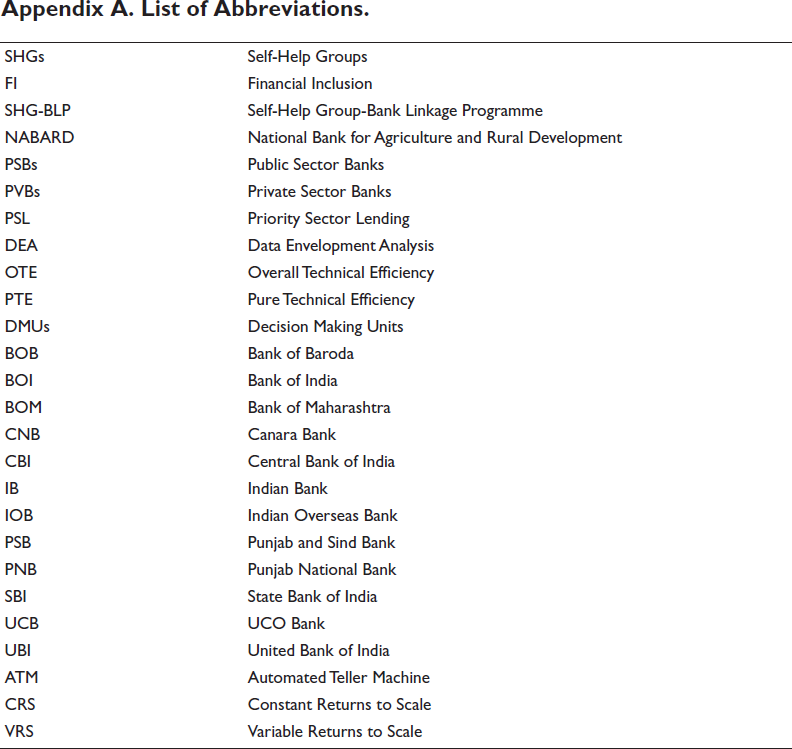
Appendix A. List of Abbreviations.
| SHGs | Self-Help Groups |
| FI | Financial Inclusion |
| SHG-BLP | Self-Help Group-Bank Linkage Programme |
| NABARD | National Bank for Agriculture and Rural Development |
| PSBs | Public Sector Banks |
| PVBs | Private Sector Banks |
| PSL | Priority Sector Lending |
| DEA | Data Envelopment Analysis |
| OTE | Overall Technical Efficiency |
| PTE | Pure Technical Efficiency |
| DMUs | Decision Making Units |
| BOB | Bank of Baroda |
| BOI | Bank of India |
| BOM | Bank of Maharashtra |
| CNB | Canara Bank |
| CBI | Central Bank of India |
| IB | Indian Bank |
| IOB | Indian Overseas Bank |
| PSB | Punjab and Sind Bank |
| PNB | Punjab National Bank |
| SBI | State Bank of India |
| UCB | UCO Bank |
| UBI | United Bank of India |
| ATM | Automated Teller Machine |
| CRS | Constant Returns to Scale |
| VRS | Variable Returns to Scale |