
Abstract
After financial reforms, banks in India adopted financial innovation to earn more profits through various off-balance sheet tools. To gauge the impact of these items on the efficiency of selected banks, we used the non-parametric Malmquist method. We calculated the efficiency with and without inclusion of these items. Technical and technological efficiency changes were calculated to make total factor productivity change index for 10 years (2008–2017). The results for the banks strengthen the dominant view in the current literature, removing off-balance sheet items led to a biased efficiency of these banks. The presence of these items increased the efficiency of the banks. Nonetheless, it also supported that increment in efficiency was more due to technological change. Despite the odd distribution of these items among these banks, they made a significant pie in the income of banks and overlooking them eroded the efficiency of the banks.
Keywords
Executive Summary
This research is intending to find the effect of off-balance sheet items (OBSI) on efficiency through DEAP-Malmquist model. The entire study has been divided into 11 heads and further their sub-points.
The introductory section talks about the understanding and brief background about the OBSI. It also mentions the change happens in the Indian bank space due to cut-throat competition. The objective section described the objective of the study and requirement of the study.
An extensive review of literature has been done to understand the methodology of various other national and international studies in similar capacities. Further, we compare all of these studies in a table for more clarity about methodology, data collection and analysis and results.
A brief about the concept of Malmquist methodology has been explained. This model further broke up the total factor productivity into efficiency and technological change to evaluate the impact of these items on the efficiency. For executing the model, we also identified the input–output variables to determine efficiency through reviewed literature. Source of data collection and sampling details have been done with further scope of the study. DEAP software used to calculate the Malmquist Index with use complete data set of 21 banks input and output variable for 10 years.
Finally, this paper talked about the inferences and results of the model. The results have suggested, despite the uneven distribution of OBSI among the banking groups studied and between the various banking institutions in India, the omission of OBSI in defining banking production, underestimates the efficiency which can generate distorted inferences.
Introduction
The off-balance sheet items (OBSI) are non-traditional activities as they are not recorded on-balance sheet. The firms manoeuvre their corporate financial tactics based on these items. So, OBSI fund assets in such a way that they become stealth on the balance sheet. Firms using these financial tactics for various reasons. If these reasons become uncontrollable than Enron happens else, they try to increase the wealth for firms and shareholders. OBSI are creating a significant portion of non-traditional income wizard for private and public banks in India. As nationalized banks did not give much significance to these items but since liberalization of Indian economy, they have to find a modern source of income. The competition could not be won only relying on core banking products. Indian banking is changing but slowly and painfully.
OBSI are basically growing through innovation and improvements in technology, financial products and supported by the liberalization in monetary policy in India. The income from OBSI as noninterest income started playing a significant role in the productivity of banks. The percentage of OBSI in the bank asset is rapidly increasing in the last two decades. The productivity of the banks might change as per the determinants of OBSI. As banks are becoming more skilled in the product offering of OBSI to investors so, these off-balance sheet activities might be affecting the operating efficiency and profit year by year.
OBSI are not only increasing sources of income for the banks but also these items make them vulnerable to other risks also. One might observe the productivity change in the bank activities through the involvement of OBSI in output–input ratios. Although banks are recording their productivity through on-balance sheet items but not through the OBSI window. Based on the data submitted to Reserve Bank of India (RBI) by these banks, it seems that banks are reluctant to give accurate figures of income generated through the OBSI. So, we used data envelopment analysis (DEA), based on Malmquist theory to measure the bank productivity in terms of mean efficiency change, mean technology change and total factor productivity (TFP) change.
The aim of this study is to understand how banks’ productivity has been impacted by these OBSI for the period of 2008–2017. We measured these efficiency scores with and without exclusion of OBSI and compared the mean difference among them. The time horizon for the study has been taken the period of 2008–2017 by freezing the data up till 31 March 2017 as various business expansion strategies have been executed in terms of mergers and acquisitions in the Indian banking industry. However, no major Indian study has been done in the similar context to understand the significant contribution of OBSI in the productivity of top public sector banks (PSBs) for the given time frame. So this creates a gap in the Indian literature since the previous study missed such types of investigations. This study tried to find the answer as what will be the productivity if OBSI are off and on while calculating those sub-efficiency scores. The results have suggested, despite the uneven distribution of OBSI among the banking groups studied and between the various banking institutions in India, the omission of OBSI in defining banking production, underestimates the efficiency which can generate distorted inferences.
Objective of the Study
This study is intending to find the effect of OBSI on efficiency through DEAP (data envelopment analysis programme)-Malmquist model. This method is further breaking up total factor efficiency (TFE) into and technological change (TC) and efficiency change (EC) to evaluate the effect of these items on the efficiency.
The objective is as follows:
To analyse the effect of OBSI on the efficiency of selected banks in India.
The time frame of the study has been from 2008 to 2017. We freezed the data up till 31 March 2017. This time frame is securing us from overlapped data because of mergers and takeovers happened in the Indian banking industry.
Details of Literature Review
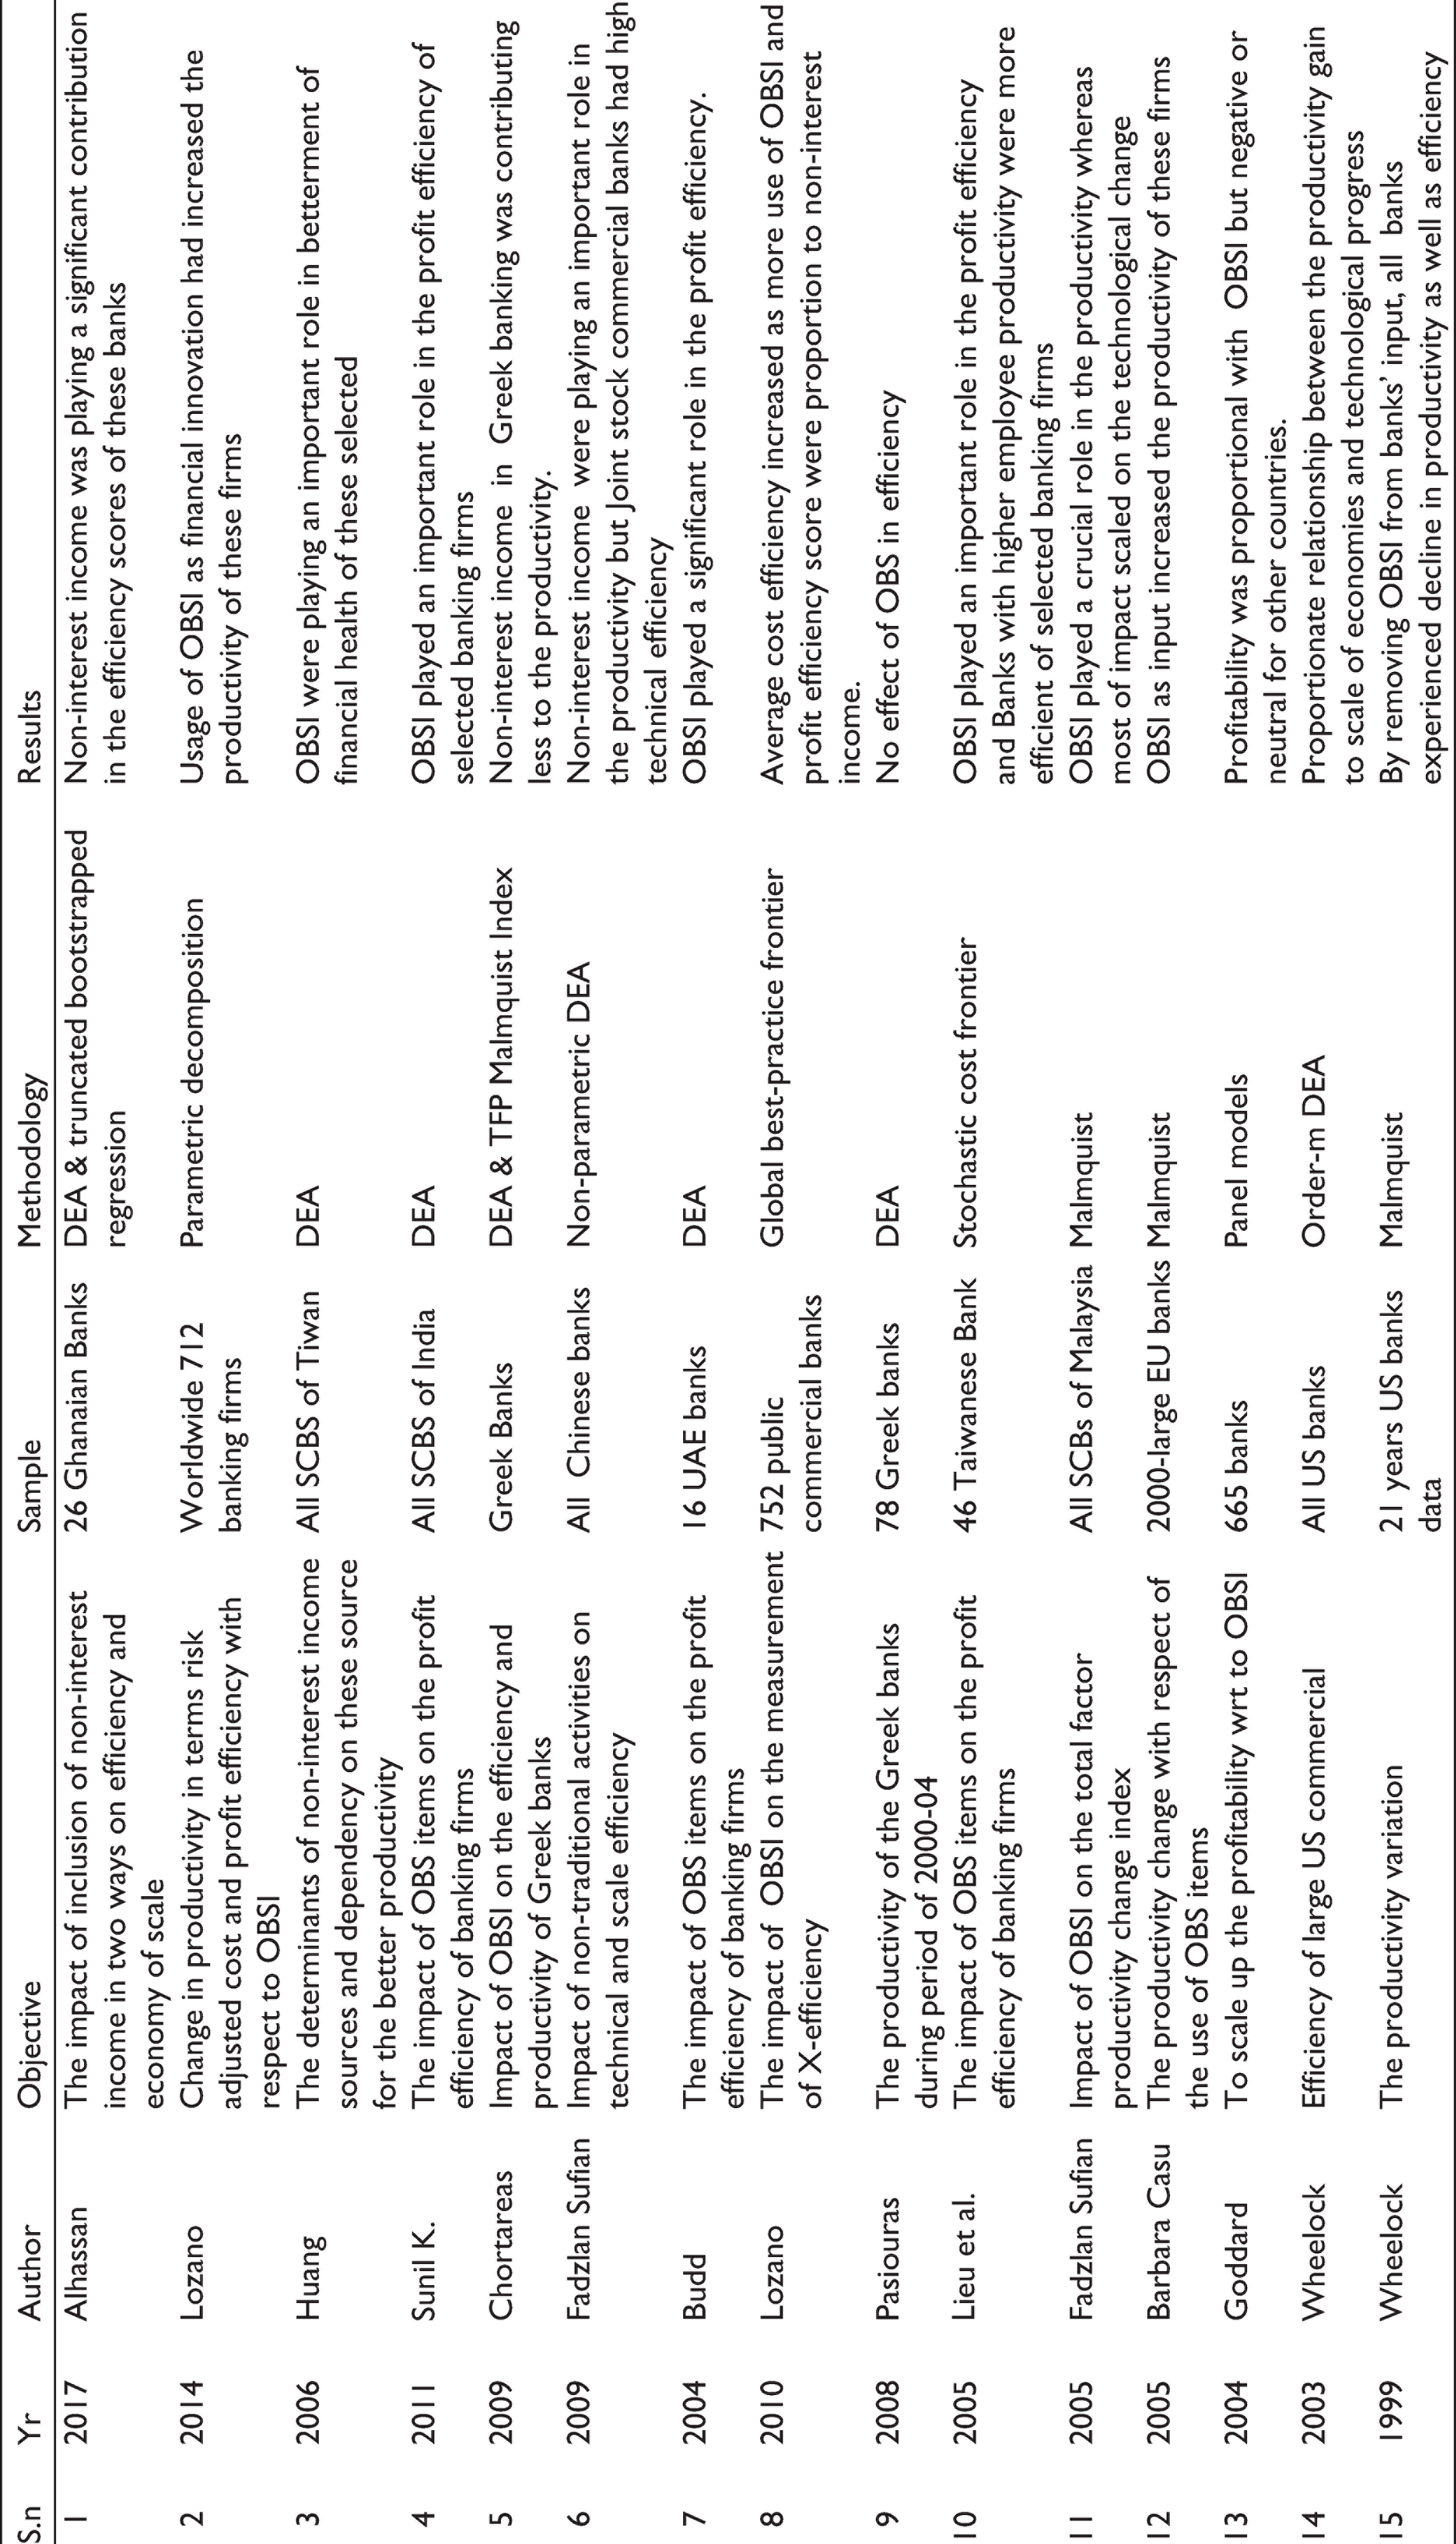
To understand the research question, 15 research papers reviewed. This research including the recently reviewed studies during the last 6 months have inferred the positive affiliation between OBSI and efficiency does exist. We summarized these researches in a meaningful manner and the crux of reviewed papers is as followed:
Alhassan and Tetteh (2017) scaled up Ghanaian banks to find the effect OBSI on efficiency and economy of scale. The authors used DEA as per input and output vectors defined for OBSI income of 26 top Ghanaian Bank for the period of 2003–2011. The authors used truncated bootstrapped regression model. They examined the effect of variables on efficiency scores. They resulted that noninterest income was playing a significant contribution to the efficiency scores of these banks. This research could have used the stochastic frontier analysis and the flexible Fourier techniques for the similar analysis to remove the complex computations as this empirical investigation might miss the optimal determinant where firms leverage their size to remain efficient in commotion.
Lozano et al. (2014) researched relationship between efficiency and OBSI. They took risk-adjusted cost and profit efficiency with respect to OBSI. They used a parametric decomposition method for this analysis. The authors dug out 4,894 observations of 712 banking firms from 84 countries to understand differences on the efficiency of these banking firms. They found efficiency of these sampled banks across group countries was not homogeneous. The use of OBSI as financial innovation had increased the efficiency of these firms. The results were not clearing individual impact of OBSI on the group banks as these banks were operating the different ecosystems. This issue should have been addressed as these all banking firms were operating in different macro- and micro-environments with different monetary objectives and limitations.
Huang et al. (2006) explored the determinants of non-traditional revenue sources with dependency on these sources for better efficiency in Taiwanese banking system. The authors used the DEA to analyse cost efficiency for the period of 1992–2004. This process resulted that OBSI were playing an important role in the betterment of financial health of these selected banking firms. With cost efficiency and use of OBSI were at prime level during the opted period. This research had not evidently identified the determinants of OBSI which were contributing clearly in noninterest income as a few noninterest income had a correlation with traditional interest activities in Taiwan.
Kumar (2011) explored the influence of OBSI on the profit efficiency of banks in India for 1992–2008 financial years. This study used DEA model estimating profit efficiency scores with alternate inclusion and exclusion of OBSI. The author compared these results and found OBSI played a key part in the profit efficiency. They also found about foreign banks were more efficient than any other banking group in the usage of OBSI. This research could have used the stochastic frontier analysis and the flexible Fourier techniques for the similar analysis to remove the complex computations as this empirical investigation might miss the optimal determinant where firms leverage their size to remain efficient. The author could have done the comparison between commercial banks and cooperative banks also for sectorial analysis.
Chortareas, Girardone, and Ventouri (2009) used Malmquist model to explore the efficiency of Greek banks. The authors found that due to competition, banks increased the OBSI to grow their income but the increment in OBSI had not increased the efficiency factors in banks. The authors inferred that OBS (off-balance sheet) activities were not contributing significantly to the efficiency of the Greek Banking. The researchers should have considered a longer time frame with the inclusion of macro- and microeconomic indicators with firms’ market capitalization. As these factors are directly or indirectly impact the productivity of the banks.
Budd and Budd (2004) explored UAE banks to understand the effect of OBSI on profit efficiency. They used DEA method to estimate profit efficiency scores. They used 16 UAE banks with alternative inclusion and exclusion of OBSI. The authors compared these results and found that OBSI played an important role in profit efficiency. The researchers should have considered a longer time frame with the inclusion of macro- and microeconomic indicators with firms’ market capitalization.
Sufian (2009) studied technical and scale efficiency through the window of OBSI. They used non-parametric DEA methods. The author used all Chinese banks’ data set for the period of 2000–2005. They made in and out placement of non-traditional activities. The author found these items were playing a sound role in the efficiency of nationalized banks but joint-stock commercial banks had high technical efficiency. This research could have used production function with the combination of intermediation approach. Further, the author should have used stochastic frontier analysis for more efficient results with non-parametric testing.
Lozano et al. (2010) examined the effect of OBSI on measured X-efficiency. They performed a wide cross-country international comparison taking in country-specific differences. The author used 752 bank data of 87 countries for the period of 1999–2006. They calculated cost efficiency and alternative profit efficiency through global bestpractice frontier. The author found average cost efficiency increased due to more usage of OBSI/noninterest income but profit efficiency scores were propionate to noninterest income. The results were not clearing individual impact of OBSI on the group banks as these banks were operating the different ecosystems. This issue should have been addressed as these all banking firms were operating in different macro- and micro-environments with different monetary objectives and limitations.
Goddard, Molyneux, and Wilson (2004) examined 665 bank data through cross-sectional, pooled cross-sectional time-series and dynamic panel models to analyse the profitability during the period of 1992–1998. The authors observed that competition had not paid any vital role in the persistency of abnormal profits these selected banks. The authors also found that profitability of UK banks was proportionate with the use of OBSI but for other countries, it was either negative or neutral. The researchers should have considered a longer time frame with the inclusion of macro- and microeconomic indicators with firms’ market capitalization.
Pasiouras (2008) investigated the efficiency of the Greek banks during the period of 2000–2004. The author employed DEA, profit and intermediate approach to the bank data set. These approaches showed that inclusion of OBSI had not increased the efficiency score of Greek banks. The author also concluded that banks expanded in foreign territory and having more branches were more efficient than other banks at national level. The researchers should have considered a longer time frame with the inclusion of macro- and microeconomic indicators with firms’ market capitalization. As these factors are directly or indirectly impact the productivity of the banks. The author could have done the comparison between commercial banks and cooperative banks, and another scenario of comparison of domestic banks with foreign banks could have been carried out for more exploration.
Lieu et al. (2005) explored the impact of OBSI on the profit efficiency of banking firms in Taiwan for the period of 1998–2001 financial years. This empirical study used stochastic cost frontier method. They estimated profit efficiency scores of 46 Taiwanese banks with alternative inclusion and exclusion of OBSI. The authors compared these results and found OBSI played a significant part in profit efficiency. Banks with higher employee efficiency were more efficient. The researchers should have considered a longer time frame with larger observations with the inclusion of macro- and microeconomic indicators with firms’ market capitalization. These factors are directly or indirectly impact the productivity of the banks.
Sufian et al. (2005) investigated the effect of OBSI on the TFE change index. They used DEA-Malmquist method. The authors used all Malaysian banks for the period of 2001–2003. The authors found OBSI were playing an important role in the efficiency of these Malay banks, whereas most of impact scaled on the TC. This research is limited to very short span of time which is again the post-merger scenario in Malay banking. This might be hampering the results in terms of accuracy of the data as mergers always conclave pro and cons of the financial health.
Casu et al. (2005) explored the EC with respect to the use of OBSI in large EU banking firms. The authors intensively used non-parametric Malmquist to examine outputs of these banks with respect to the TFE change index. The authors drawn data set from Bank Scope over 2,000 European banks for the period of 1994 and 2000. They resulted OBSI as input increased the efficiency of these firms. The results were not clearing individual impact of OBSI on the group banks as these banks were operating the different ecosystems. This issue should have been addressed as all these banking firms were operating in different macro- and micro-environments with different monetary objectives and limitations.
Wheelock and Wilson (2003) researched the efficiency of large US commercial banks for the period of 1993–2003. The authors engaged the order-m DEA process. They used it to understand efficiency across all bank sizes. As this worked on relative to expected max output. They inferred that efficiency was improved across all bank size. This gain was highest for banks where larger asset size declined. The authors also found proportional relationship between the efficiency gain to scale of economies and technological progress. This research could have used production function with the combination of intermediation approach. Furthermore, the authors should have used stochastic frontier analysis for more efficient results with non-parametric testing (Table 1).
Result of Reviewed Literature and Gap
The result of reviewed literature suggested the investigators from different countries have used different models to calculate the efficiency of banks using noninterest income as a substitution of OBSI. Indian researchers such as Mukherjee (2002), Sathye (2003), Ram Mohan and Ray (2004), Shanmugam and Das (2004), Chakrabarti and Chawla (2005), Das and Ghosh (2006), Debasish (2006), Dash and Bhole (2007) and Ray and Das (2010) recognized the importance of noninterest income. They used this income as proxy for OBSI to study the risk involvement but not the impact of productivity.
Foreign authors such as Chortareas et al. (2009), Pasiouras (2008), Jagtiani, Nathan, and Sick (1995), and Jagtiani, Saunders, and Udell (1995) concluded that excluding noninterest income as substitution for OBSI not only hampered the efficiency of their selected banks for the different time zones but also changed bank ranks. So, we can confer through existing literature that non-inclusion of OBSI in output vector would create an inclined inference. For Indian banking, the efficiency calculation based on proxied OBSI has not explored properly. So, we analysed EC with and without of OBSI for the period of 2008–2017.
Methodology
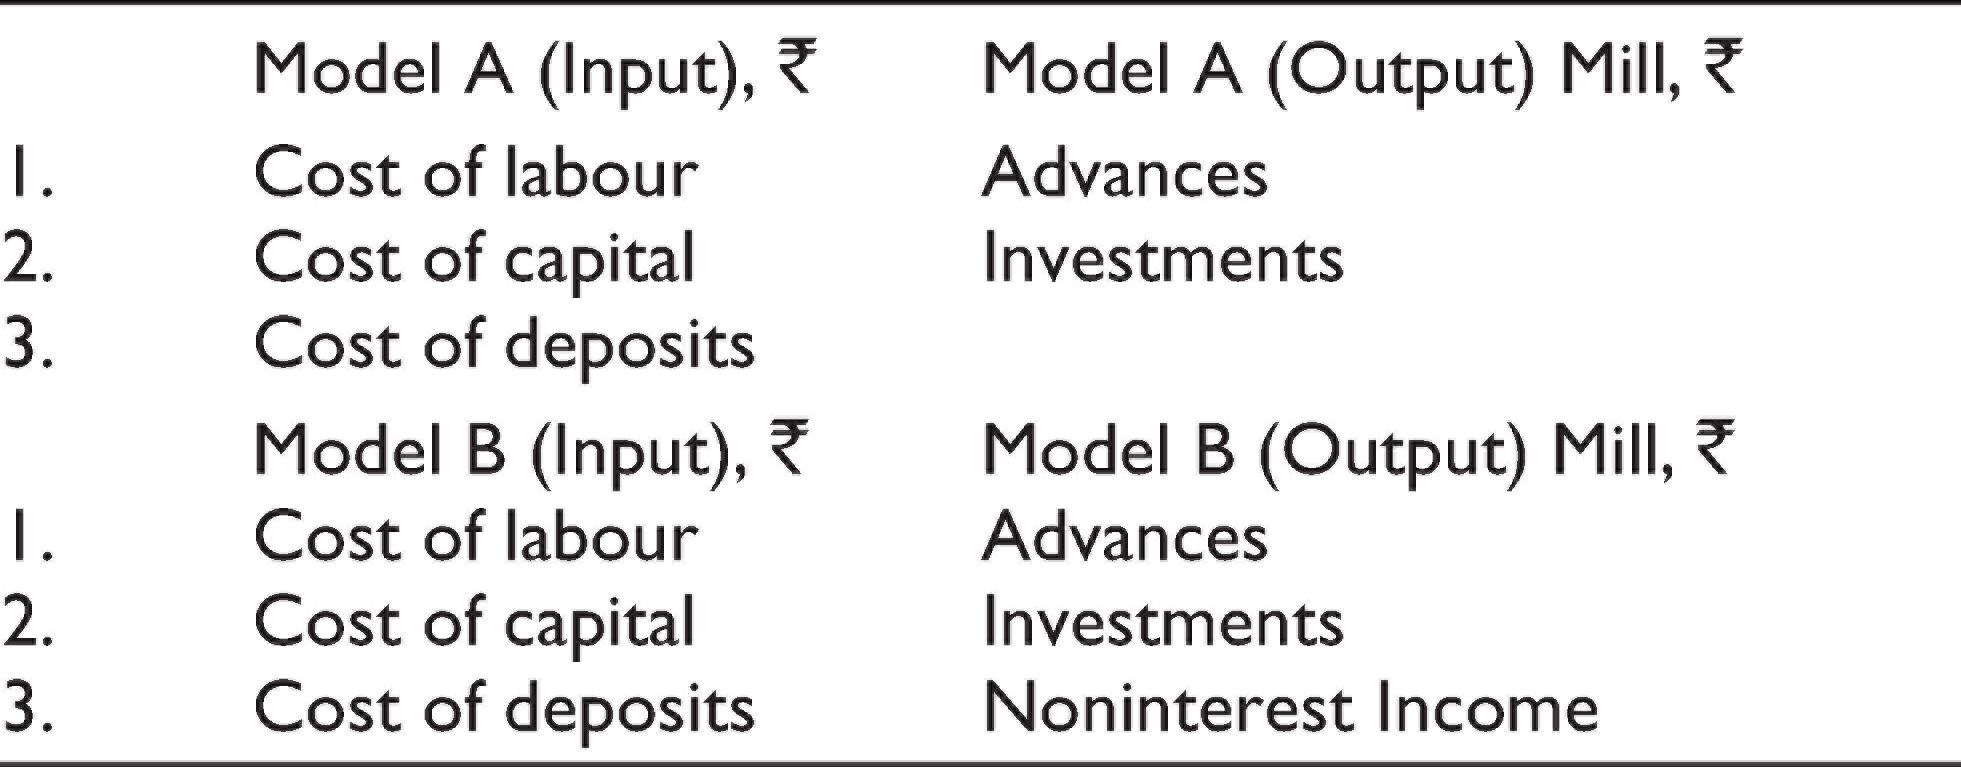
We fixed Models A and Model B, respectively, with and without noninterest income as a proxy for OBSI. Then compared the efficiency differences between them. We calculated the efficiency by employing DEA-Malmquist method and further checked the difference of means for the robustness of these models.
There are two significant ways to find out inputs and outputs to calculate efficiency for a bank:
The production approach (Benston, 1965) The intermediation approach (Sealey & Lindley, 1977)
The Production Approach: This approach assumed banks as service providers for their clients. The service is measured by transactions done and processed documents. The data of deposits and loan accounts can be considered in lieu of formers. This theory based on operating costs as:
Cost of labour, space, IT systems, raw materials or input-associated costs.
The Intermediation Approach: This approach assumed banks as financial intermediaries that channelized money between investors and creditors. With this process, banks generate brokerage through the collection of deposits and other liabilities. These fee-based items are loans, securities and other investment instruments.
Comparative Matrix of Reviewed Literature
The Difference: The intermediation approach took deposits as inputs with interest and operating costs. But for productivity or efficiency calculation, Berger and Humphrey (1997) not agree with both approaches as these ways could clarify the dual role of banks. They found that for bank-level efficiency broker approach was more accurate. For branch level productivity, the production approach was more accurate. At the bank level, the administration will try to lessen total costs. While at the branch level, most customer service processes are performed and no financing or investment decisions are made. They are usually under the control of branches. Further, in practice, the availability of flow data needed by the production. This approach is usually exceptional and is not common.
Identifying the Input–Output to Determine Efficiency Through Reviewed Literature
The intermediation approach is output oriented in which deposits, labour and physical capital are basic inputs. The input variables are used as follows:
Cost of work = personnel expenditure Cost of deposits = interest expenditure Cost of capital = total operating expenditure
The calculations of input costs are as follows:
Labour cost = Staff costs/total assets Cost of deposits = Interest charges/customer deposits Cost of capital = Total capital expenditure/total fixed assets
The following are the main exit factors that have been identified through the literature review (Elyasiani & Mehdian, 1990): noninterest income, advances and investments.
Table 2 presents two different pairs of input and out variables for Models A and B. We used intermediate approach to examine the role of OBSI on bank efficiency. The two outputs of Model A are advances and investments. As it was a specific consideration in the intermediation approach that provides efficient bank performance only from the view of financial intermediation. It ignores OBSI, the main source of income for these banks in India. In Model B, we introduce noninterest income as a representation of OBSI as an extra product to explain the fact. In contemporary time, to generate more risk-free income these banks are heavily involved in OBSI.
Model Frame
Hypothesis for the Robustness of Models
H0: the mean efficiency of Models A and B is equal.
The DEAP-Malmquist Approach
TFP measures change in total production to inputs. This concept is derived from the ideas of Malmquist (1953) and the distance function approach.
Malmquist (1953) propagated TFP can measure change in total production to inputs. Cave (1982b) explores the productivity indices which is the base of theoretical framework for efficiency. The Malmquist productivity Index number approach was further derivation of this approach. This concept is widely used for the calculation of EC. The output distance function which is closely related to Malmquist is as followed:
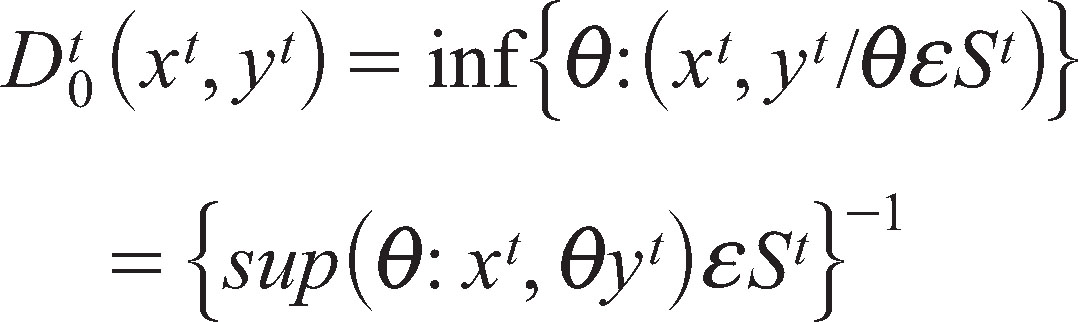
The biggest ratio increase in output is measured by the inverse of distance function. The calculation of distance from the technology boundary is calculated by Farrell’s (1957) technical o/p efficiency.
So, for two different time periods, we can define the distance function as follows:
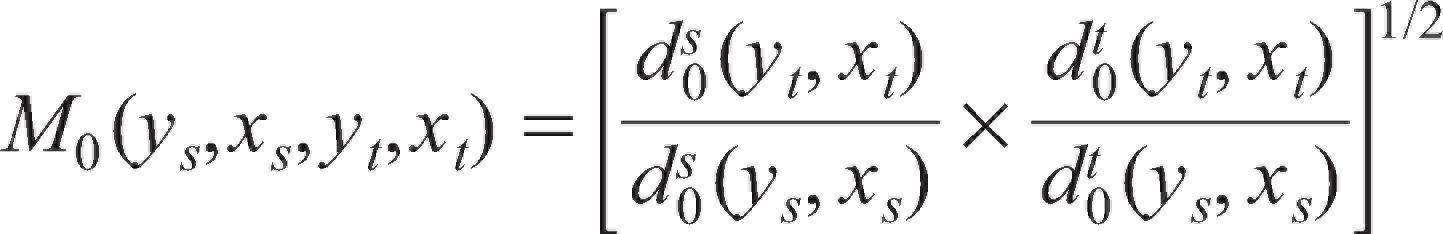
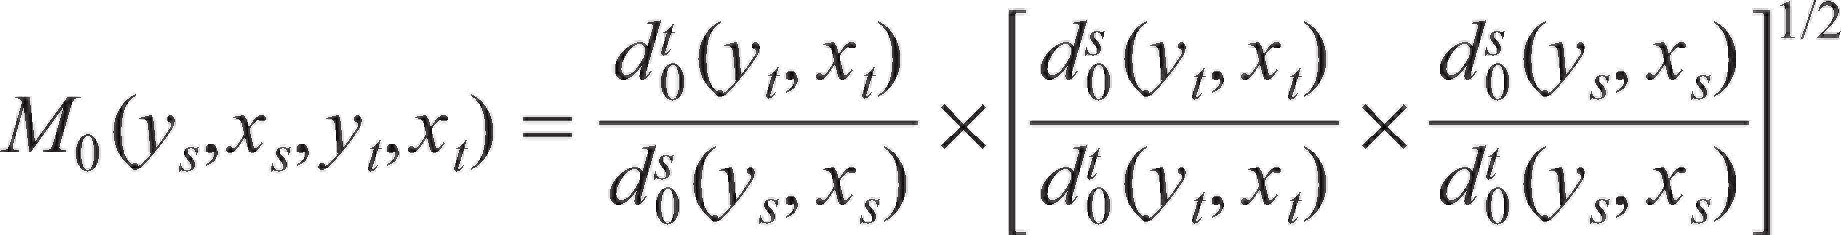
This distance function measures the maximum proportional change in the needed outputs so that (xt+1, yt+1) is feasible to the technology in t. Following Färe, Grosskopf, and Roos (1997), the Malmquist TFP exchange rate (output-oriented) between the s periods (the base period) and the period t is given by:

where
If M0 > 1 means a progressive growth of the TFP.
If M0 < 1 a decrease in the TFP.
If we define Equation (3) in terms of geometric mean with respect to time s and t than Malmquist Index will be:

The remainder of the index in Equation (4) is a measure of technical change. It is the geometric mean of change in technology between the two periods, evaluated Xt and Xs.
Therefore,
The change in efficiency (M0) is disintegrated into TC and technical change efficiency (TCE). TC is reflecting change in the performance of the best-practice decision-making groups (DMU), whereas TCE reflects the convergence or divergence of the best practices of the remaining DMU. Breaking up the value is that it provides information on the sources of variation of the overall efficiency. The Malmquist TFP index is made of distance function.
Why DEAP-Malmquist Model?
As per the ROL in the banking industry, researchers basically used three methods to gauge the productivity of the firms through the following:
Malmquist Index Tornqvist Index Fisher Index
While calculating the Tornqvist Index and Fisher Index, one has to test the assumptions of maximizing the profits or minimization of the cost. The two indexing theory has another assumption of acquiring full information of input–output variable prices as per the given time frame. Apart from these points, if researchers have panel data than there is no scope to calculate the productivity panel by panel through these models. The Malmquist indexing allows us to use the panel data productivity calculation as it facilitates the decomposition of productivity changes into technical EC and technical change indices. Apart from this, researchers need not to follow the profit maximization assumption and they can leave the input–output pricing as per the given time frame. A demerit which the Malmquist model is carrying as it cannot calculate the distance function among the panel variables. This demerit can be removed by DEA method. So in this study, we used DEA-Malmquist techniques to generate the decomposed indices of efficiency to understand the impact of OBSI to the productivity of top PSBs in India.
Scope and Limitation
The scope of the study is restricted to assess reasons affecting off-balance sheet financing practices in the selected commercial banks in India. These banks have at least 10 years of data submitted to RBI for the period of 2008–2017. The investigation would prove an extra edge for management, government, investors, professionals and academicians by giving helpful conclusions to take strategic business decision. This investigation has been carried out for the time frame of 2008–2017 only and does not include the Indian banking life span and the present examination is taken up with the chosen only 21 public banks which further may be extended to entire banking firms community and wider time frame for better understanding the role of OBS activities in this arena. The determinants of efficiencies used in this study are those often described in conventional banking studies and literature. Further, the study used bank data and countrywide macroeconomic data that is determined from RBI to define macroeconomic variables. Since the limited research exists on OBS financing practices in India, the study is built on the current body of knowledge and studies conducted majorly in other countries’ context.
Details of Sampling and Data Collection
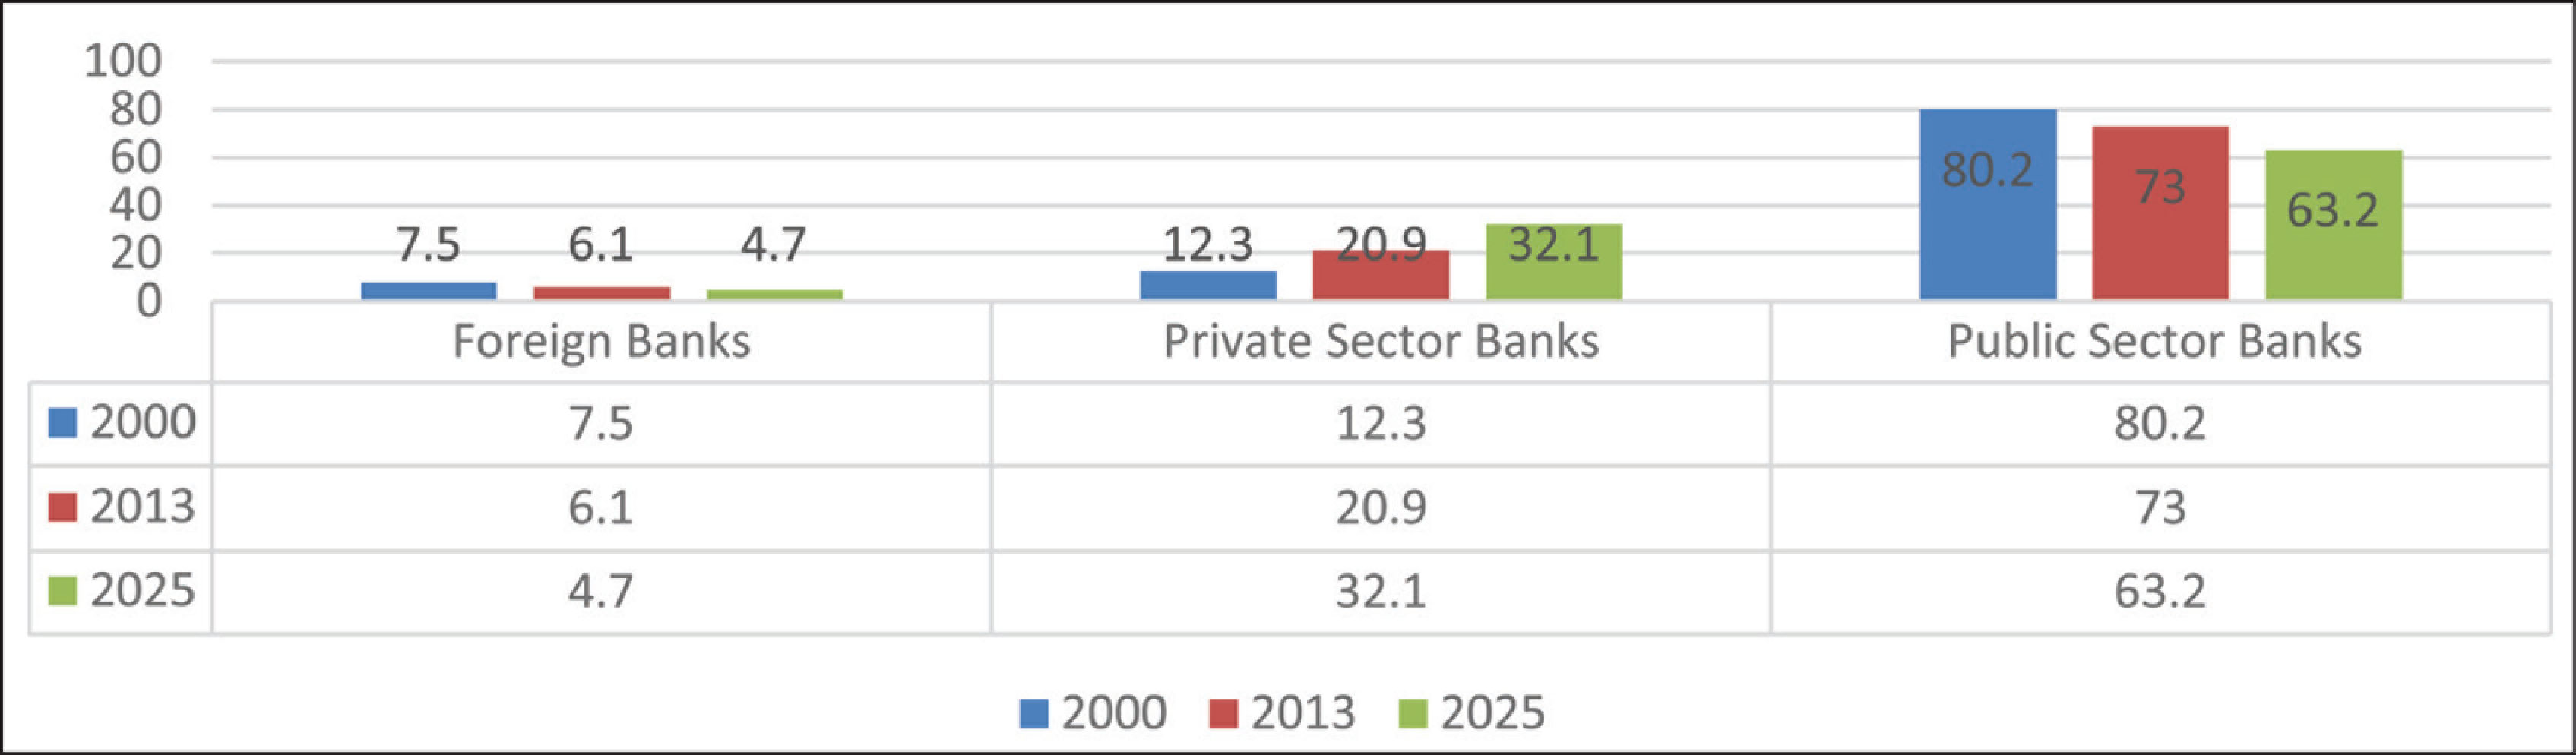
For this study, the target banking firms are 21 and all those firms are listed on NSE. This sample size covers around 80 per cent of the public market share of India and all have been regularly pied in bank nifty index since 2008 (Figure 1).
The sampling technique used is purposive sampling. Purposive sampling used because it allows focusing on particular features of a selected population, which will best enable to answer research questions.
The secondary data collected on the Population of Indian Banking Sector (SCBs) including the annual reports of banks, Indian Banker’s Association (IBA) and the RBI. ‘Financial Analysis of Banks’ brought by IBA, ‘Statistical Tables Relating to Banks of India’. ‘Reserve Bank of India Monthly Bulletin’, ‘Report on Currency and Finance’ and other publications of RBI and its website, various magazines dealing with the current banking scenario and research papers, etc. for arriving valid decisions of objectives.
Data Analysis and Results and Discussion
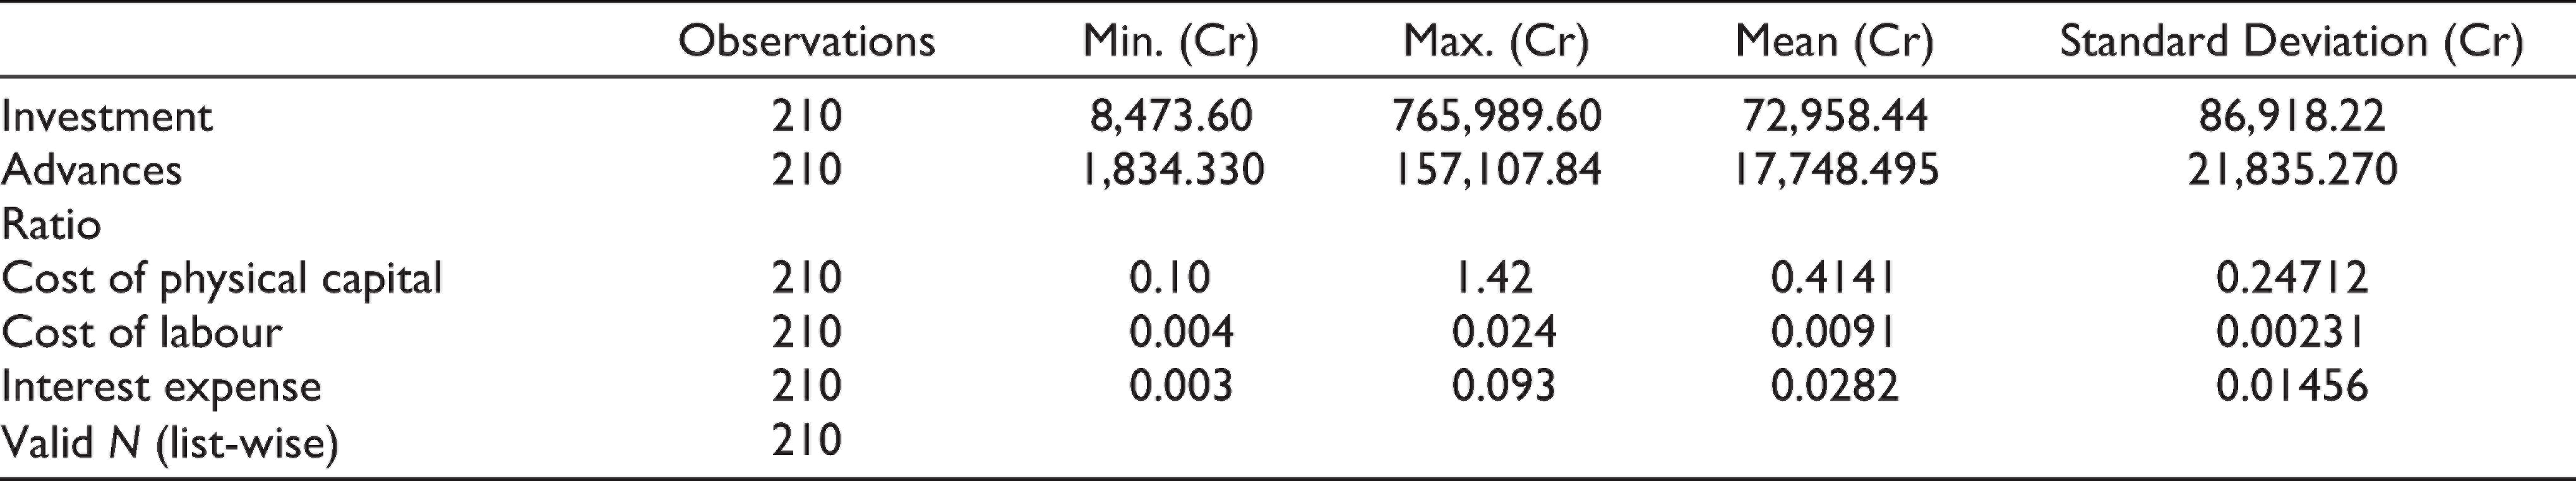
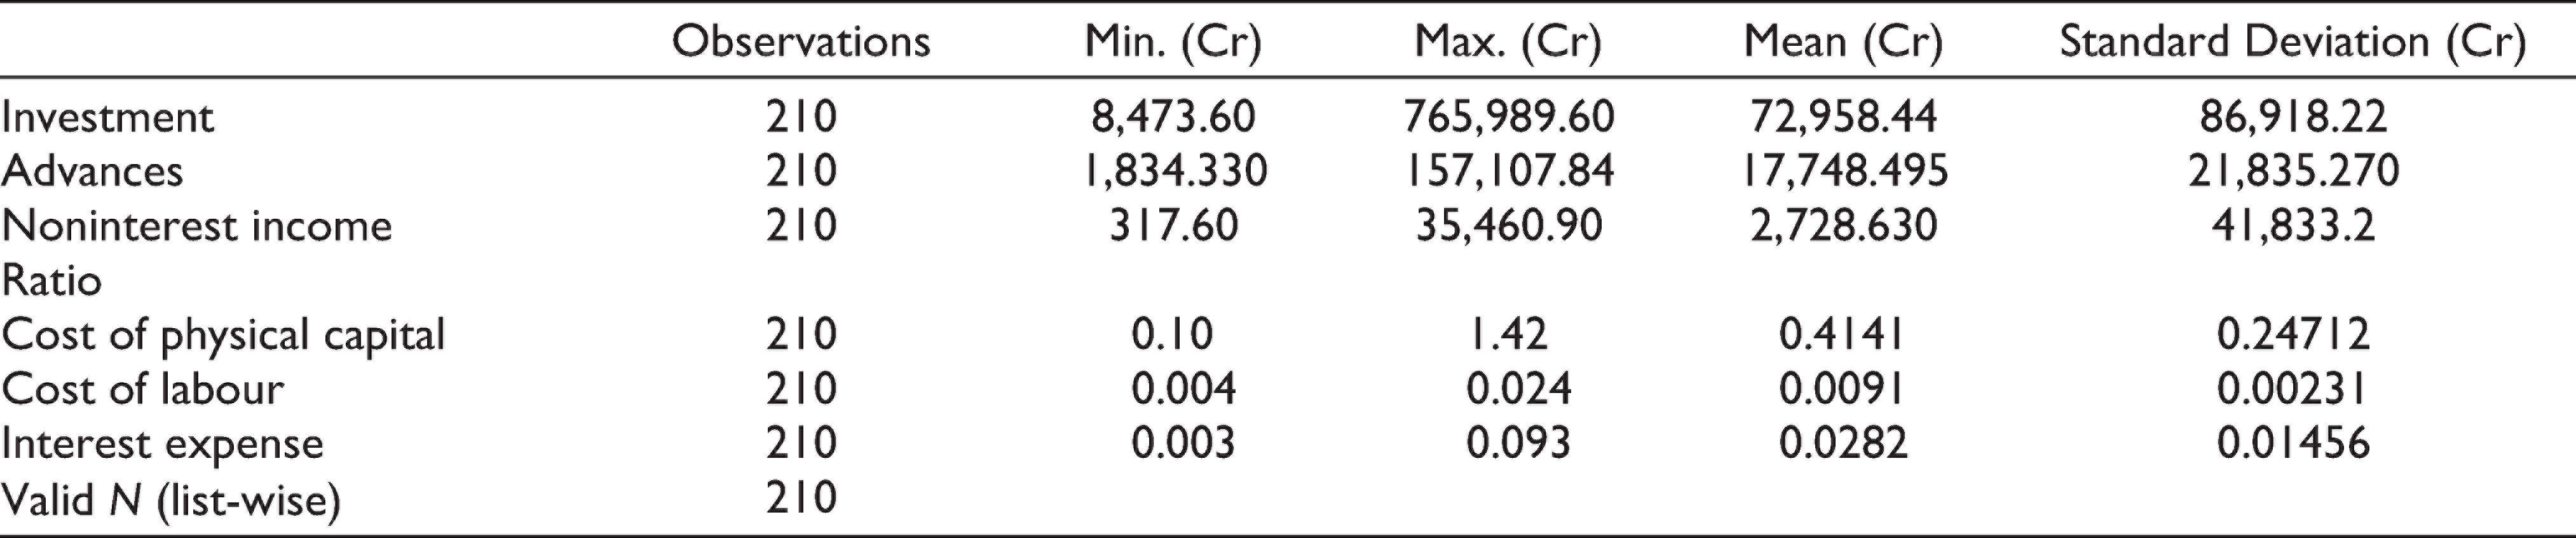
According to Table 4, all input as well as output variables comprised 210 observations for the period of 2008–2017 and the inputs and output are measured as proxies for major banking variables with exclusion of OBS income.
The cost of physical capital as an input ratio of total fixed assets indicates the selected nationalized banks had mean of this variable 0.41 with minimum 0.10 to maximum of 1.42. This shows that over the period of 10 years, there is a bank which cost of capital was higher than other banks with the value of 1.42 and in contrast, another bank which stayed at 0.10 to other banks. The standard deviation (SD) statistics for this proxy is 0.2471 which shows the fairly higher variation in cost of capital among sampled public banks.
The cost of labour as an input ratio of total assets shows the selected nationalized banks had mean of this variable 0.009 with minimum 0.004 to maximum of 0.024. This marks that over the period of 10 years, there is bank which cost of labour was higher than other banks with the value of 0.024 and in contrast, another bank which stayed at 0.004 to other banks. The SD statistics for this proxy is 0.00231 which shows the slightly higher variation in cost of labour among sampled PSBs.
The interest expense as an input ratio of total customer deposits signals the selected nationalized banks had mean of this variable 0.0282 with minimum 0.003 to maximum of 0.093. This indicates that over the period of 10 years, there is bank which interest expense was higher than other banks with the value of 0.093 and in contrast, another bank which stayed at 0.003 to other banks with SD of 0.0145.
The second part of this model deals in output measures as investments and advances for the selected banks. The descriptive statistics for investment had an average of 72,958.44 Cr with ranges between 8,473.60 and 765,989.60 Cr with SD of 86,918.22 Cr. This statistic points out that investment decisions had vivid imagination and highly vary in same public sector domain for the sampled period. Similarly, the descriptive statistics for advances had a mean of 17,748.48 Cr with ranges between 1,834.33 Cr and 157,107.84 Cr with SD of 21,835.270 Cr. This statistic indicates that decision regarding advances had been very crucial for all banks.
Model 2 also portrays the most important output variable ratio of noninterest income. The statistic about this proxy infers that it ranges from 317.6 Cr to 35,460.90 and mean 2,728.63 Cr with SD of 41,833.2 Cr as a significant output for all public banks. It shows that over period of the time how PSBs heavily relying on the noninterest part which majorly milked through OBSI of the selected banks.
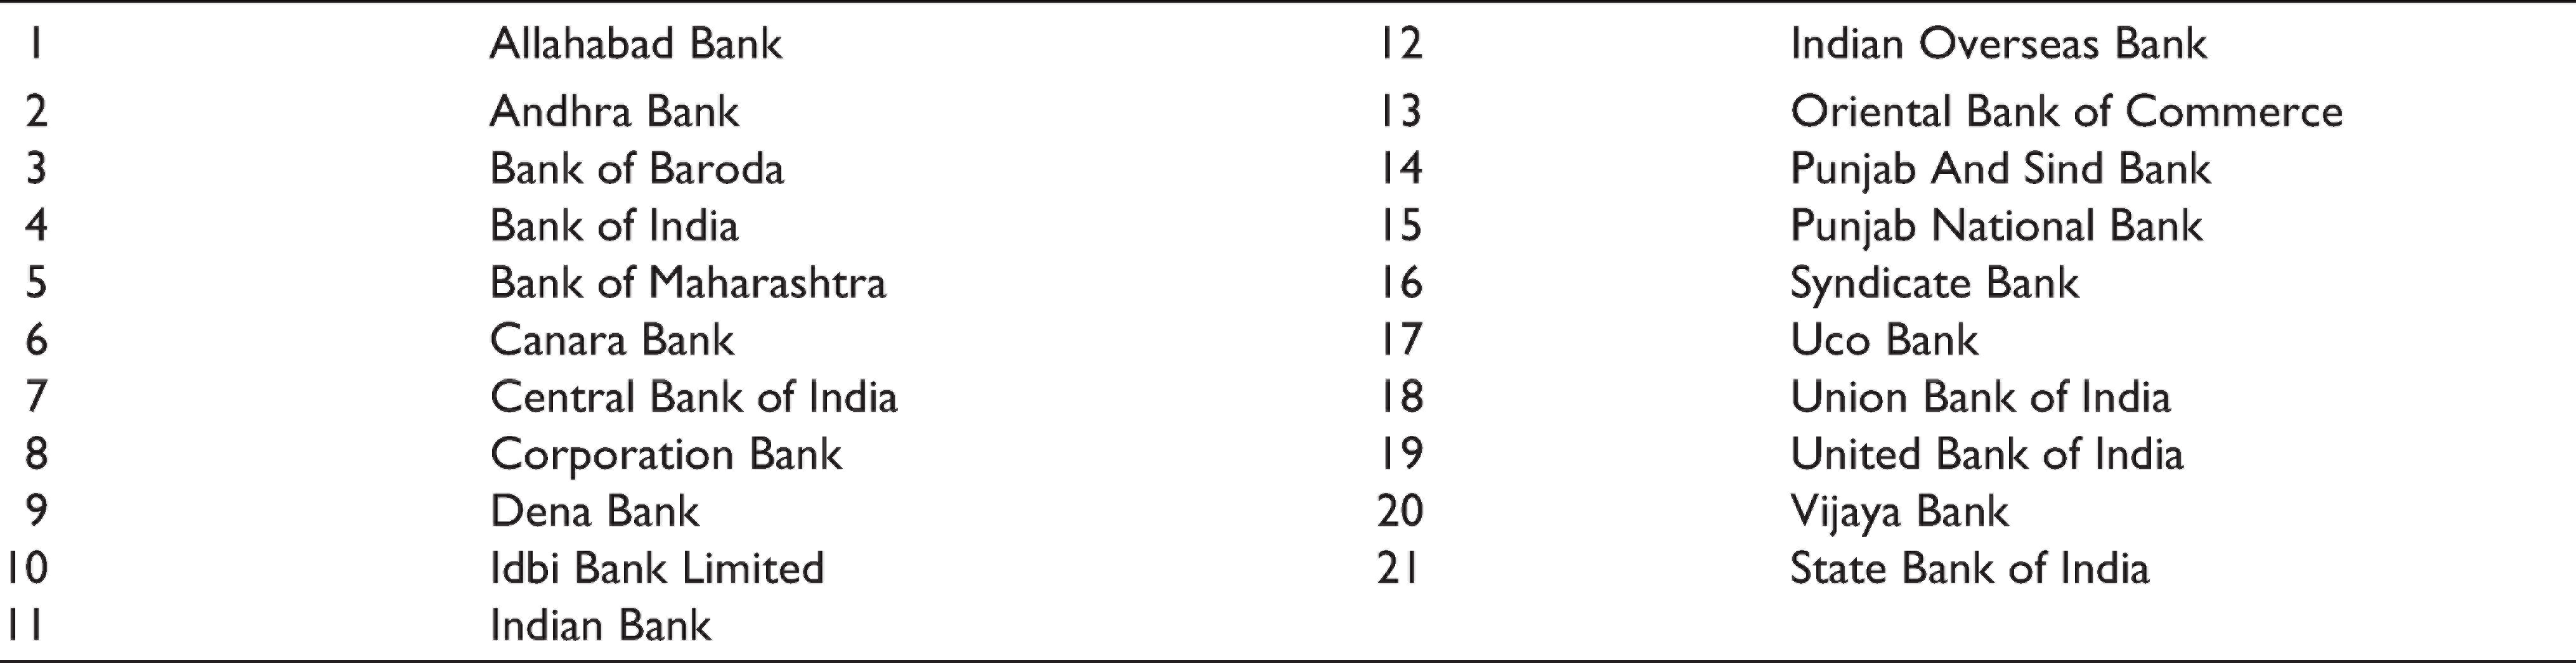
Selected PSBs in India
Model 1 (without OBS Income) Descriptive Statistics of Input–Output of PSBs
Model 2 (with OBS Income) Descriptive Statistics of Input–Output of PSBs
Malmquist Index Decomposition (Summary of Annual Means) Results of Selected PSBs
We examined the effect of OBSI on the TFP in two ways. The relationship of TFP estimates held with OBSI and without OBSI at the bank level. So we verified the differences between the average TFP estimates when the OBSI first excluded and then included.
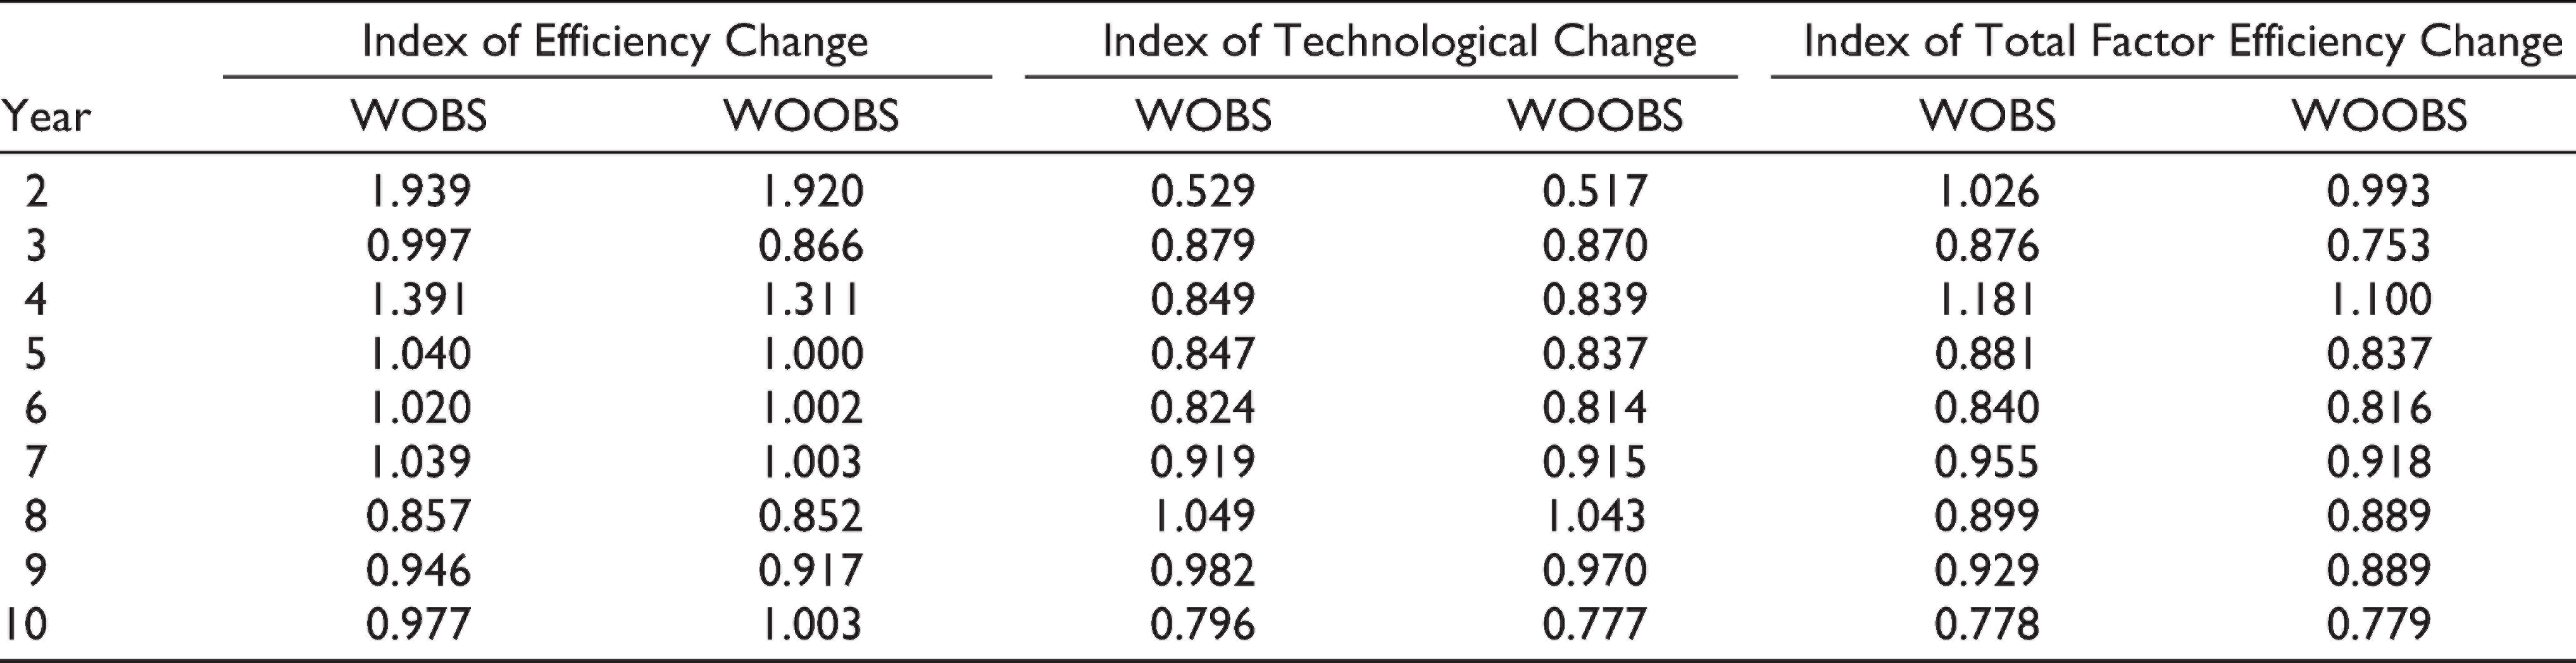
Table 6 represented the Malmquist TFP change index is calculated. The progressive TFP has been shown by an index value greater than one. Similarly, if the index value lower than one referred as a decrease in TFP. The TFP is the product of EC and TC.
=> (TFP) = (TC) × (EC).
The observations of Table 6 for the index of TFE change clarified that the production was 27.47 per cent for WOOBS while 31.85 per cent growth for WOBS for selected time. When the OBS elements are added to the bank production definition, a different image appeared. Even if we run a yearly analysis for this sample, we got the inclusion of OBSI-related revenue increased the total efficiency of these factors. The results of Table 6 justified our assumption that banks shifted their production arc were more likely to have a substantial portfolio of OBSI. Removing these items would deteriorate the bank efficiency.
t-Tests for the Differences between Malmquist TFP Measurements
The results of calculated difference further tested under t-test significance. We used the series of the test for all change indices with the null hypothesis concerned with equal mean efficiency while with OBSI and without OBSI as:
H0: the mean efficiency of Models A and B is equal.
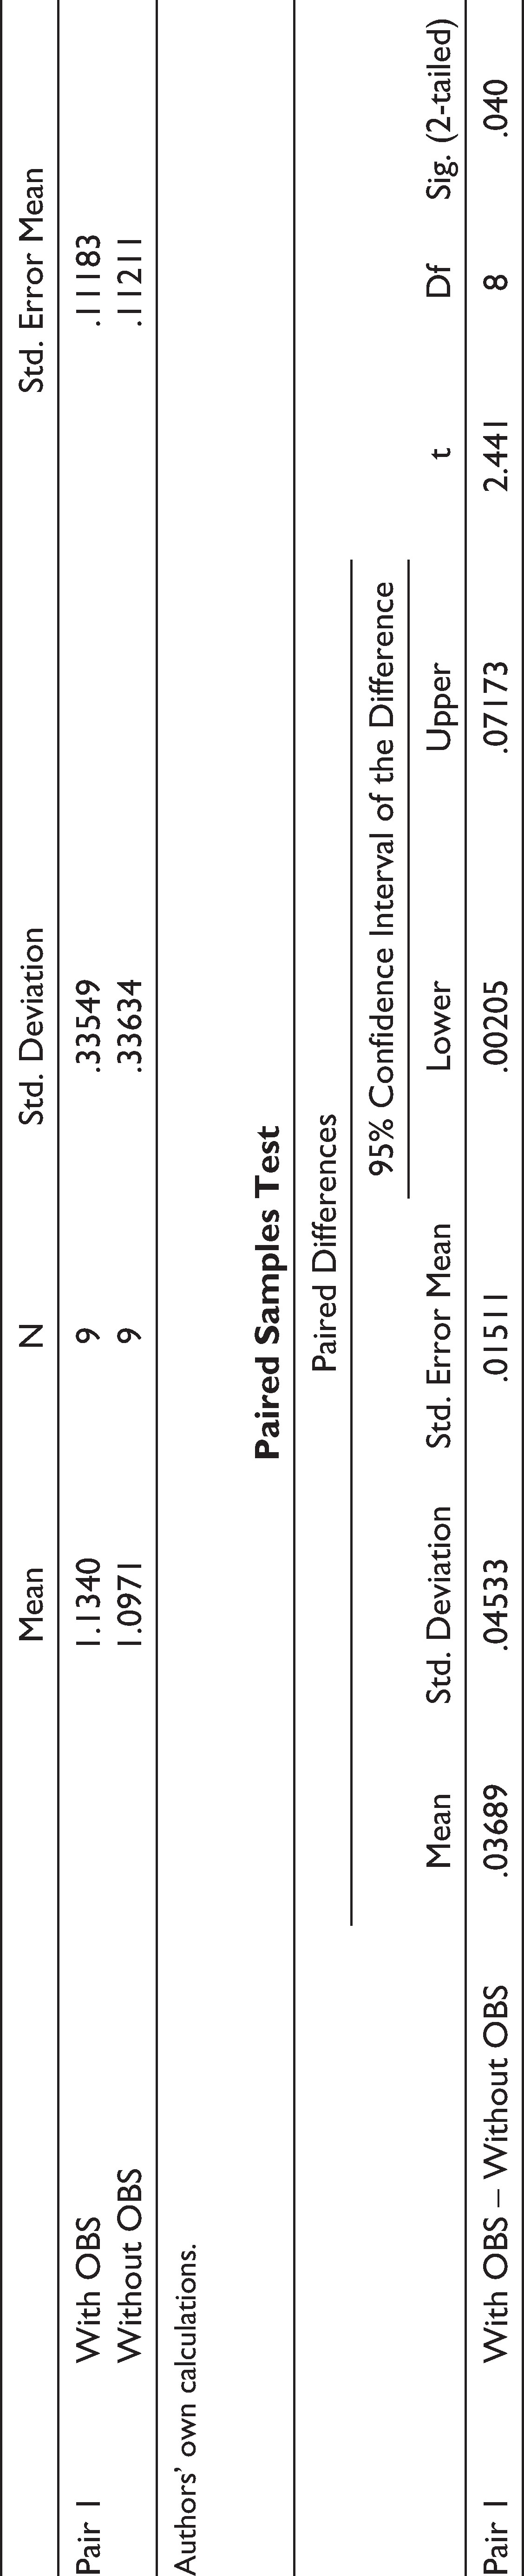
For Mean Efficiency Change
The results in Table 7 for EC clearly state that mean efficiency change with OBS is 1.134 and without OBS is 1.0971 which clearly remarks that inclusion OBSI has increased the efficiency of the banks for the given period.
Table 7 also concluded that the null hypothesis has been rejected as the p value is less than 0.05 at 95 per cent confidence interval. So the mean efficiency of Model A is not equal to the mean efficiency of Model B. It implied that the OBSI are playing a substantial part in banks’ efficiency.
For Mean Technological Change
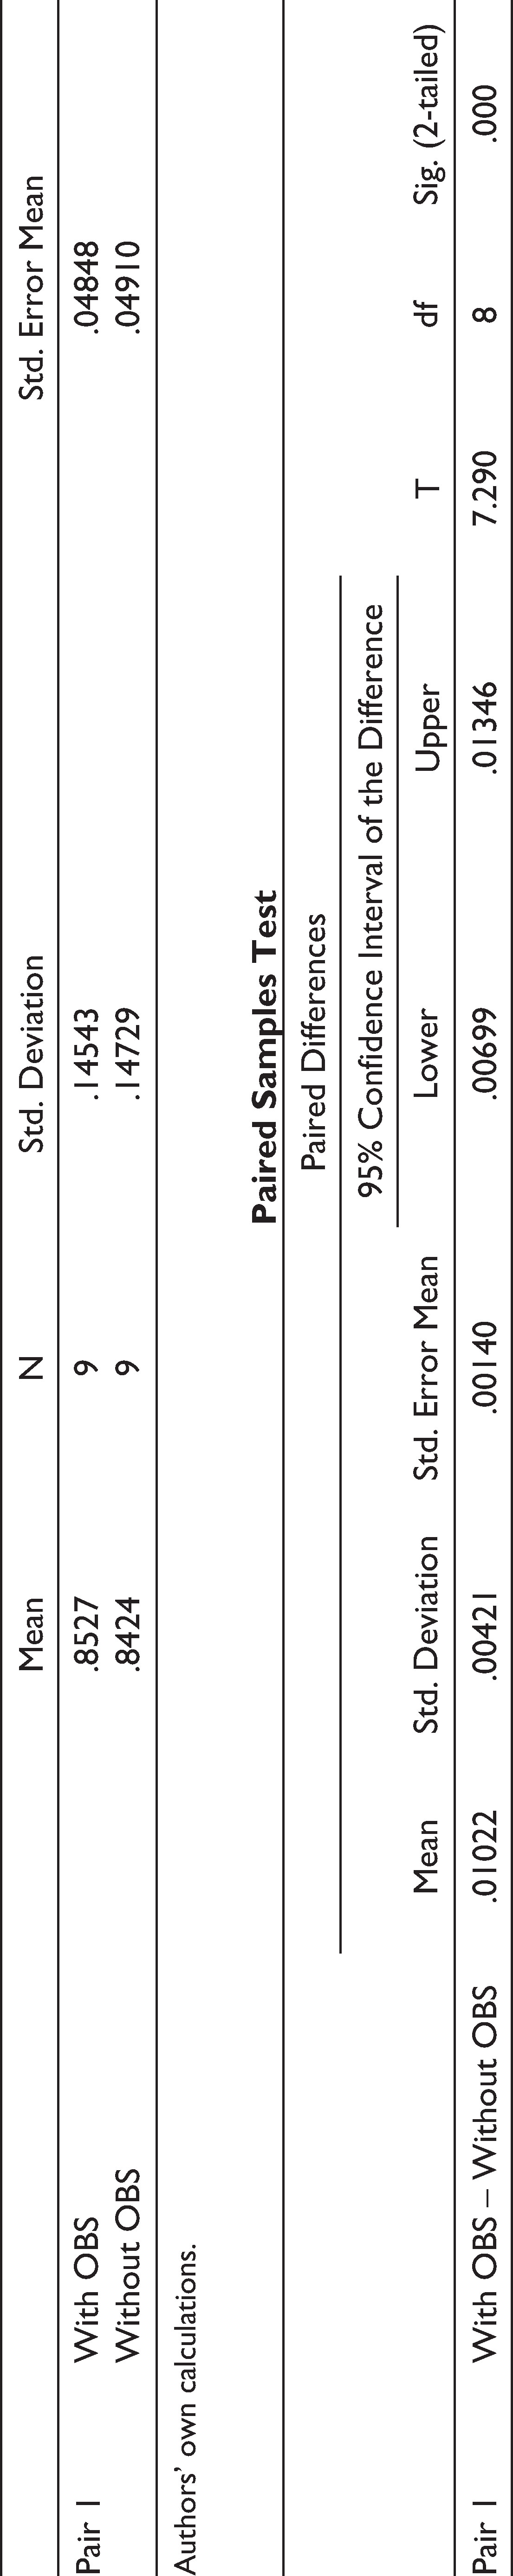
The results in Table 8 for TC state that mean TC without OBS is 0.8424 and with OBS is 0.8527 which clarifies that inclusion OBSI has increased the efficiency of the banks.
Table 8 concluded the null hypothesis rejected (as the p = 0, less than 0.05 at 95 per cent confidence level). So the mean efficiency for technology change of Model A is not equal to the mean efficiency for technology change of Model B. It infers the OBSI are playing an important part in the technology EC.
Malmquist Index Decomposition for PSBs
Paired Samples Statistics
Authors’ own calculations.
Paired Samples Statistics
Authors’ own calculations.
Paired Samples Statistics
Authors’ own calculations.
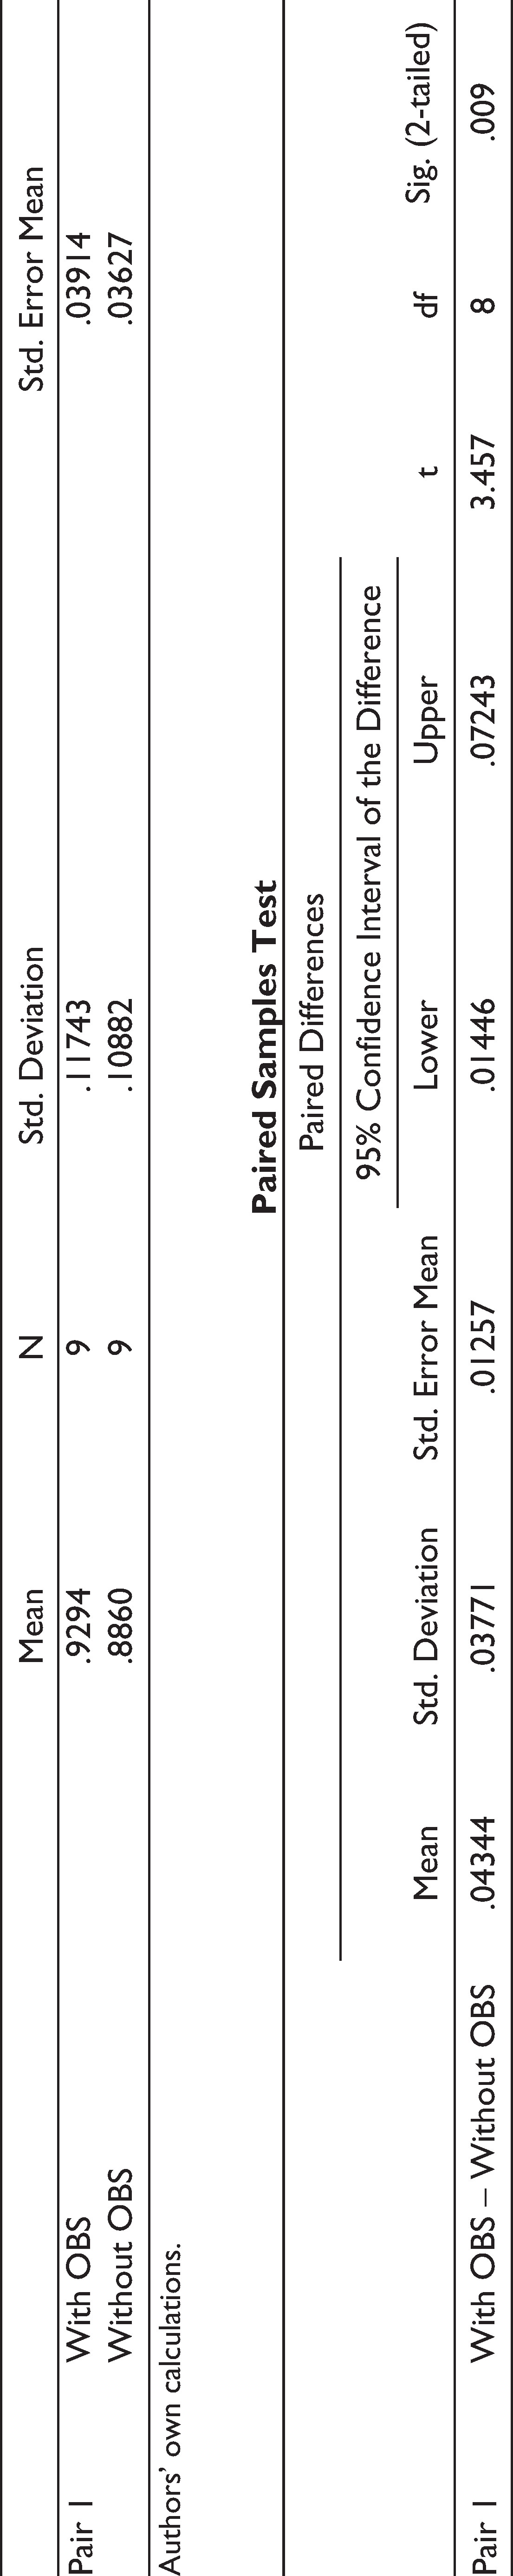
For Mean Total Factor Efficiency Change
Table 9 resulted for TFE change as mean efficiency change with OBS is 0.929 and without OBS is 0.886 which states inclusion OBSI has increased the efficiency of the banks.
Paired sample test in Table 9 inferred rejection of the null hypothesis (the p value is less than 0.05 at 95 per cent confidence level). So the mean efficiency for TFP change of Model A is not equal to the mean efficiency for TFP change of Model B. It implied that the OBSI are playing a substantial part in banks’ efficiency.
Findings
After studying the background and literature with analysis of data, we found that the OBS activities are noninterest-based income activities for selected private banks in India determine of Guarantees Given on Behalf of Constituents Acceptances, Forward Exchange Contracts, Endorsements and Other Obligation.
The contributions of this study, unlike previous studies in India, included income from OBSI in estimating the efficiency index. In line with the research done by Huang and Chen (2006), Kumar (2011), Chortareas et al. (2009), Alhassan and Tetteh (2017), Sufian (2009), Pasiouras (2008), Sufian (2005), Casu (2005) and Wheelock and Wilson (1999), we also examined the effect of noninterest income on efficiency using DEA-Malmquist model. To our best understanding, this research provides the foremost submission of the DEA-Malmquist method to selected bank data in India. Through the DEA, we estimated the efficiency scores for 10 years and analysed the effect of OBSI on the efficiency activities of these banking companies. Specifically, we examine how the exclusion of this income affects the efficiency of the sampled banks. This is important to classify the significance of these activities, which produced contribution to the efficiency of these banks. The results suggested in spite of the irregular dissemination of OBSI among these banks or the different institutions of the same industry, the OBS activities are becoming increasingly important and the lack of accountability would generate a biased inference.
Conclusion
For last two decades, there had been an increase in OBSI in the form of paid services (fees from derivative trading activities, foreign exchange transaction incomes, guarantees, acceptances) in all countries. In emerging countries, OBSI grew by post-impact of liberalization and deregulation of the financial services industry. The opening of the economy in the 1990s and reforms in Indian financial sector boosted the OBS activities in banking as well these banks become more combative to open competition. This has led banks to focus increasingly on activities that do not create interest.
In this study, we examined the effect of using OBSI income as a production variable on the efficiency of the bank. In recent years, intensifying competition, emerging deregulation laws, innovations in financial markets, the reduction in deposit margins and the purchase of funds for their subsequent intermediation in assets and liabilities, and the swift evolution and dissemination of new technologies have prompted Indian banks to move in off-balance sheet arena. The banks’ responses to the changing nature of the functioning atmosphere led to changes in the configuration of financial strategies which ultimately imitated in the surge of OBS activities. This study attempted to explore at what extent the inclusion of the OBS elements influences the rates of change in total efficiency of banks. The enclosure of OBS elements seems to have a greater impact on TC efficiency. This result imitated shifting the productivity focusing the OBS activities as a substantial part of bank portfolio. They would have been penalized more if this variable had not been included in the efficiency analysis. Despite the odd circulation of OBSI among the banking groups studied and between the various banking institutions in India, omitting OBSI in defining banking production, underestimates the efficiency levels and it can lead to distorted conclusions.
Footnotes
Declaration of Conflicting Interests
The authors declared no potential conflicts of interest with respect to the research, authorship and/or publication of this article.
Funding
The authors received no financial support for the research, authorship and/or publication of this article.