
Abstract
The Integrated Poverty Index (IPI) is a summary measure of poverty/deprivation that includes “poor” across economic, education and health/nutrition-related dimensions. Estimates across three decades since 1991 show a slow reduction in IPI, notably in mainly small states with middle per capita income. The growth–poverty linkage seems to be dwindling away. States with higher per capita income have not been able to reduce their IPI values in recent times, raising concerns of “IPI-trap”. Further, low-income states have been at the same level of IPI and PCNSDP for the past two decades raising concerns of both growth-led and development-led initiatives. The paper concludes that since there is a strong “income and population effect” to IPI reduction, there is a need to build synergies to secure sustainable capabilities expansion.
Introduction
The advent of the human development approach in 1990 reiterated that apart from being a “means” towards economic growth, human beings are the “ends” for whom economic growth is pursued. The focus on the “beings and doings” of people has also led to a resurgence in research on economic growth and its linkage with human development, both in its subjective and objective variants. Most of the studies have been preoccupied with human development achievements, often measured using functionings rather than capability sets of individuals owing to difficulties in empirical estimation.
Capability is defined in the space of functionings wherein evaluations are based on “well-being freedom”. This, Amartya Sen argues, would represent the freedom to enjoy the various possible “well-beings” associated with the different functionings n-tuples in the capability set (Sen, 2003 [1993]). Amartya Sen views “poverty as the deprivation of basic capabilities rather than merely as lowness of incomes” (Sen, 2000, p. 87), where basic capabilities are “the ability to satisfy certain crucially important functionings up to certain minimally adequate levels” (Sen, 1993). The deprivation of basic capabilities can vary, as Sen has argued, “from such elementary physical ones as being well nourished, being adequately clothed and sheltered, avoiding preventable morbidity, and so forth, to more complex social achievements such as taking part in the life of the community, being able to appear in public without shame, and so on” (Sen, 1995, p. 15). He argues that there are several other dimensions of capability deprivation—and thus on real poverty other than lowness of income. He puts forth the following arguments (pp. 87–88):
Poverty can be sensibly identified in terms of capability deprivation; the approach concentrates on deprivations that are intrinsically important, unlike low income, which is only instrumentally significant. There are influences on capability deprivation—and thus on real poverty—other than lowness of incomes (incomes is not the only instrument in generating capabilities). The instrumental relation between low income and low capability is variable between different communities and even between different families and different individuals; the impact of income on capabilities is contingent and conditional.
There is no suggestion, as is sometimes claimed, that the capabilities concerned should be determined without reference to prevailing living standards; indeed, Sen has been clear that such standards will influence the selection of relevant capabilities (e.g., Sen, 1984, pp. 84–85).
Further, defining a basic capability set is a contentious issue and can only be arrived upon through a broader consultative process. There is presumed to be a consensus as to what is considered to be “adequate”; hence, it is subjective and is not amenable to being objectively defined by an external agency.
In a somewhat parallel track, there has also been substantial interest in understanding the dimensions of deprivation that make for ill-being (Sen, 1999) or ill-fare (Guhan, Harriss-White & Subramanian, 1999) which is perceived as the opposite of well-being and welfare, respectively. Ill-being or ill-fare can be understood in terms of negative freedoms—lack of freedom to basic necessities such as food, education and lack of freedoms to economic and social rights such as decent employment and access to information.
In consonance with the effort to move beyond the income dimension in measuring well-being achievement, ill-being or deprivation has also moved beyond measuring income deprivation to encompass deprivation in education, health and other related dimensions. Notable among the efforts to measure dimensions of deprivation are two indices introduced by UNDP: the Human Poverty Index in 1997 and the Multidimensional Poverty Index in 2010. In addition, the Inequality-adjusted Human Development Index (IHDI) focused attention on the influence of inequality in income, education and health dimensions of human development attainments (Chakarborty & Majumdar, 2005; Radhakrishna et al., 2010).
The Human Poverty Index included deprivations in three dimensions—survival, education and in knowledge and economic provisioning, conspicuously omitting to include income poverty in its dimensions. One of the objectives of this approach was to compare income poverty levels with human poverty and to demonstrate the weak relationship between income and human poverty. The same level of income poverty was seen to be associated with widely varying levels of human poverty. Elaborating further on income poverty and capability deprivation represented by the concept of human poverty, Kakwani (2006) explains that while poverty is concerned with the inadequacy of “command over resources” needed to generate socially determined basic capabilities, capability deprivation is more general and may be caused by numerous factors. Poverty may then be conceived as a subset of capability deprivations. However, Krishnaji (1997) critiques the use of HPI on three grounds: the variables chosen do not possess uniform dimensions. Two indicators, access to safe water and access to health services, refer to the whole population, whereas two other, indicators, namely, adult literacy rate and malnutrition below 5 years age, refer only to a particular section of the population. Secondly, the quality and sources of data used to compute the index are not reliable. Thirdly, many essential dimensions such as deprivation of gainful employment, basic human rights including equality before law and justice are not included in the index. The dimension of economic deprivation does not encompass the income variable (proxy) and also the indicators are not a true representation of the dimension.
Subsequent efforts revised the HPI and provided estimates for Indian states. Based on the studies on human poverty, Prabhu and Kamdar (2002) construct a modified poverty index for 15 major states using illiteracy (deprivation in knowledge), probability not surviving up to age 40 (deprivation in health) and children under age 4 who are undernourished. Indicators representing structural factors, political commitment and per capita income were used to measure the influence on human poverty levels using data for early 1990s. The analysis indicated that the role of per capita income in reducing human poverty is rather limited given unequal structural relations. In a similar vein, Sivakumar and Sarvalingam (2010) constructed a Human Deprivation Index using poverty line, infant mortality rate and illiteracy rate as deprivation indicators for 15 major states in India across three time points—1981, 1991 and 2001. They also studied the relationship between human deprivation and the three indicators using a multiple linear regression model. Their results stated that for Andhra Pradesh, Madhya Pradesh and Kerala, influence of income poverty was dominant whereas in Maharashtra, Orissa, Punjab and Tamil Nadu, illiteracy played a predominant role in determining Human Deprivation Index. Another study by Ray and Mishra (2012) evaluates multidimensional poverty of India and China in 1993 and 2006 in two stages. First, it measures deprivation across 11 dimensions 1 by regions and then it aggregates deprivation in the country as a whole. The study reveals that during the study period, both the countries witnessed rise in standard of living as well as a rise in human deprivation levels. Rural deprivation in India is substantially higher than in China and China has better performance in child and maternal health. However, not all dimensions are deprivation indicators and their use in a deprivation index is contestable.
UNDP presented a Multidimensional Poverty Index (MPI) in its annual report in 2010. As per this measure, the household’s living standard survey computes expenditure on numerous consumption goods (sometimes ever more than 1000), but Alkire and Santos have selected only six factors. The 10 indicators across the three dimensions of income, education and health that are used to compile the MPI are drawn from household data of the Family Health Surveys, but Ravallion (2011) raised a concern that in an effort to capture deprivation across all dimensions of poverty, an MPI overlooks the obstacle of data availability and the need that all the dimensions must come from the same sampled households. Further, the list of material goods to measure standard of living is extremely narrow (only 6) excluding a wide range of other requisite commodities. There have been several attempts to estimate multidimensional poverty for the Indian context. Drèze and Khera (2012) measure Achievement of Babies and Children Index and also Child Development Index for Indian states. However, the indicators selected to measure each of these measures are not consistent. They do not represent any single aspect of dimension or a single type of population. It attempts to aggregate development, deprivation as well as gender dimension of development in one single index. For instance, one of the dimensions of the CDI is poverty which is estimated using proportion of population below poverty line, proportion of population in India’s lowest wealth quintile and median per capita income. These indicators, when aggregated, do not truly represent the actual proportions of the poor in India. One could also object to the poverty dimension being used to measure development.
Given the complexity of measurement of poverty, this article presents an Integrated Poverty Index, integrated over the income and capability dimensions for Indian states. It provides scores and rankings across Indian states on the IPI but does not attempt to provide a headcount ratio, on account of the population groups that are included for different indicators belonging to different segments. The IPI was constructed for three time points in 1990s, 2000s and 2010s spanning two decades for 24 states in India.
Social sector data sets in India are fragmented and often have incompatible data sets. In case of education, data are more frequently updated and they are more readily monitorable, whereas for health, the data sets are extremely problematic. Official data sets have been able to capture health outcomes at irregular time intervals and whenever Sample Registration System (SRS) data are available, they are for specific states and districts and not available uniformly across all the states and districts for a single point in time. Thus, despite our effort to use officially generated data, we are constrained to use dated NFHS data 2005–2006 for child nutrition. Kurian (2016) argues that although India has been a pioneer in establishing health data systems, yet lack of information continues to be extremely problematic with definitional issues, duplication of indicators, making it difficult to track changes over time and space. To minimize such lacunae, there have been efforts to create large-scale surveys of multiple household data such as IHDS 2005 and 2012 which are trying to generate household level numerics but they do not really capture the kind of aggregation necessary at the macro-level. Though it covers a large number of indicators across the huge data set, it does not capture mortality data that is much more complicated and confines itself to morbidity data which is more based on perceptions of individuals.
Linkages of Capability Deprivation and Economic Growth in India
The human development literature has been replete with references to the fact that high levels of income do not automatically lead to higher human development outcomes. The relationship between higher economic growth and its impact on levels of deprivation has been the subject of fewer studies.
Vollmer et al. (2014) examine the association between economic growth and early childhood undernutrition using evidence from 121 nationally representative demographic surveys conducted between 1990 and 2011 across 36 low-income and middle-income countries. The outcome variables used were stunting, underweight and wasting relating to children on 0–35 months age, whereas the independent variables were per capita gross domestic product, in constant prices adjusted for purchasing power parity. Sample size ranged between 469,000 and 485,000 households. The study did not find any association at the country level between average changes in the prevalence of child undernutrition outcomes and average growth of per capita GDP. There was a very small quantitative association between increase in per capita income and reduction in early childhood undernutrition. The study lends support to the argument that direct health investments are required in low- and middle-income countries to improve the nutritional status of children. Critiquing the results of Vollmer et al. (2014), Alderman Haddad, Healey and Smith (2014) highlight the fact that some of the results indicating a positive but weak impact of income growth on mortality have been downplayed; the use of per capita income at national level has weaknesses in terms of yielding only 129 observations and hence results need to be re-examined.
Headey (2013) using cross-country data across 198 observations (including India at the subnational level) examined the influence of non-nutrition factors that might influence nutrition outcomes. Evidence showed that 5.5 per cent rise in per capita GDP could reduce stunting prevalence by a full percentage point. While infrastructure has not been found to be directly important, higher asset ownership, improved access to health services, higher rates of female secondary education and lower fertility rates were found to predict improvements in nutrition.
In the Indian context, there have been several multivariate models that have explained economic growth and capability deprivation linkages using individual human development indicators. The relationship between income growth and deprivation is most often posed in terms of whether growth is pro-poor. Examining India’s growth performance since 1993–1994, Palanivel and Unal (2011) indicate that the poverty elasticity of growth declined in India over the period 1970s to 2000s. The low and declining elasticity of poverty coincided with high growth performance during 1990s and 2000s which in fact spurred the government of India to initiate specific programmes for enhancing human development outcomes. On a related but different note, Suryanarayana (2008) examines the inclusiveness of the India’s growth performance between the years 1992–1994 and 2004–2005. He reports that the association between median consumption and the inclusion coefficient across states is weak which implies that there is no cross-sectional evidence to believe that growth in India is inclusive. However, Dubey and Thorat (2012) have argued that the rates of poverty reduction during the period 2004–2005 to 2009–2010 are higher as compared to the earlier 1993 to 2004 period. A more recent study by Motiram and Naraparaju (2013) using the methodology by Duclos (2009) and Araar, Duclos, Audet and Paul (2009) statistical assess the growth of the poor in India by various standards and over a range of poverty lines. They define the growth process as being pro-poor for a group if all the poor quantiles of the group grow at least at the standard imposed (2004–2009). Applying this methodology to NSS consumption expenditure data 2004–2009, they do not find any evidence for pro-poor growth or any disadvantaged class groups except for scheduled tribes in rural areas. In fact when absolute rather than relative standards are used, they have found evidence for anti-poor growth in both rural and urban areas. They conclude that Indian growth in recent times has been biased in favour of middle and richer groups. Tracing the role of income growth and literacy on health using state-, district- and individual-level data in India, Rajan, Kennedy and King (2013) conclude that wealthier is indeed healthier in India though only to the extent that high average incomes reflect low poverty and high literacy. Alleviating poverty may be more effective than raising average income levels.
Integrated Poverty Index: Concept and Properties
We propose an index which is simpler and reflects the deprivation/unfreedoms caused due to process and outcome dimensions of income and human poverty, the logic for this framework being that poverty is a function of both stock and flow determinants. These terms have been used differently to explain poverty. For instance, Krishna (2013) has considered determinants of poverty as flow and poverty per se as stock. According to them, income changes more rapidly; hence, it is a flow variable and education and health are stock variables as the former reflect budget constraints and consumption choices, whereas the latter change gradually and hence have been considered as stock. But Narayan and Petesch (2007) argue that the while moving out of poverty can be due to greater investment in education, the presence of other enabling factors like land, livestock, human capital also contribute to the process. Here, we argue that even within income, education and health, there are factors that are flow dimensions as well as stock. We argue that even within each dimension, flow variables are connected with stock variables as well. Reduction in dropout rates (flow variable) can directly influence quantum of adult illiteracy rates. While infant mortality rate is a stock variable, reduction in malnourishment (a flow variable) would determine future health outcomes.
The Integrated Poverty Index (IPI) is a capability-based poverty measure that provides a multidimensional estimate of deprivations occurring through a range of material and non-material functionings. The purpose of a poverty estimate using the capabilities lens is the estimate which includes the impact of multiple dimensions: this, as Osmani (1978, p. 105) calls, is a bundle of commodities with differential threshold limits. He argues that since all the bundles can have different monetary values, choice of choosing a particular bundle becomes extremely crucial. He is critical of the min–max approach to poverty, as the least cost bundle need not necessarily conform to the prevailing consumption behaviour and dictates of palatability may also cause deviations from a balanced diet prescribed by rigid cost minimization.
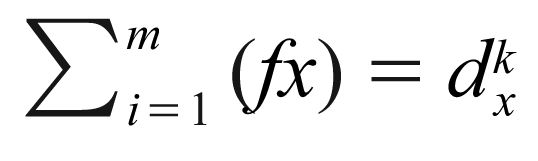
The capabilities framework broadens the basket to encompass both material and non-material dimensions. Tracing the route to the capabilities framework, IPI follows characteristics of unidimensional measure as well as the properties of a multidimensional index. The measurement of IPI is split into two parts: identification of poverty based on matrix functionings (fx) and aggregation of their poverty characteristics into an overall poverty measure. The most common route of identification of fx is the way argued by Amartya Sen specifying a set of “basic” or minimum capabilities, and regarding the inability to fulfil these needs as the test of poverty (Sen, 1981).
where
dx = dimension x representing various capabilities
Example: Dimensions (k x 3)
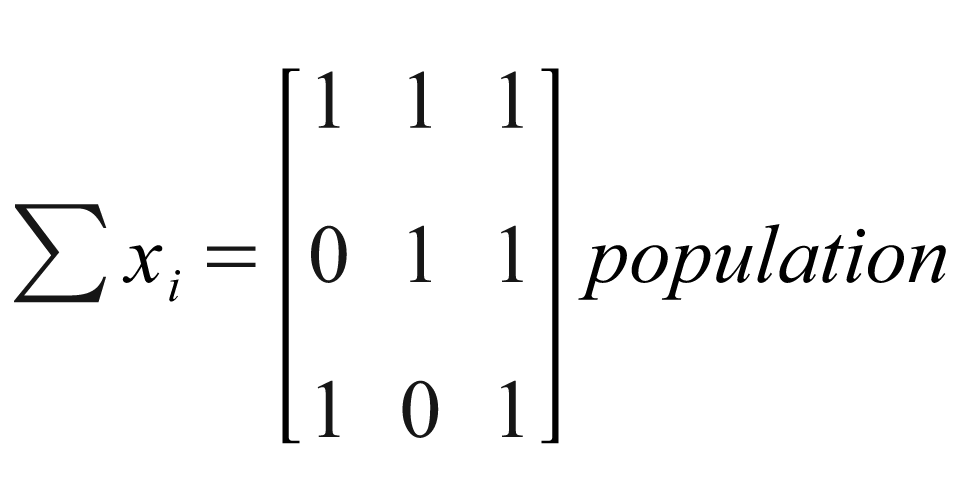
1 indicates poverty and 0 indicating achievement due to dimension x
kth = determining capability poor(m) population; k1 is the economic dimension of poverty, k2 is the education dimension of poverty, and k3 is the health and nutritional dimension of poverty.
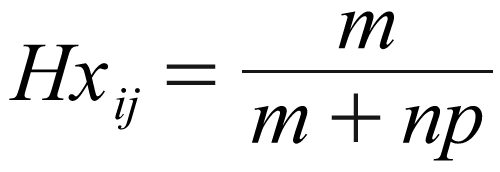
where m are poor and np are non – poor
and Hxy is the head count for dimension x and yth sub – indiccator;
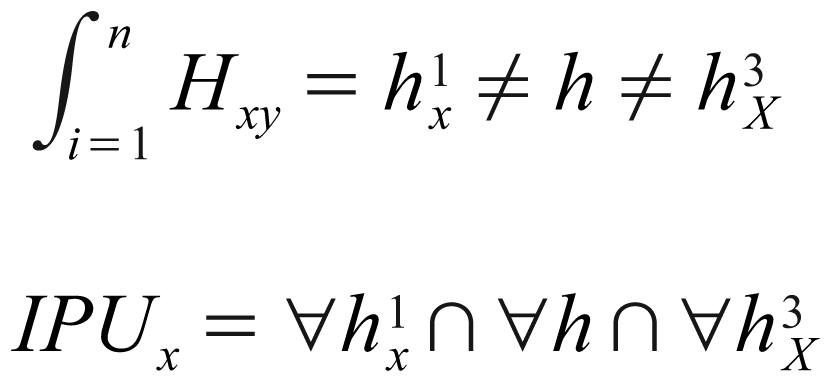
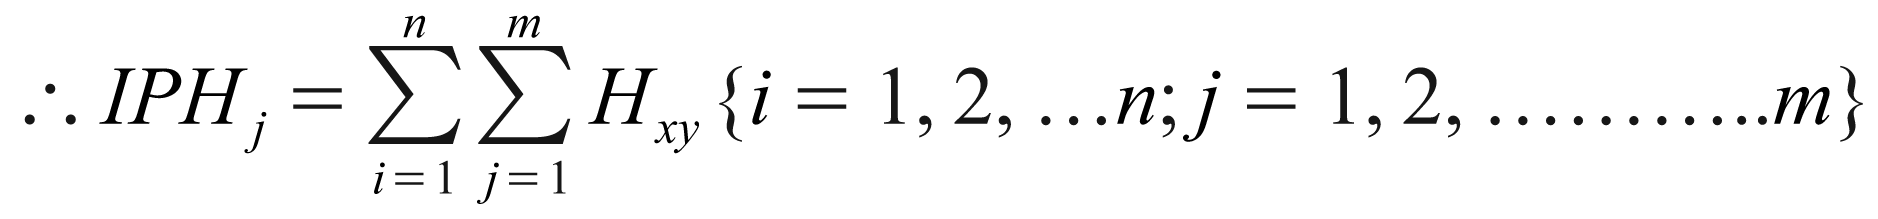
IPUx is intersection of dimension x across kth level which differ equal across x.
But,

where Ï is the sub-indicator of dimension x. The universal set of xth dimension is derived across distinct sets. Each cohort measures different functionings and therefore a distinct component of capabilities dimension; thus, IPI enables the estimation of a composite score rather than a head count based on indicator intersections through headcounts of distinct capabilities losses for all k = 1, 2, 3, …, n. IPI represents a composite estimate of the IPh (as measure of identification) and IPu IPI.
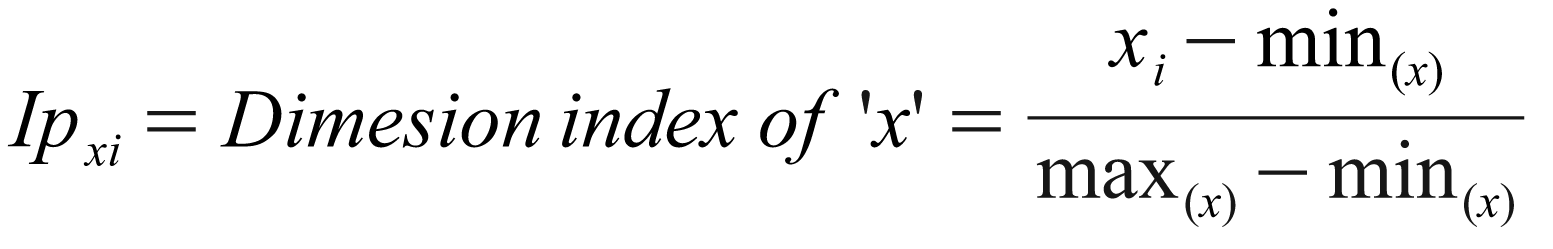
The first step is to create sub-indices for each dimension. Minimum and maximum values (goalposts) need to be set in order to transform the indicators into indices between 0 and 1.
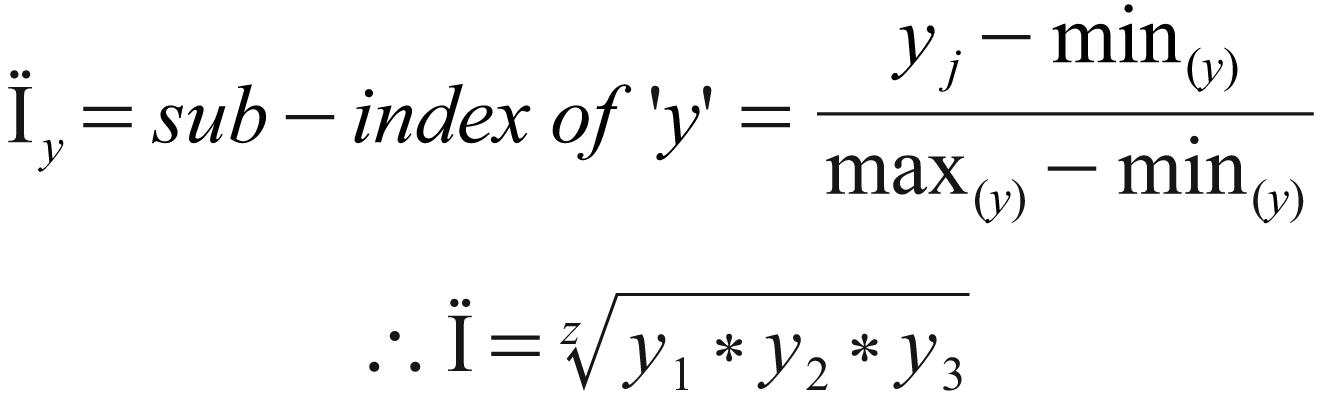
where z = 1/2/3 indicating sub-indicators of dimension x.
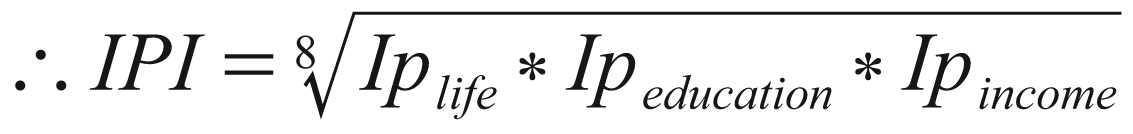
The Integrated Poverty Index (IPI) is a summary measure of poverty/deprivation measure that includes “poor” across economic, education and health/nutrition-related dimensions. Based on similar characteristics of the Human Development Index (HDI), the Integrated Poverty Index (IPI) is the geometric mean of normalized indices measuring deprivation in each dimension (Ul Haq, 2003). 2
IPI ranges between 0 and 1: values tending to 0 indicating no deprivation and 1 indicating highest deprivation across all dimensions.
An aggregate of these sub-indices is obtained as a geometric mean as follows:
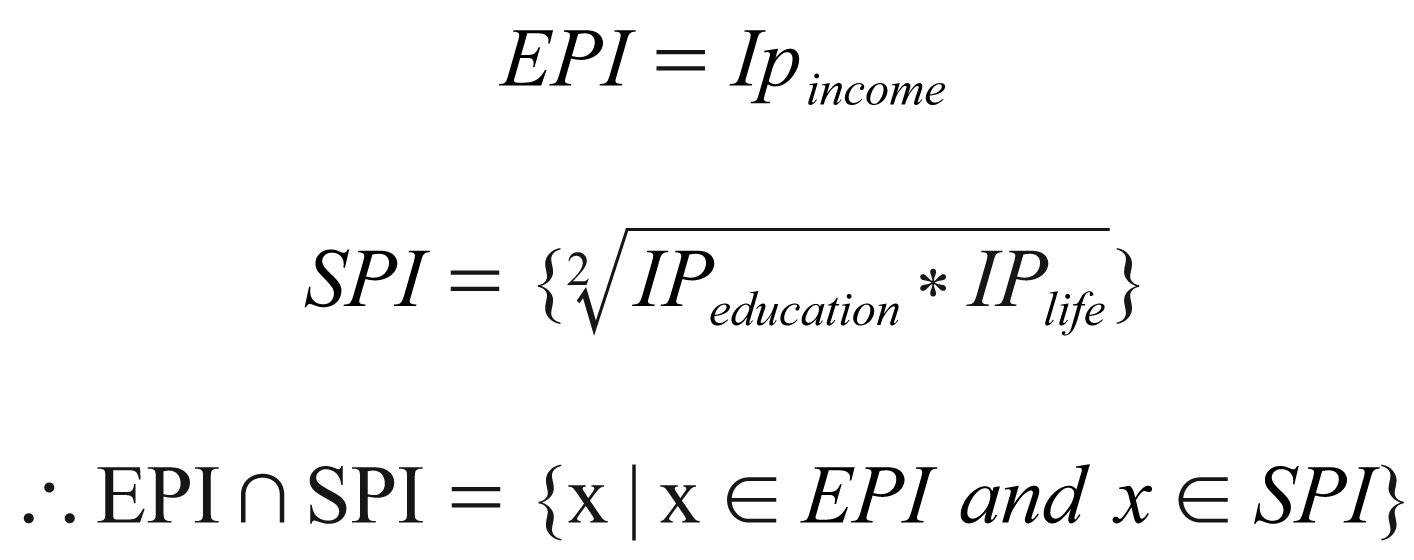
Estimation of absolute and relative deprivation is uniquely possible through a disaggregation of the sub-indices into Economic Poverty Index (EPI) and Social Poverty Index (SPI). Anand and Sen (2000) provide the rationale of including income as a capability dimension. The economic dimension of IPI adopts this rationale for EPI estimation.
Subcomponents are equally critical in determining IPI values as all dimensions carry equal weights. Interestingly, there is no linear relationship across each component making it possible to estimate the relative responsiveness of dimensions with one another and across control variables like per capita incomes, population growth rate and dominance of social groups. The necessary condition for reduction in IPI is fall in one of the subcomponents, whereas the sufficient condition is to ensure sustainable reduction which would be influenced by the quantum and quality of reduction of the other subcomponents.
Equation 6 embodies imperfect substitutability across all IPI dimensions. It thus addresses one of the most serious criticisms of the linear aggregation formula, which allowed for perfect substitution across dimensions. Some substitutability is inherent in the definition of any index that increases with the values of its components.
Data and Methodology
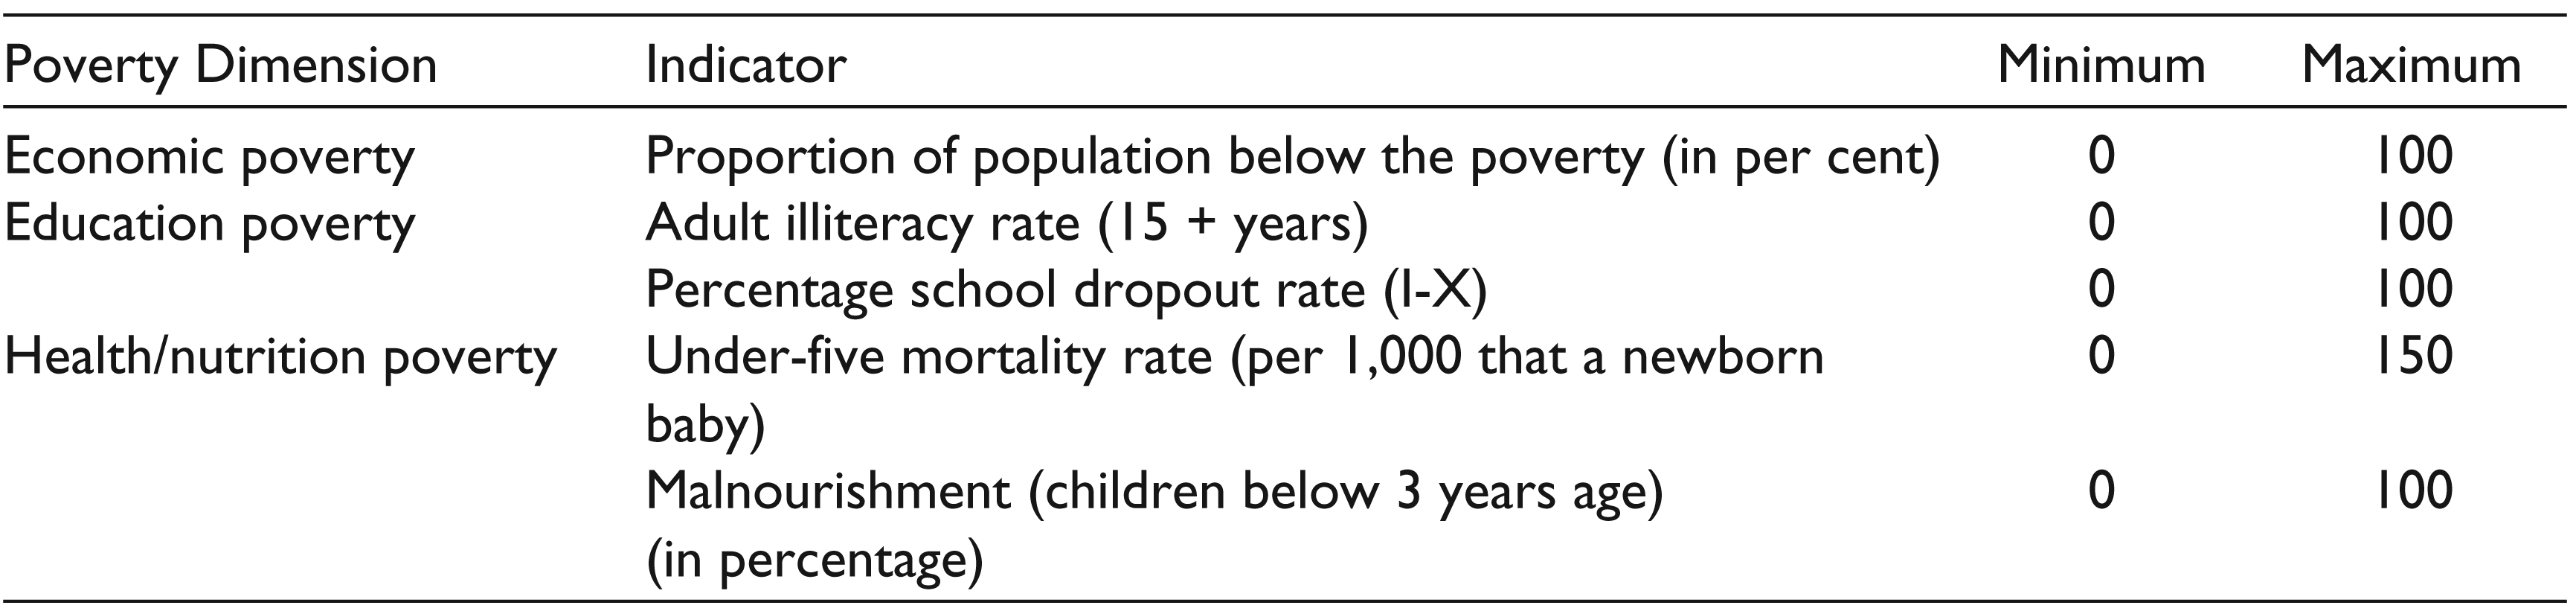
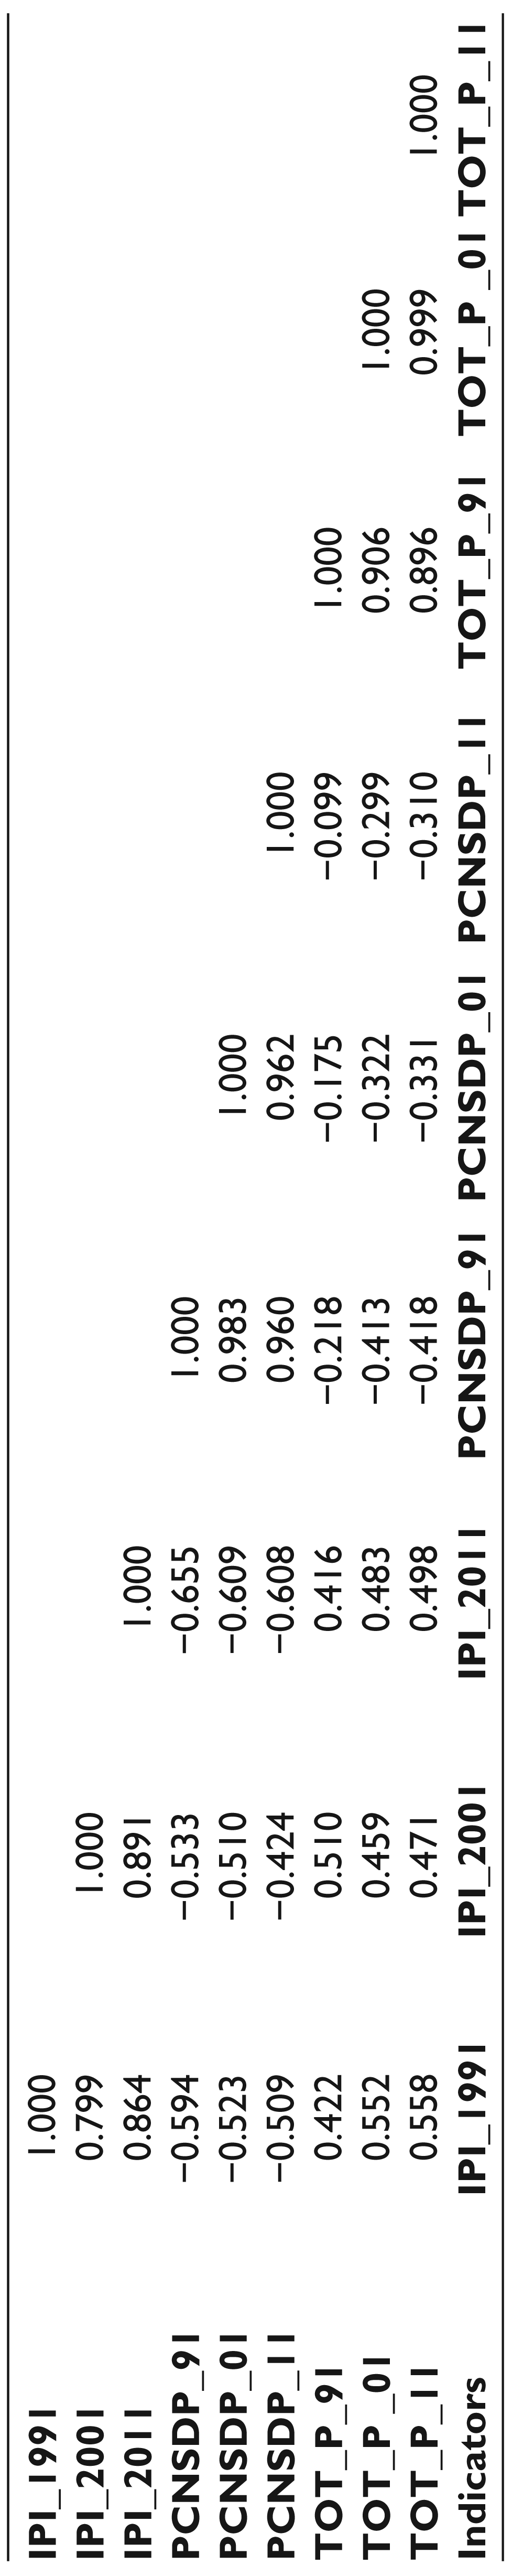
The list of indicators used for estimation is presented in Table 1. The choice of indicators is based on the indicators that capture capability deprivation and arrive at an integrated poverty measure.
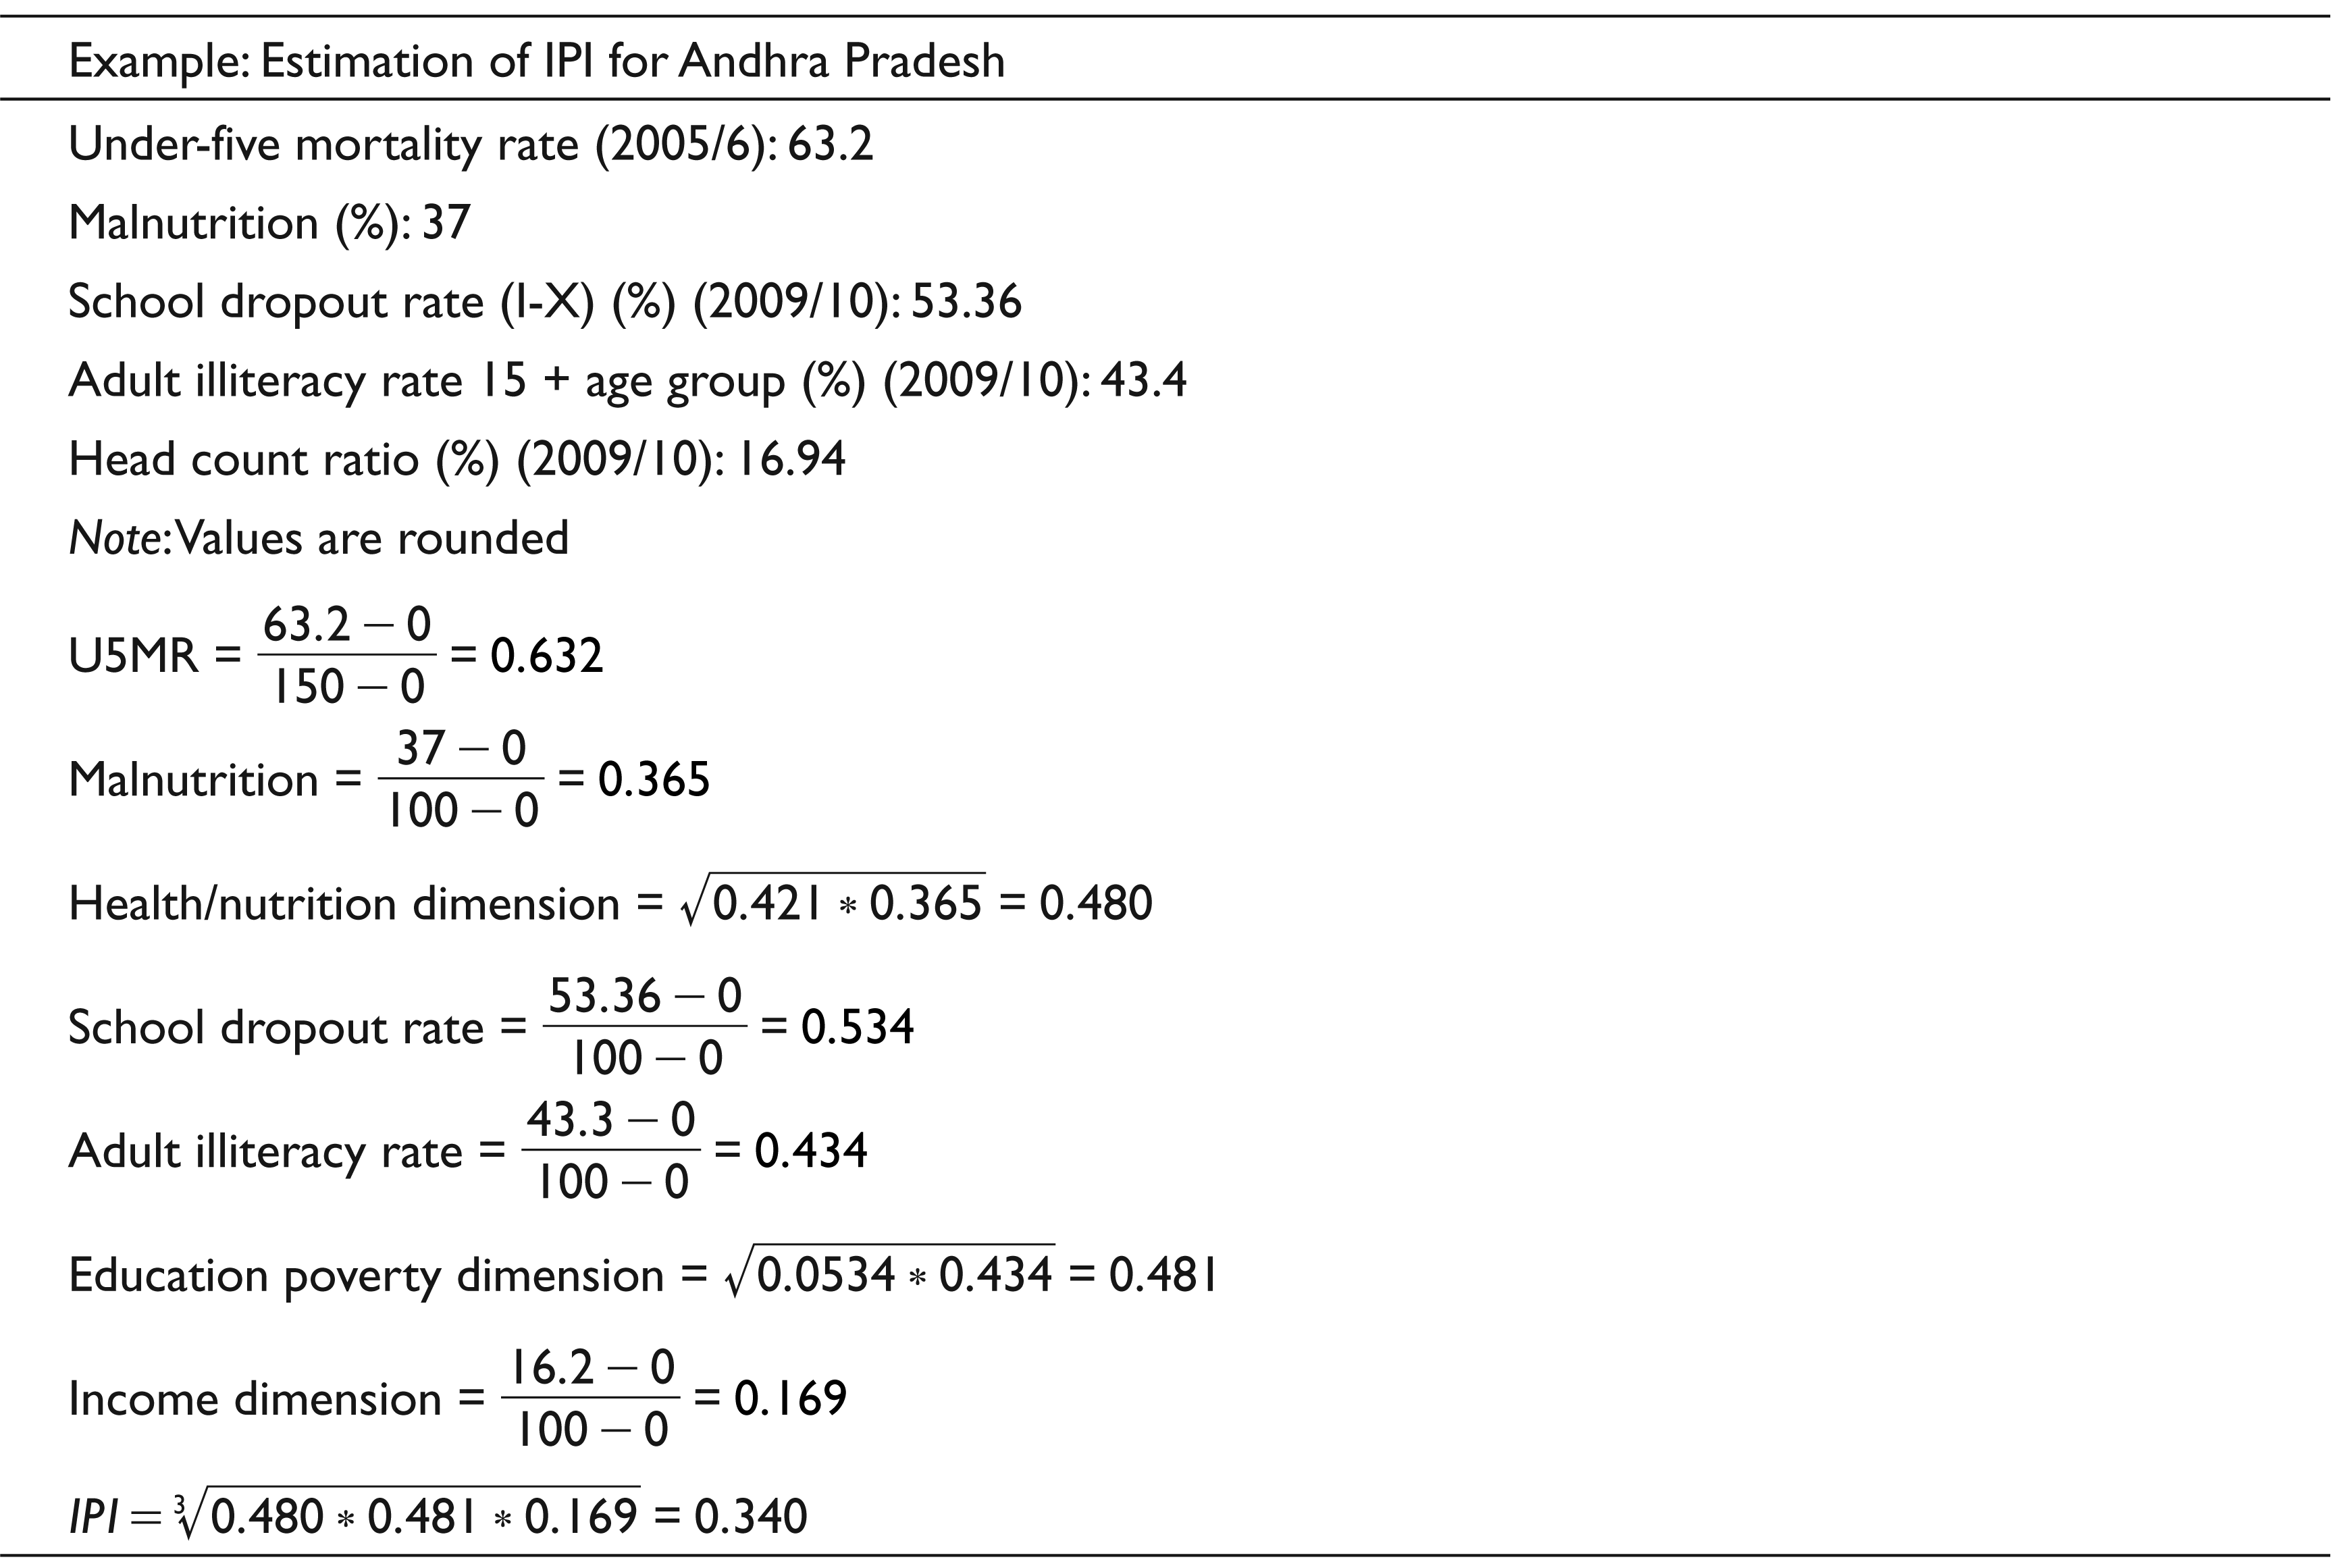
Since IPI is constructed across all poverty dimensions, the need to transform any parameter to inverse function is not relevant here. 2 The first step is to create sub-indices for each dimension. Minimum and maximum values (goalposts) need to be set in order to transform the indicators into indices between 0 and 1. As the geometric mean is used for aggregation, the maximum value will affect the relative comparison (in percentage terms) between any two states or periods of time. The maximum values are set to the actual observed maximum values of the indicators from the states in the time series, that is, 1991–2010. The minimum values will affect comparisons, so values that can be appropriately conceived of as subsistence values or “natural” zeros are used (Table 1). Progress is thus measured against minimum levels that a society needs to survive over time. The minimum values are set at 0 for all dimensions as the objective is to achieve a poverty-free society. Note that since indicators for economic, education poverty and malnourishment are in percentages, the goal posts are the same across time points. Since under-five mortality is defined in terms of rate per thousand live births, the goal post for this indicator has been determined based on the values of the worst performing state.
Indicators and sources of data used to estimate IPI are from official sources; which are comparable over different time points as they are generated on a regular basis and are not subject to vagaries of the database generated from sporadic surveys largely dependent on funding by international agencies. It has properties of unidimensional measures like the head count ratio and estimates available from Socio-Economic Caste Census (SECC) results. Given that the IPI deals with a capability set of several regions, IPI outcomes in one region are directly comparable with another region also because it is taking the mean deviation approach of the HDI. Further, SECC is only an indicative measure capturing only economic dimensions, namely, income, employment and asset with a bit of education and no health at all, whereas IPI weighs both economic and social factors equally in its composition. Lastly, the advantage of IPI over MPI is that it is does not have to depend on one sample set for estimation and hence can be monitored periodically using official data systems.
Goal Posts for Estimation of Integrated Poverty Index
Empirical Analysis
In this and following sections, we present the empirical results of our estimations for Indian states. Scatter plots of IPI with per capita NSDP at all three points and also for change in IPI scores with change in per capita NSDP were done. Loss due to inequality measured by the inequality-adjusted HDI and IPI scores also provided interesting insights. Finally, elasticity of IPI to changes in income was computed for two time periods: 1990–2000 and 2000–2010 to understand the responsiveness of integrated poverty to changes in per capita income.
Estimation of IPI for Indian States
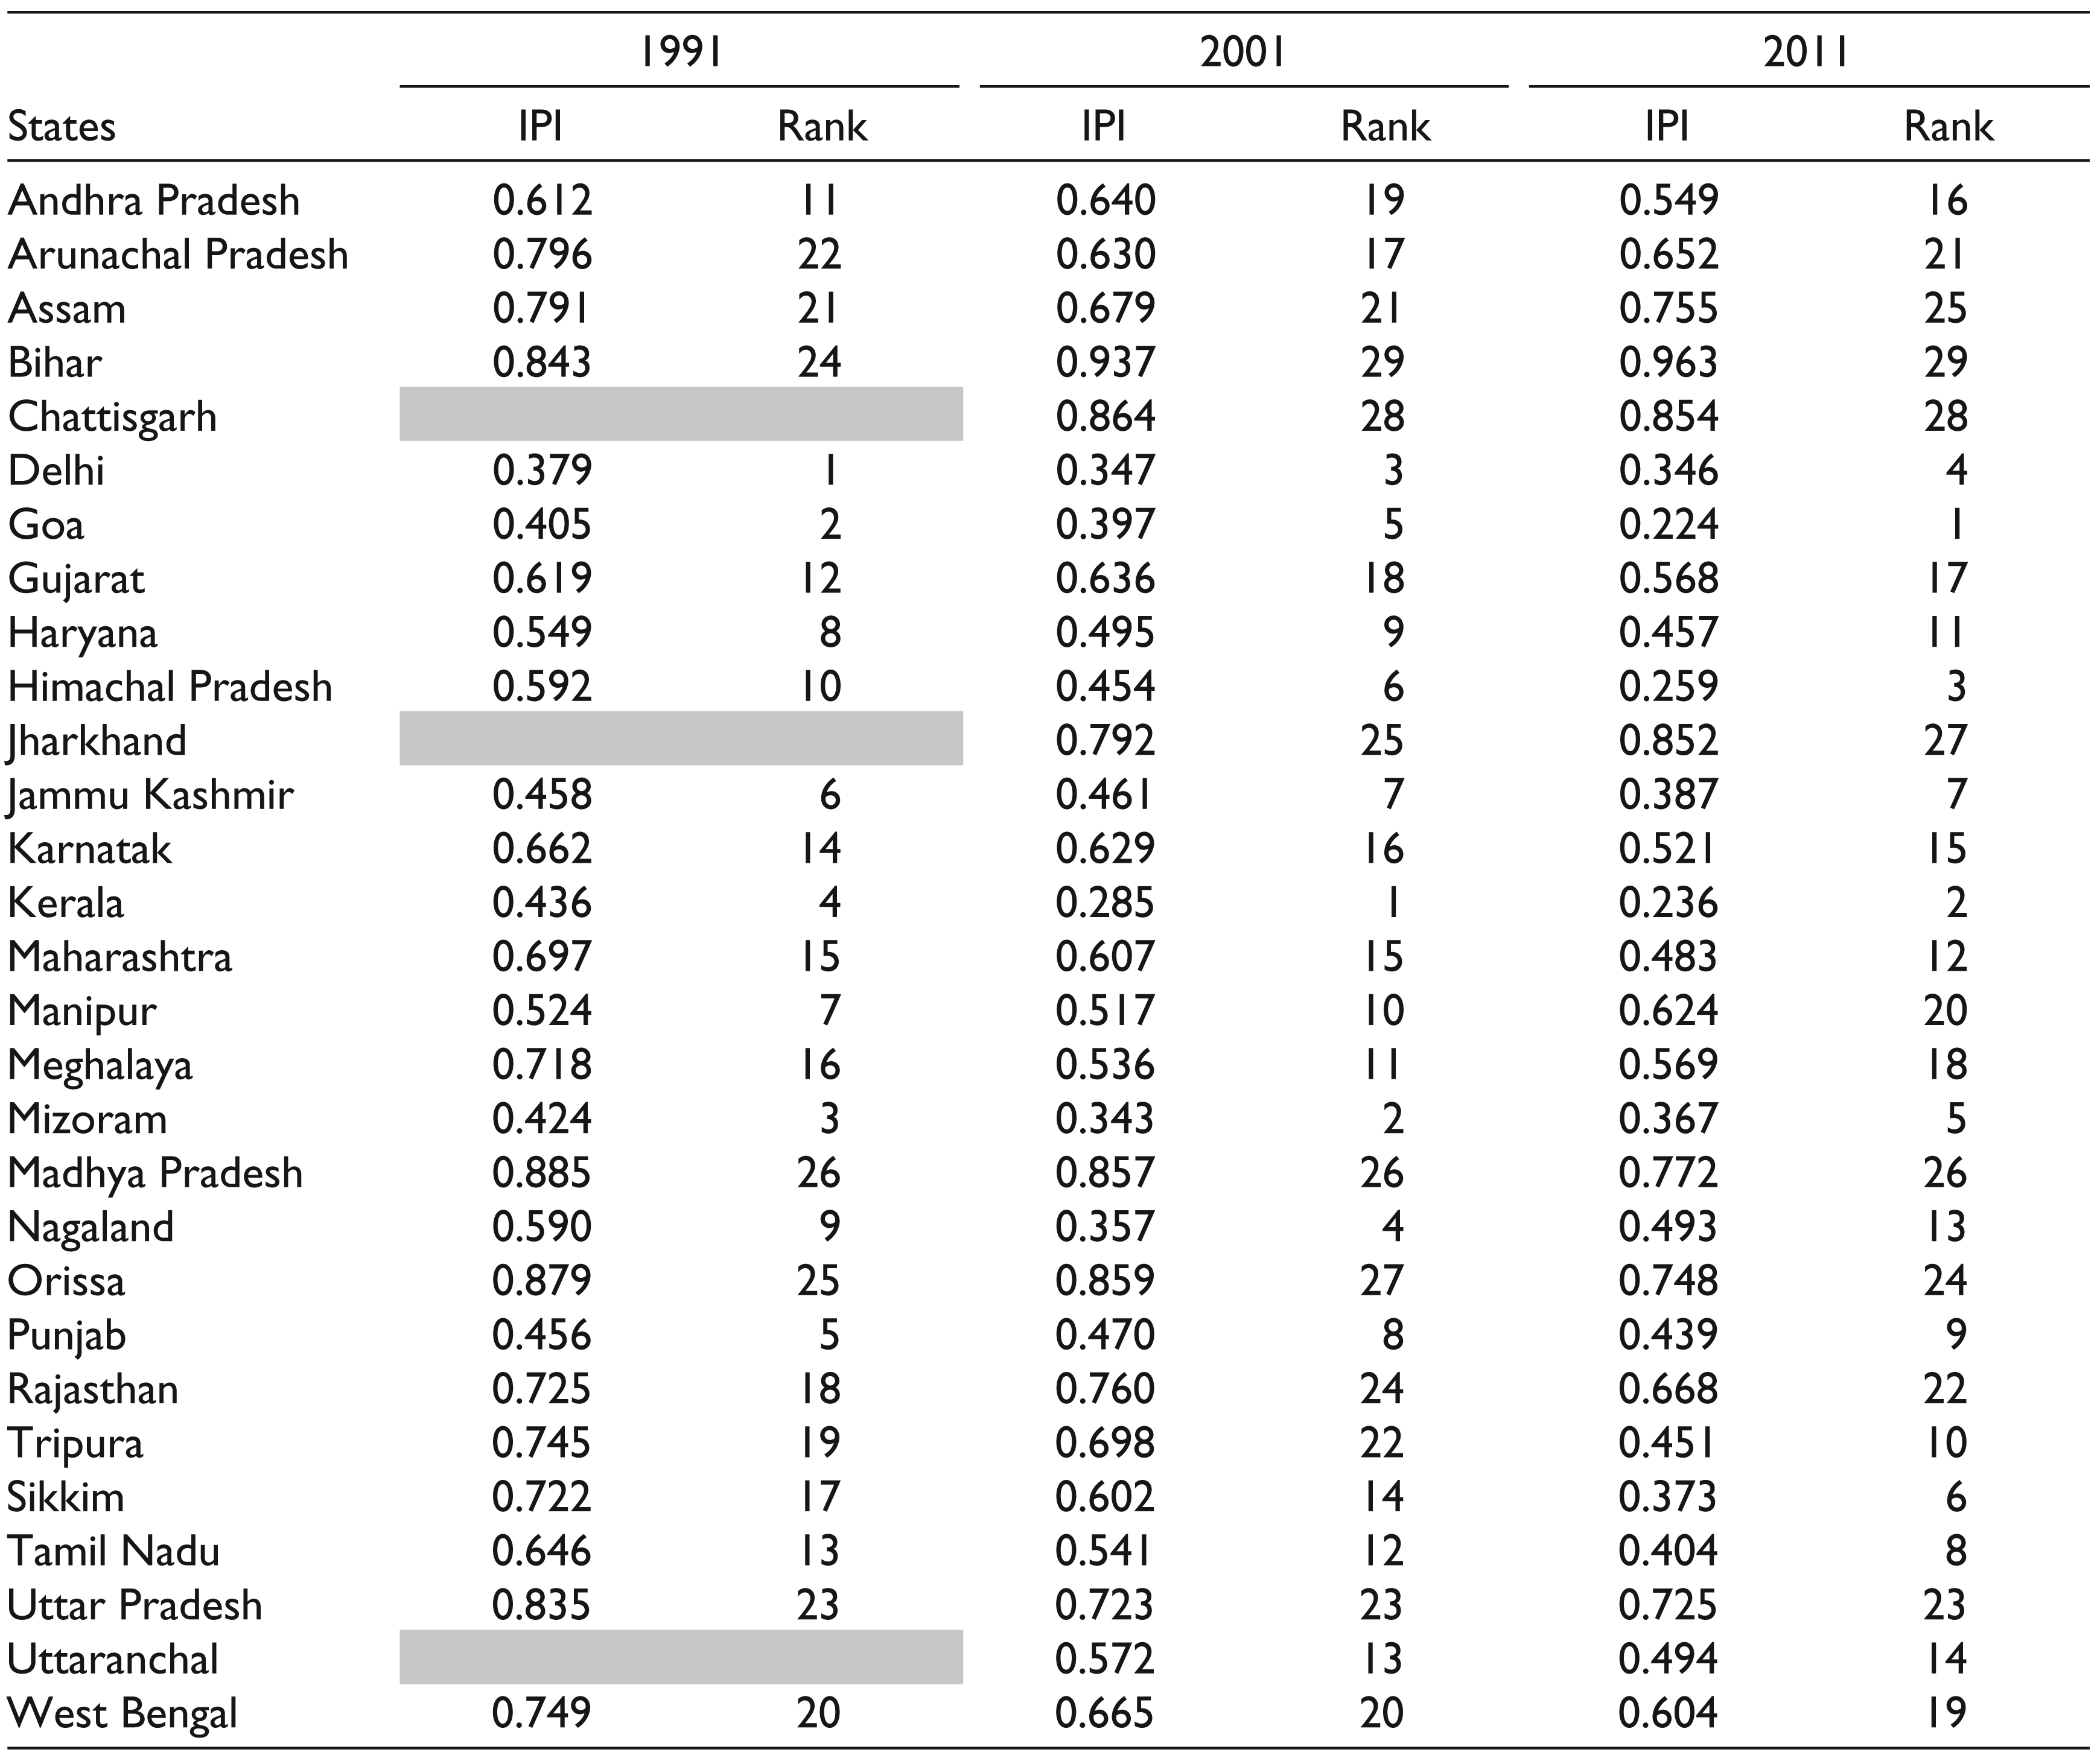
The integrated poverty estimates for the three time points, namely 1991–1993, 2000–2002 and 2009–2011, are presented in Graph 1. The all-India average IPI estimates show a slow reduction from 0.447 in 1991, to 0.356 in 2000–2003 to 0.301 in 2009–2011. Placed in an ascending order, we find that IPI has not been very stable over time and across states. The all-India average for 24 states has reduced by about 0.146 points between 1991 and 2011, that is, 2.11 per cent per annum. As is to be expected, the best performance in terms of having the least integrated poverty scores was that of Mizoram, Delhi and Kerala during the 1990s. Kerala, however, reduced its poverty faster to emerge to the top slot in 2010s followed by Mizoram and Goa. Notably, all these states are small states each accounting for less than 3 per cent of the India’s population.
States at the bottom of the ranking implying high levels of poverty were Madhya Pradesh, Odisha and Bihar in that order ranking 22, 23 and 24, respectively, at all three time points (see Table 2). Note that six states (Nagaland, Manipur, Arunachal Pradesh, Assam, Jharkhand and Bihar) are experience “reversing of IPI”, that is, a gradual rise in IPI over a period of time. This is an area of serious concern as most states are also low PCY regions. Evidently, there are some states where IPI has reduced more sharply (Himachal Pradesh, Meghalaya, Sikkim) as compared to other states. But Assam, Arunachal Pradesh and UP though have experienced a considerable reduction in IPI score, yet in absolute terms are relatively worse than other states. States such as Himachal Pradesh, Meghalaya, Sikkim and Arunachal Pradesh improved their ranks over the two-decade period, whereas Karnataka, Andhra Pradesh, Gujarat and Karnataka have slid down in their ranks.
Ranks for Integrated Poverty Index for Indian States: 1990s–2010s
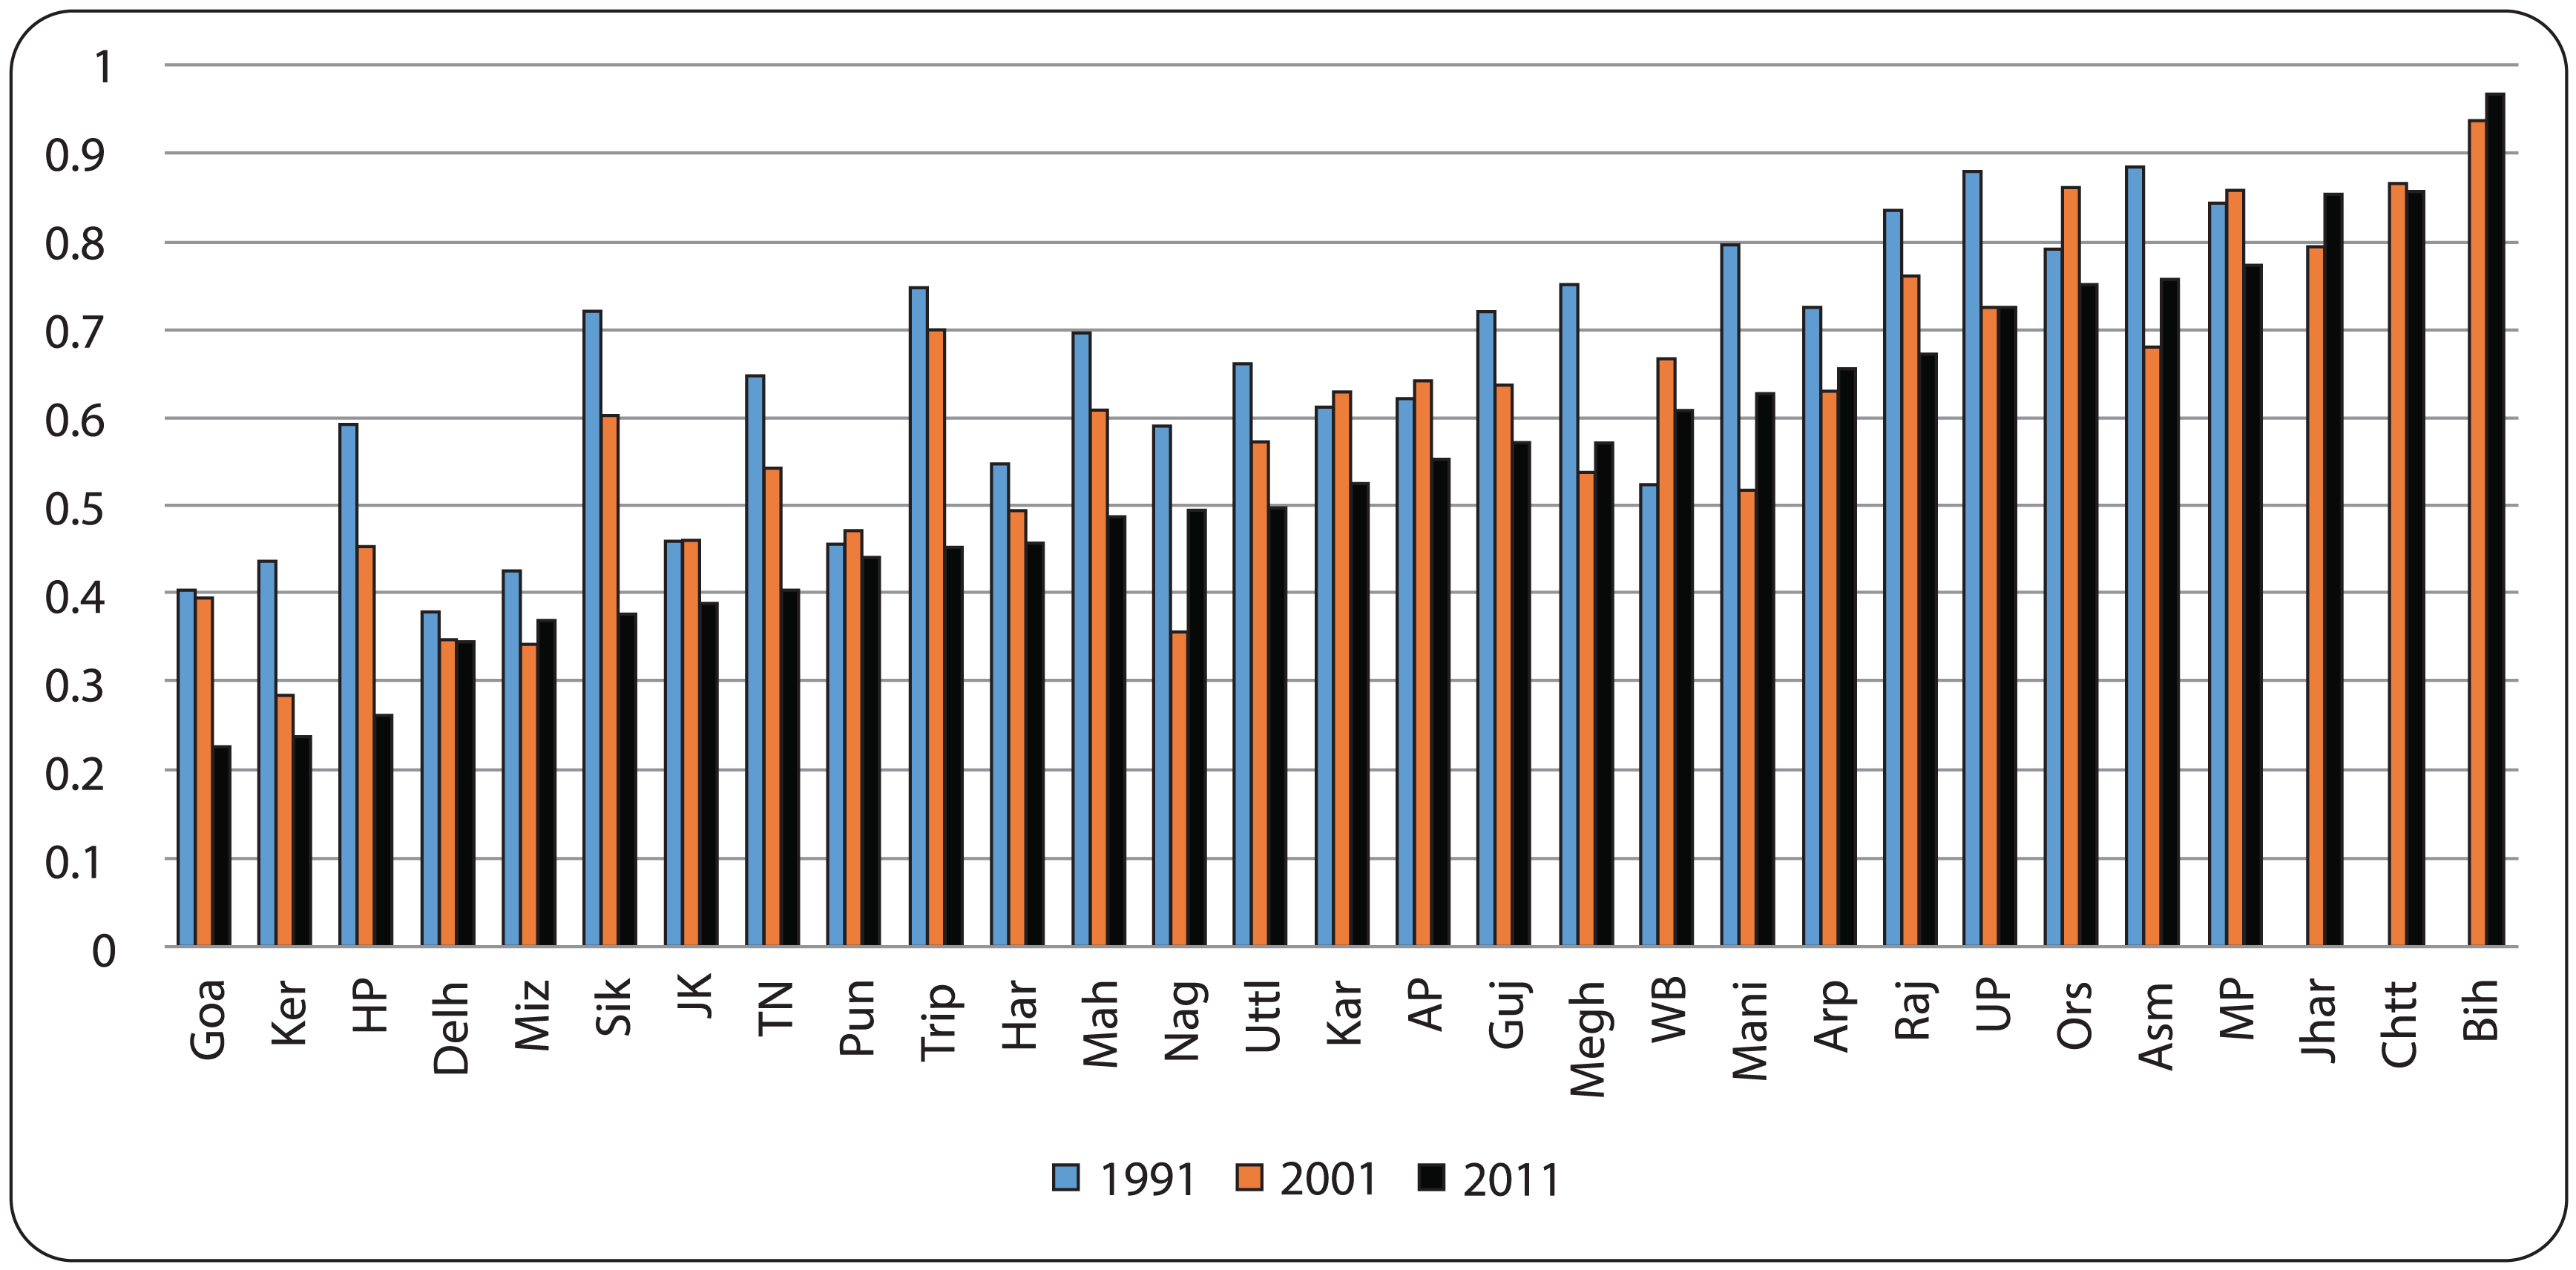
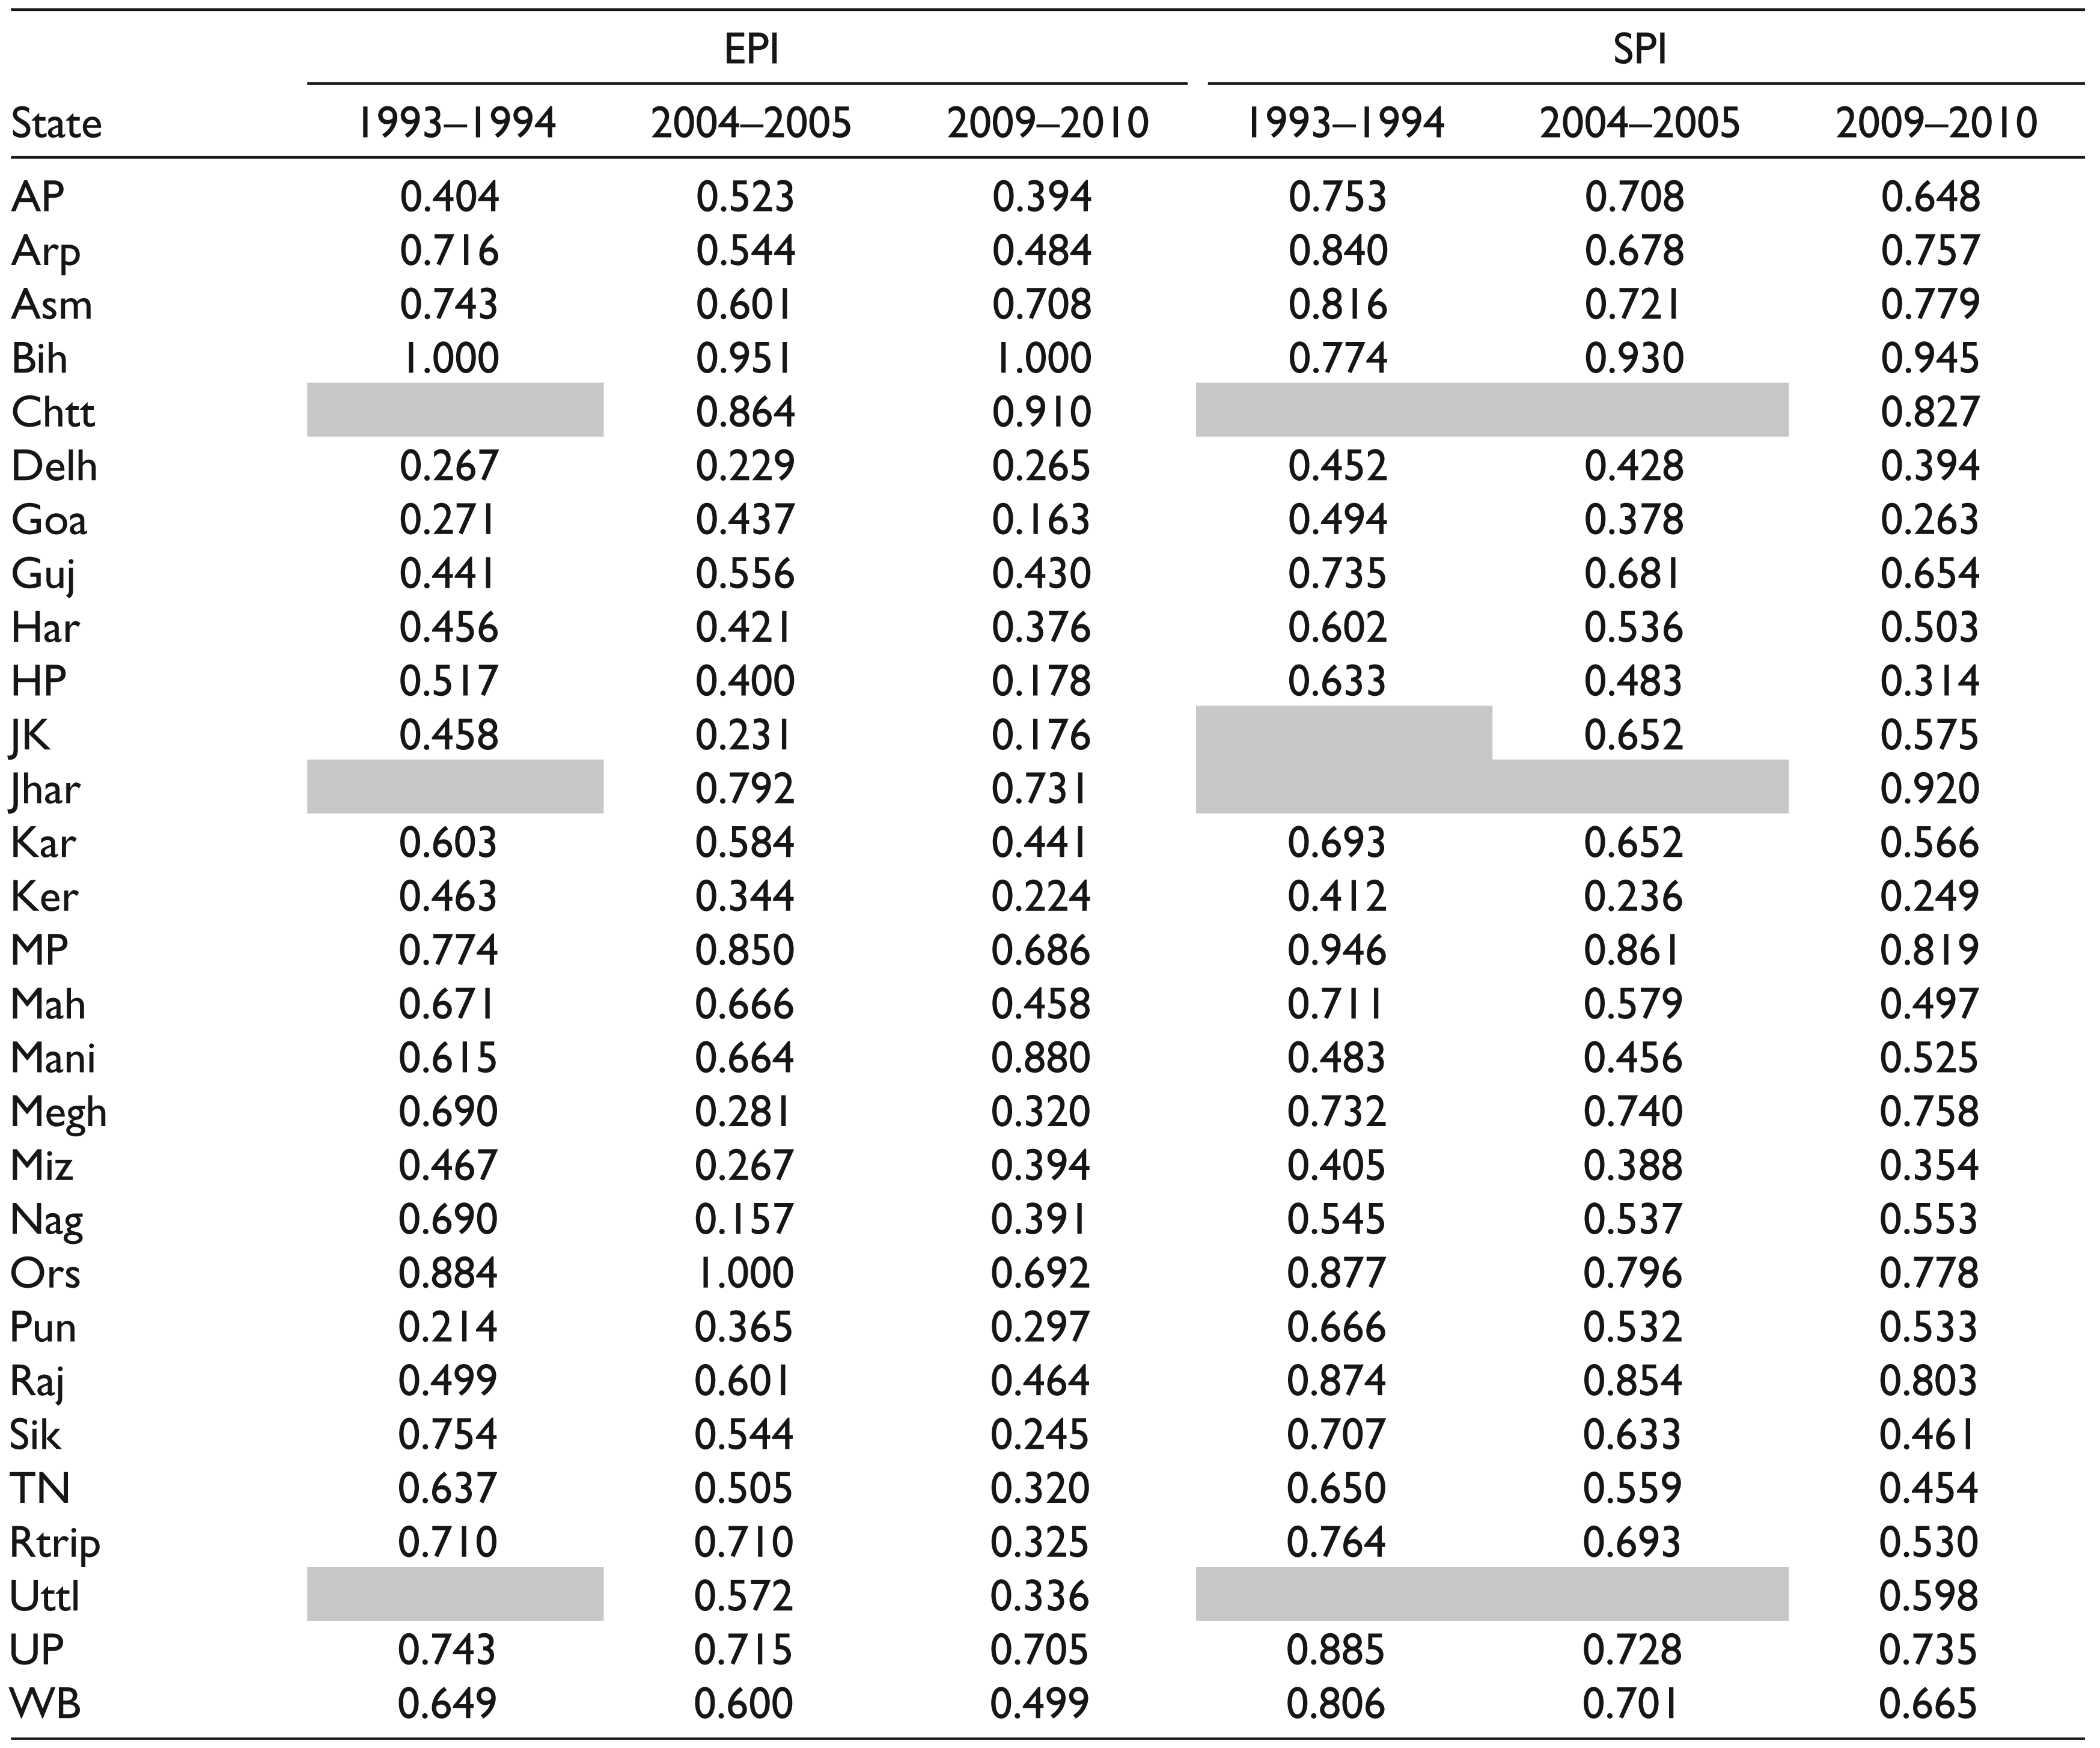
Performance of the states with regard to reduction of Economic Poverty Index (EPI) presents some very interesting results. Income score of most states reduced over the past two decades but at differing rates. A perusal of Graph 2 shows that with an exception of Himachal Pradesh, Goa, Sikkim and Kerala, the rate of reduction of income score has been the same or marginally better than in the previous decade. It is noteworthy that although in the first decade, reduction of economic poverty was faster in most states, this was not the condition in the recent decade. Evidently, states have EPI values higher than the all-India average with values around 0.200 to 0.500 (Table 3). Most states are thus experiencing two major constraints with respect to reduction of EPI: (i) stagnancy in the overall reduction and (ii) number of states with high EPI with negligible or no improvement in aggregate well-being.
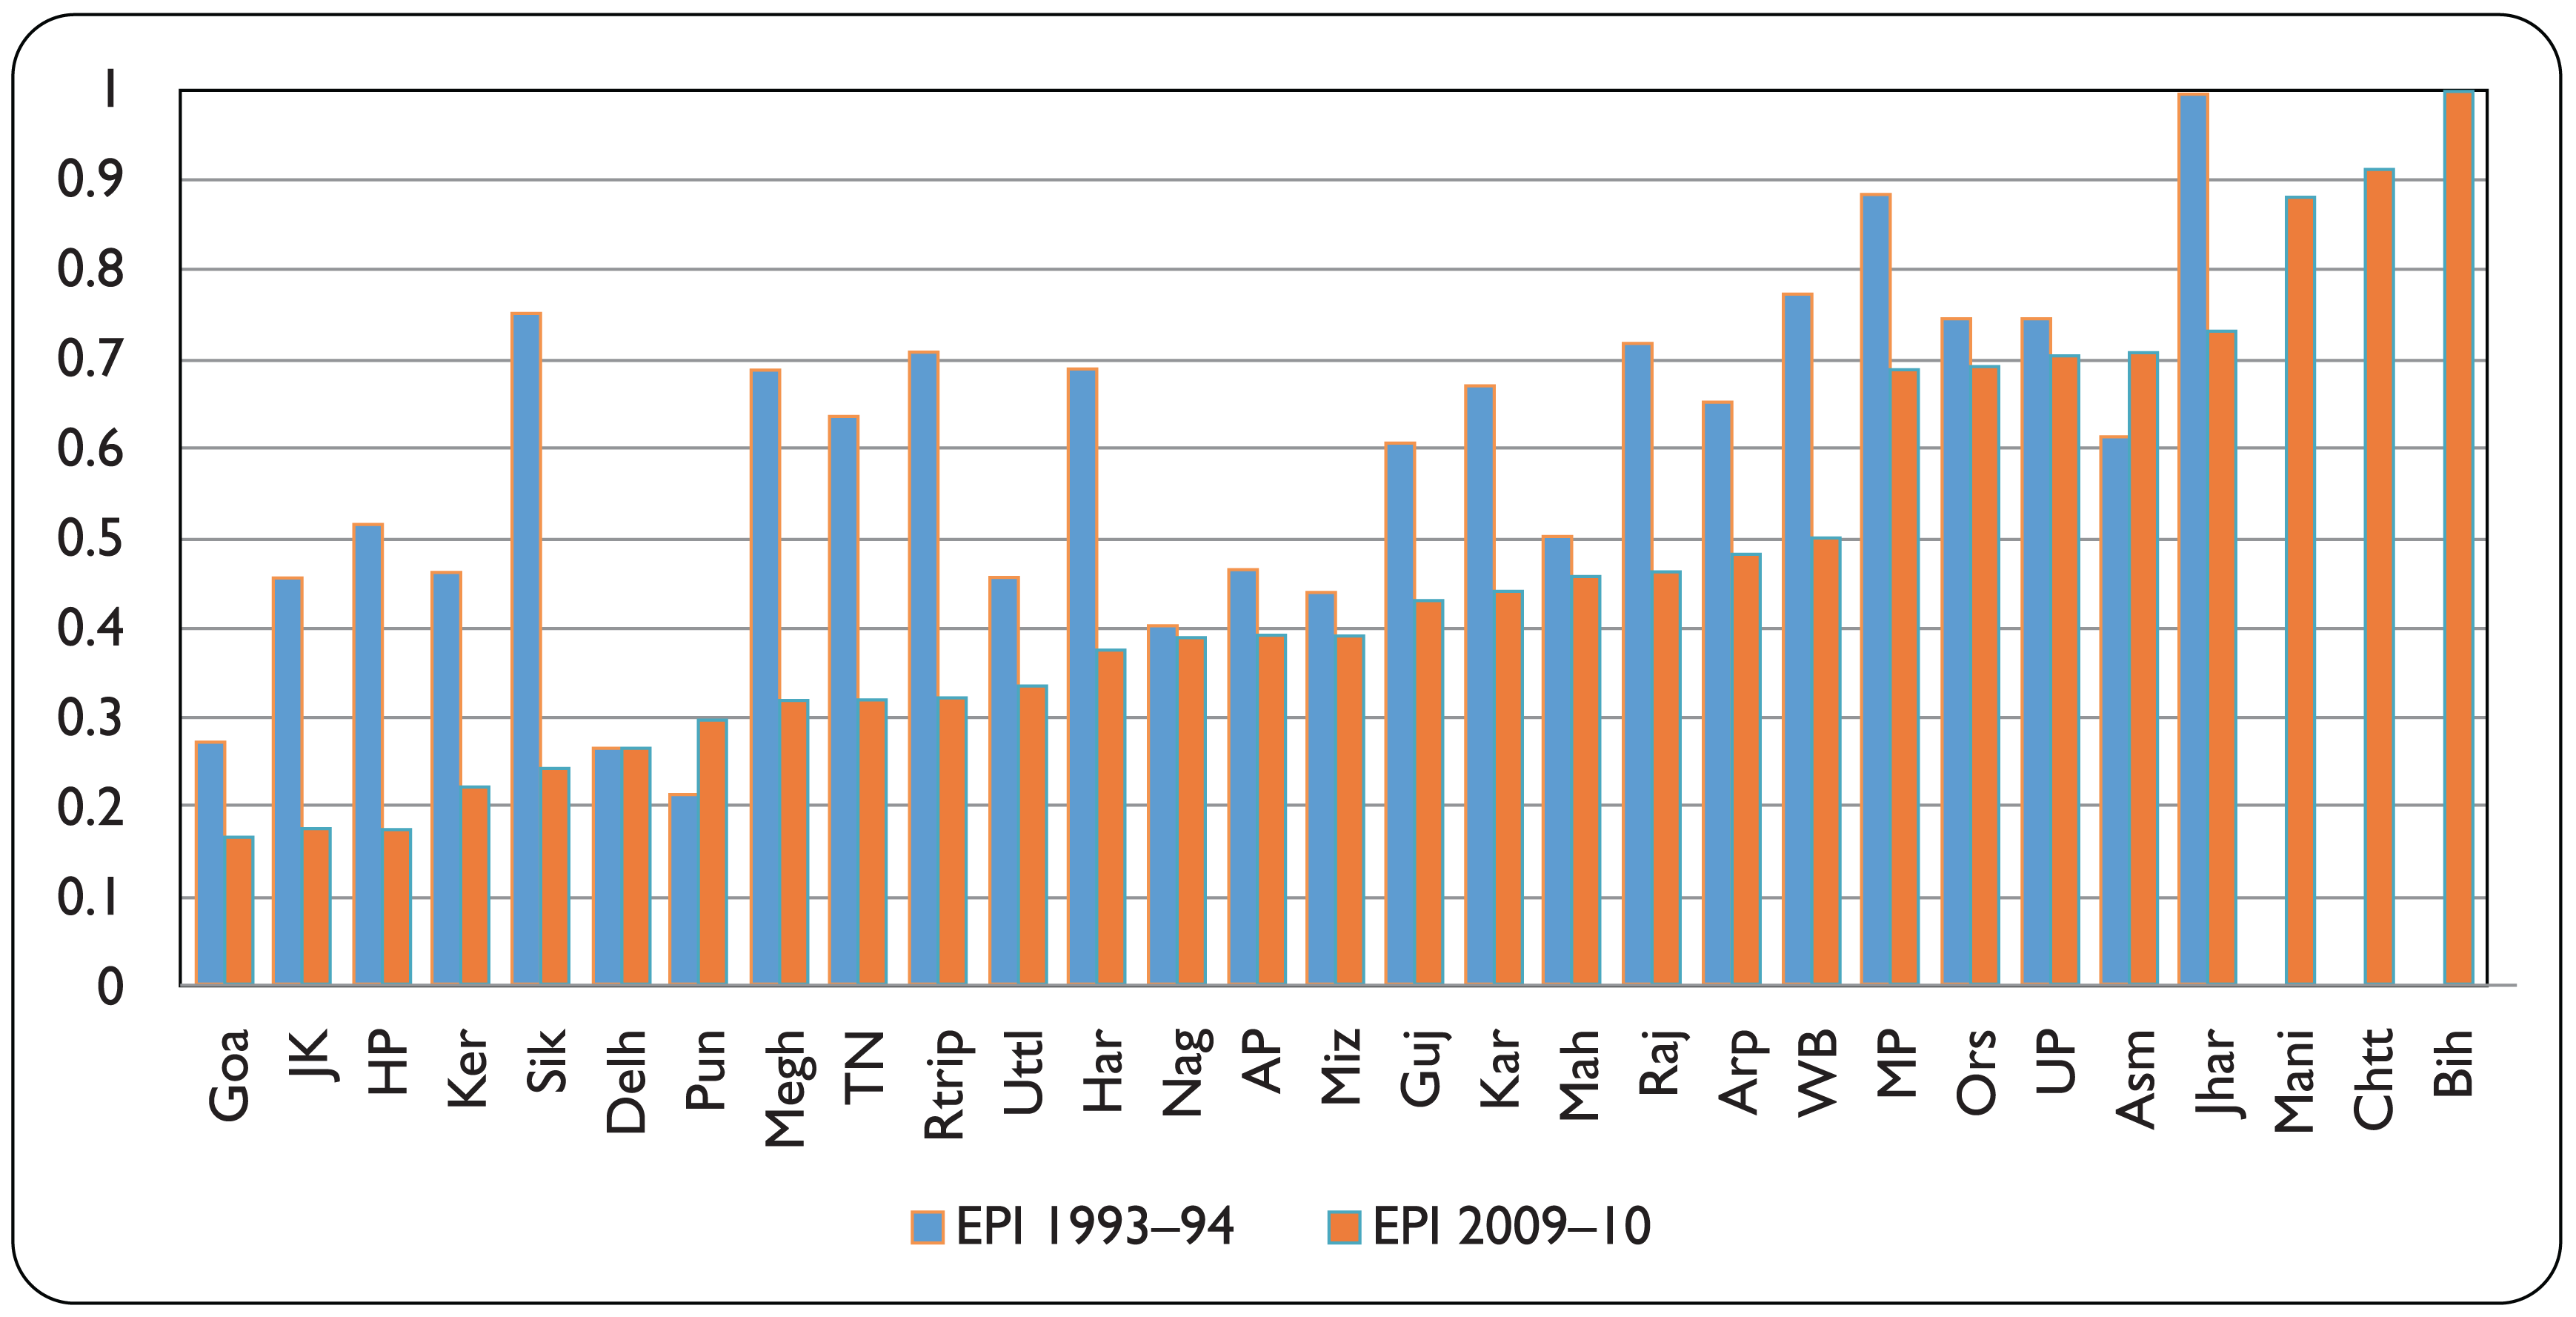
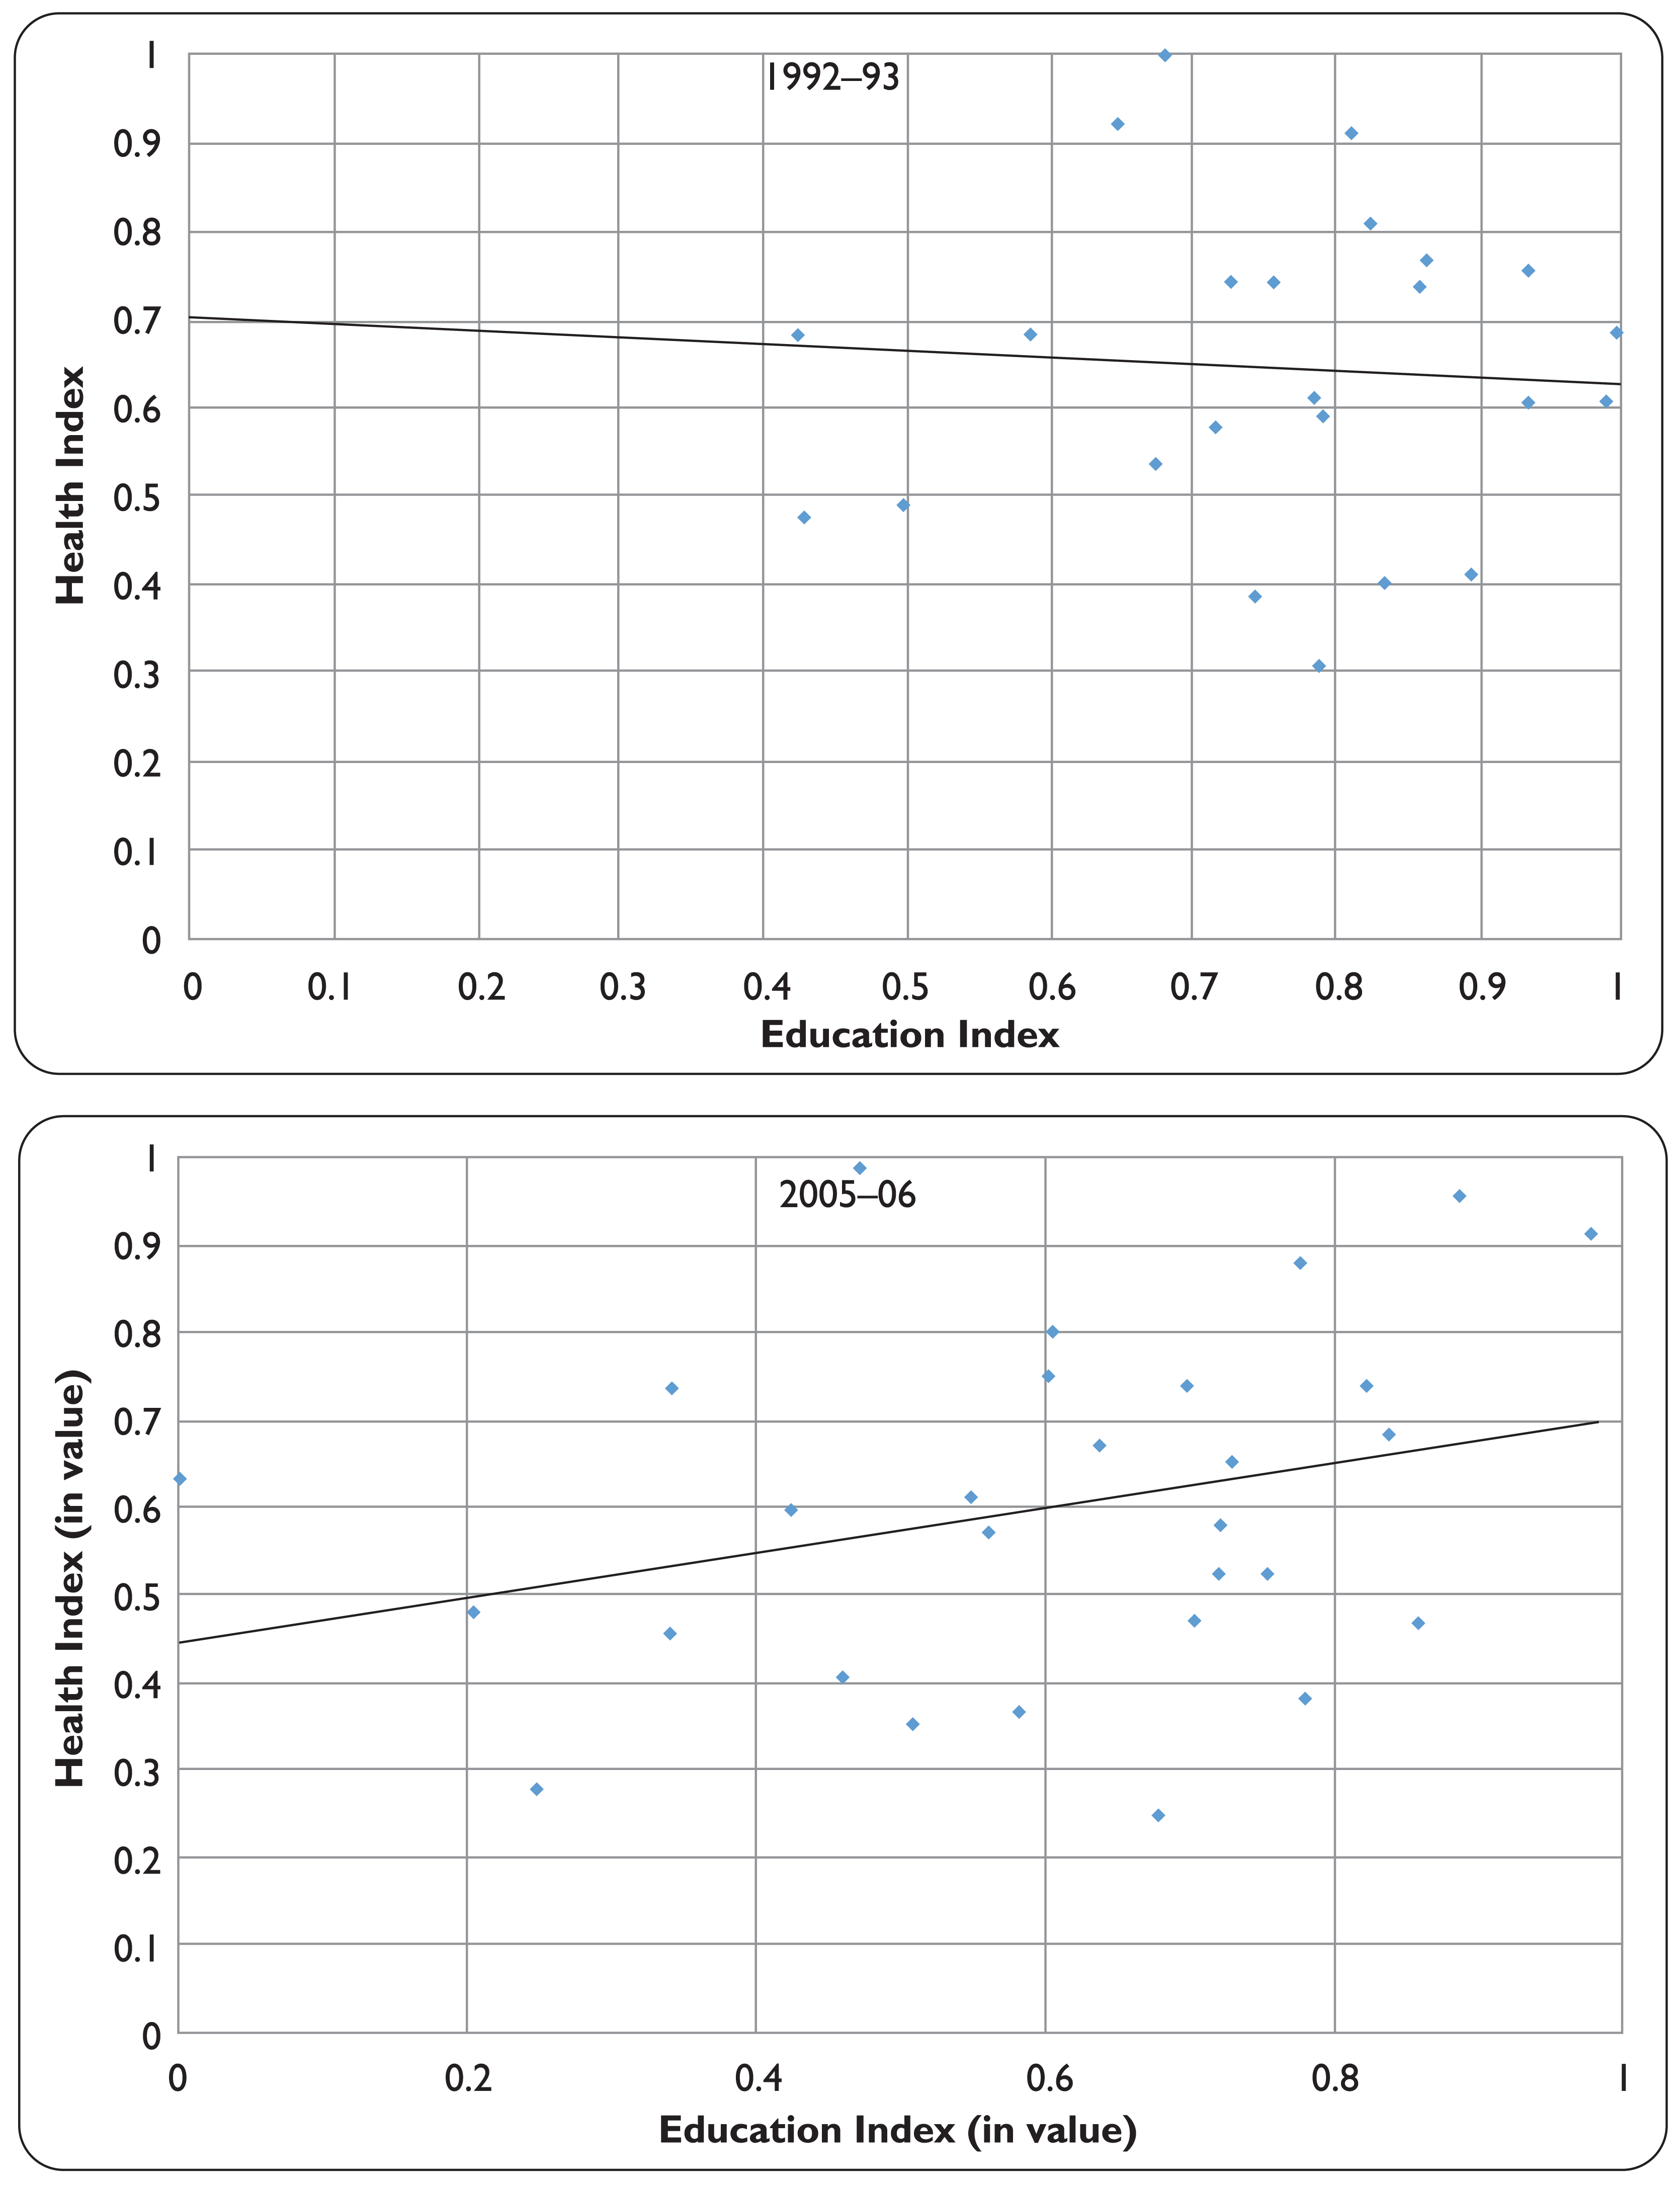
In case of Social Poverty Index (SPI), which comprises Education Poverty and Health Poverty, it is extremely interesting evidence which is relatively complex. A perusal of scatters of education index and health index for time points, 1992–1993 and 2005–2009, vividly shows a positive relationship between levels of poverty in both education and health sectors. In fact, along the mean distribution we find equal number of states with education and health poverty (See Graph 3). States like Arunachal Pradesh, Andhra Pradesh, Rajasthan and Bihar had dominance of education poverty, whereas Madhya Pradesh, Assam, Orissa and West Bengal had dominance of health poverty in the 1990s.
However, by the early 2000s, barring Tamil Nadu, Punjab, Sikkim, Goa, Mizoram and Jammu and Kashmir, most states have dominance of health-related poverty. In the past two decades, there seems to a faster reduction of education poverty rather than health poverty. Statewise estimates of head count ratio with and without adjustment of health expenditure shows that poverty rises by over 3.6 per cent in rural areas in urban areas by 2.9 percentage points (Gupta, 2009). Some of the states that dominated high EPI values also belong to this category. Health poverty was prominent for its high scores and also was sticky with not much downward movement over the two decades pointing to the need to tackle health poverty more seriously. Thus, despite improvements in education outcomes, social poverty continues to higher in most states relative to income poverty.
Statewise Component Scores of Economic Poverty Index (EPI) and Social Poverty Index (SPI)
IPI and Economic Growth: Withering Interconnections
Income is a means to determining overall level of capabilities expansion. Similarly, stability in rate of economic growth would translate into a process of sustained capabilities. However, we need to underscore the fact that while income is a means to the end, empirical evidence has been mixed about the impact of economic growth on human development. It may also be argued that inverse relationship between poverty and per capita income is tautological; yet the two decadal analysis between the integrated measure of poverty and per capita income for Indian states shows changing interlinkages between the two indicators.
We find four interesting groups of states while evaluating the linkages between PCNSDP and IPI (See Graph 4). First, states with relatively low level of PCNSDP (₹10,000–27,000) are also states with over 0.790–0.920 IPI; this includes states like Orissa, Madhya Pradesh, Jharkhand, Chhattisgarh and Bihar. Second, though PCNSDP levels of Rajasthan, Assam and Uttar Pradesh are similar to Bihar and Orissa, their IPI values are relatively lesser though above 0.500. Third, states with PCNSDP ranging between ₹40000 and 55000 include Karnataka, West Bengal, Gujarat, Himachal Pradesh, Maharashtra, Haryana and Uttarakhand. Lastly, despite low PCNSDP, states like Kerala and Manipur have comparatively low IPI values. High-income states do not show any particular pattern. IPI and PCNSDP levels indicate similar stories as reflected in the 2001–2004 period. But some of the interesting dimensions are even as Manipur, Meghalaya and Mizoram continued to remain in average ₹20,000–30,000 per capita income levels with low levels of IPI, PCNSDP in Kerala has improved to ₹40000 and IPI has reduced significantly. It had the lowest rank. Coincidently, Sikkim, Punjab and Himachal Pradesh with similar PCNSDP levels have relatively higher IPI as compared to Kerala.
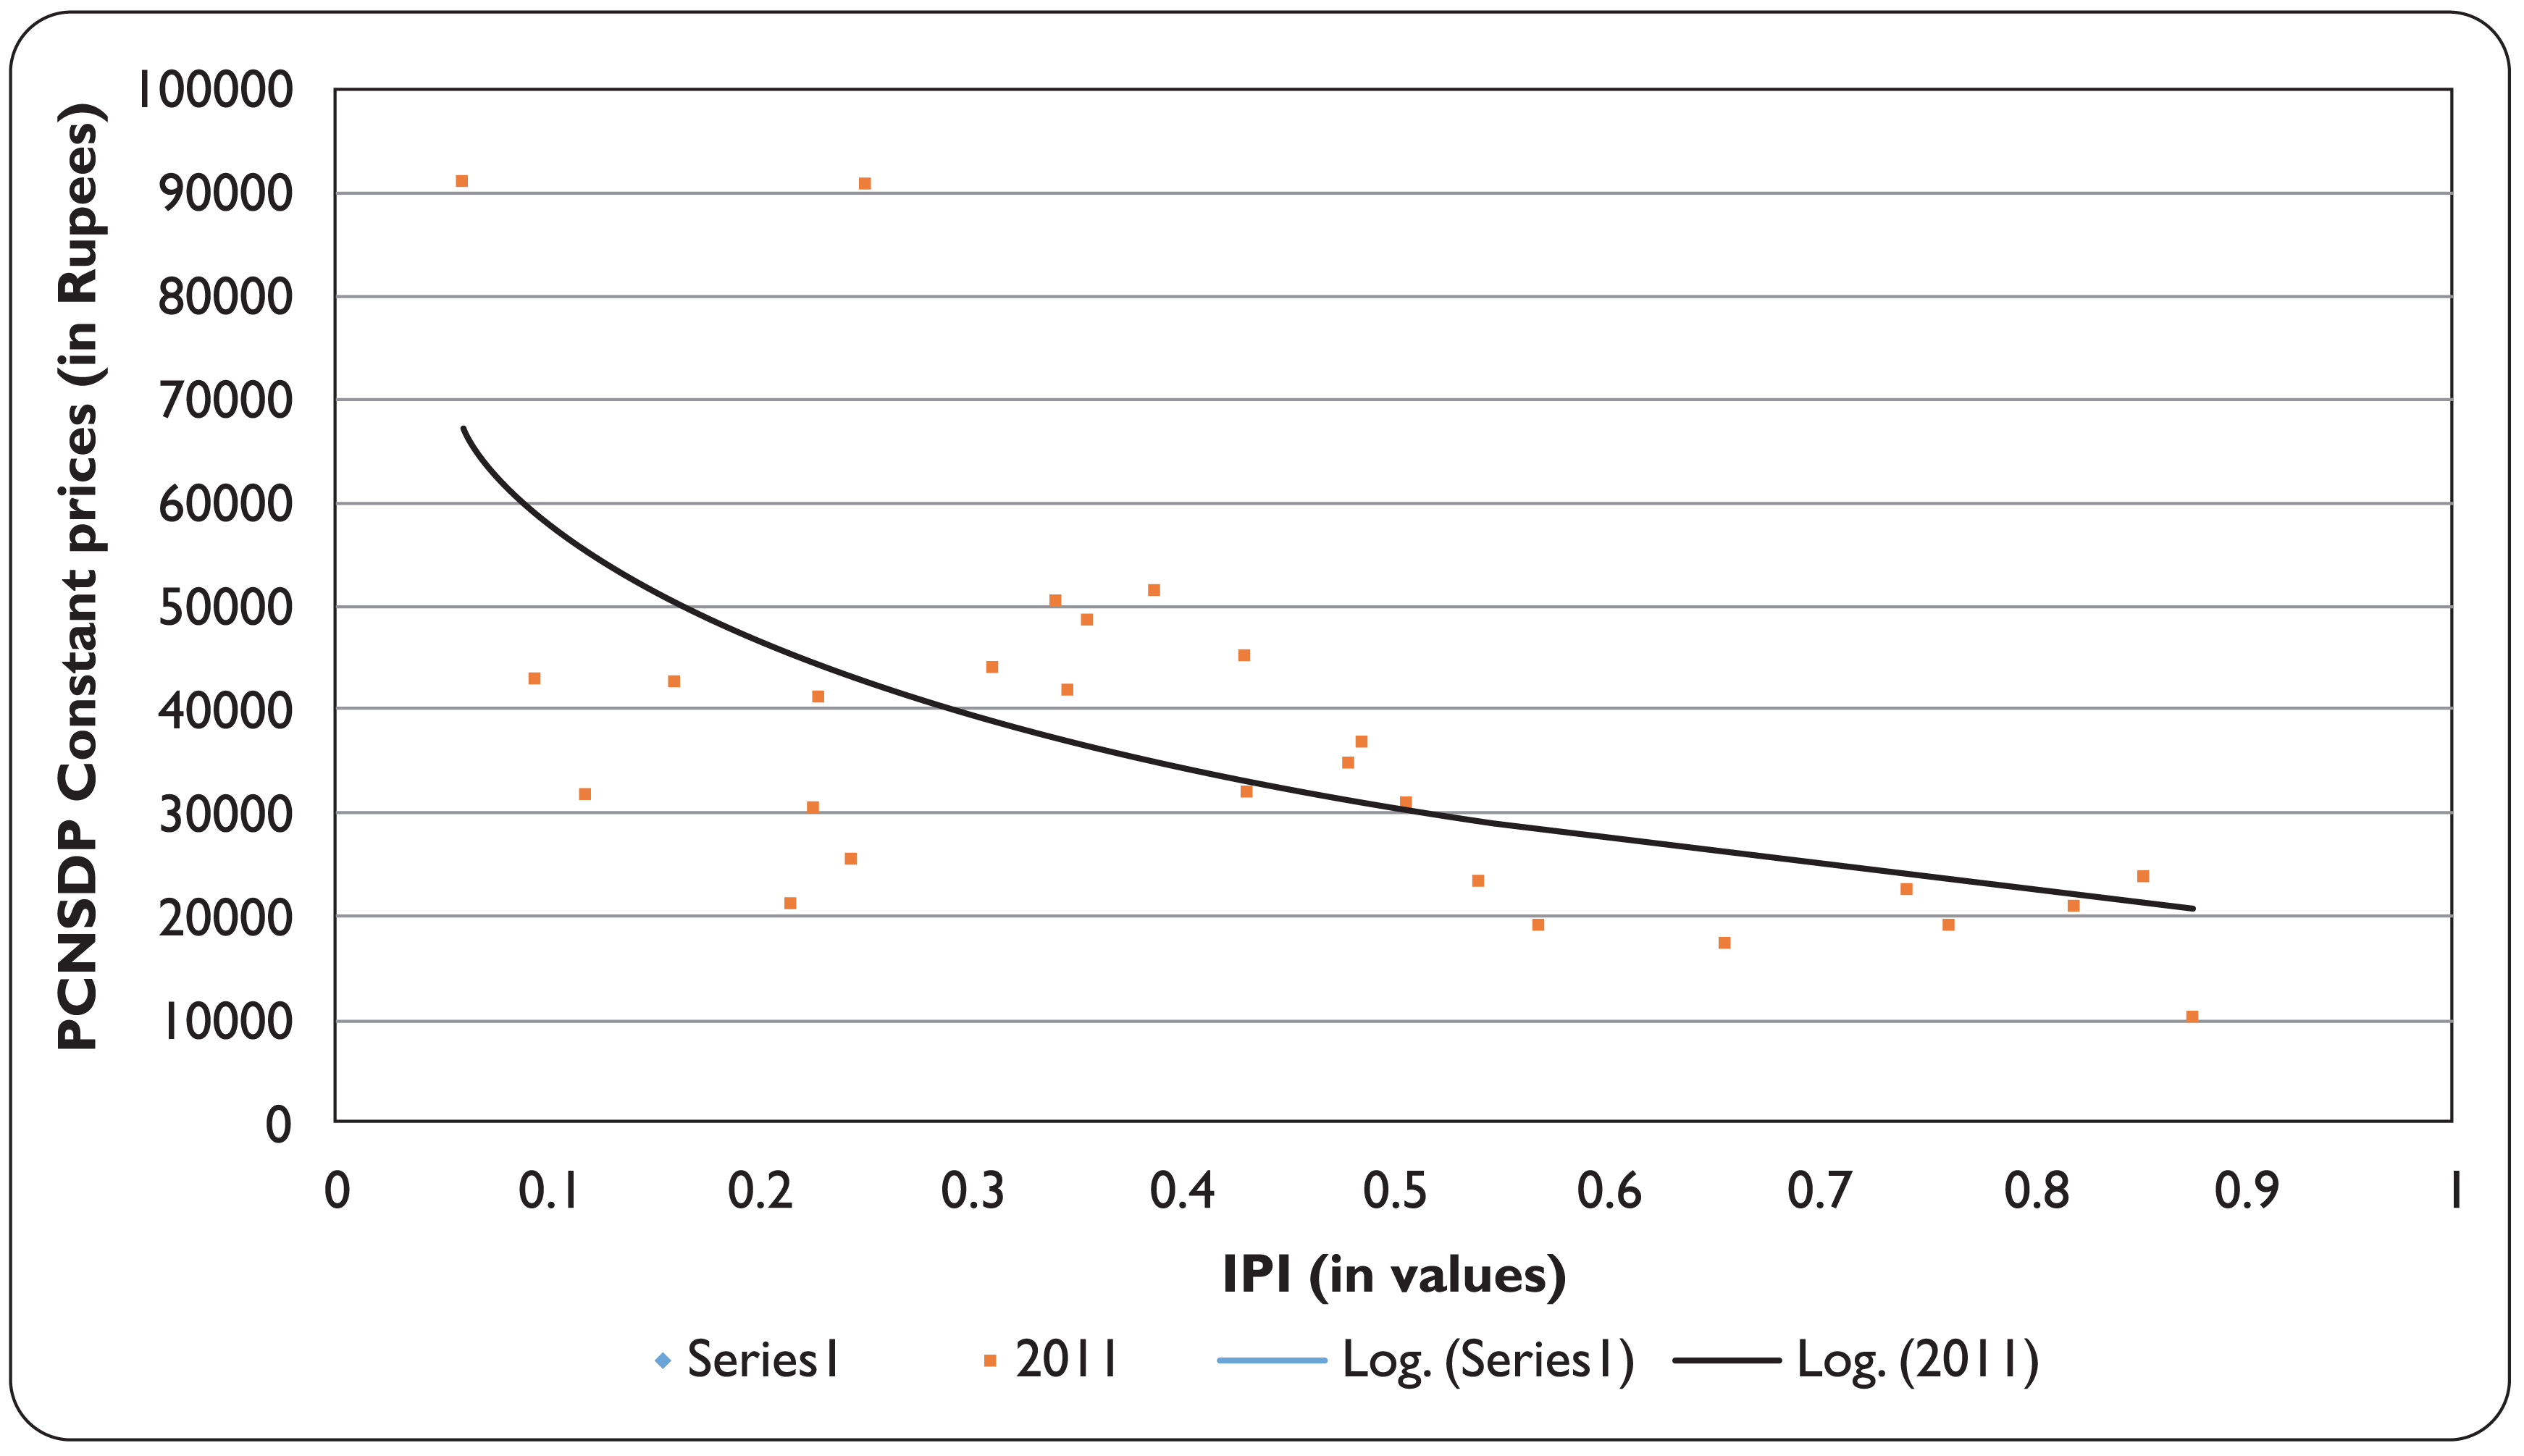
Note that Gujarat, Maharashtra, Tamil Nadu and Haryana with much higher PCNSDP levels have not been able to reduce their IPI values in recent times, raising concerns of “IPI-trap” in high-income states. On the other hand, we find that low-income states (Bihar, Madhya Pradesh, Chhattisgarh, Orissa, Jharkhand and Uttar Pradesh) have been in the same level of IPI and PCNSDP for the past two decades raising concerns of both growth-led and development-led initiatives in these states. Incidentally, Rajasthan and West Bengal seem to have reduced IPI to close to 0.400 and are in levels currently achieved by Karnataka and Andhra Pradesh.
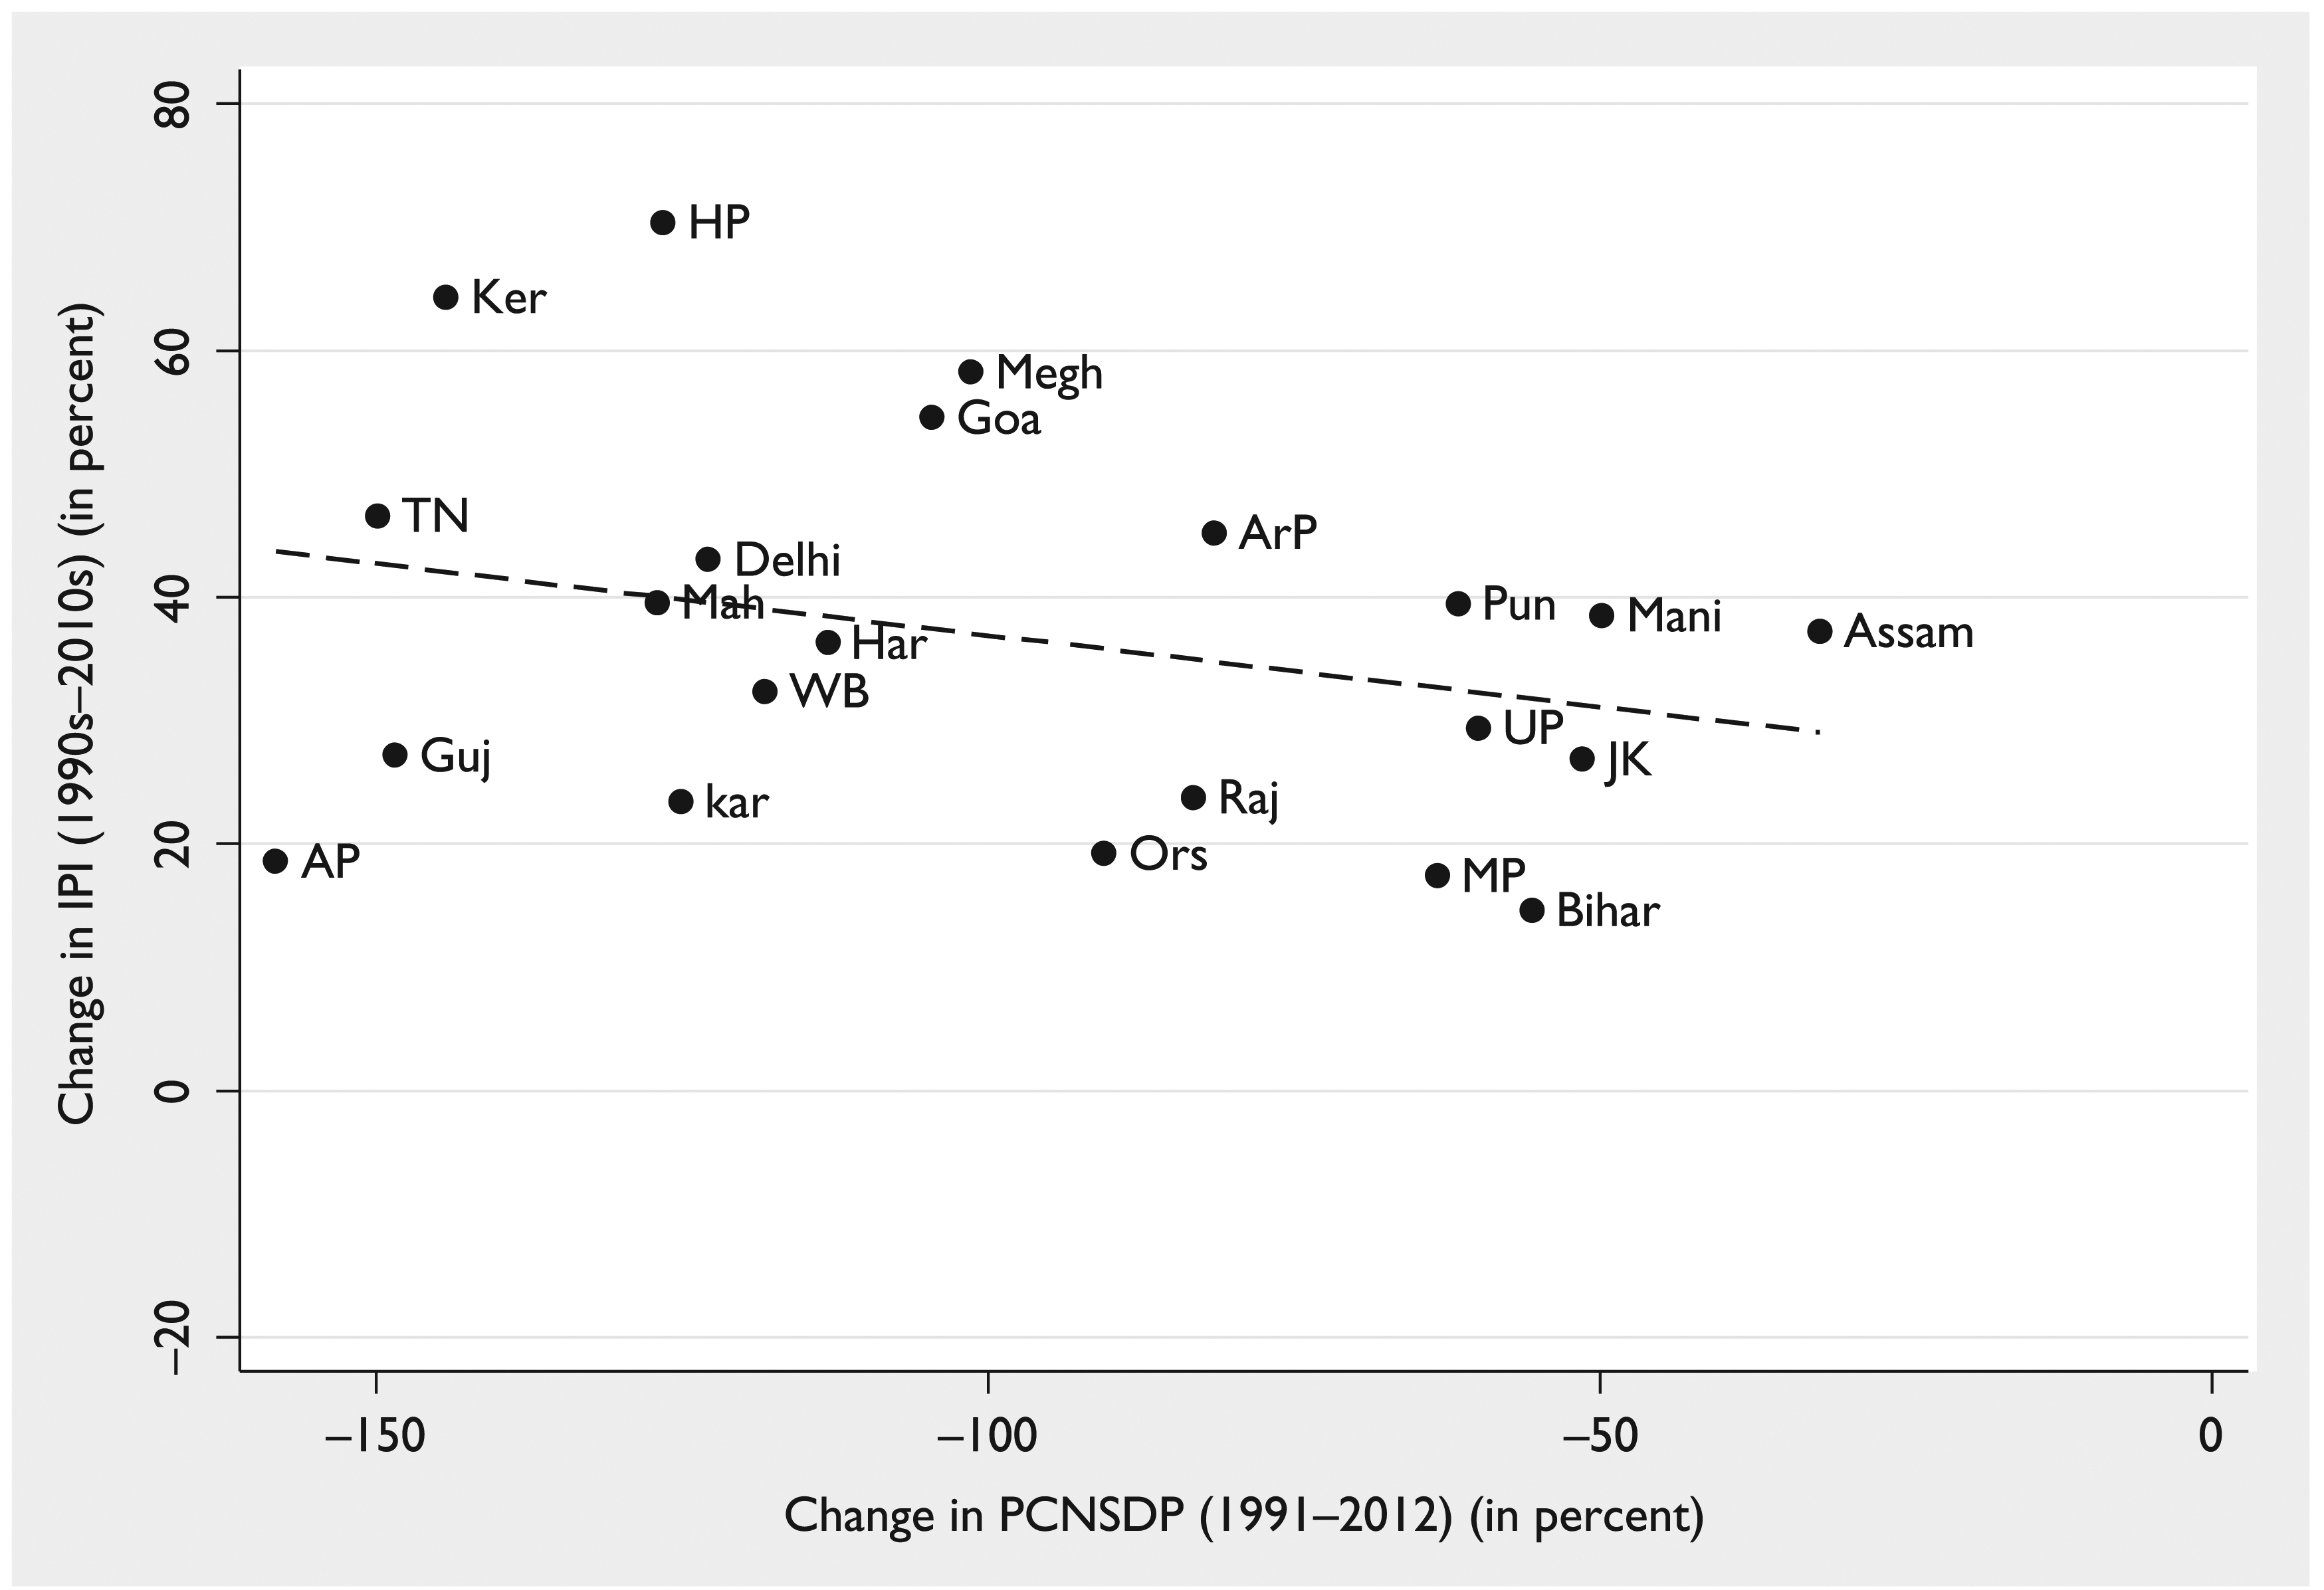
A longitudinal relationship of IPI and average annual growth rate of PCNSDP (1991–2012) shows that Kerala and Tamil Nadu with average growth rates of about 6 per cent as compared to 5.5–6 per cent recorded by Maharashtra, Himachal Pradesh and Karnataka but have had differential reductions in IPI rates (See Graph 5). In fact, Gujarat and Andhra Pradesh with relatively higher growth have not been able to reduce IPI. Similarly, Punjab has had lower rates of economic growth and lower percentage share reduction in IPI.
Overall, one can say that the period has been a directionless era with regard to aggregate poverty reduction. While growth has benefited certain states, other states seem to have failed to experience this process.
5.3 Does Population Matter?
A pertinent dimension to any poverty analysis is to probe its interrelationship with population. In an evaluation of growth and income poverty, Kundu, Mohanan and Varghese (2013) found weighted CV higher than the unweighted CV in all the years because the relatively more populous states like Bihar and Uttar Pradesh report per capita SDP significantly below the national average. Furthermore, the rise in the weighted CV is higher than the unweighted CV since the more populous states have not improved their per capita income levels as much as the less populated states. While it has been argued that demographic transition can be an enabler by contributing to overall development process, it can also be a disabler of economic growth as often seen through the prism of “population explosion”. Earlier, Amartya Sen (1994) in his theorization of role of population growth identified two strands of debate: a general approach of “override” and a “collaborative approach”. In case of the former, population growth is accorded highest “priority” in third world countries to family planning over other public commitments including shifting international aid away from development in general to family planning, as it seeks to manipulate people’s choices by offering them only some opportunities (the means of family planning) while denying others, no matter what they would have themselves preferred. In case of the latter, there is greater emphasis on rational decisions of women and men, based on expanded choices and enhanced security, and encouraged by open dialogue and extensive public discussions. According to him, the distinction between the “collaborative” approach and the “override” approach thus tends to correspond closely to the contrast between, on the one hand, treating economic and social development as the way to solve the population problem and, on the other, expecting little from development and using, instead, legal and economic pressures to reduce birth rates.
The capabilities approach argues that population influence would be critical both in terms of the levels and its composition. A heterogeneous population could have extremely diverse forms of capabilities, which coupled with weak entitlements could perpetuate capabilities deprivation. This argument in case of Indian states can be explained in terms of population dominance of vulnerable social groups SC/ST and poverty (Thorat, 2003; Dubey & Thorat, 2012; Thurow, 1969).
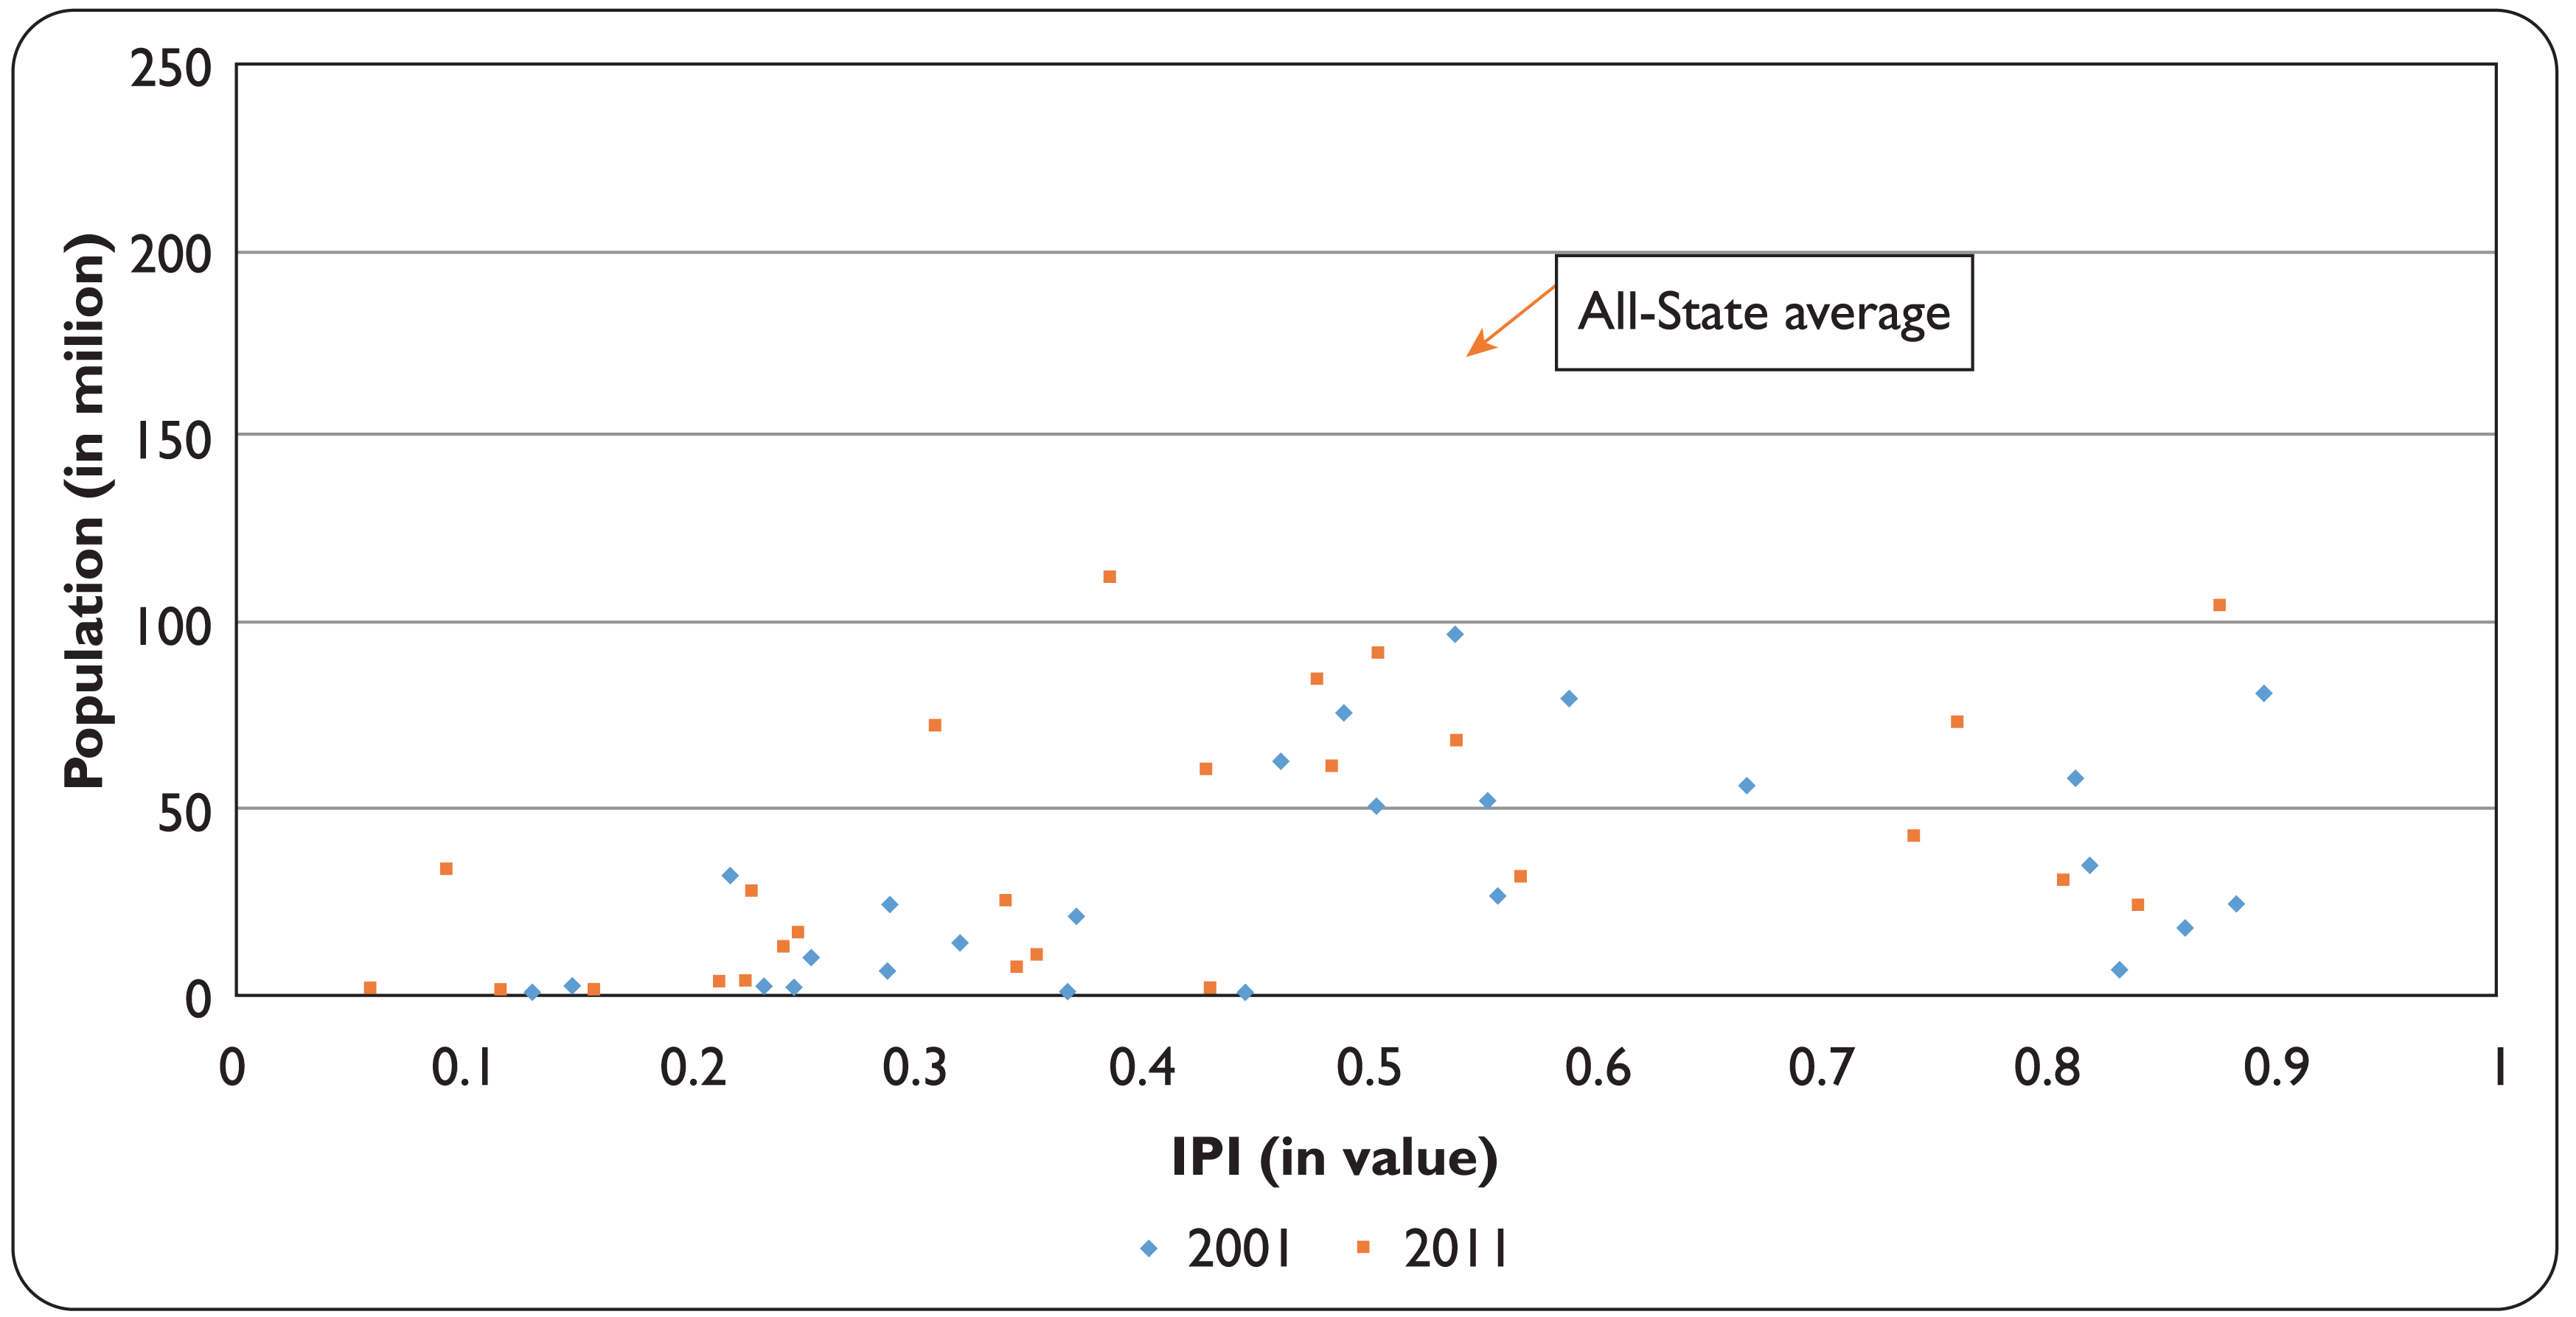
It is interesting to note that states which account for less than 0.1 to 1.0 per cent share in total population have been able to reduce IPI by over 40–50 per cent (See Graph 6). Kerala with a 3 per cent population share has been able to reduce IPI by about 40 percentage points, but Punjab has not been able to do so. The ability of states with greater population share and/or greater concentration of population, face greater challenges in reducing IPI. For example, states like Andhra Pradesh, Bihar, West Bengal which account for about 6–7 per cent of the total population (each) have been in the 10–15 per cent range of IPI reduction. There is an exception of Maharashtra in this regard though. Uttar Pradesh with over 15 per cent population seems to be struggling with stimulating growth and reduction of poverty and aggregate deprivation. Changing relationship between IPI and population can be best gauged by changing slopes of the trend lines and rise in the dispersion of the two variables.
To sum up, the coefficient of variation shows fluctuations in the PCNSDP across states as well as worsening of IPI over time (Table 4). Inequalities of Per capita income and rate of economic growth seem to have influenced overall IPI outcomes too. While both appear to be moving in the same direction, IPI appears to worsen even more rapidly over a period of time. Interestingly, we find that population CV has increased rapidly across states over the past two decades. Thus, while there are states with population density of less than 52–350 people in a sq. km, there are states with over 828–1132 persons per sq. km. This implicitly also underlies the problem of per capita availability of both quantum and quality of resources. Population and demographic factors seem to be emerging as equally crucial determinants of IPI for a state.
Elasticities of IPI
Often poverty analysis has been confined either to estimates of absolute and relative deprivation or to explaining its relation to overall growth process. In the analysis of IPI, we have found that each dimension has responded differently over time. There have been attempts to estimate elasticities of poverty with respect to growth. Growth elasticity of poverty (GEP) is the percentage reduction in poverty rates associated with a percentage change in mean (per capita) income. Growth elasticities of poverty can be written as
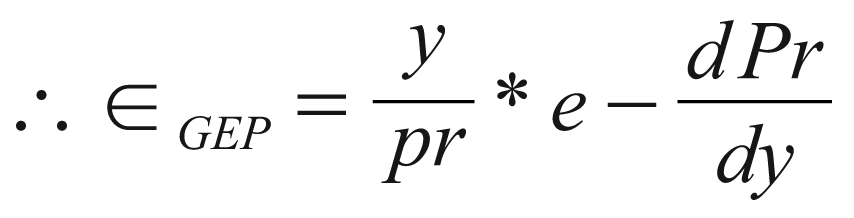
where PR is a poverty measure and y is per capita income. Note that
Coefficient of Variation of IPI, PCNSDP and Population: 1991–2011
To look at the socio-spatiality dimension of poverty, we introduce population elasticity of poverty (PEP). Ceteris paribus, PEP, is the percentage reduction of poverty rates associated with a percentage change in absolute population. Population elasticity of poverty can be written as
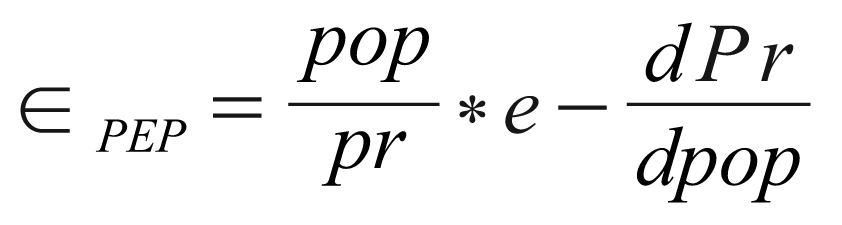
where pop is the population. Further,
Estimates of GEP for developing countries range from 1.5 to 5, with an average estimate of around 3. This implies that a 1 per cent increase in per capita income is associated with a 3 per cent decrease in the poverty rate (proportion of people living on less than $1 per day). Ravallion and Chen (1997), and Bruno, Ravallion and Squire (1998) estimated the value of the growth elasticity of poverty for the cross-section of countries to be between −2.0 and −3.0. A mean 1 per cent rise in consumption expenditure or income can reduce income poverty by 2–3 per cent. Inherently, therefore, economic growth is fundamental to reducing poverty rates, particularly in low-income countries. However, Bourguignon (2003) argues for the need to look at both growth effects and distributional effects. The thrust of most papers has been to explain the impact of economic growth on poverty reduction. He found that while the growth–poverty nexus is visible, the effectiveness of these linkages improved significantly when the redistribution effect is included. Redistributive policies not only reduce poverty drastically, but also have the ability to improve the elasticity of poverty reduction in the future period.
Population, on the other hand, has provided a very complex series of explanations: (i) It could hold down returns to labour relative to capital and other factors of production, depressing wages and worsening the income distribution; or (ii) an initially small but expanding modern sector within a larger, backward economy, population growth swells the traditional and informal labour force and delays the time at which modern-sector capital accumulation exhausts the supply of subsistence-level workers. The negative relationship of population–poverty could be a reflection of time lags, non-linearities and reverse causation. Often institutional practices through which societies mediate among competing claims on the social product can be a determinant. Rapid population growth may be a consequence of advances in health, signalling broad-based welfare improvement as in the case of Kerala and Tamil Nadu; such economies may expand rapidly with scant regard for equity. Yet, declining fertility rates need not always be a reflection of improvements in standard of living but could also be due to lack of quantum and quality of healthcare services.
The most that the 1992 UNFPA Consultative Meeting of Economists could conclude on the matter was that “The causal links between population growth and absolute deprivation are not well understood…. Research has not established a strong causal link running from high fertility to poverty” (United Nations Population Fund, 1993, pp. 50–51). World Bank economist Lant Pritchett (1997, p. 51) is brusquer: solid evidence that population growth is “a cause or even an exacerbating condition of poverty” cannot be given “because there is none”. Population growth is both a “cause and a consequence of poverty, and unravelling the pattern of causation may be an almost hopeless task” (Rodgers, 1989, p. 9). The closest explanation to changing relationship between population and poverty is provided by Lipton (1997), who reports a “large” positive effect of fertility on subsequent poverty in a 28-country analysis (Herrmann et al., 2011).
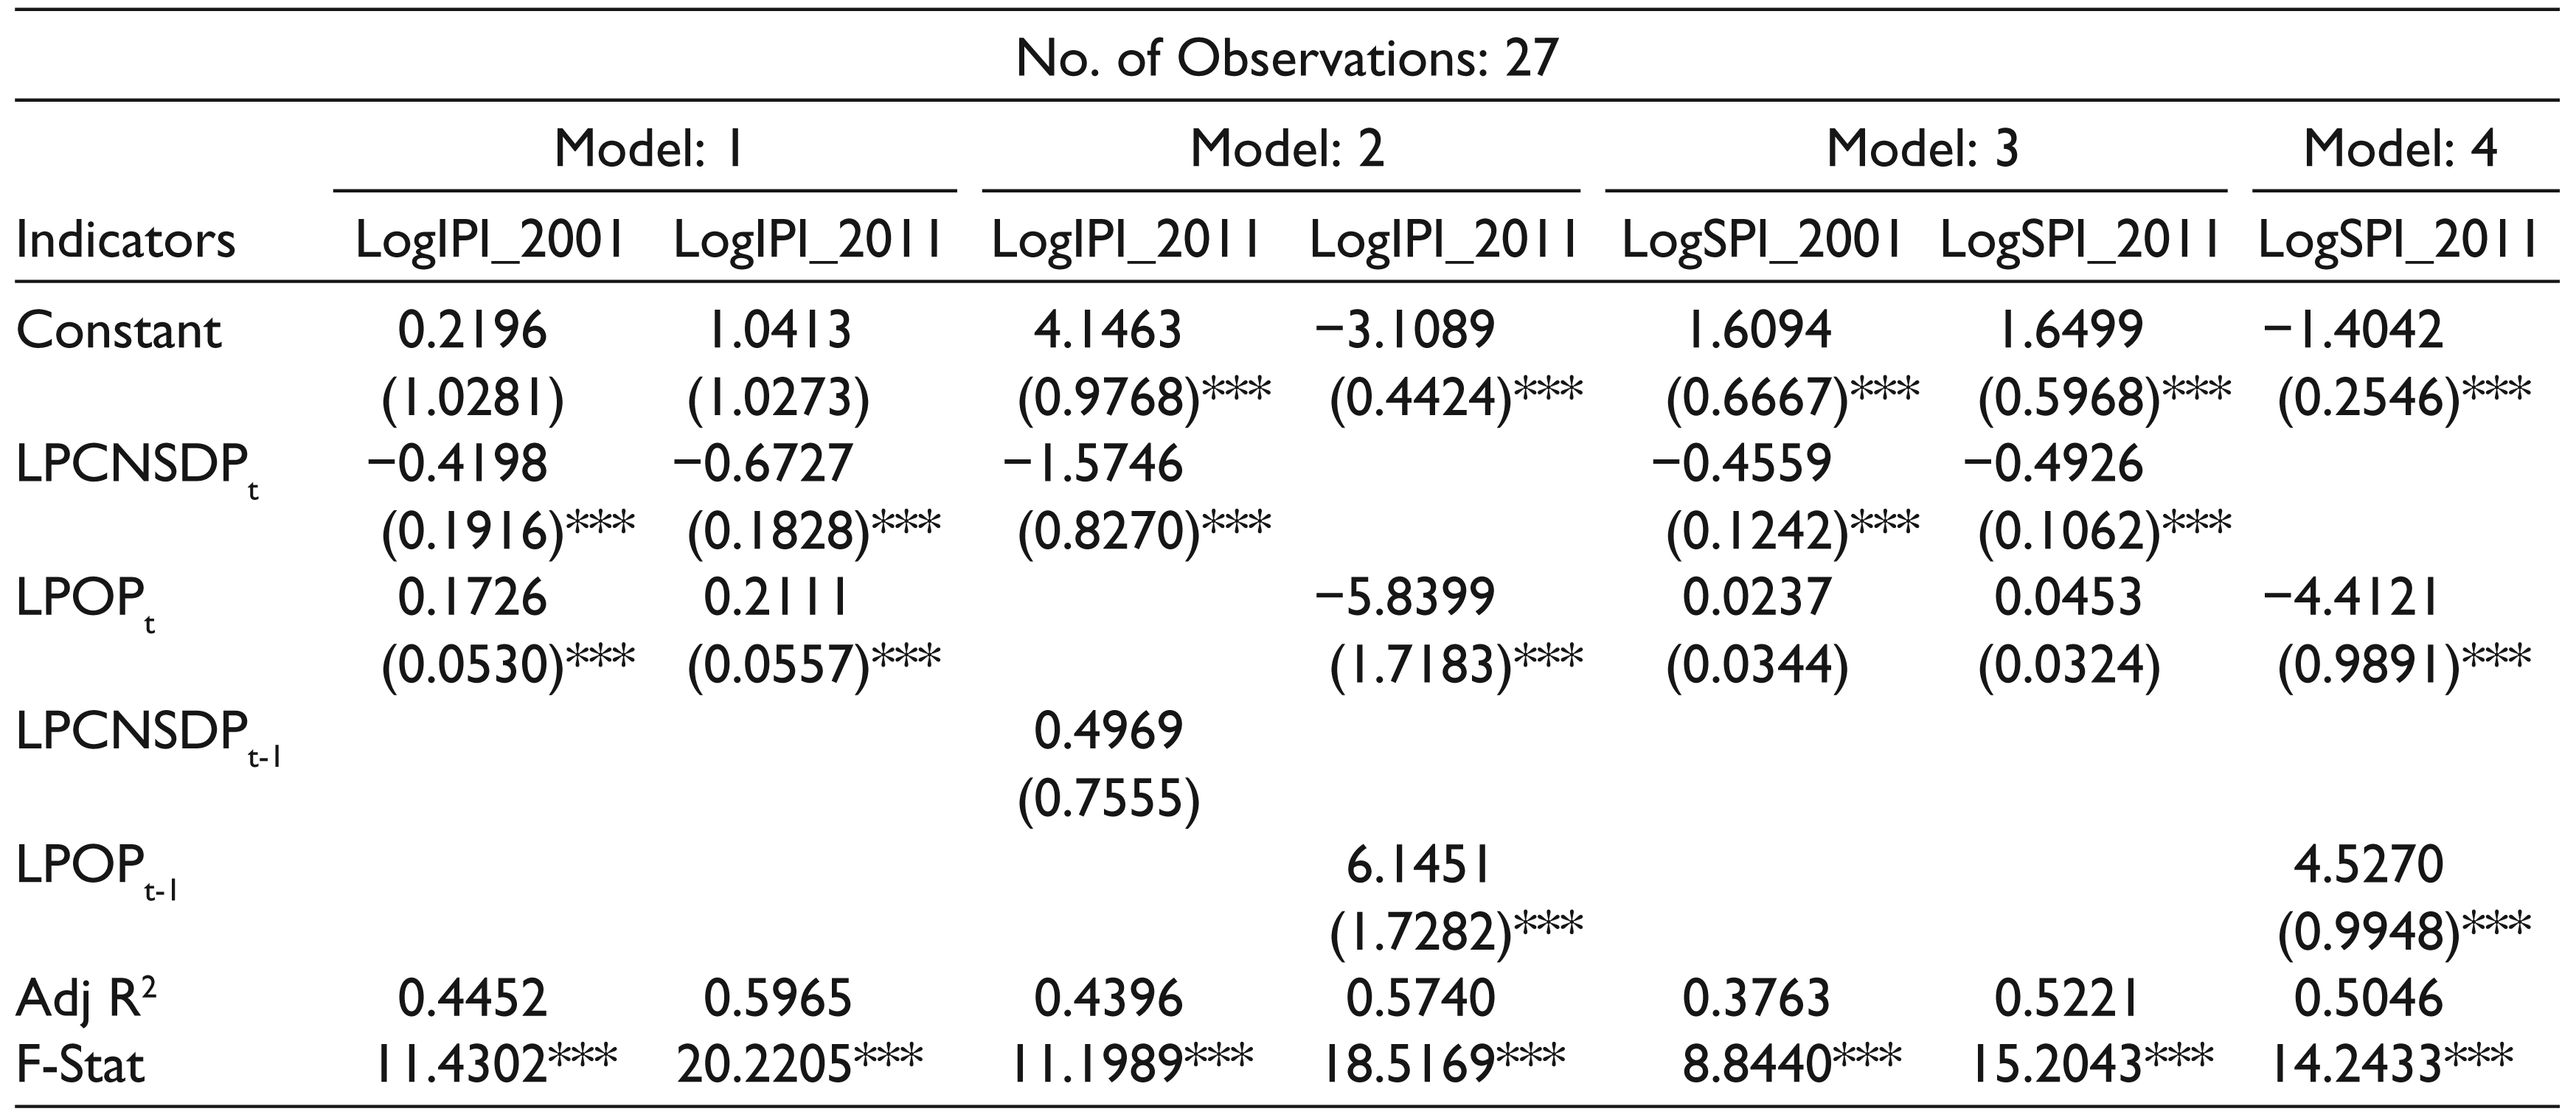
Application of growth elasticity estimates to non-monetary indices has also been tested. The seminal work, “Measuring Pro-poor Growth in Non-income Dimensions” (Grosse, Harttgen & Klasen, 2008) is one of the few studies on the growth–poverty relationship that extends the toolbox of pro-poor growth measurement to non-income dimensions and composite measures of well-being (using the HDI as a composite measure). Drawing on Bourguignon (2003), we use log difference values to re-estimate the relationship of dimensions with growth and population. Log difference of values was used to estimate elasticities. Hence, to extend the analysis, we computed elasticities of poverty, with respect to economic and population growth rates, and estimates are presented in Table 5.
Results of three models show the growth–population effect, lagged income effect and lagged population effect. In the first model, the growth and population effect in the tth is highly inelastic. The adjusted R 2 have improved across both the specifications. The coefficient of the growth elastic is negative indicating a 1 per cent rise in income can reduce IPI by 0.5 per cent. Incidentally, the population effect has a positive coefficient which is also significant at 1 per cent level, indicating that a 1 per cent rise in population can lead to a rise in IPI. Thus, growth–population effect seems to further make the reduction of IPI extremely sticky at lower levels.
Next, we tested for a semi-lagged model with t and t − 1 of the independent variables. Here, we find that
The last model looks at the specific impact on SPI as we found that EPI is more responsive to growth, while education and health poverty have not followed the same pattern. Even in this case, we find that growth effect on SPI is significant but inelastic for both the time periods. In the semi-lagged models, we find that population effect is very strong with highly elastic coefficients that are similar (t = 4.41 and t − 1 = 4.52).
OLS Results
Clearly low-income states with relatively low growth rates and high population growth have experienced dual disadvantage with respect to IPI reduction. Yet, states which have been able to accelerate the rate of economic growth have been able to address IPI partially, but have failed to sustain the reduction, as population growth rates remained constant/increased even in the 2000–2011 period.
One can argue that while the trickle-down effect of growth is more evident with respect to income poverty, education and health-related deprivation are determined by largely non-economic growth-related parameters. What is more disconcerting is that the PEP values are greater than GEP values in both the decades, indicating a higher population effect on SPI reduction rather than income effect. This can be partly explained with regard to scores of social poverty that were higher than that for income poverty indicating that social dimensions of poverty occupied a much greater share in the IPI. Moreover, decline in income poverty was faster than that for social poverty.
Thus, states with high population growth rate with unstable health indicators continue to grapple with IPI in general and SPI in particular even subsequently. However, states like Kerala and Tamil Nadu which completed the epidemiological transition would experience stable reduction in IPI. Tamil Nadu and Kerala managed to reduce income and social poverty simultaneously. High middle-income states such as Kerala, Himachal Pradesh, Punjab and Tamil Nadu performed well. The results could point to higher levels of income acting through higher public expenditure and effective implementation of policies leading to better outcomes in both income and social poverty spheres. Intuitively, one can construe that the reduction of fertility rates from the previous period provides the setting for reduction of poverty in the present period. Further, arguing from the capabilities lens, the population stability from the previous period would determine expansion of capabilities in the present period and thus reduction in IPI.
Summary and Policy Implications
The challenges to explain the presence of growth, inequality and impoverishment led to conceptualization of poverty measures that encompass both monetary and non-monetary indicators. At a time with the Sustainable Development Goals being designed across nations, strengthening of data systems to monitor social progress becomes equally critical. Given the complexity of measurement of poverty, this article constructs a simple yet comprehensive index. The Integrated Poverty Index (IPI) is a summary measure of poverty/deprivation measure that includes “poor” across economic, education and health/nutrition-related dimensions. Based on similar characteristics of the Human Development Index (HDI), the Integrated Poverty Index (IPI) is the geometric mean of normalized indices measuring deprivation in each dimension. The IPI was constructed for three time points in 1990s, 2000s and 2010s spanning two decades. However, data availability across all the variables makes it difficult to monitor and evaluate them continuously. Relying on microdata systems has been able to provide considerable clarity of multidimensional deprivation; yet, to streamline the evidence with policymaking, there has been an urgent need to strengthen macro-data sets.
The all-India average IPI estimates show a slow reduction from 0.447 in 1991, to 0.356 in 2000–2003 to 0.301 in 2009–2011. There are notable changes mainly in small states with middle per capita income. The composition of the reduction of IPI over the past three decades seems to be dominated by reduction of income poverty-related head count ratio. This too has not been evenly poised. With an exception of Himachal Pradesh, Goa, Sikkim and Kerala, the rate of reduction of income score has been the same or marginally better than the previous decade. In case of Social Poverty Index (SPI), education index and health index show differing paths of progress over time, with divergence increasing over time.
Growth–poverty linkage seems to be dwindling away, with the trickle down glaringly absent while evaluating reduction of non-income poverty. States with relatively low level of PCNSDP are also states with over 0.500–0.600 IPI. States like Uttar Pradesh, Bihar, Madhya Pradesh, Assam, West Bengal and Arunachal Pradesh belong to this category. Despite low PCNSDP states like Kerala and Manipur have comparatively low IPI values, high-income states do not show any particular pattern. Economic progress is no longer a guarantee of economic well-being.
Note that Gujarat, Maharashtra, Tamil Nadu and Haryana with much higher PCNSDP levels have not been able to reduce their IPI values in recent times, raising concerns of “IPI-trap” in high-income states. On the other hand, we find that low-income states (Bihar, Madhya Pradesh, Chhattisgarh, Orissa, Jharkhand and Uttar Pradesh) have been in the same level of IPI and PCNSDP, for the past two decades raising concerns of both growth-led and development-led initiatives in these states. Incidentally, Rajasthan and West Bengal seem to have reduced IPI to close to 0.400 and are in levels currently achieved by Karnataka and Andhra Pradesh.
IPI trap seems to be occur both due to income and population related determinants. The population effect is seen more evidently in States with higher population shares. Growth elasticity of poverty and population elasticity of poverty show clearly that low-income states with relatively low growth rates and high population growth have experienced a dual disadvantage with respect to IPI reduction. Yet, states which have been able to accelerate the rate of economic growth have been able to address IPI partially, but have failed to sustain the reduction, as population growth rates remained constant/increased even in the 2000–2011 period.
With emphasis on the strengthening of policy coherence, institutional restructuring to address complex forms of poverty, there is a need to recognize the importance of building synergies to secure sustainable capabilities expansion. Overall, the results indicate that the challenge lies not only in triggering growth and social progress in low-income states but also in accelerating the pace of poverty reduction in the low- and middle-income states which seem to be in a trap-like situation.
Footnotes
Acknowledgements
Article presented at the Indo-Swiss Joint Conference “Social Dynamics: Indian and Swiss Approaches” 9–10 September 2014, Bengaluru and at IAS Probationers’ Training, LBSNAA, 20 May 2016. The comments helped in further deepening the paper. We would like to thank Ms. Toral Gala, Research Associate for the assistance and patiently working through the various stages of revision. The gaps and errors are purely those of the authors. The usual disclaimers apply.