
Abstract
Scheduled Tribes form one of the most disadvantaged segments of the Indian population. The developmental interventions, including the constitutionally guaranteed affirmative action, have had limited success in bringing up the standards of living of these groups. This article focuses on a riverine tribe, the Misings, whose livelihood and developmental challenges are compounded by the recurrent floods and riverbank erosion. It is based on a study of developmental transition of this tribe inhabiting on the banks of the river Brahmaputra and its tributaries in upper Assam. It analyses socio-economic transition process among the tribe driven by the progressive forces of the spread of education and resulting occupational diversification. The levels of progress are found to vary depending on the degree of vulnerability of settlement locations—those bearing the brunt of recurrent floods and riverbank erosion are lagging behind in development attainments. To make the transition process more expeditious and inclusive, institutional strengthening for better delivery of basic services is suggested.
Introduction
The Scheduled Tribes (STs), constituting 8.6 per cent of the population of India as per the 2011 Census, is one of the most disadvantaged groups socio-economically. Despite special constitutional provisions to protect the interests of these tribes and various affirmative policies to uplift their socio-economic conditions, it is even officially acknowledged that the development interventions have had limited success in raising the levels of living (Planning Commission, 2011). Indeed the process of marginalization of tribes, as noted by Xaxa (2014), has continued unabated. There is a high concentration of tribal population in the northeast region of India. In the state of Assam, where the proportion of tribal population is the least among the states of the region, the STs constitute a sizable 12.44 per cent of the total population (Ministry of Tribal Affairs, 2013). The major STs communities living in Assam are the Boro-Kacharis, the Misings, the Karbis, the Sonowal Kacharis, the Rabhas, the Dimasa Kacharis, the Tiwas, the Garos and the Deoris (Registrar General of India, 2001). In contrast to most other tribes of the region—which are typically located in the hills, the foothills and the forested areas—the Misings and the Deoris of Assam inhabit mostly on the banks of the Brahmaputra and its tributaries in upper Assam. Accordingly, these tribes face additional livelihood and development difficulties arising from recurrent natural calamities of floods and riverbank erosion afflicting their habitats (Bordoloi, 1990). The particular developmental difficulties of these riverine tribes have received little attention in the available literature. This study of developmental transition among the Misings 1 was motivated by the need to fill this gap in the literature.
Development transition here has been broadly conceived as the process of socio-economic advancement observable in terms of improvements in the usual indicators of human development. Following its initiation in the UNDP Human Development Report of 1990 and its further refinements and adaptations subsequently, the Human Development Index (HDI) has gained increasing acceptance as a more holistic measure of human well-being than the single dimensional gross domestic product (GDP) per capita. Studies interested in the living conditions of the tribes, indigenous people and other marginalized sections now frequently use human development markers for assessing their progress in the path of development (Cooke, Mitrou, Lawrence, Guimond, & Beavon, 2007; Hall, Layton, & Shapiro, 2006; Ministry of Tribal Affairs, 2005). The present study goes beyond the advancements in aggregate markers such as literacy rate and looks into the living conditions, consumption patterns and occupational profile of the Misings to explore further traces of developmental transition in the tribe. The specific objectives of the study were the following:
To capture the socio-economic progress of the Misings in Assam and compare the attainment levels in key developmental indicators with those of the STs, in general, and the overall population of the state of Assam. To examine whether the living standards and occupational pattern of the Misings tend to vary with socio-geographical variations of their habitats and, if so, understand what the contributing factors are. The underlying interest in pursuing this objective is to see if (a) ravages of recurrent floods and riverbank erosion have restricted the scope for upward occupational mobility and (b) exposure to ways of life of other communities has had any impact on the lives and practices of the Misings. To examine the efficacy of the special institutions for the delivery of programmes meant for socio-economic uplift of the Misings.
Demographic and socio-economic changes among the Misings in the Brahmaputra valley have been captured from the trends in key demographic and socio-economic parameters such as sex ratio, literacy rate, work force participation rate and occupational pattern shifts in the successive Censuses since 1971. The progress of the Misings in these areas has been juxtaposed with those of all tribes and the overall population of the state of Assam to see whether the attainment levels of the Misings have tended to converge with those of the tribal population and also the overall population of the state. For fulfilling the second and third objectives, a field study was conducted in 2013 in three districts of the upper Brahmaputra Valley with significant concentration of the Misings population. From each district, three villages were selected on the consideration of representing the three broad types of habitats of the Misings population, namely, the chronically flood- and riverbank erosion-affected habitats, moderately flood-affected habitats and habitats with mixed population of the Misings households, and households belonging to other communities. The details of the sampling procedure have been laid out in the Appendix.
In the field investigation, data have been collected mainly at two levels—village level and household level. For the household leg of the survey, about 10 per cent of the Misings households from the 9 sample villages were selected at random. The households sample thus selected consisted of 227 units. A structured questionnaire was used to gather information reflecting the living condition, socio-economic status and occupational patterns of the sample households.
The article has been organized in six sections. The second section, based on the analysis of the Census data from 1971 to 2011, is an attempt to capture the attainments of the Misings in terms of usual developmental indicators. The third section, based on field study, is an attempt to capture the living standards and consumption patterns of the sample households in the three different geographical conditions of habitats of the Misings people. The fourth section examines the diversity in the occupational profile of the sample households and attempts to explain the occupational variations in households in terms of socio-economic and geographical factors. The efficacy of institutional arrangements for socio-economic uplift of the tribe has been discussed in the fifth section. The concluding section summarizes the broad findings and brings out the policy implications thereof.
Relative Developmental Attainments of the Misings
In this section, using the Census data, progress of the Misings tribe in terms of a few development indicators in comparison with other tribes and overall population of Assam over the period of 1971 to 2011 has been described. Limitation of the data set forced us to confine the analysis to only a few parameters of socio-economic development over time.
Sex Ratio
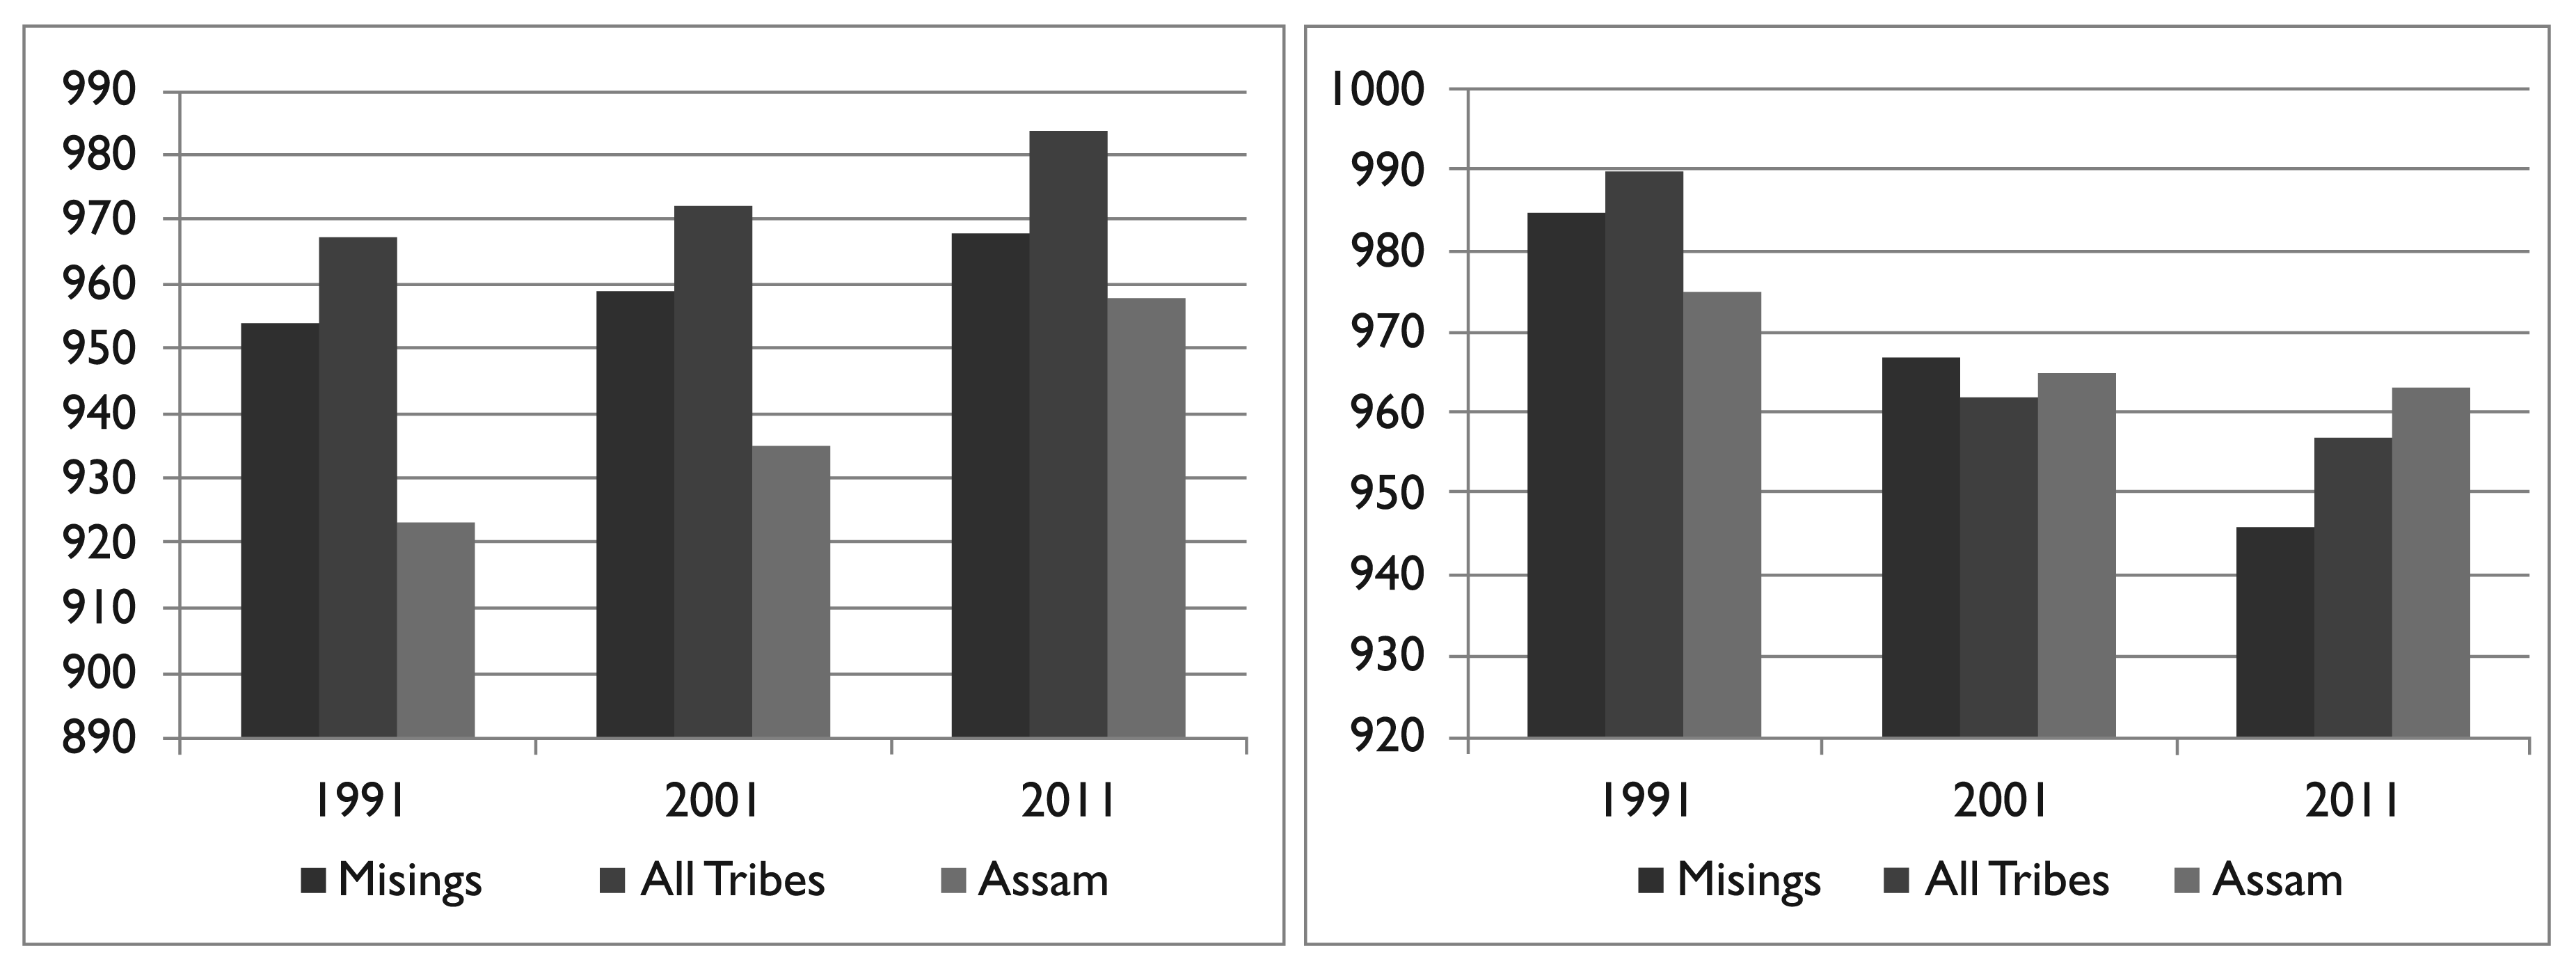
Sex ratio among the Misings has been higher than the ratio for the entire state of Assam, though it has been lower than that for all the tribes of the state taken together. Over the three decades from 1991 to 2011, there has been a steady improvement in the overall sex ratio among the Misings as also among the others in the state (refer Panel a of Figure 1). However, the child sex ratio has registered a decline in the state during the same period and the decline has been the sharpest for the Misings (refer Panel b of Figure 1). This seems to be a serious concern that calls for both research and policy attention.
Literacy
Another crucial parameter to understand the socio-economic progress of any section of the population is its literacy rate. Highlighting the importance of education, India Human Development Report 2011 pointed out that among the different parameters of educational attainments, literacy is the most fundamental, as it paves the way for further learning and training (Planning Commission, 2011). Figures 2, 3 and 4 portray the changes in literacy rates among the Misings, all STs and the overall population of Assam separately for persons, males and females, respectively. The literacy rate for persons has improved significantly for all the three entities over the four decades from 1971 to 2011. To begin with, the Misings lagged substantially behind the others in 1971. But over the next 40 years, the Misings has caught up impressively with the rest of the people of Assam. Figure 2 clearly portrays the convergence of the Misings with the whole state of Assam in terms of literacy rate.
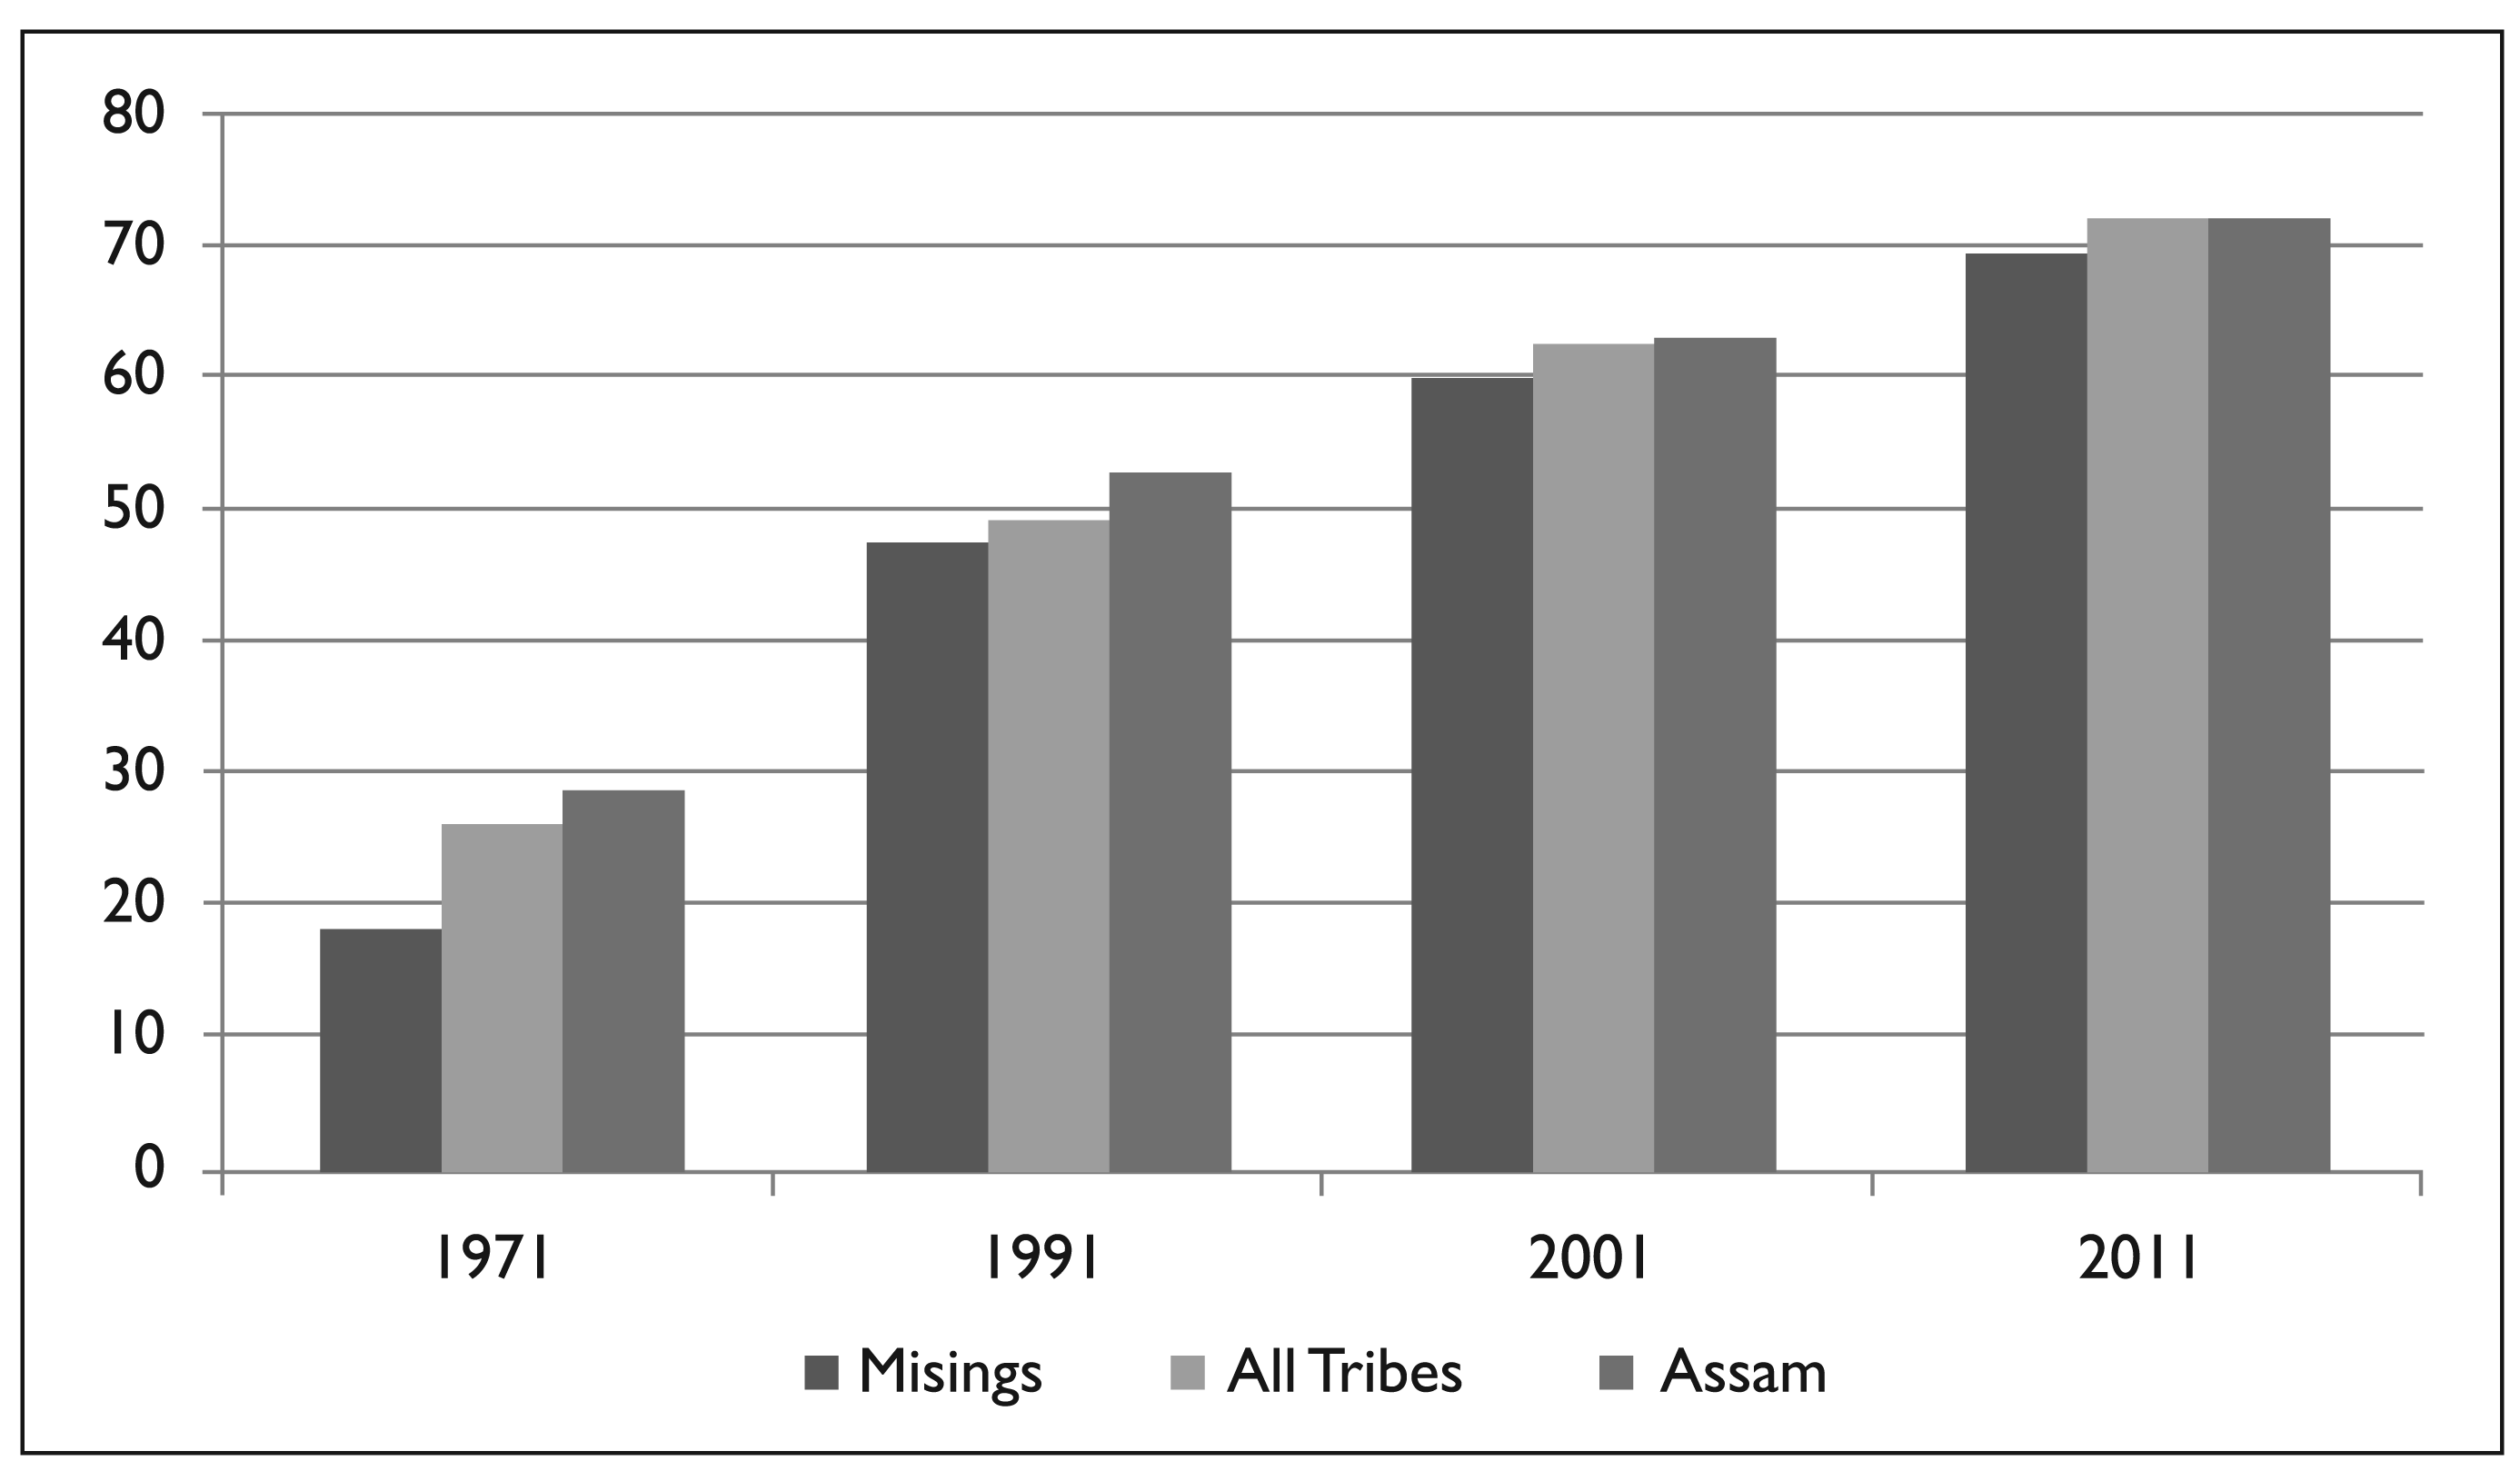
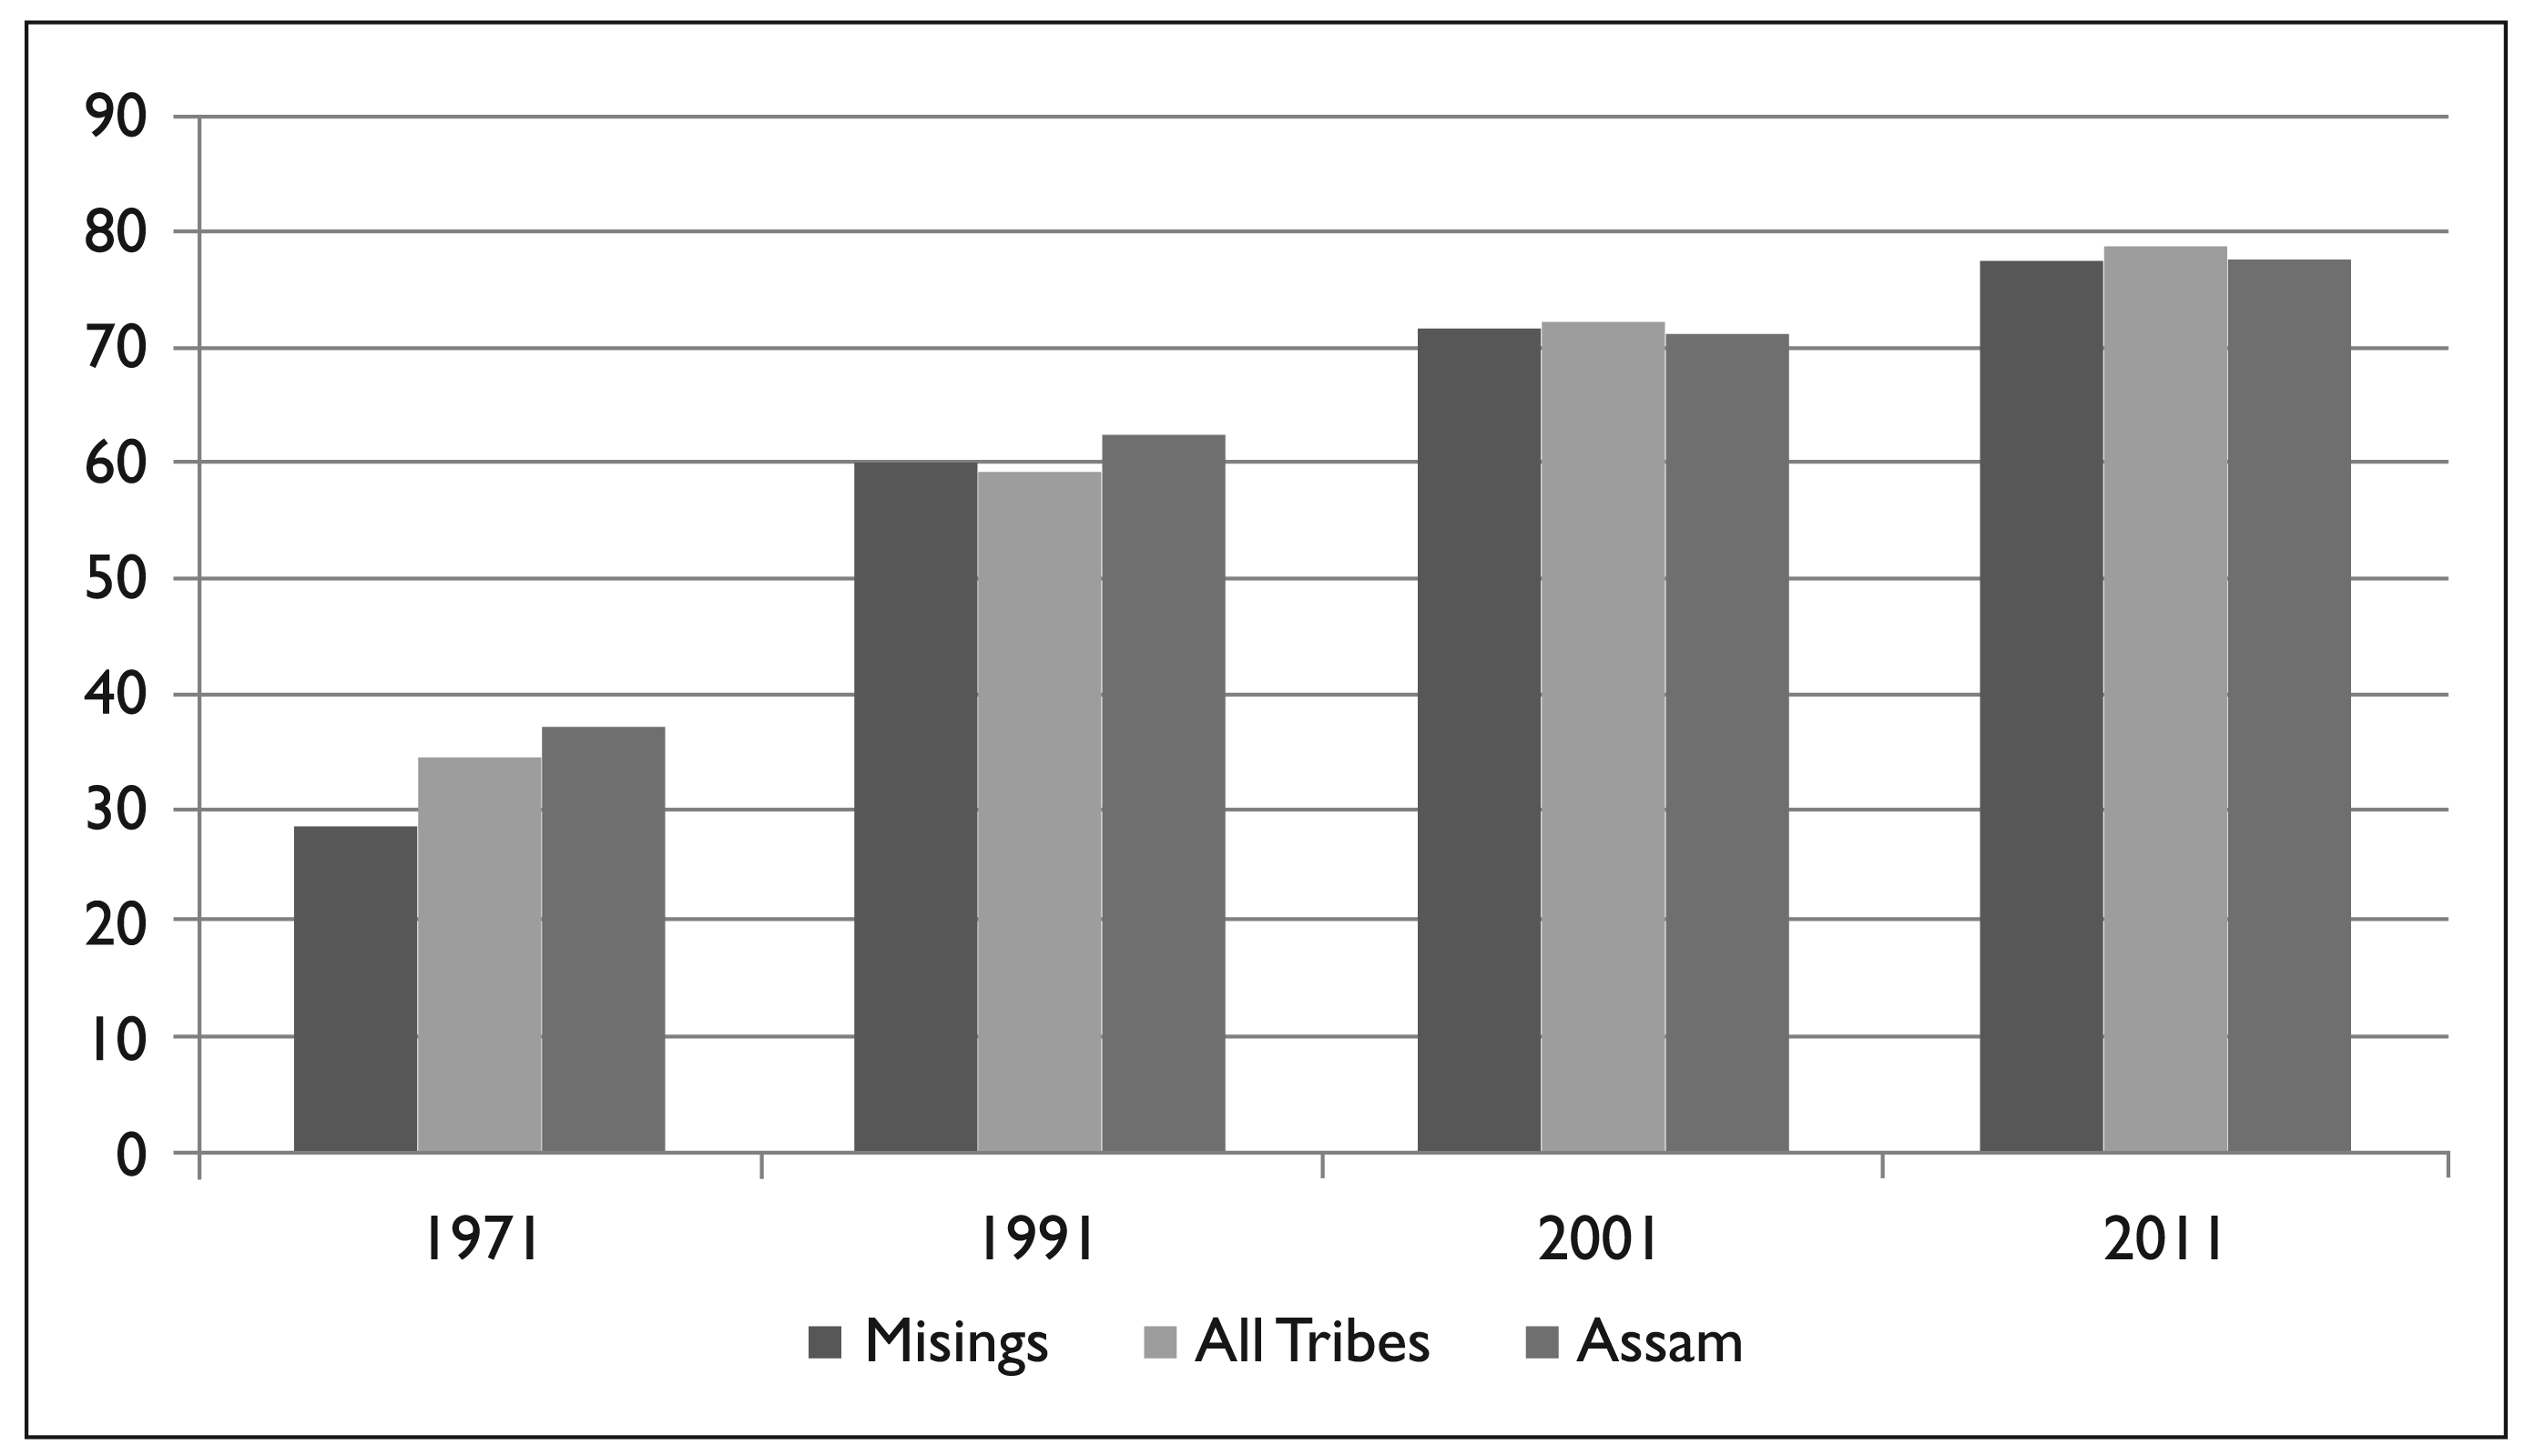
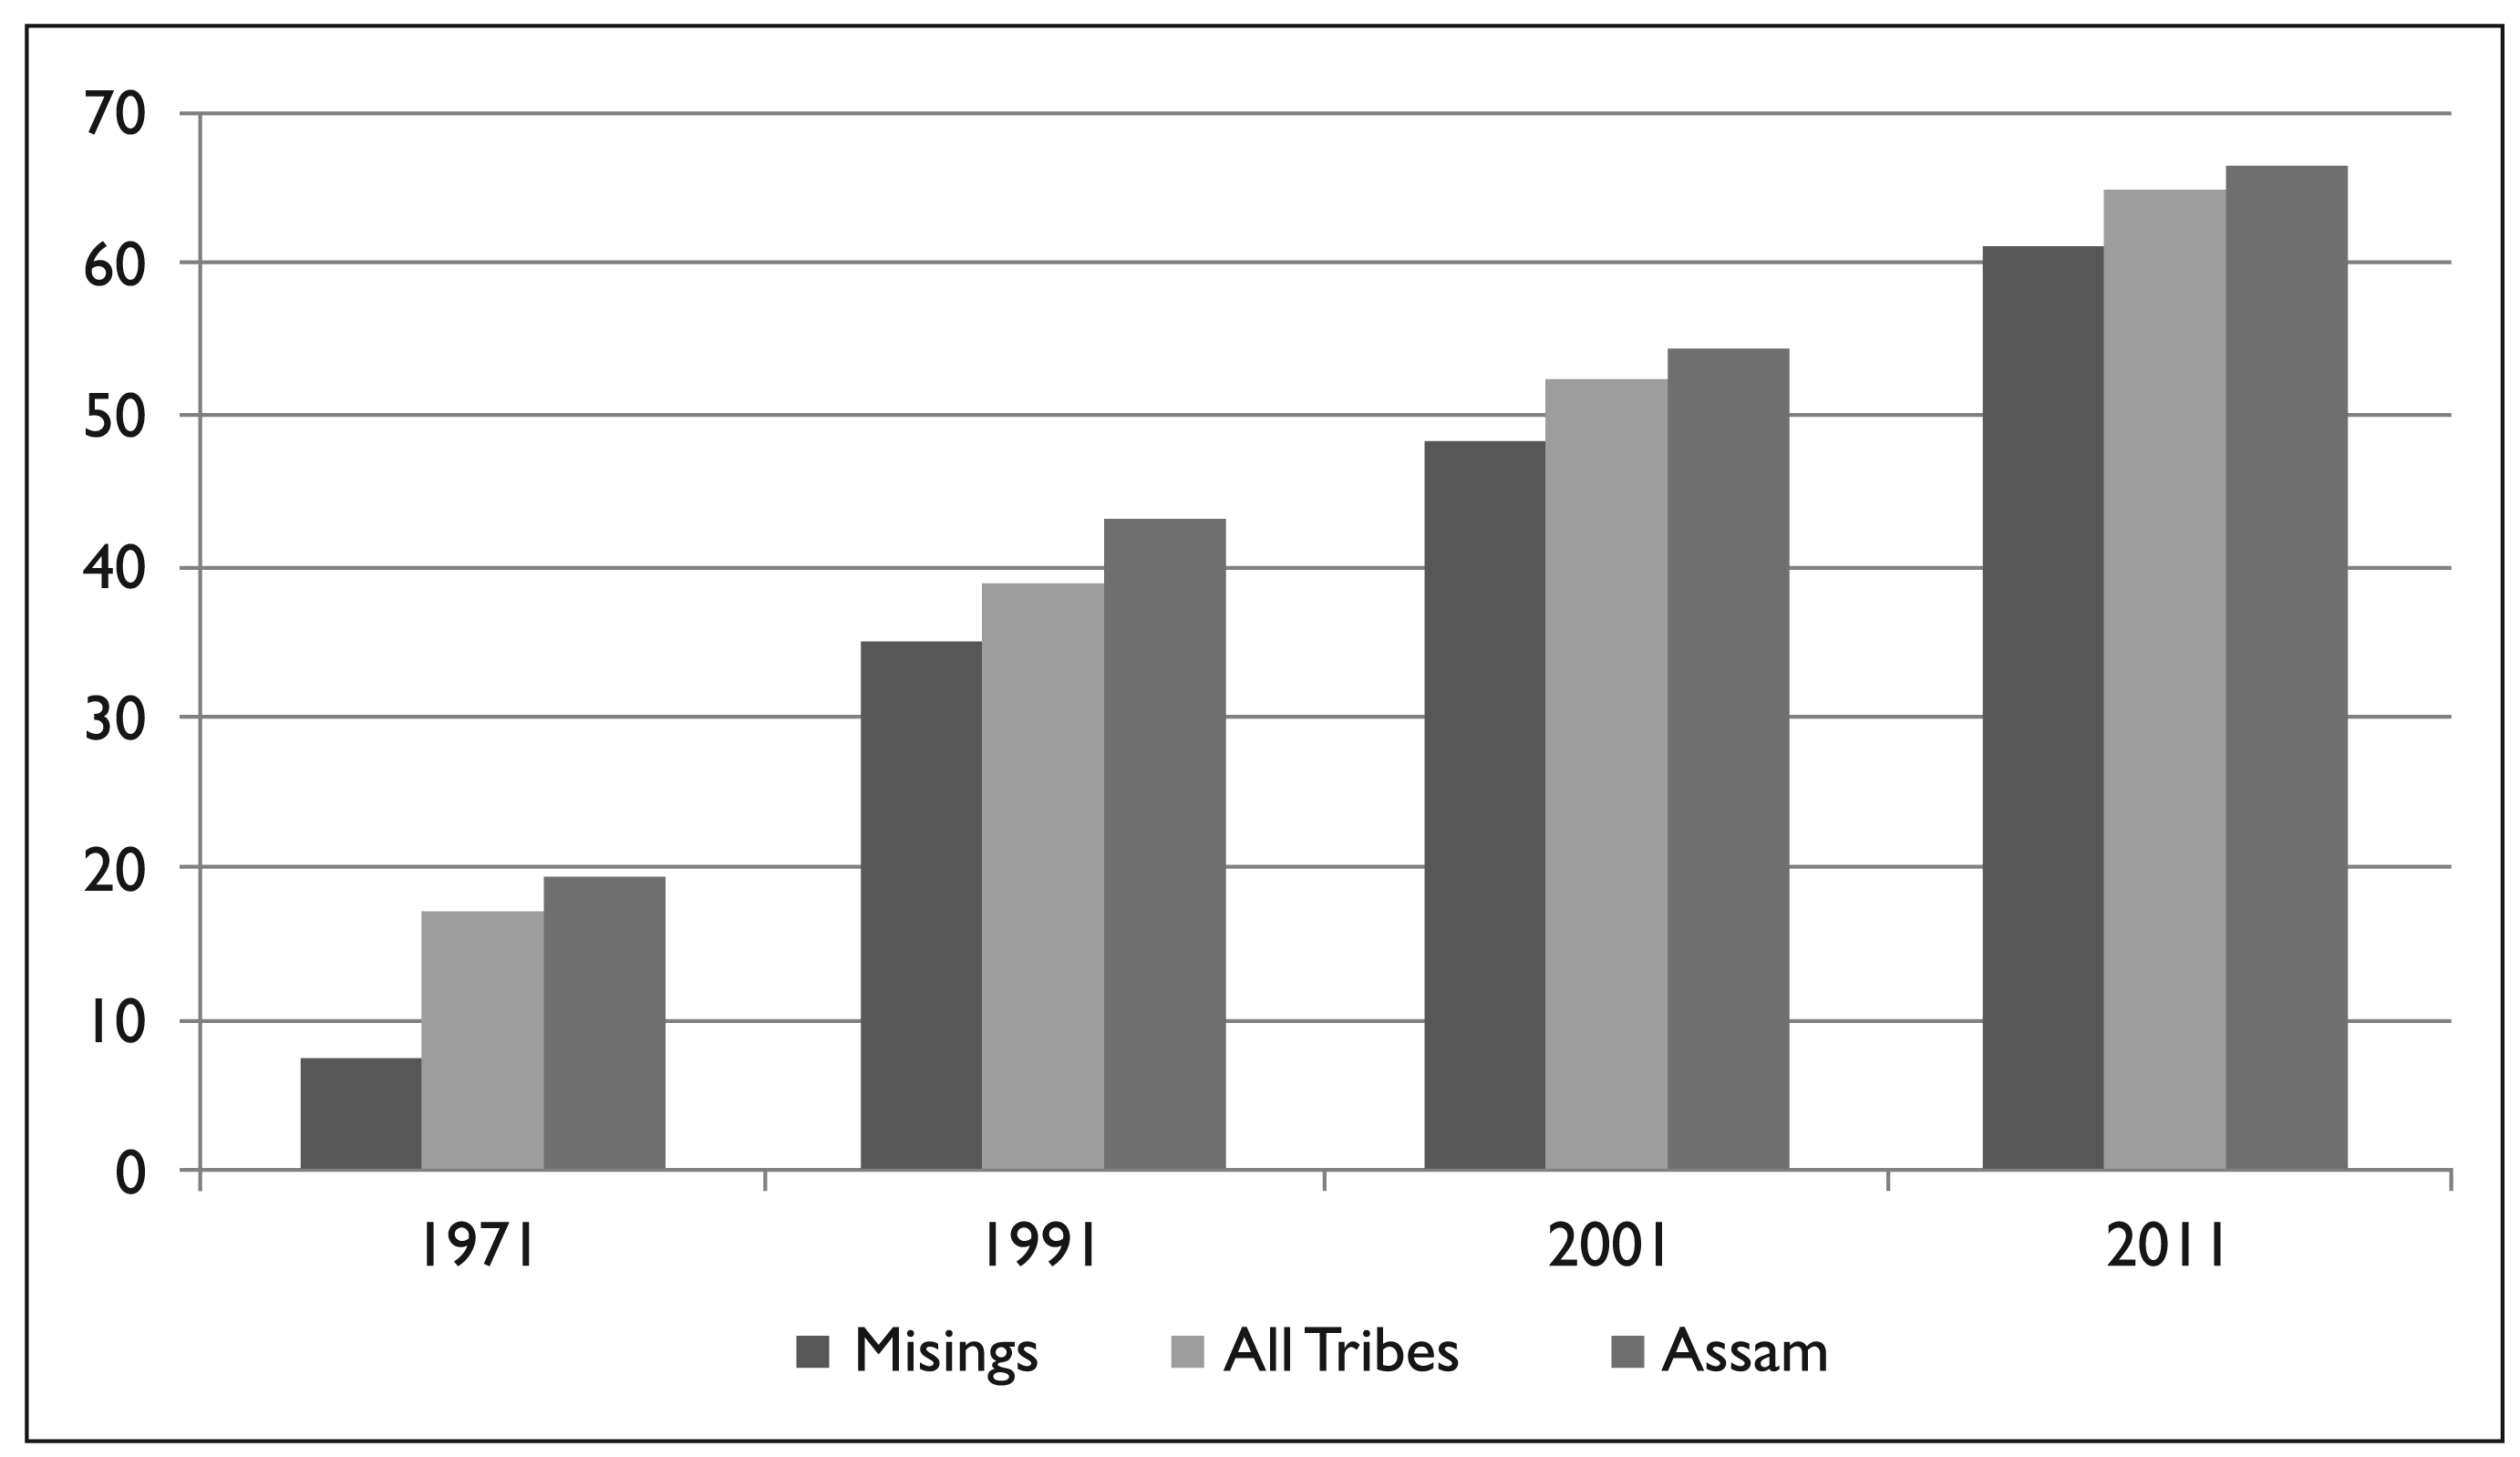
The increasing trend in literacy has been recorded for both males and females of the tribe. In 1971, the male literacy rate was only 28.5 per cent which improved considerably to 77.2 per cent by 2011. The female literacy rate was even more abysmal at barely 7.5 per cent, but went up to 60.9 per cent by 2011. The male–female gap in literacy has tended to narrow down over the years, though the females still have some catch up to do.
Work Force Participation and Occupational Distribution
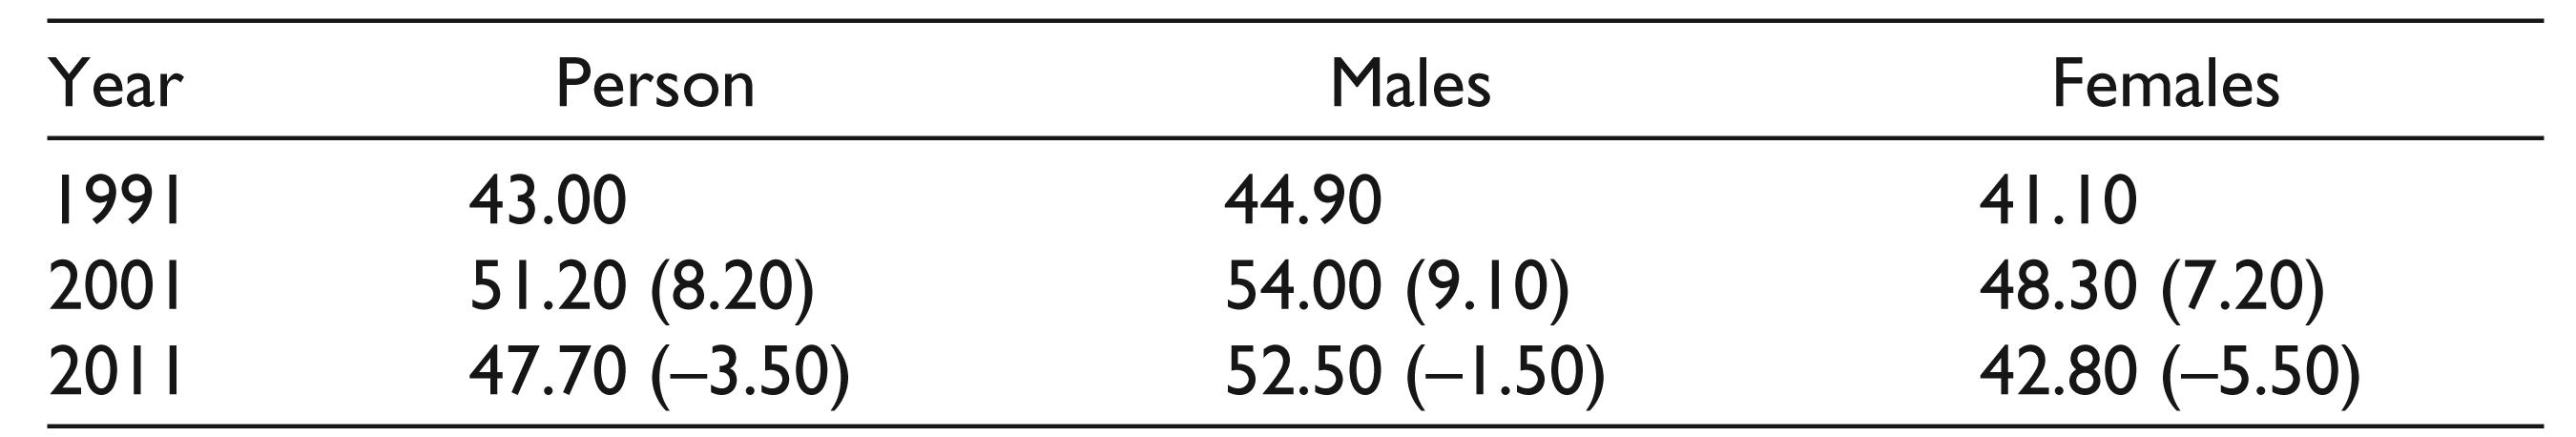
Table 1 presents the trend in workforce participation among the Misings over the span of last 30 years. The workforce participation rate had gone up for both males and females during the decade of 1991 to 2001 and then declined during 2001 to 2011. Whether the increase/decrease is a sign of progress is difficult to fathom from the aggregated data. The overall decline may arise from increase in the enrolment at the secondary and tertiary levels. Vepa (2012) and Mehrotra et al. (2013) pointed out that the decline in female workforce may happen partly due to the withdrawal of women from work outside homes, which earlier used to take place out of distress or economic compulsion. Sometimes, economic hardship of a family forces women to work for extra earnings. With improvement in the economic condition, their compulsion to work may slowly be receding. Thus, some women may stop working and concentrate on households and domestic responsibility. To the extent these are the probable contributing factors to the recent decline in the workforce participation, the decline may be a reflection of the economic progress of the tribe.
Work Force Participation Rate (in percentage) among the Misings in Assam
In this context, it may be instructive to look into the occupational distribution of the workforce for tracing if there have been occupational shift resulting from and contributing to socio-economic uplift of the tribe.
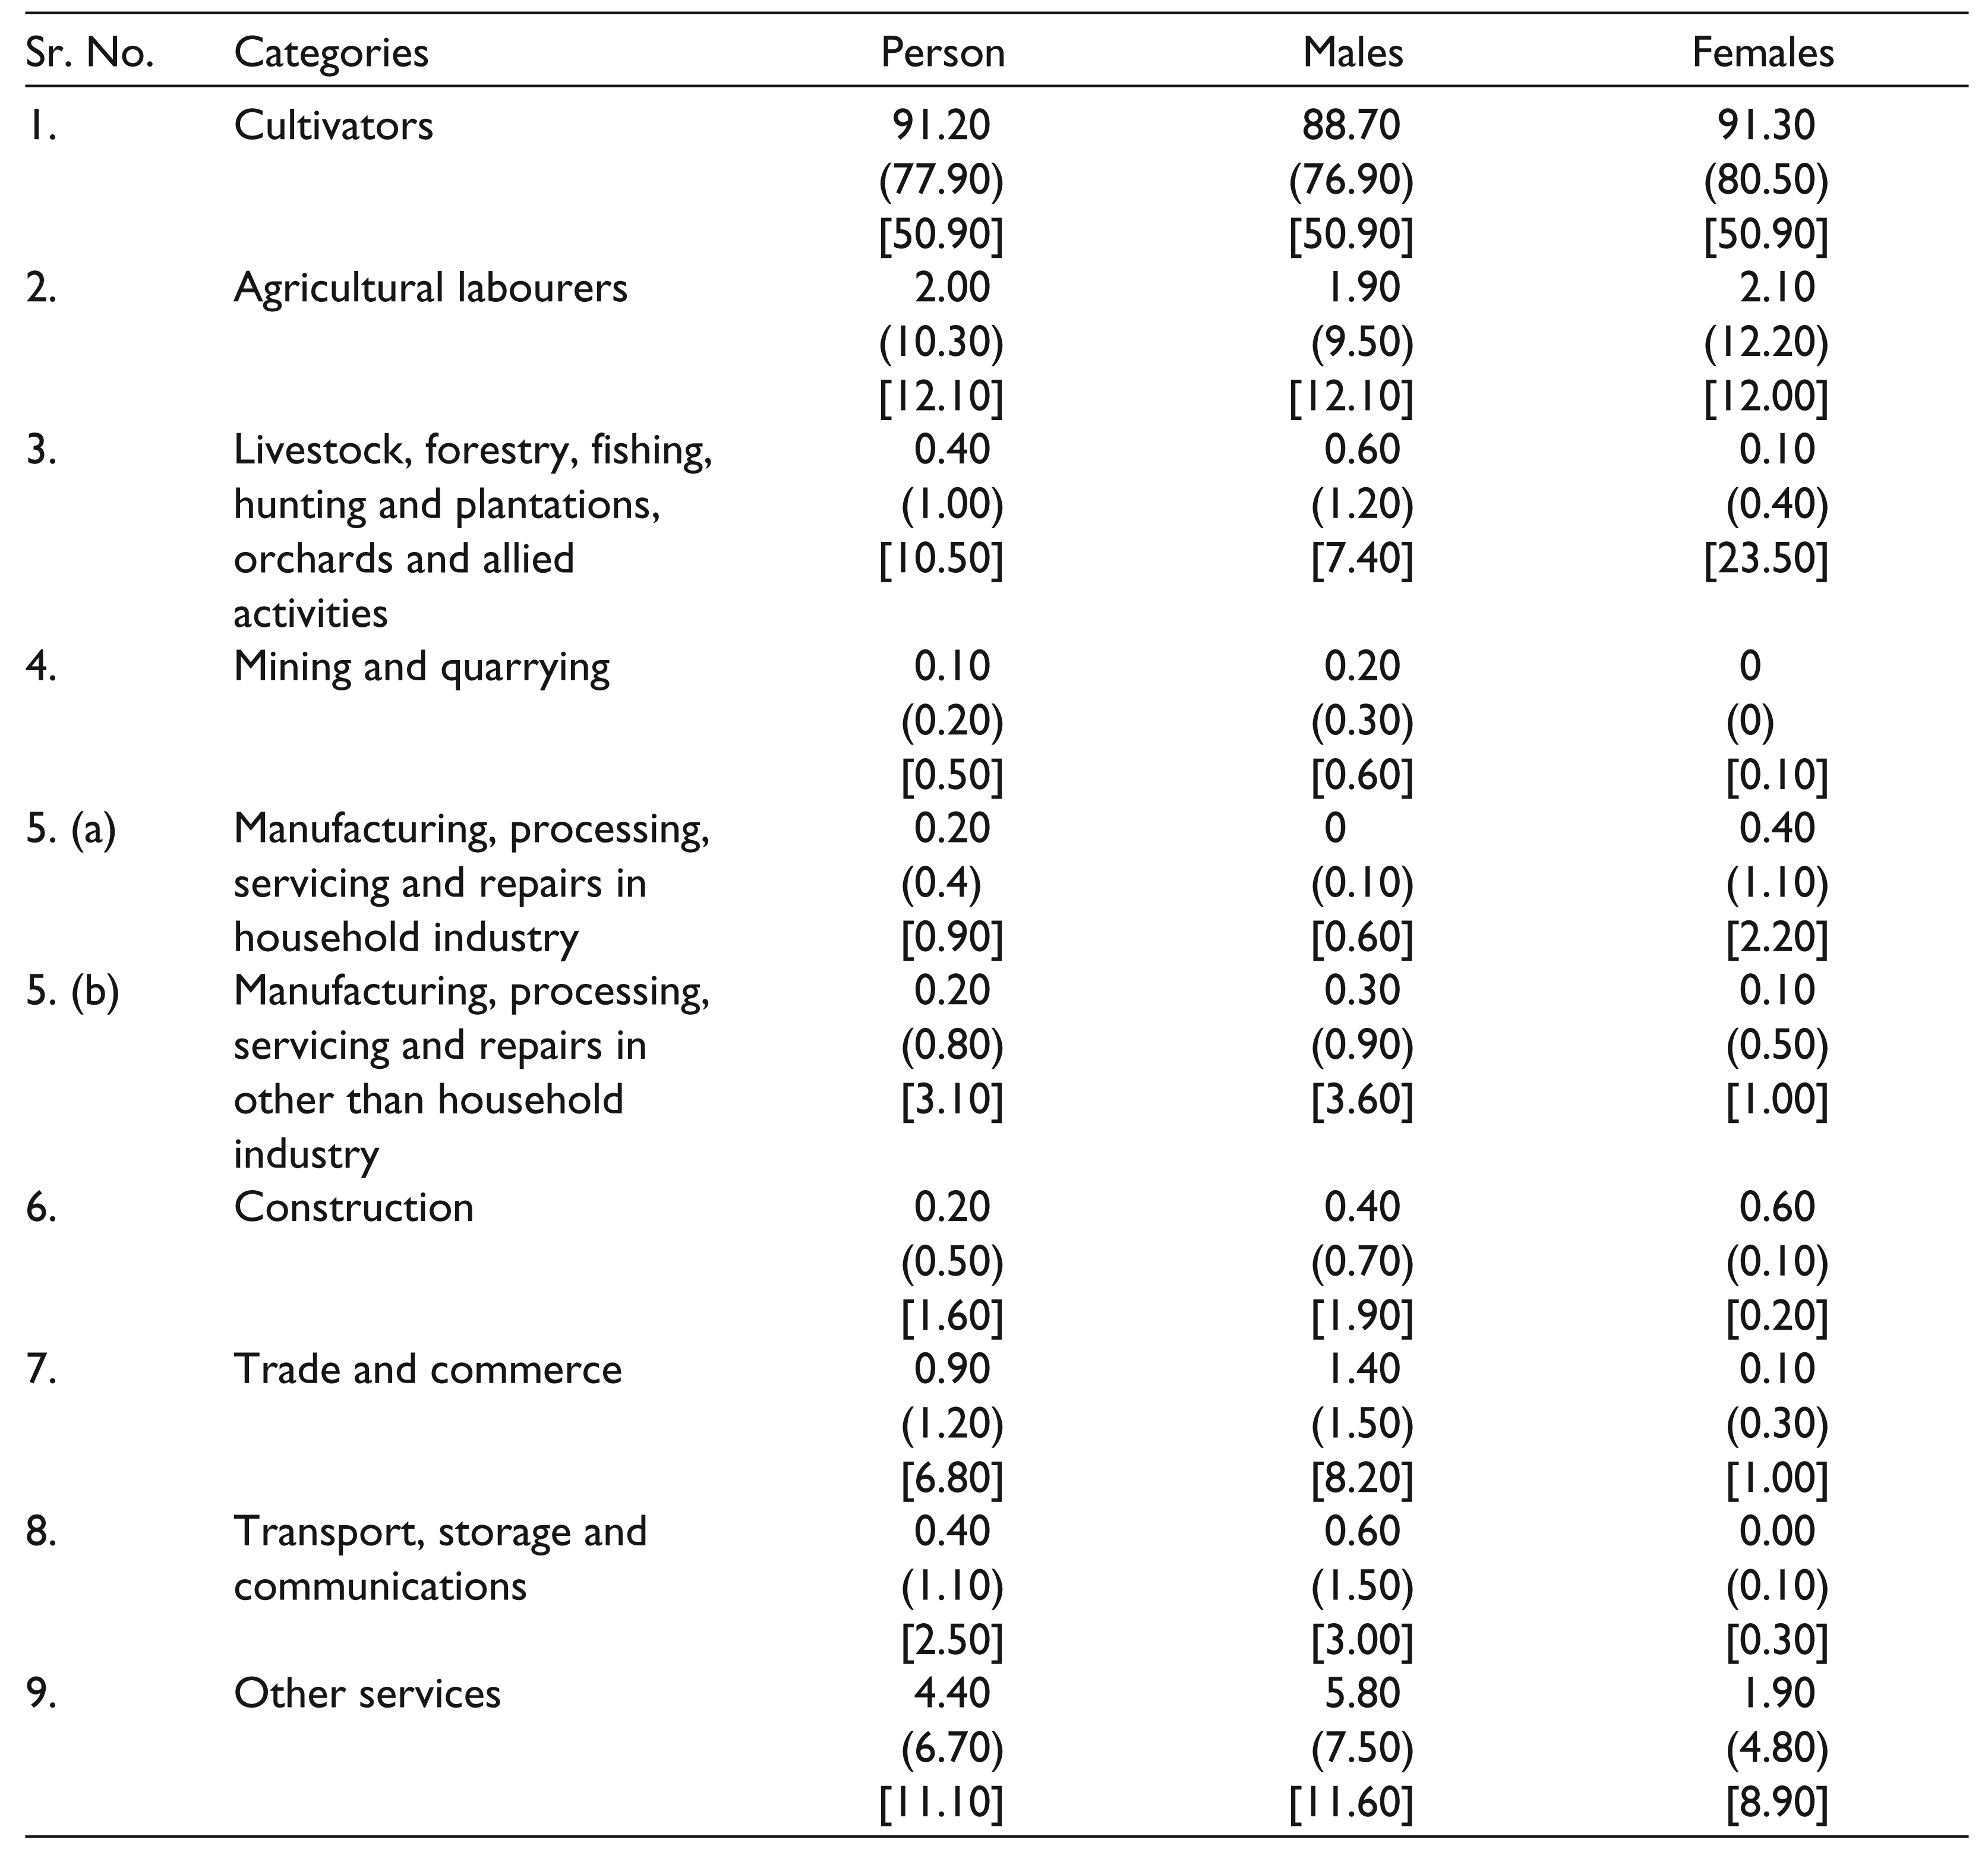
Occupational distribution of main workers of the Misings presented in Tables 2 and 3 2 reveal that cultivation continues to be the dominant occupation among the tribe members.
Occupational Distribution of Main Workers (in percentage) among the Misings in Assam in 1991
Occupational Distribution of Main Workers (in percentage) among the Misings and All Scheduled Tribes in Assam in 2001 and 2011
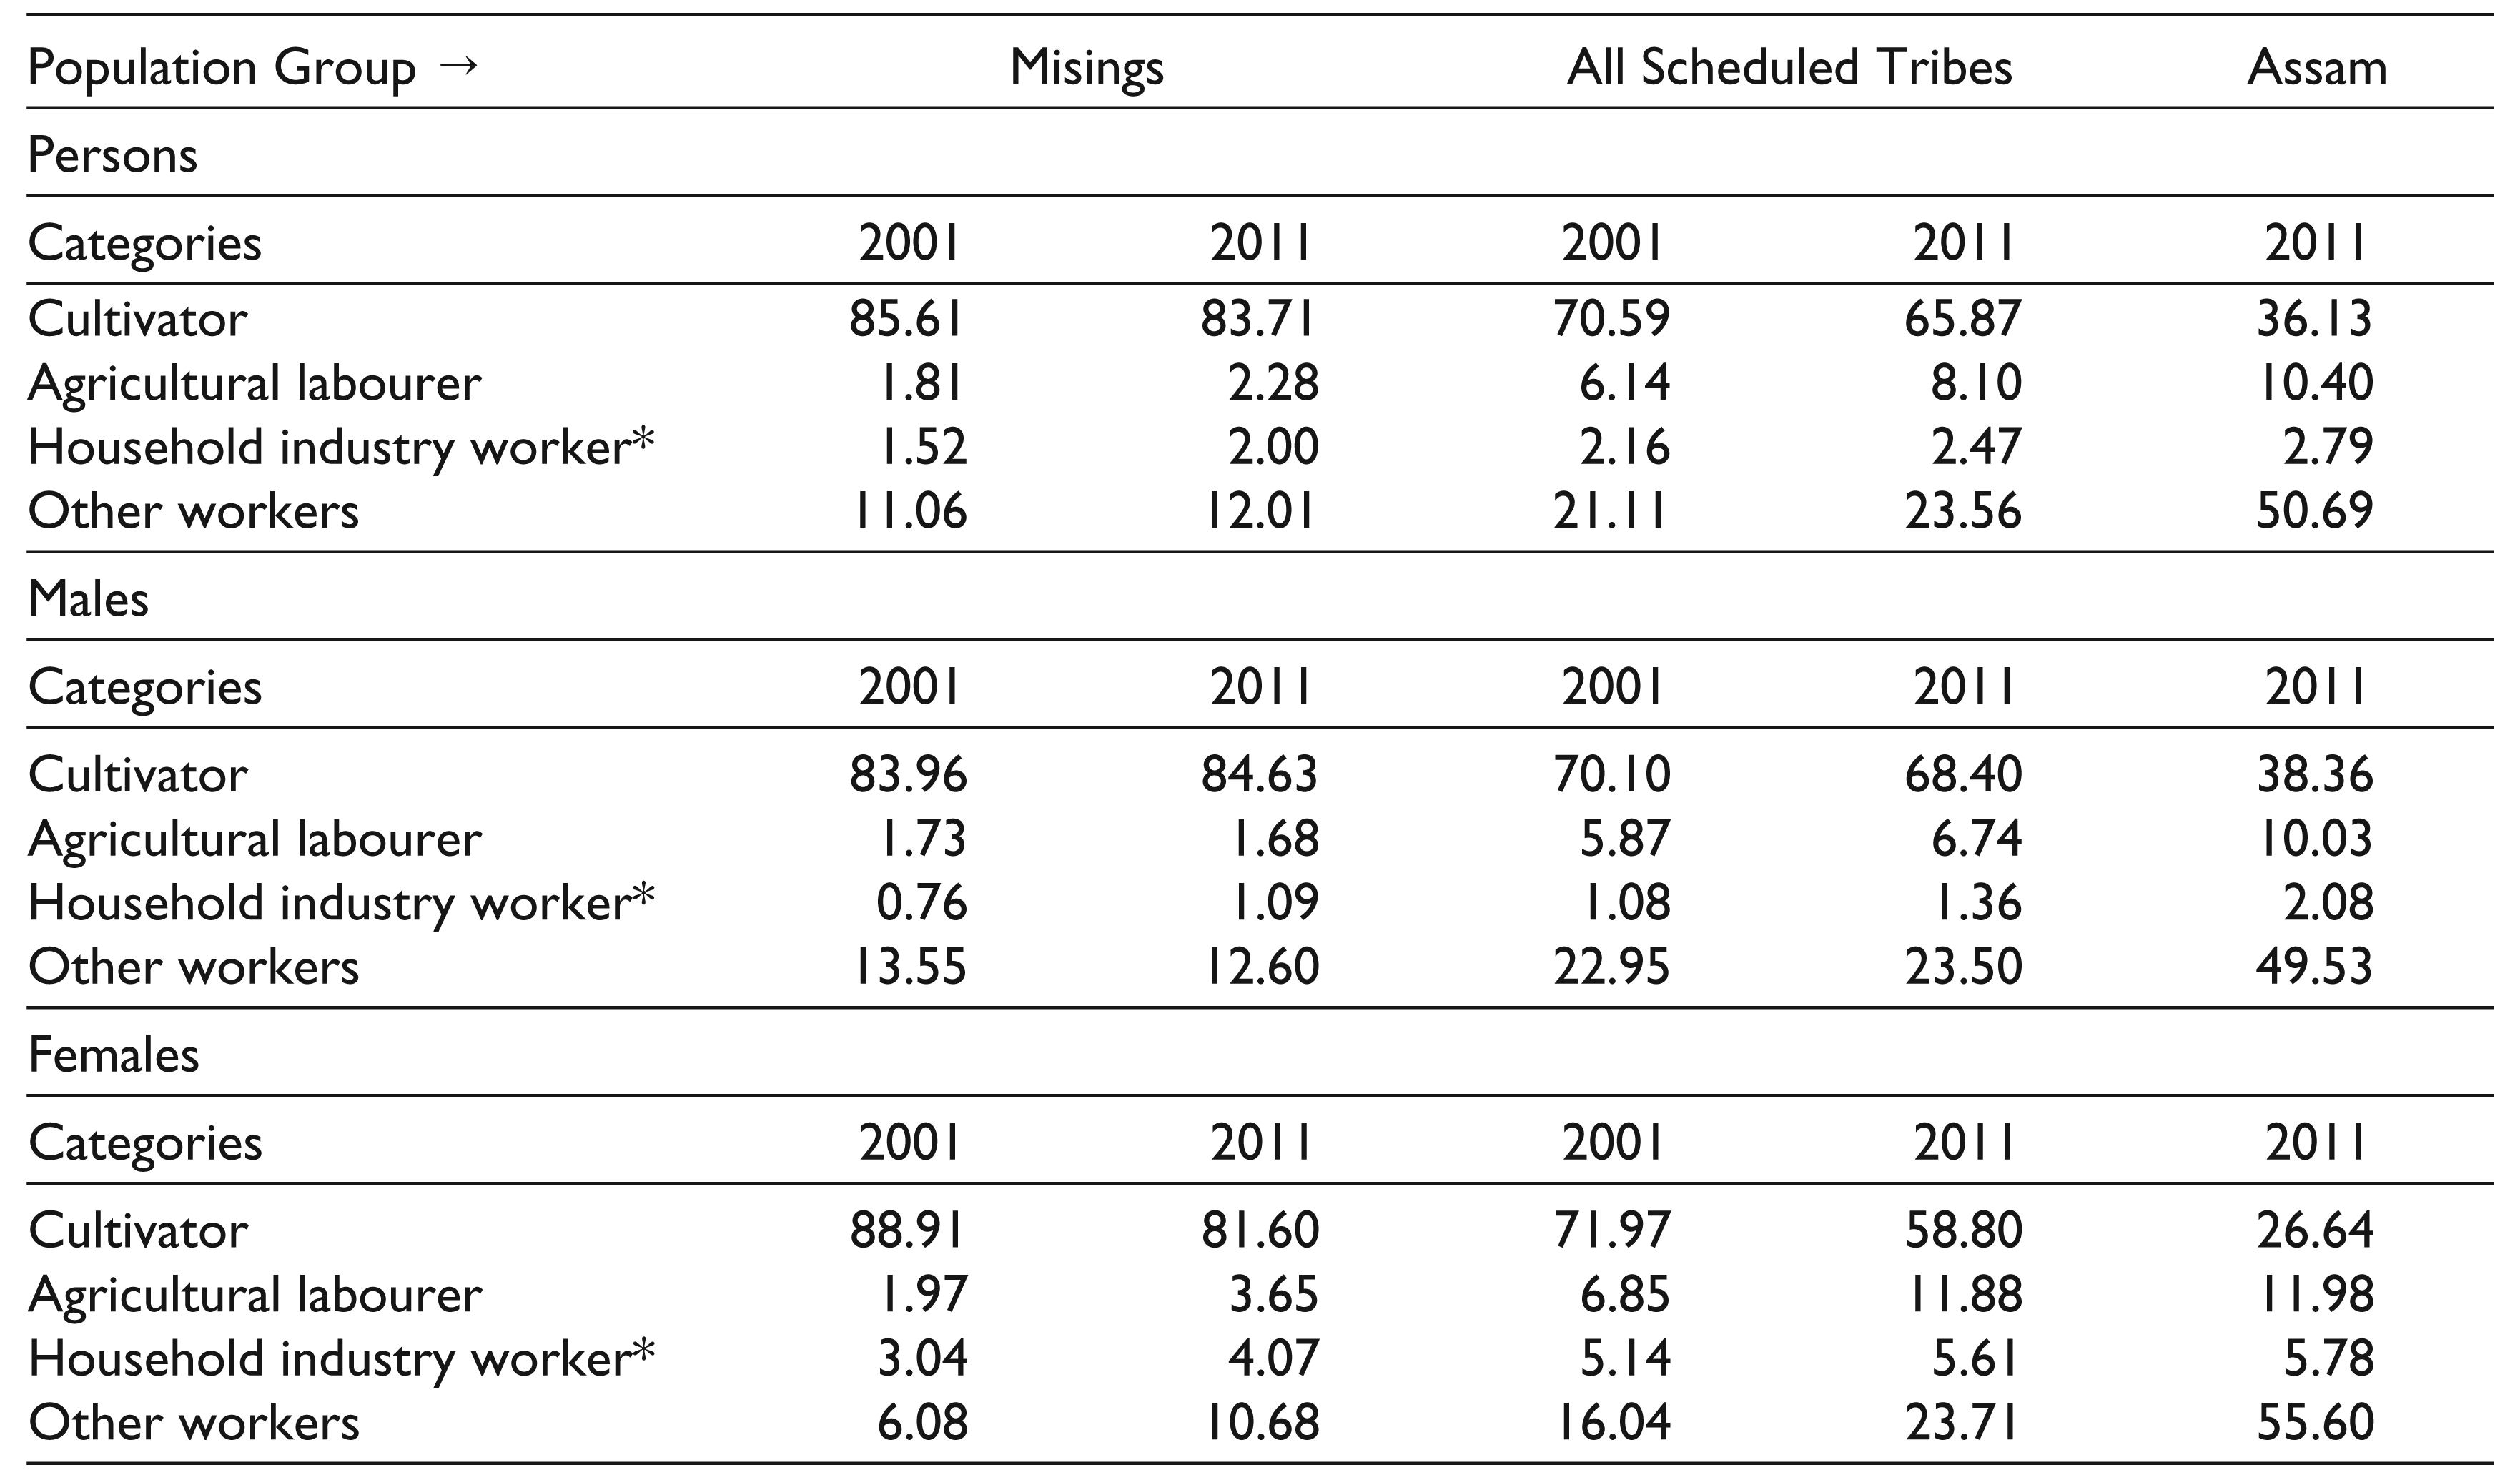
The percentage of cultivators in the Misings workforce, however, declined somewhat during 2001 to 2011, though the decline was sharper for all STs of the state compared to that for the Misings. The decline in the percentage of cultivators has not been fully compensated by increase in the share of agricultural labourers. Consequently, there is some increase in the percentage of workers in the non-farm occupation, indicating that a process of occupation shift is underway among the Misings too.
Living Conditions, Health and Education among the Misings: Evidence from Primary Field Study
Living conditions, health status and educational attainments of the Misings population inferred from patterns observed in the sample households have been outlined in this section. Further, here we explore whether and to what extent the living conditions and developmental attainments differ across the three categories of villages, namely, as detailed earlier, the chronically flood- and erosion-affected habitats, moderately flood-affected habitats and habitats with mixed population.
Dwelling Condition
India Human Development Report 2011 regards the condition of dwelling as one of the key indicators of socio-economic well-being (Planning Commission, 2011). The data on the quality of shelter gathered in the sample survey of the present study shows that most of the dwellings are traditional type, locally known as “Chang Ghar.” This traditional house type is characterized by the raised stilt wherein there is considerable gap between the floor of the house and the ground to cope with floods. Data collected through sample survey shows that 86 per cent households’ dwellings are traditional type. In the chronically flood- and erosion-affected villages, these traditional dwellings constitute 98 per cent of sample households. Only a small fraction of households were seen to have Assam-type kutcha and Assam-type pucca dwellings as well.
Sanitation
Sanitation is another basic necessity for a hygienic and healthy life. Data gathered through sample survey tells the dismal state of nearly 60 per cent of the sample households not having any toilet facility. Only about 7 per cent of the sample households reported to have sanitary toilets and another 34 per cent only kutcha toilets.
Practice of open defecation is more extensive in the chronically flood- and erosion-affected villages compared to other two categories of villages. More than 81 per cent of the sample households in those villages practice open-field defecation.
Energy Source
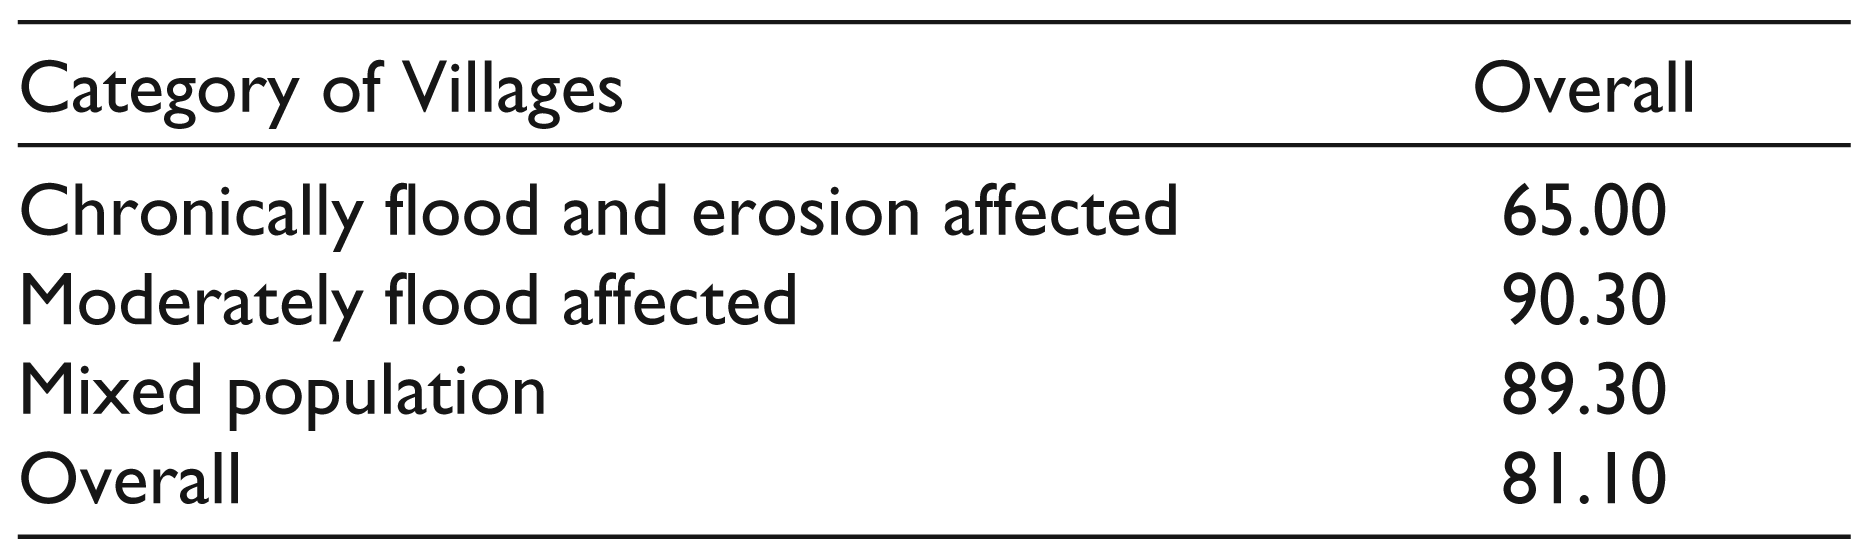
Though a majority of the sample households have electricity connection for lighting, the villages in the chronically flood-affected zones lag behind the others in terms of electrification coverage (refer Table 4). While about 90 per cent of the households in moderately flood-prone and mixed population villages are electrified, only 65 per cent households in the chronically flood- and erosion-affected villages were found having electric connection. In terms of cooking fuel, use of commercial source like LPG is very limited among sample households. Nearly 90 per cent of the sampled households in all three districts and across village categories use firewood as cooking energy. Only 3 per cent households use LPG cooking fuel.
Percentage of Sample Households with Electricity
Pattern of Consumption Expenditure
As Mitra (2004) points out, the pattern of consumption of people indicates economic sufficiency and well-being by bringing out relative importance of various items and groups of items in the scheme of their consumption. In order to understand consumption pattern of the sample households, monthly expenditure on food and non-food items, including the value of self-produced home consumption, were estimated. Food items include cereals, pulses, vegetables, fish and meat, sugar and tea, edible oil, etc. On the other hand, non-food basket of goods include clothing, fuel and lighting, education, health consultation, transportation, communication, social ceremonies, intoxicants, etc. The shares of different components in the average consumption basket of the sample households are shown in Figure 5.
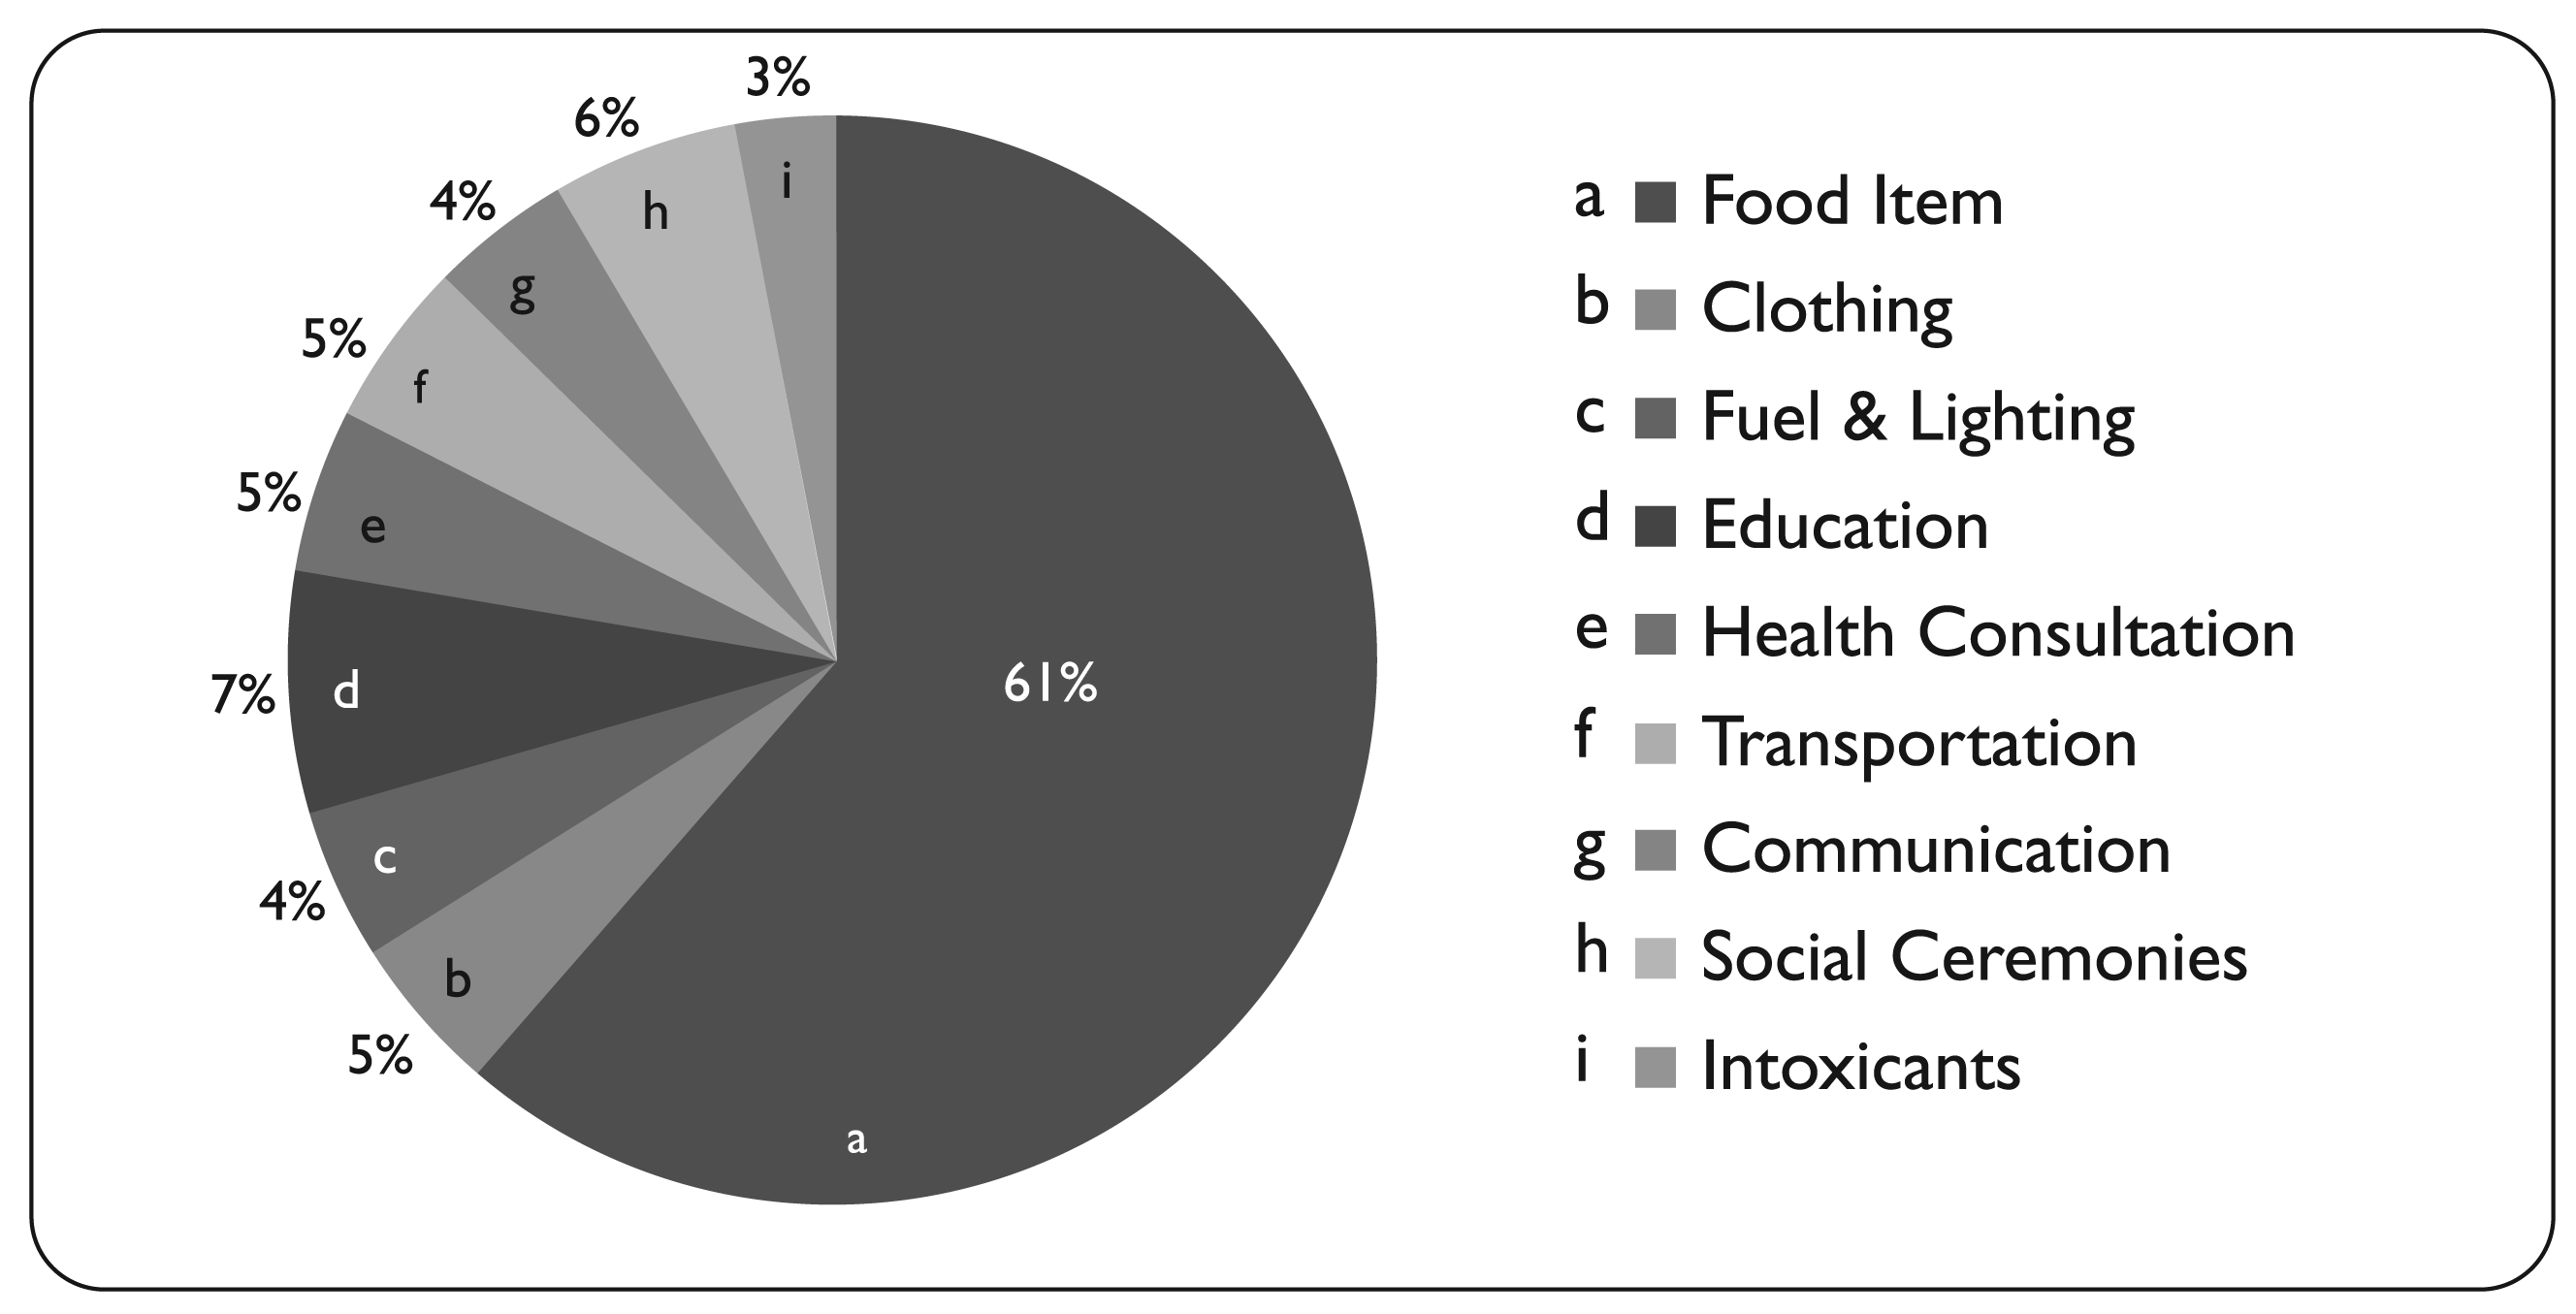
Households on an average spent a major chunk (more than 61%) of their monthly consumption expenditure on food items. In contrast to the common stereotype, the percentage of household consumption expenditure on intoxicants is quite limited. On the other hand, the percentage of expenditure on social ceremonies is relatively higher. This is akin to the findings of AIRTSC (2008), which mentioned that a strong community bonding exists among the Misings and to maintain a coherent social life, the tribe spends a considerable amount of resources on various socio-religious ceremonies.
A significant part of the monthly expenditure is spent on the education of children. Investment on the education of children can be expected to facilitate the younger generation to shift to more rewarding occupations.
However, when the pattern of consumption is compared for the three categories of villages, the composition shows a significant variance of the chronically flood-affected village from those of the other two categories (refer Table 5). The fact that households in this category are required to spend a higher proportion of consumption expenditure on food indicates that income-wise also these villages are poorer than those of the other categories. Further with the compulsion of having to allocate a greater part of consumption expenditure on food, the households in the chronically flood-prone villages are constrained to restrict spending on the education of children.
Percentage Share of Some Key Items in the Monthly Consumption Expenditure Including Self-produced Home Consumption by Category of Villages

Moreover the households in the chronically flood-affected villages also spend a larger part of their consumption expenditure on health consultation. It is well known that floods are often followed by outbreak of contagious diseases, hence it is quite possible that households in the chronically flood-prone areas are required to spend more on health due to their greater exposure to such diseases in the aftermath of floods. Higher rates of open defecation in such villages mentioned earlier obviously makes matter worse.
Landholdings
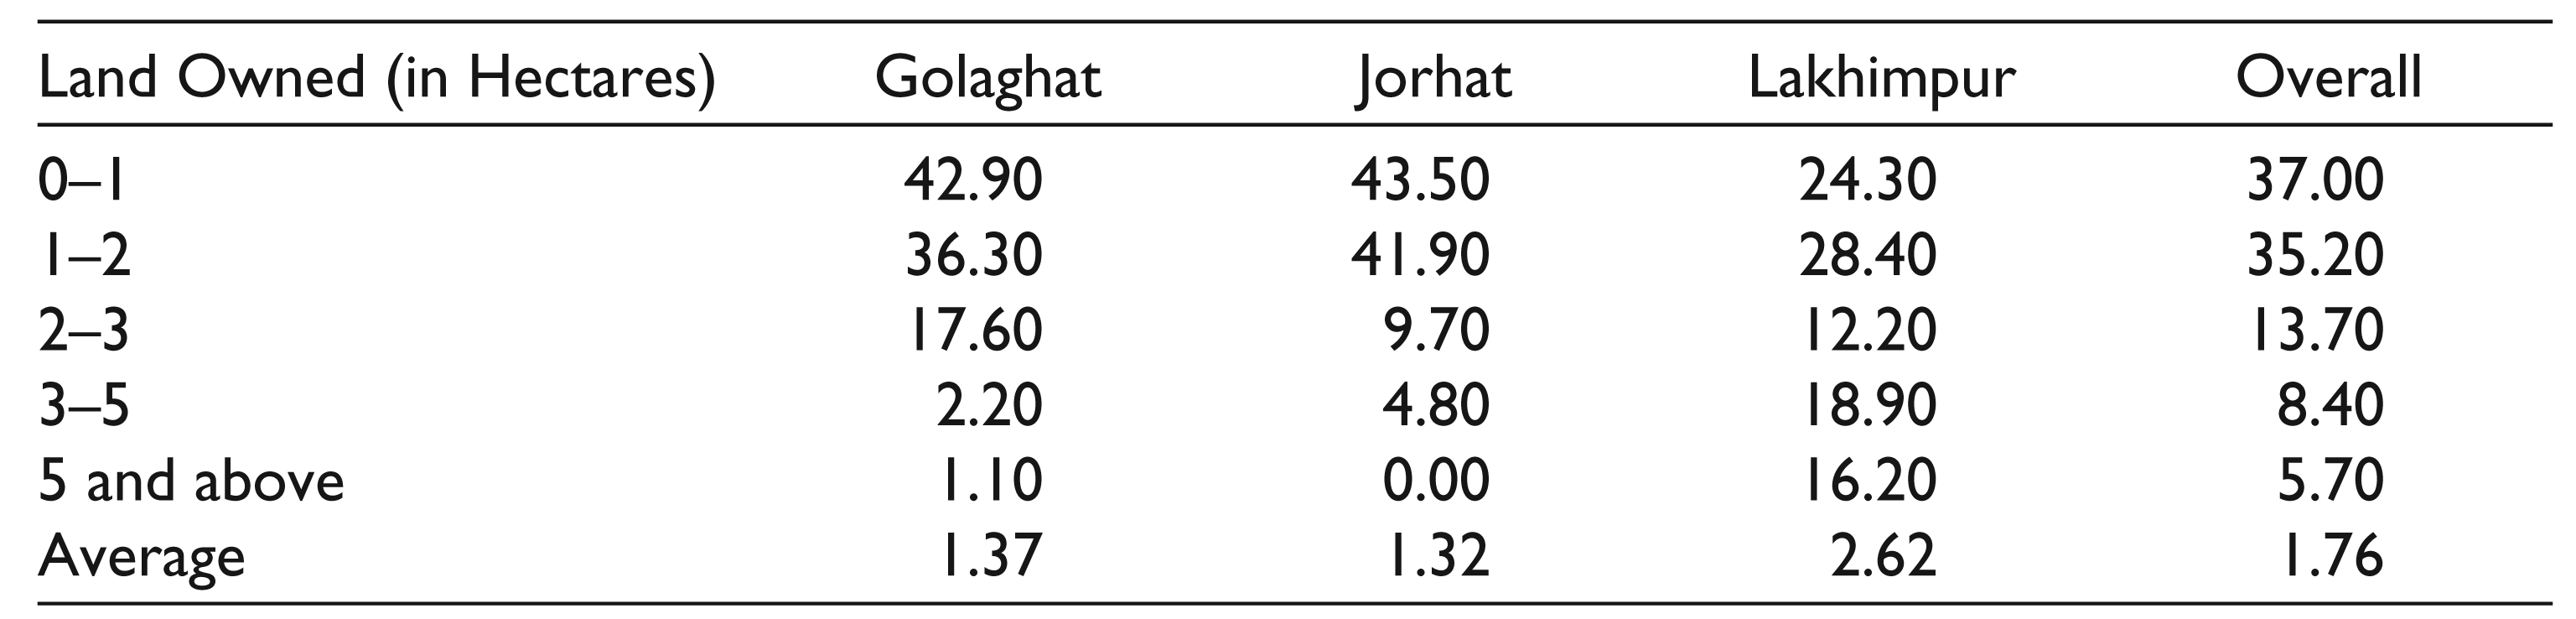
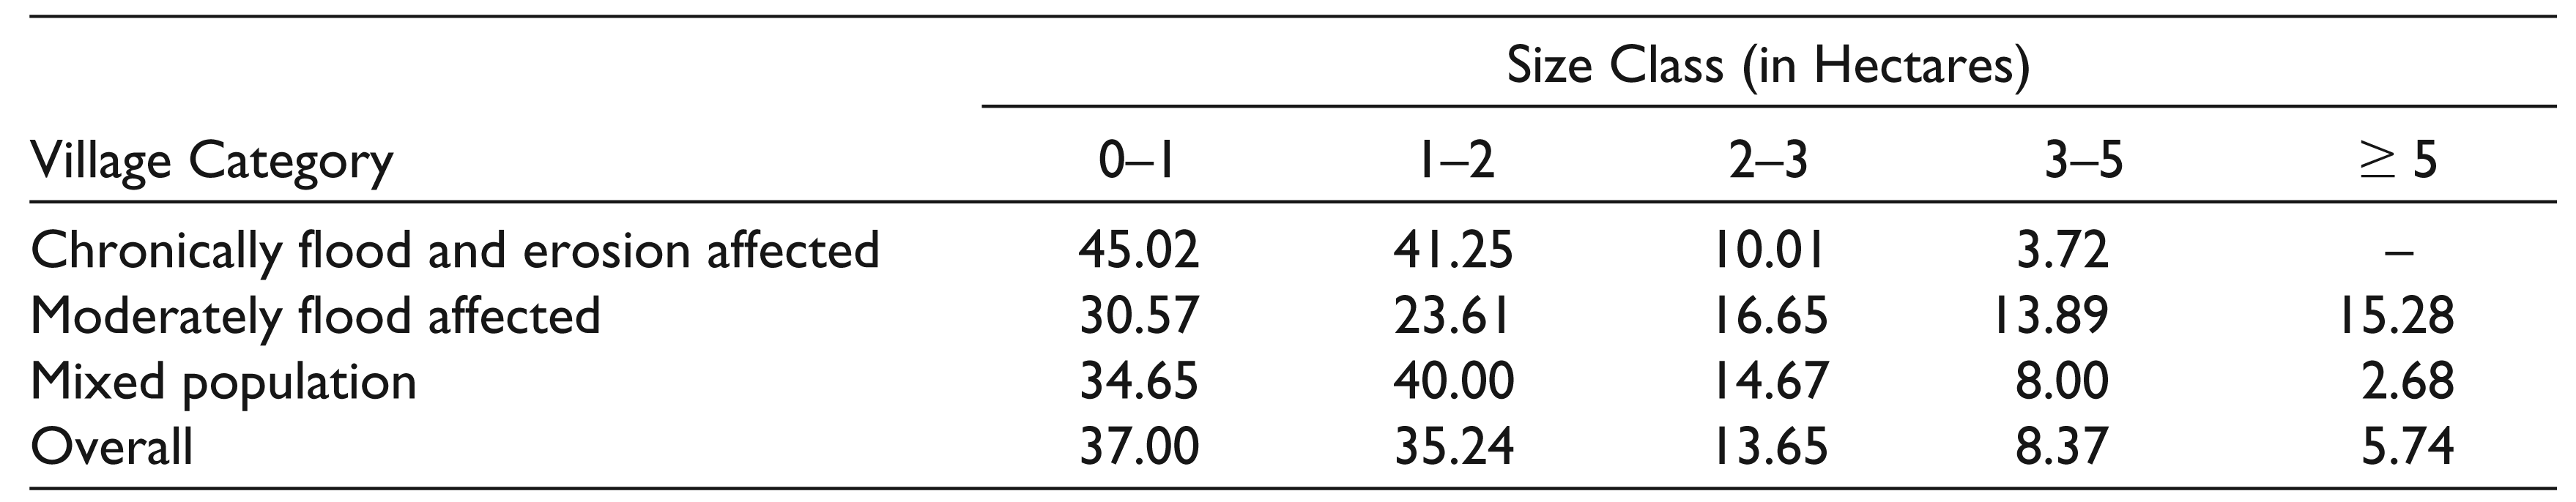
As land continues to be the main asset of households in rural India, it was expected to look into the extent of land ownership of the sample households. The term “landholding” is defined here as the total land area of all types—cultivated and uncultivated—held by a household (Das, 1995). Table 6 shows that the average size of landholding is significantly higher among the households in Lakhimpur district (2.62 ha) vis-à-vis Golaghat (1.37 ha) and Jorhat (1.32 ha) districts. Most of the sample households in Golaghat and Jorhat districts fall in the category of small and marginal landholding. The size of landholding is typically lower in the chronically flood- and erosion-affected villages (presented in Table 7). More than 86 per cent of the sample households in the chronically flood- and erosion-affected villages have less than 2 ha of land. In contrast, the percentages of households in same size classes of holding in moderately flood-affected and mixed villages are 54 and 75, respectively.
Percentage Distribution of Sample Households According to the Size of Land Ownership
Percentage Distribution of Sample Households According to the Size of Land Ownership by Category of Villages
Access to Financial Services
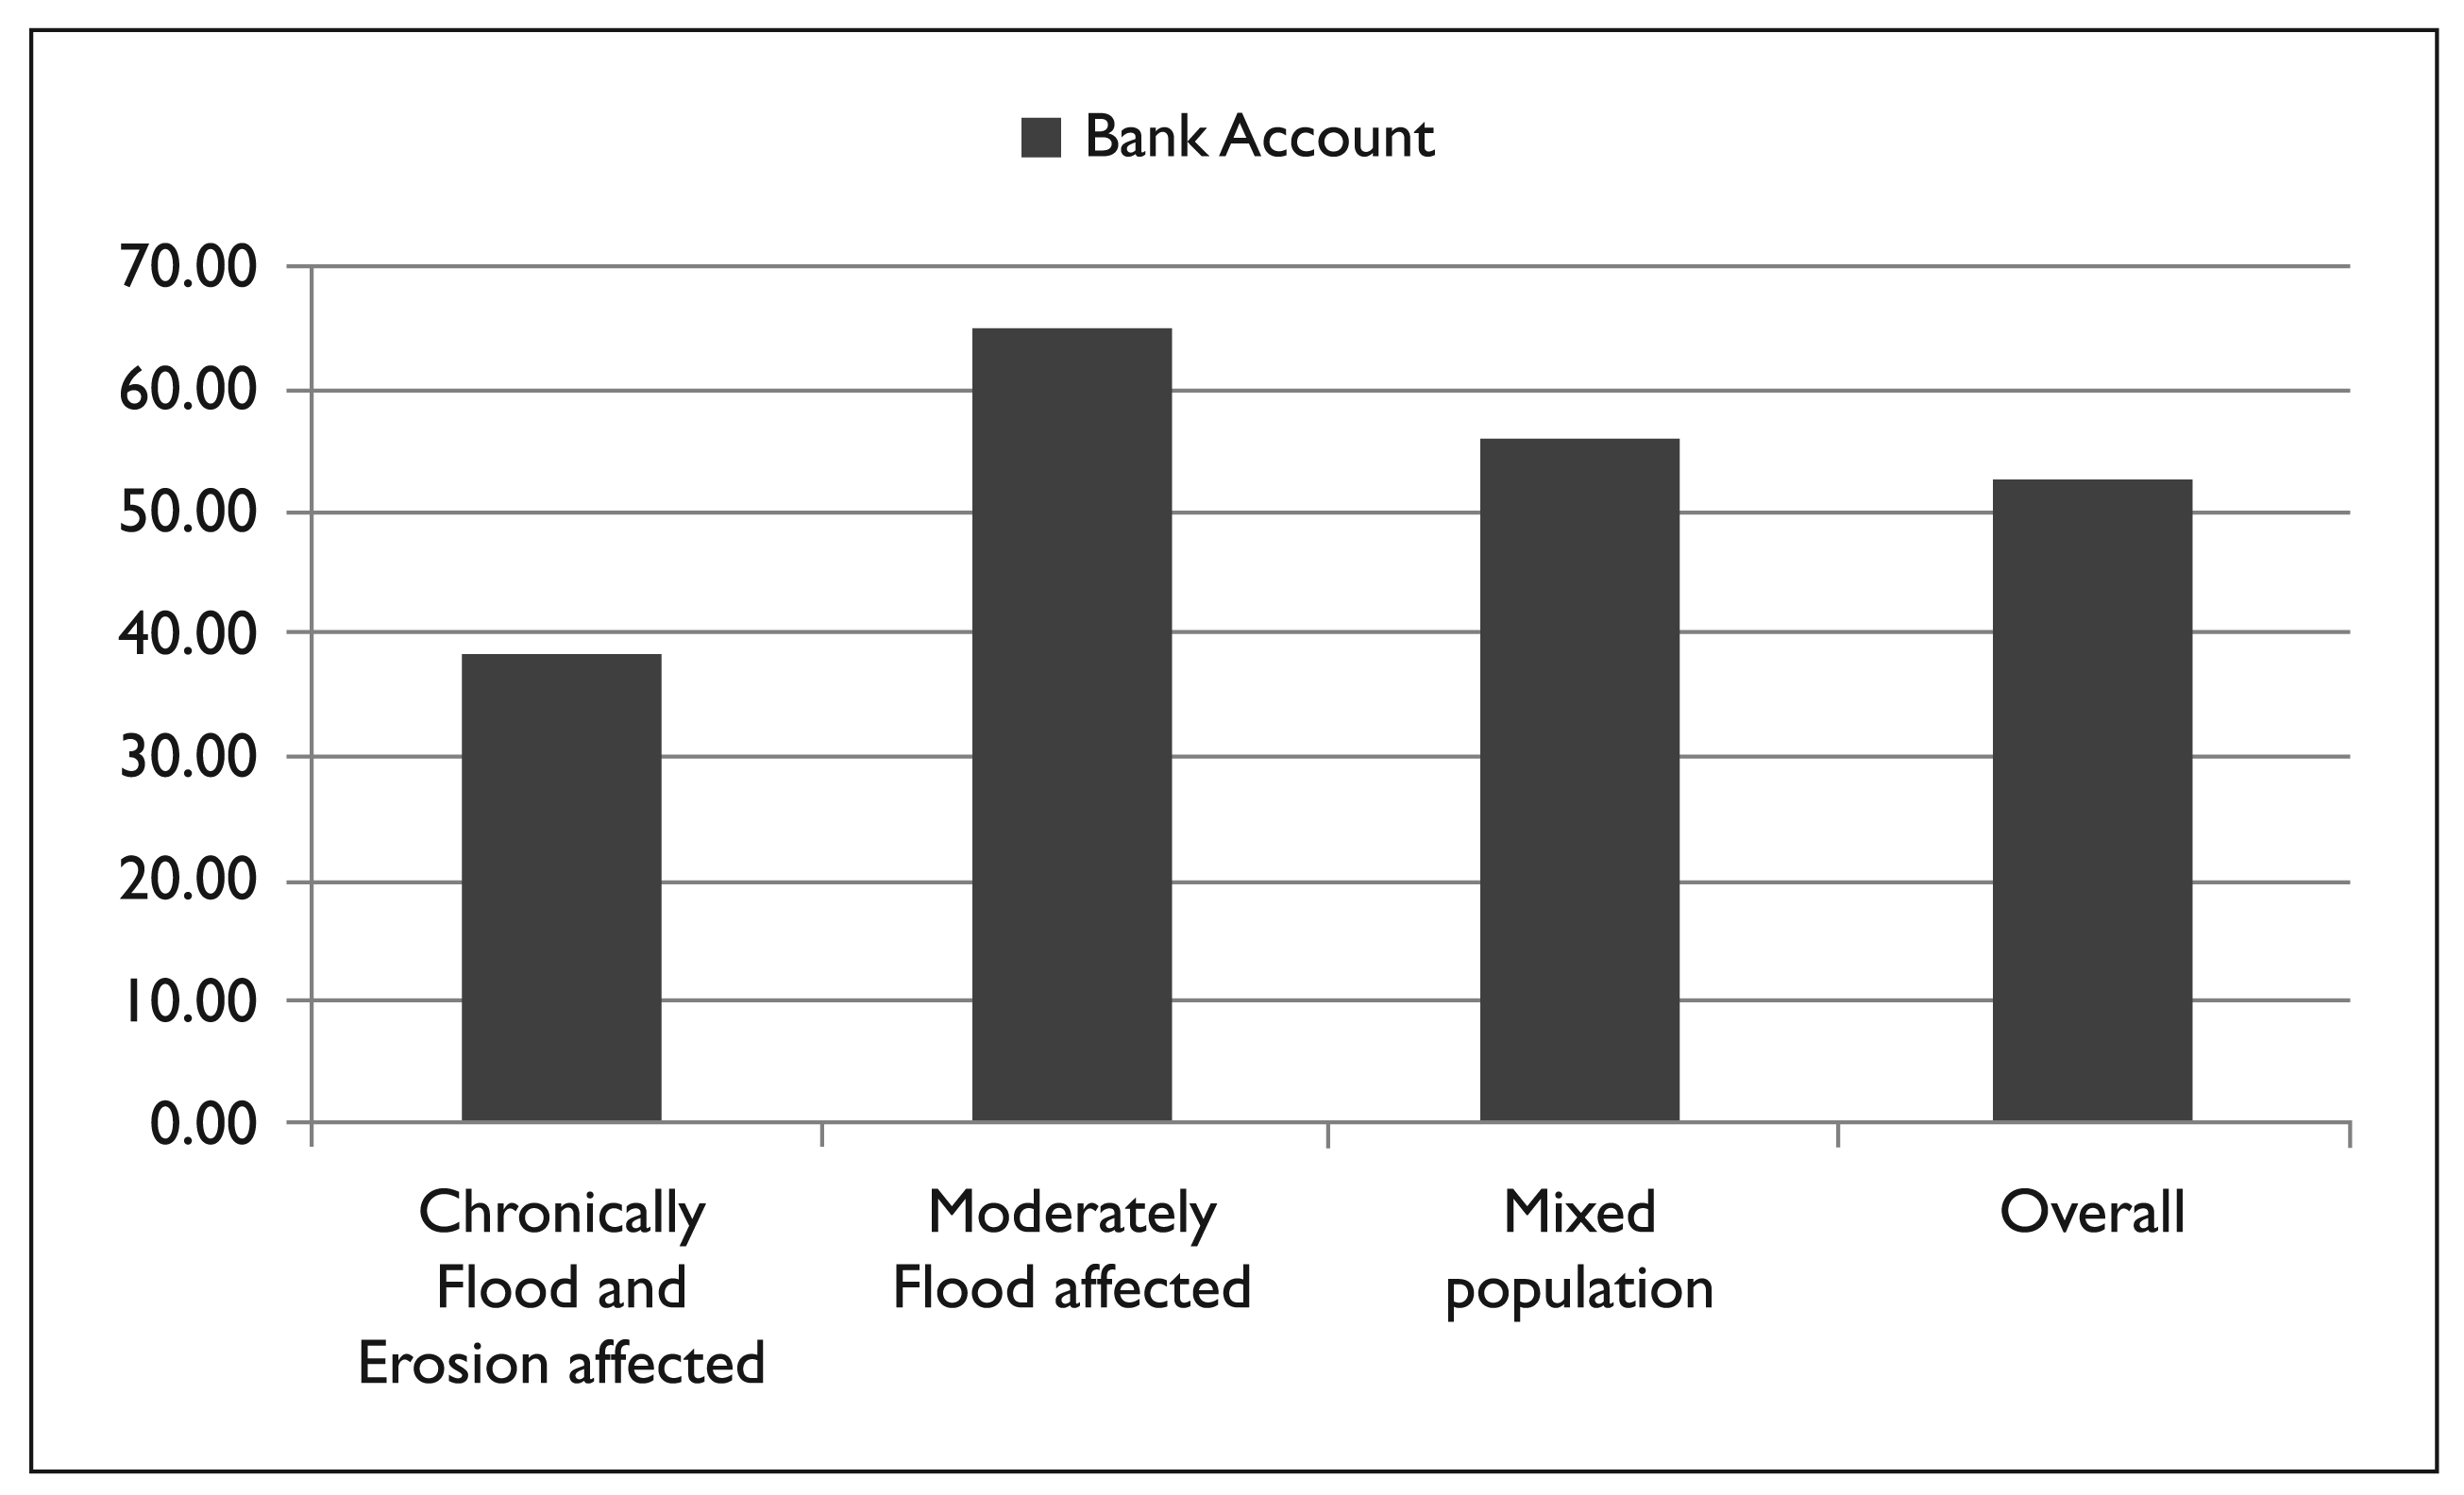
Access to formal financial services can reduce dependence of households on costly informal sources of these services, thereby reducing the risk of falling into severe indebtedness. Thus, financial inclusion can be an important instrument of uplift of the economic condition of households. Access to financial services of sample households has been seen in terms of the two indicators, namely, (a) percentage of households having at least one bank account and (b) percentage of households having used institutional credit facilities.
The percentage distribution of the sample households as per having bank account and availing loans by different source of credit are depicted in Figures 6 and 7. It can be seen that financial exclusion among the households has been high as nearly half of the sample households did not have a bank account at the time of the survey. Households in the chronically flood- and erosion-affected villages have remained substantially behind the rest of the categories in this regard. As many as 60 per cent of the households in the chronically flood-affected villages were completely financially excluded at the time of the survey compared to similar households constituting 35 per cent and 45 per cent in the moderately flood-affected and mixed population villages, respectively.
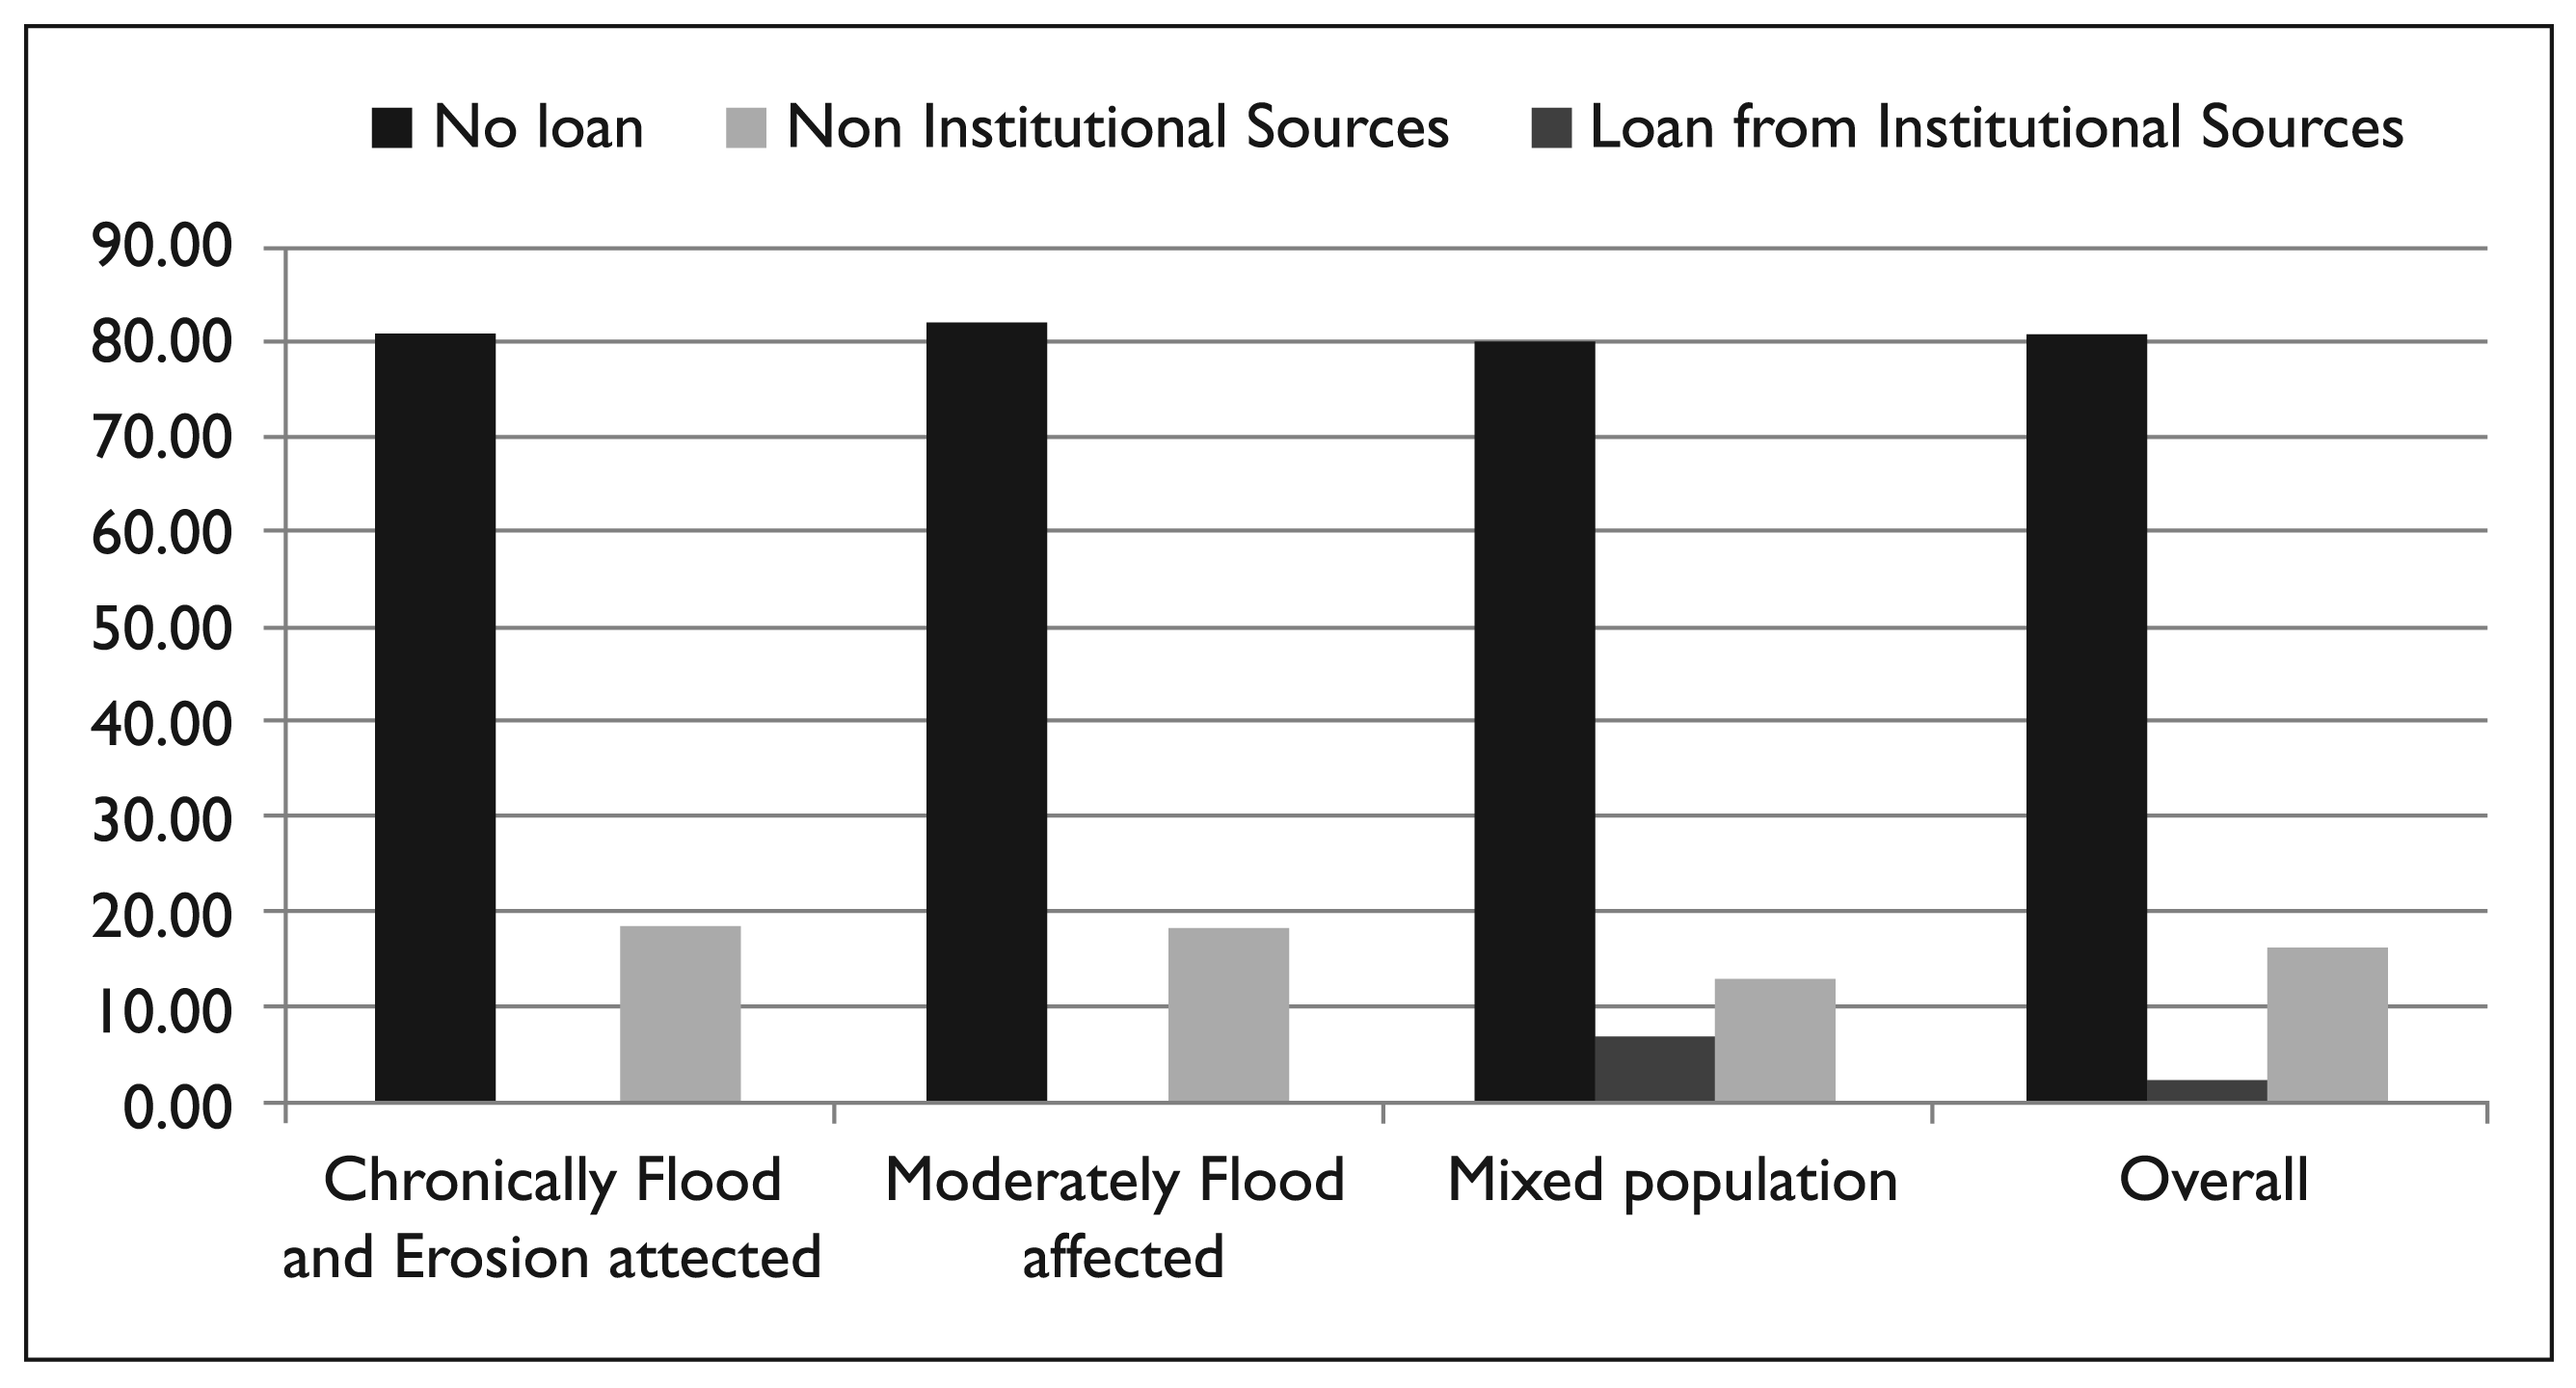
The fact that only about 18 per cent of the households accessed institutional credit indicates that even for those who are financially included, the depth of financial inclusion is rather low.
Status of Health
Health status has been captured in terms of incidence among sample households of diseases such as malaria, jaundice, tuberculosis which are typically endemic in many parts of Northeast India. Table 8 shows that the incidence of malaria is quite high in the surveyed areas. At least one member of 15 per cent of the surveyed households suffered from malarial sickness during the reference year. The households afflicted by jaundice, infectious water-borne disease, was about 10 per cent. Incident of tuberculosis, a common disease in the backward-living conditions, was however found to be very few.
Percentage of Sample Households Reporting Incidence of Common Diseases During the Year Preceding the Survey
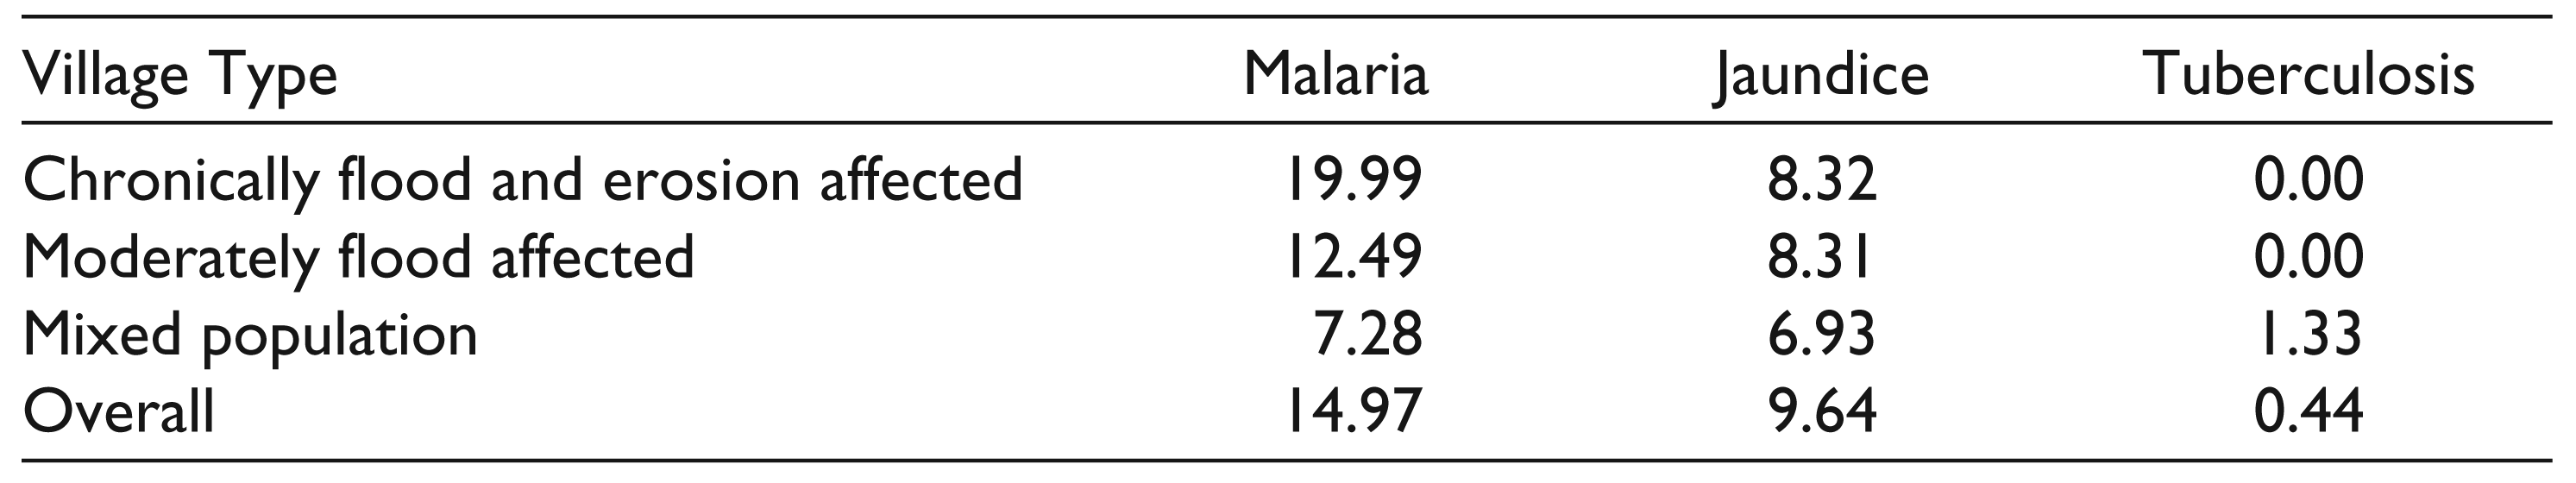
Incidences of both malaria and jaundice are significantly higher in the flood-affected villages, especially in the chronically food-affected ones than in the villages with mixed population where incidentally there are some instances of tuberculosis infections. More frequent incidences of diseases seem to compel sample households in chronically flood-affected villages to spend higher share of their monthly consumption expenditure in health consultation, as observed earlier.
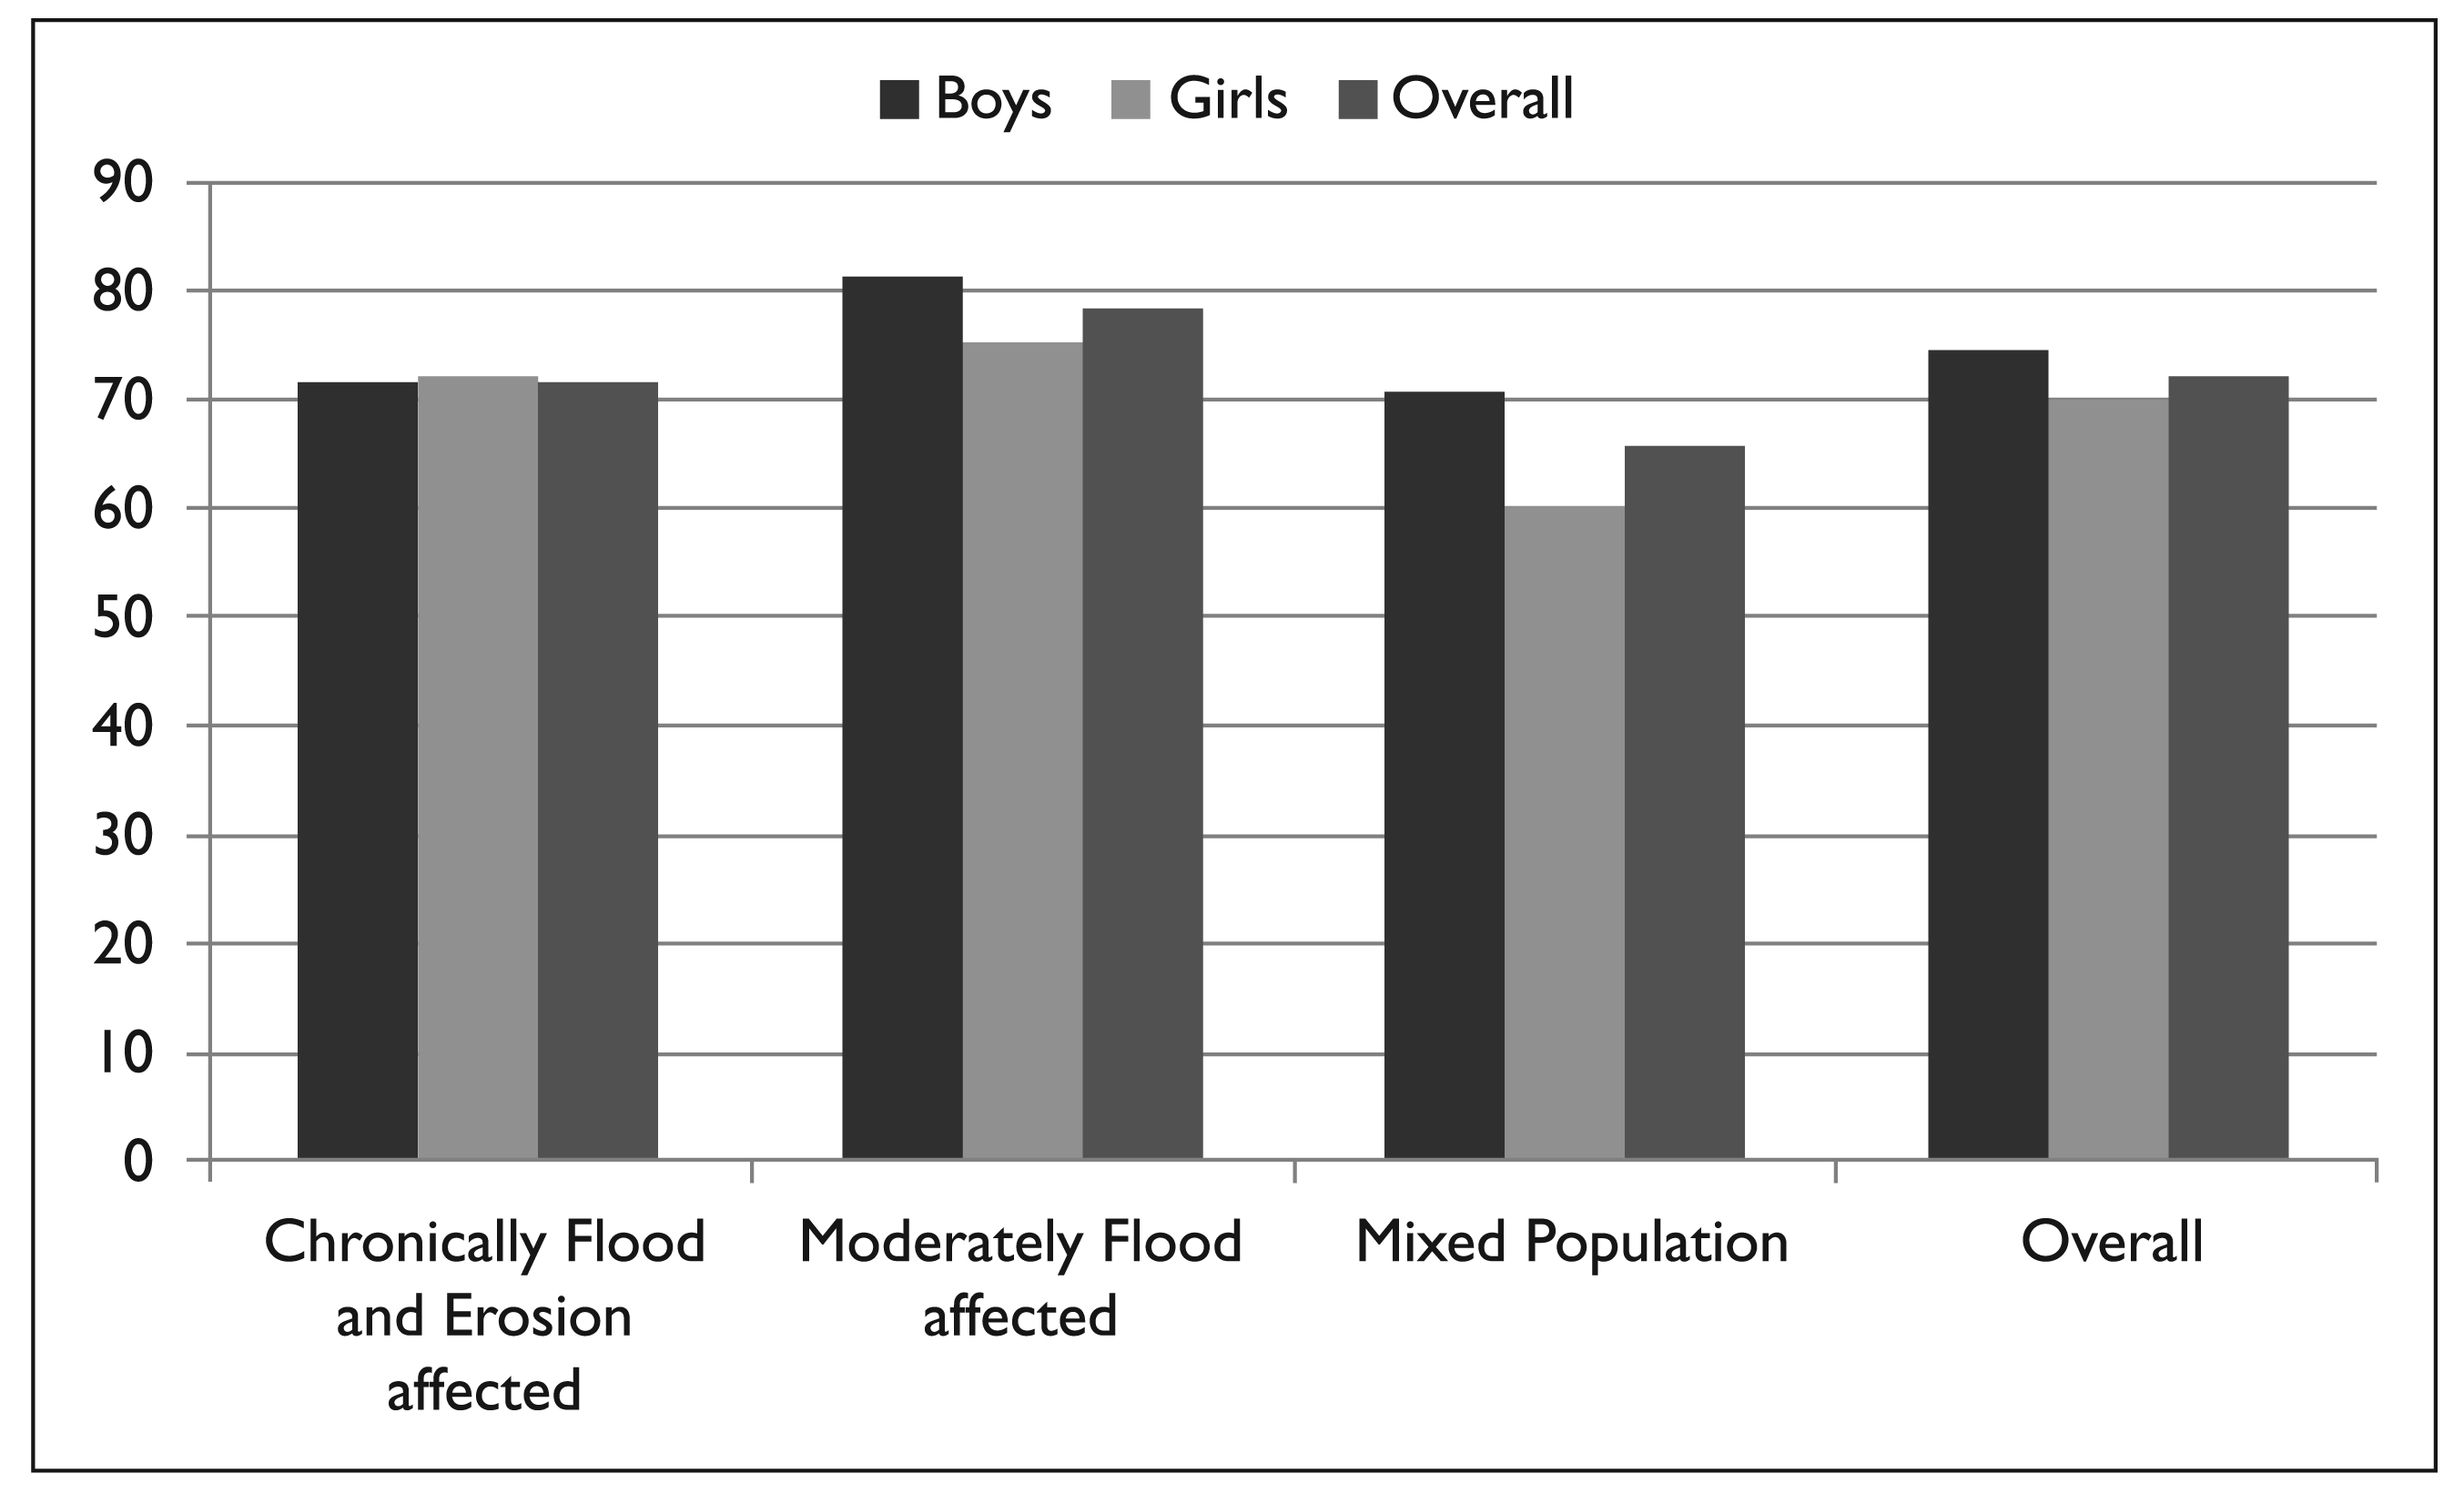
For progressive improvement of the health status over time, immunization of children assumes importance. During the sample survey, 72 per cent of the children in the age group of 0 to 5 years in the surveyed villages were found to be at least partially vaccinated. This indicates exclusion of a considerable section of children from proper vaccination (refer Figure 8). The percentage of vaccinated boys (about 75%) in the sample villages was found to be somewhat higher than the girls (about 70%). This difference in the immunization rate among boys and girls has an implication for the observed decline in the child sex ratio reported in the second section of this article. Among the three different village categories, moderately flood-affected villages are relatively better off in terms of vaccination as compared to the other two categories.
An important indicator of progress related to health is reduced dependence on quacks and increase reliance of professional medical advisers. The heartening fact in this regard is that as many as 82 per cent of the sample households consult only medical professionals like government doctor for health advice. However, about 11 per cent goes to both government doctors and quacks, and 7 per cent of the households still depend only on quacks. Further, proportion of households depending on quacks is considerably higher in chronically flood- and erosion-affected villages. Greater dependence on “quack” for health advice in among these households reflects the poor penetration of modern health services, public or private, in these areas.
Enrolment
Another parameter crucial for progressive socio-economic uplift of a community with the passage of time is the enrolment of its children in educational institutions. The enrolment status of children in the age group of 6 to 16 years in the sample households is presented in Table 9.
Enrolment Ratio (in Percentage) in Age Group of 6–16 Years Across Village Categories
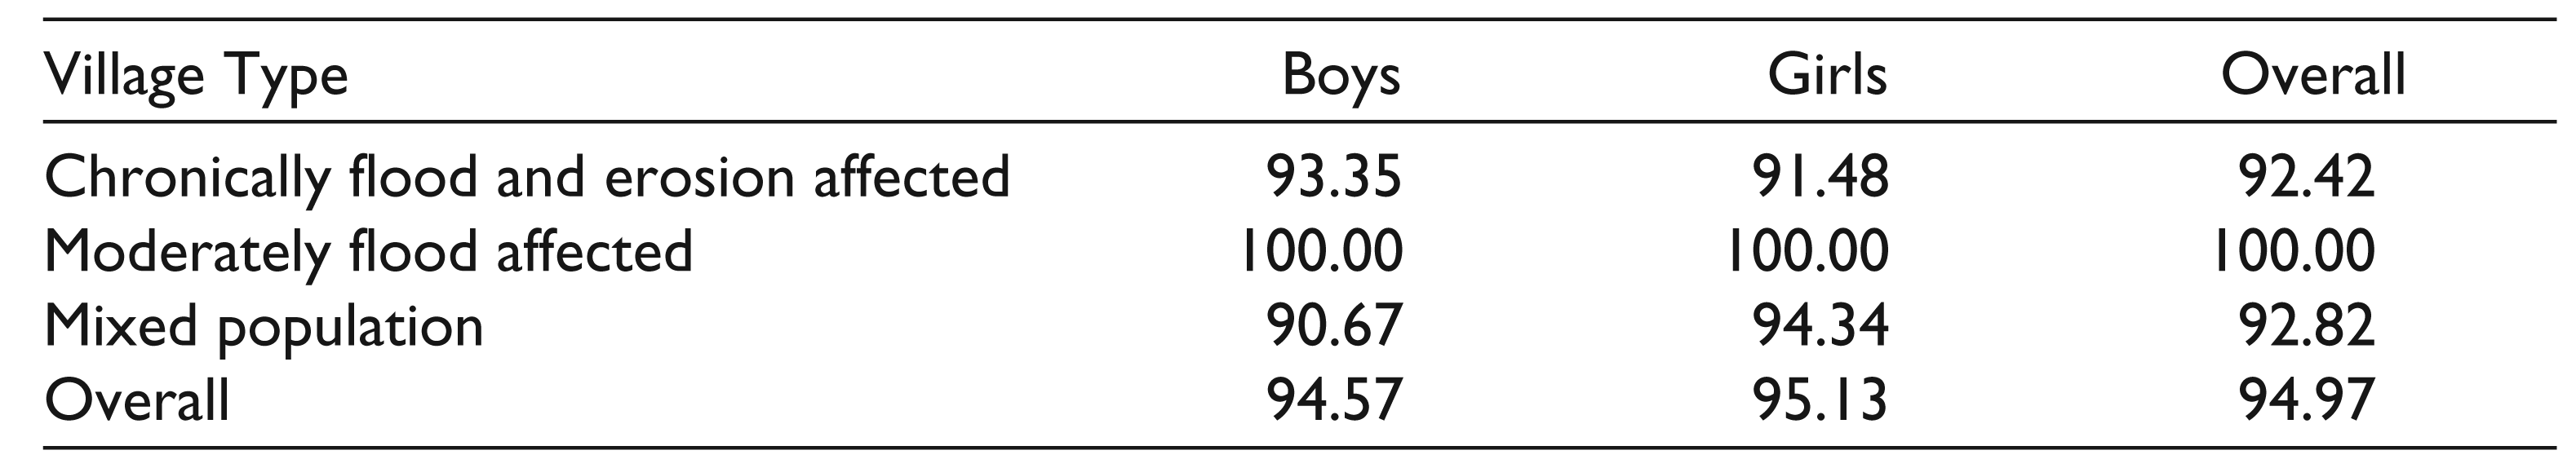
The heartening features of the enrolment status depicted in Table 9 are the high overall enrolment and higher enrolment ratio of girls than boys. But the less than universal enrolments in the chronically flood-affected and mixed villages is an area of concern.
Occupational Patterns and Determinants of Occupational Diversity
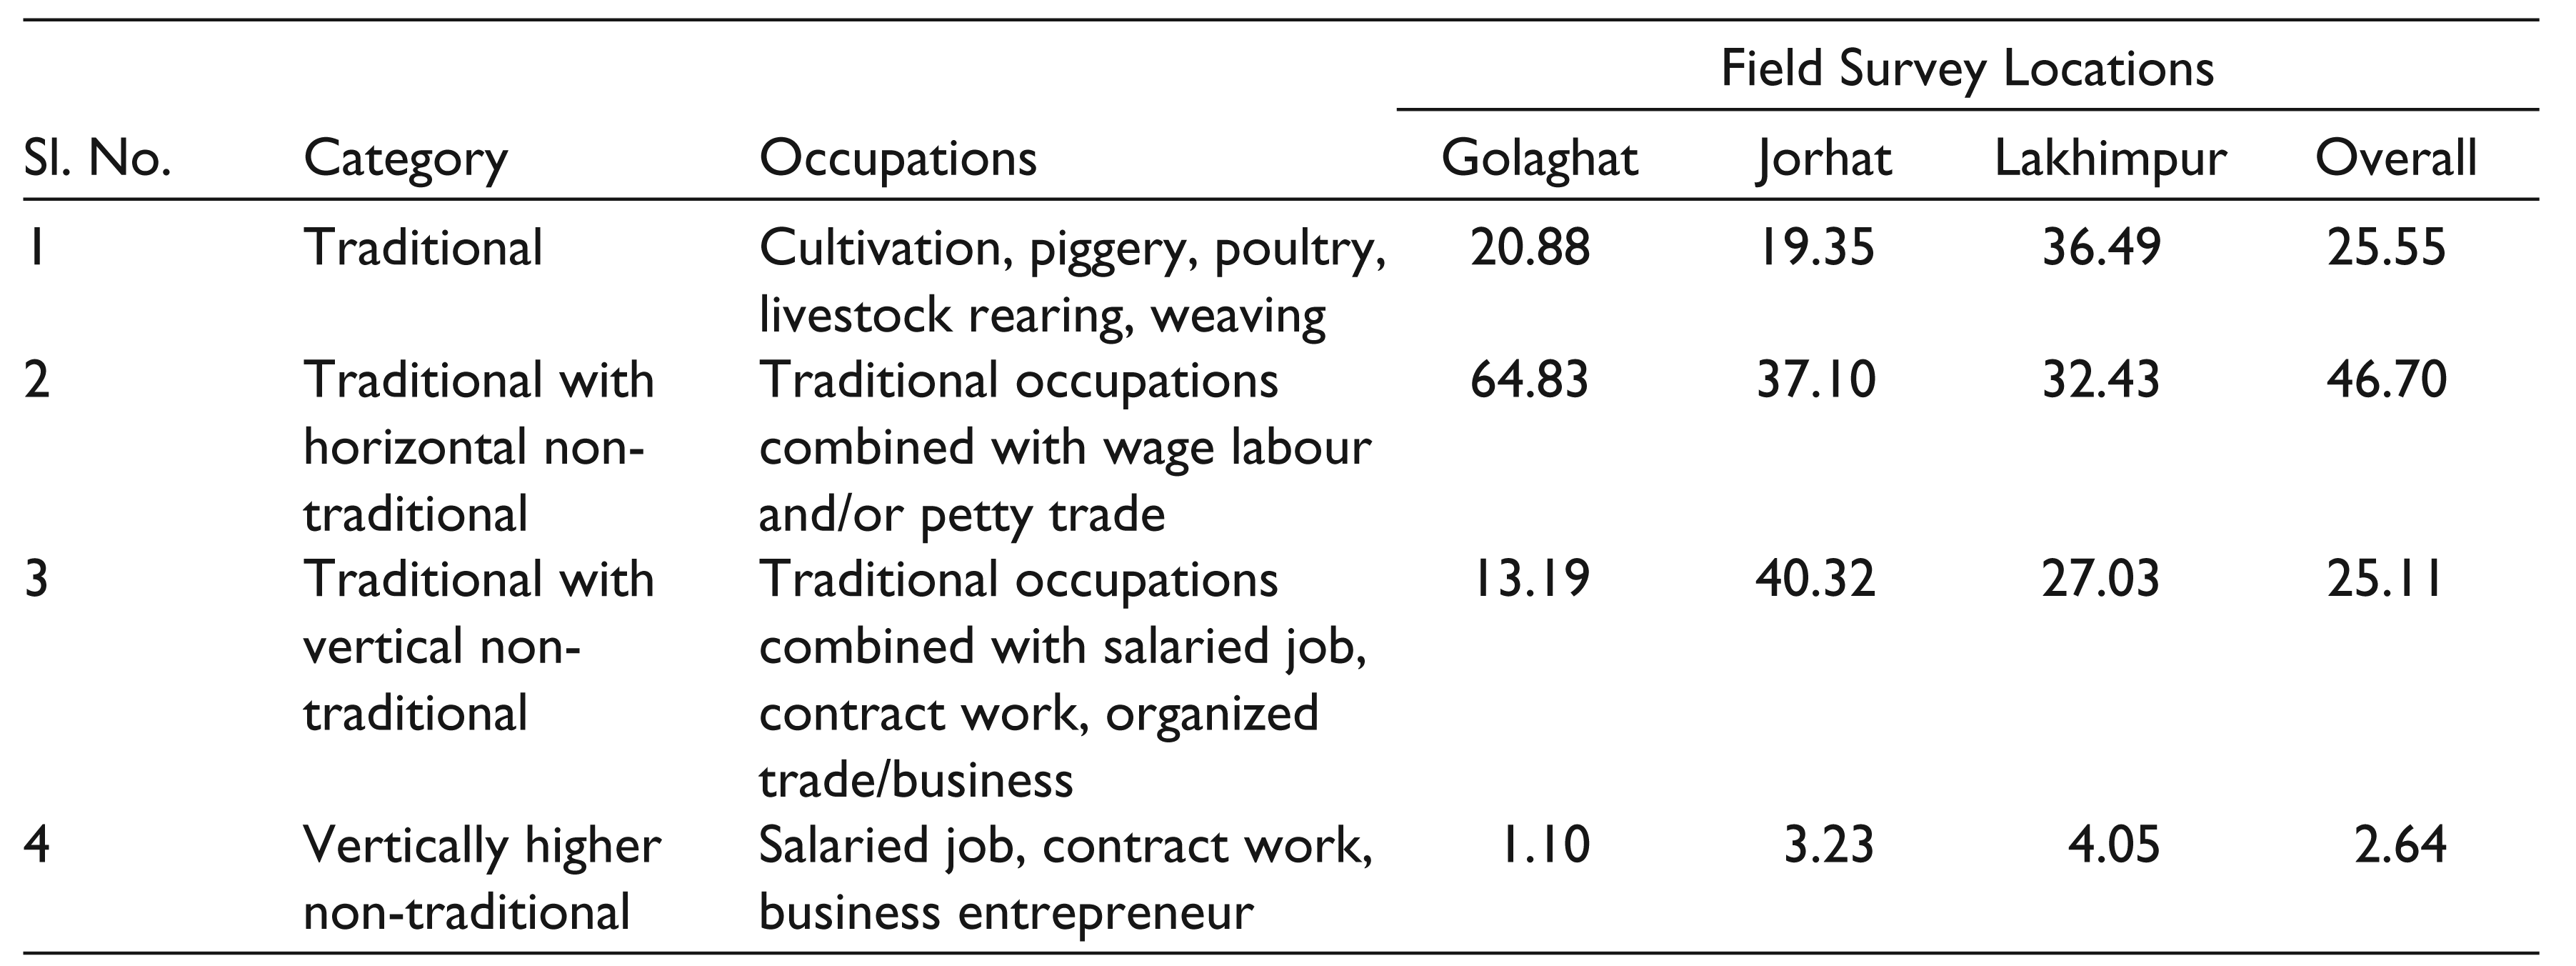
One of the indicators of socio-economic transition of a community is their occupational mobility. Occupational mobility may be classified into horizontal and vertical mobility. Horizontal movement or mobility of an individual or a group takes place within the same level of stratum. Mobility is said to be vertical, when the transfer of an individual or a group takes place from one stratum to another in an ascending/descending order (Singh, 1986). In vertical mobility, household or an individual shift to more rewarding and/or less painstaking and/or socially higher-ranked occupation, and thereby move up socio-economically to a higher strata. Horizontal mobility, in contrast, may not lead to such an uplift. Yet an individual or a household may be compelled to diversify occupation horizontally because of factors such as coping with shocks, marginalization of existing occupation, lack of resources and lack of capital (physical, financial and or human) to move into higher level of occupations. In the present study, horizontal occupational shift seems to be primarily driven by the erosion of land owned, and vertical shifts appear to be induced mostly by the spread of education. It is to be noted that many households fall in the mixed categories where households have shifted to a new occupation without completely giving up their traditional occupations. 3 Sample households have been categorized in four strata according to the direction of their occupational diversification. The lowest stratum includes households having purely traditional occupations. Thus, there has been little occupational diversification among the households of this stratum. The next stratum is comprised of households who have mixture of traditional and such non-traditional occupations which indicate merely horizontal diversification of occupation. The third stratum includes households with a mixture of traditional occupations and such non-traditional occupations which indicate a vertical diversification. The fourth stratum includes households which have purely non-traditional occupations which are of higher order.
Table 10 presents a distribution of sample households as per occupational strata. From the numbers in the table, two pertinent facts come to fore. First, despite only a quarter of the sample households being still stuck with purely traditional occupations, as many as 97 per cent of the households have not fully abandoned their traditional occupation. Second, the households of Lakhimpur district are less inclined to occupational shift than households in the other two locations. This corresponds to the fact that the average size of landholding in Lakhimpur district is significantly higher than the other two locations. Relatively larger possession of land has enabled the sample households to stick at their traditional occupations such as cultivation. In other words, households in Lakhimpur district are under lesser compulsion to shift to other occupations.
Percentage Distribution of Sample Households by Occupational Strata
Having traced the pattern of occupational diversification, it is pertinent to explore what induces the households to diversify their occupations. A regression analysis has been carried out to explore significance of some of the factors affecting the decision of sample households to get into occupations away from the tribe’s traditional occupations. The model and the results of the analysis are reported in the next subsection.
Variables for the Regression Analysis
Dependent Variable
The dependent variable Y in the regression model is a qualitative variable indicating the occupational category to which a household belongs. The four ordered occupational categories are (a) traditional, (b) traditional mixed with non-traditional horizontal occupations, (c) traditional mixed with vertical non-traditional occupations and (d) vertically higher non-traditional occupations.
Explanatory Variables
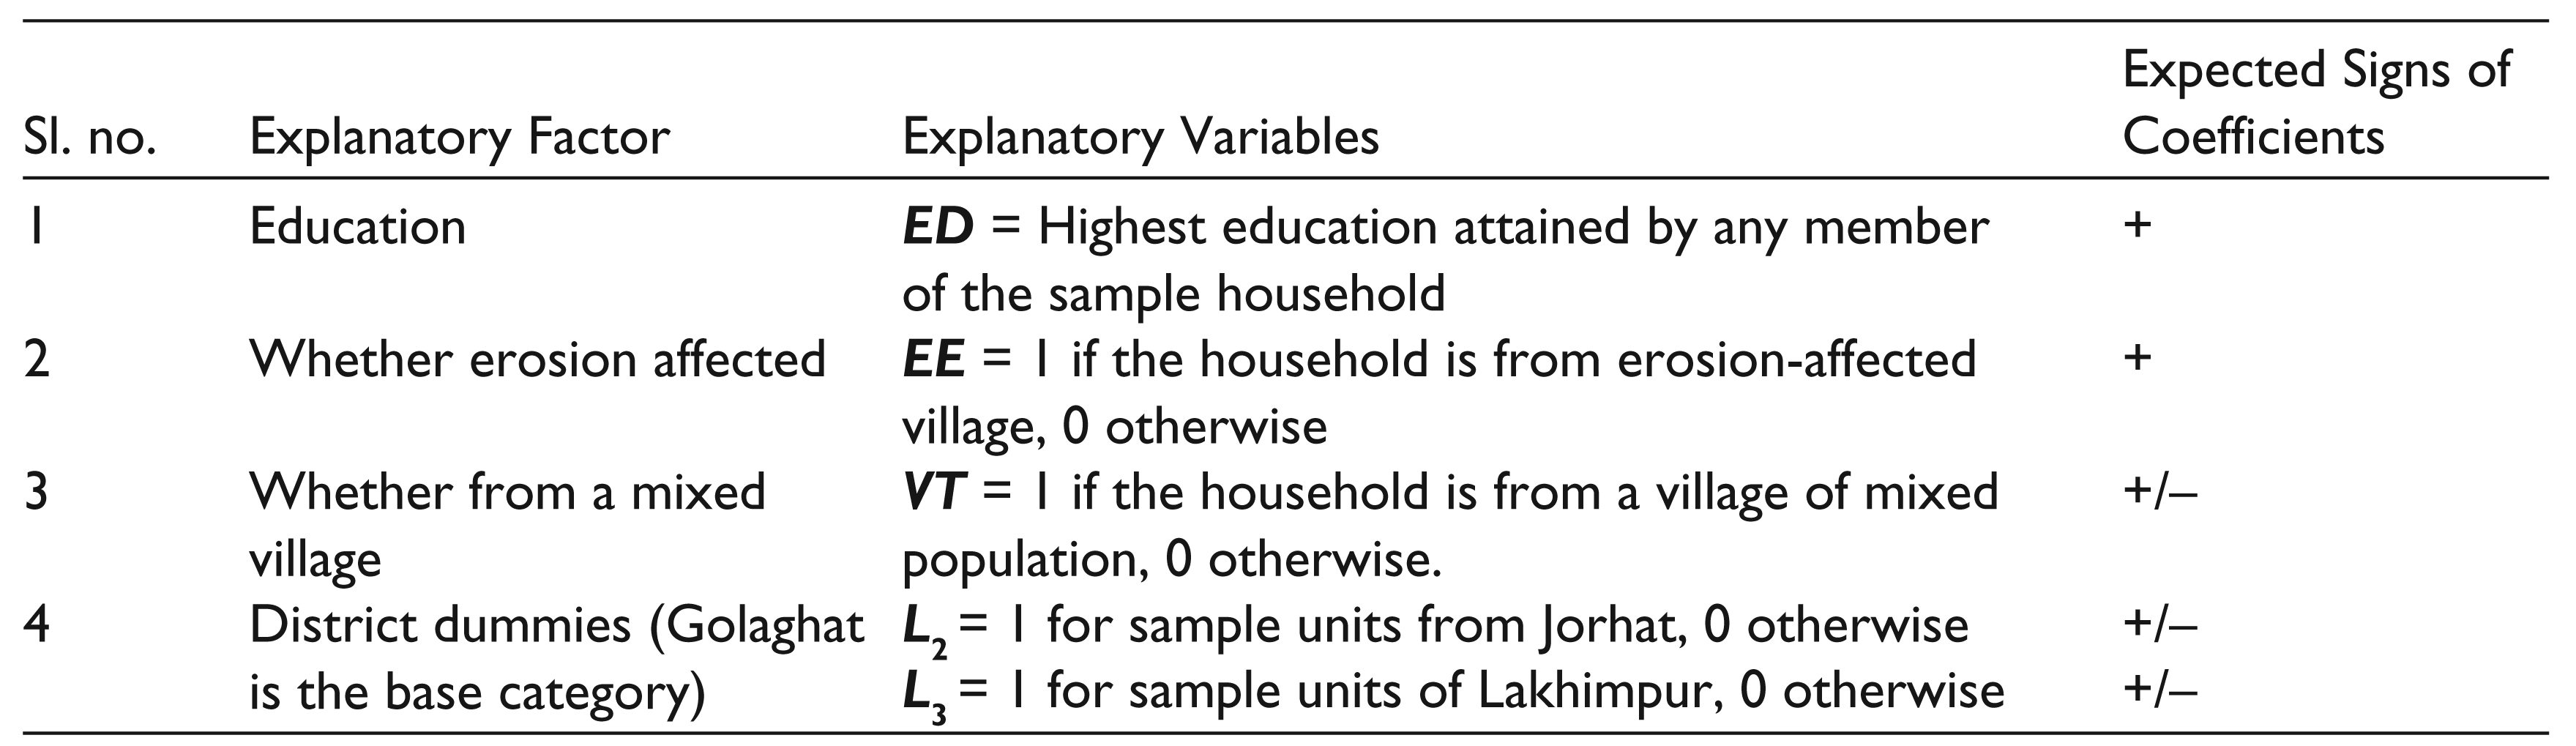
The explanatory factors included for the present analysis are the level of education (as an indicator of human capability), whether erosion affected (as an indicator of shock of natural calamities), the extent of the households contact with people of other communities (as an indicator of extent of exposure to other ways of life) and district locations, which takes into account the differences of the households across the three sample districts in terms of landholding pattern and other local factors. Explanatory variables included in the model, their definitions, notations and expected signs of their coefficients which have been presented in Table 11.
Description of Explanatory Factors and Variables for Regression Analysis of Occupational Shifts of Sample Households
Functional Specification of the Model
The dependent variable being qualitative indicating ordered categories, Ordered LOGIT, has been chosen as a suitable specification for modelling it.
Thus, the observed occupational status of the sample households Yi is linked to the latent variable Yi* in the following way:
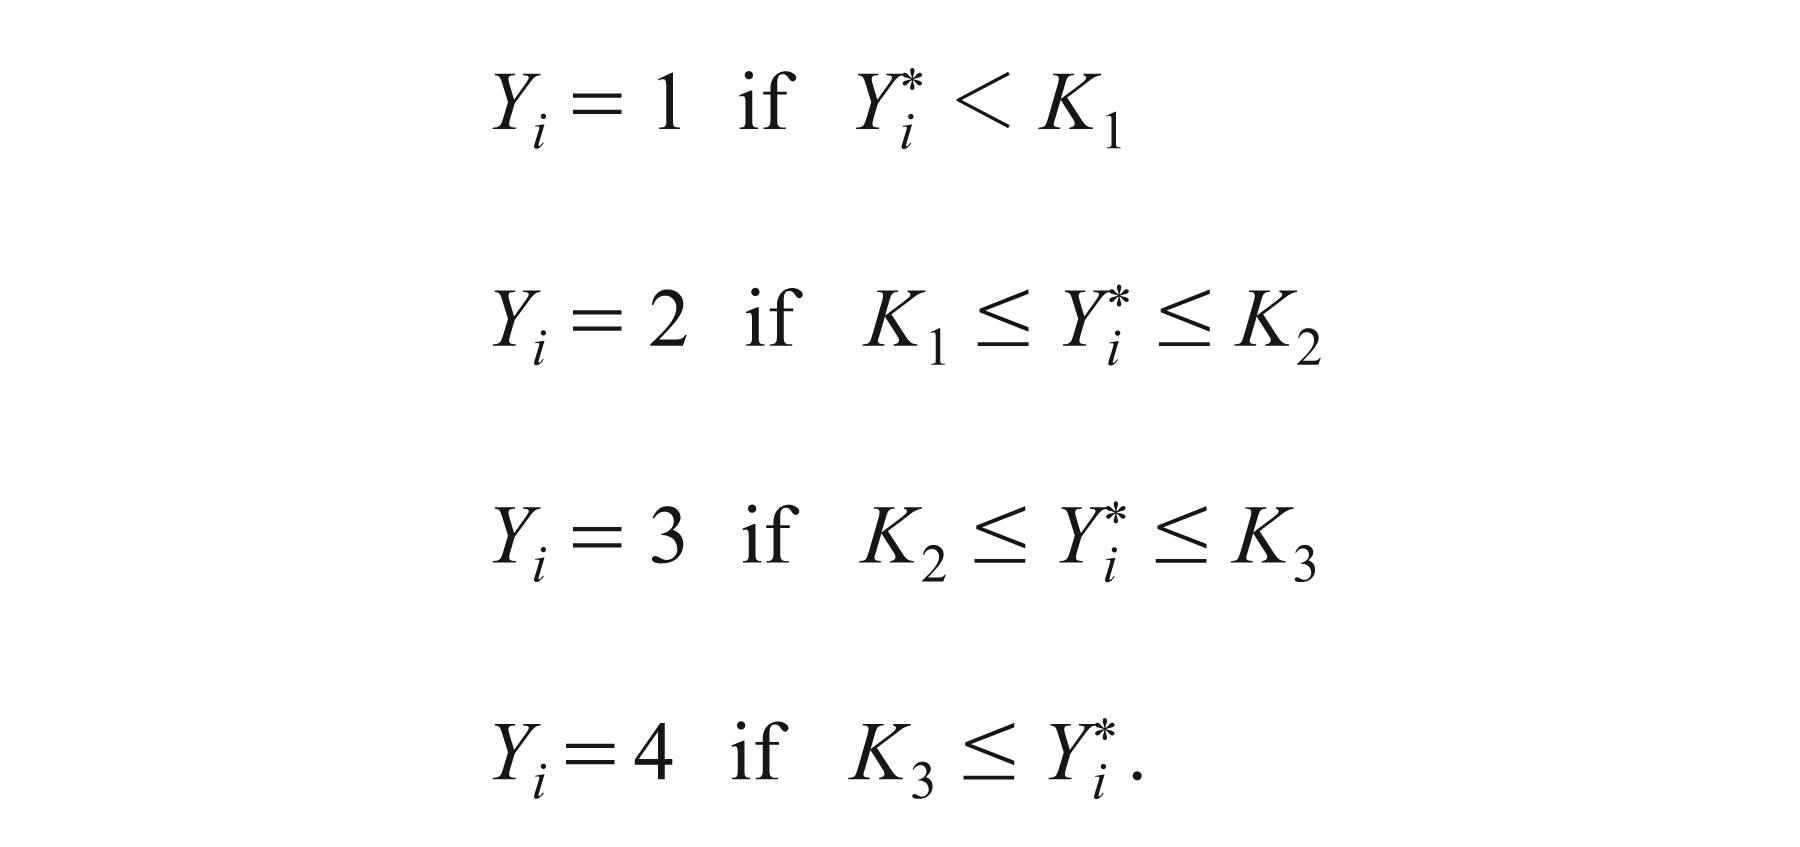
Incorporating explanatory variable, the latent variable has been specified as

where Ki are the threshold levels of Y* for Y to cross over categories and μ is the random term, which has a logistic distribution.
Results and Implications
Results of the maximum likelihood estimation of the model using STATA11.0 are summarized in Table 12. 4
Results of Ordered LOGIT Regression of Occupational Categories of Sample Households
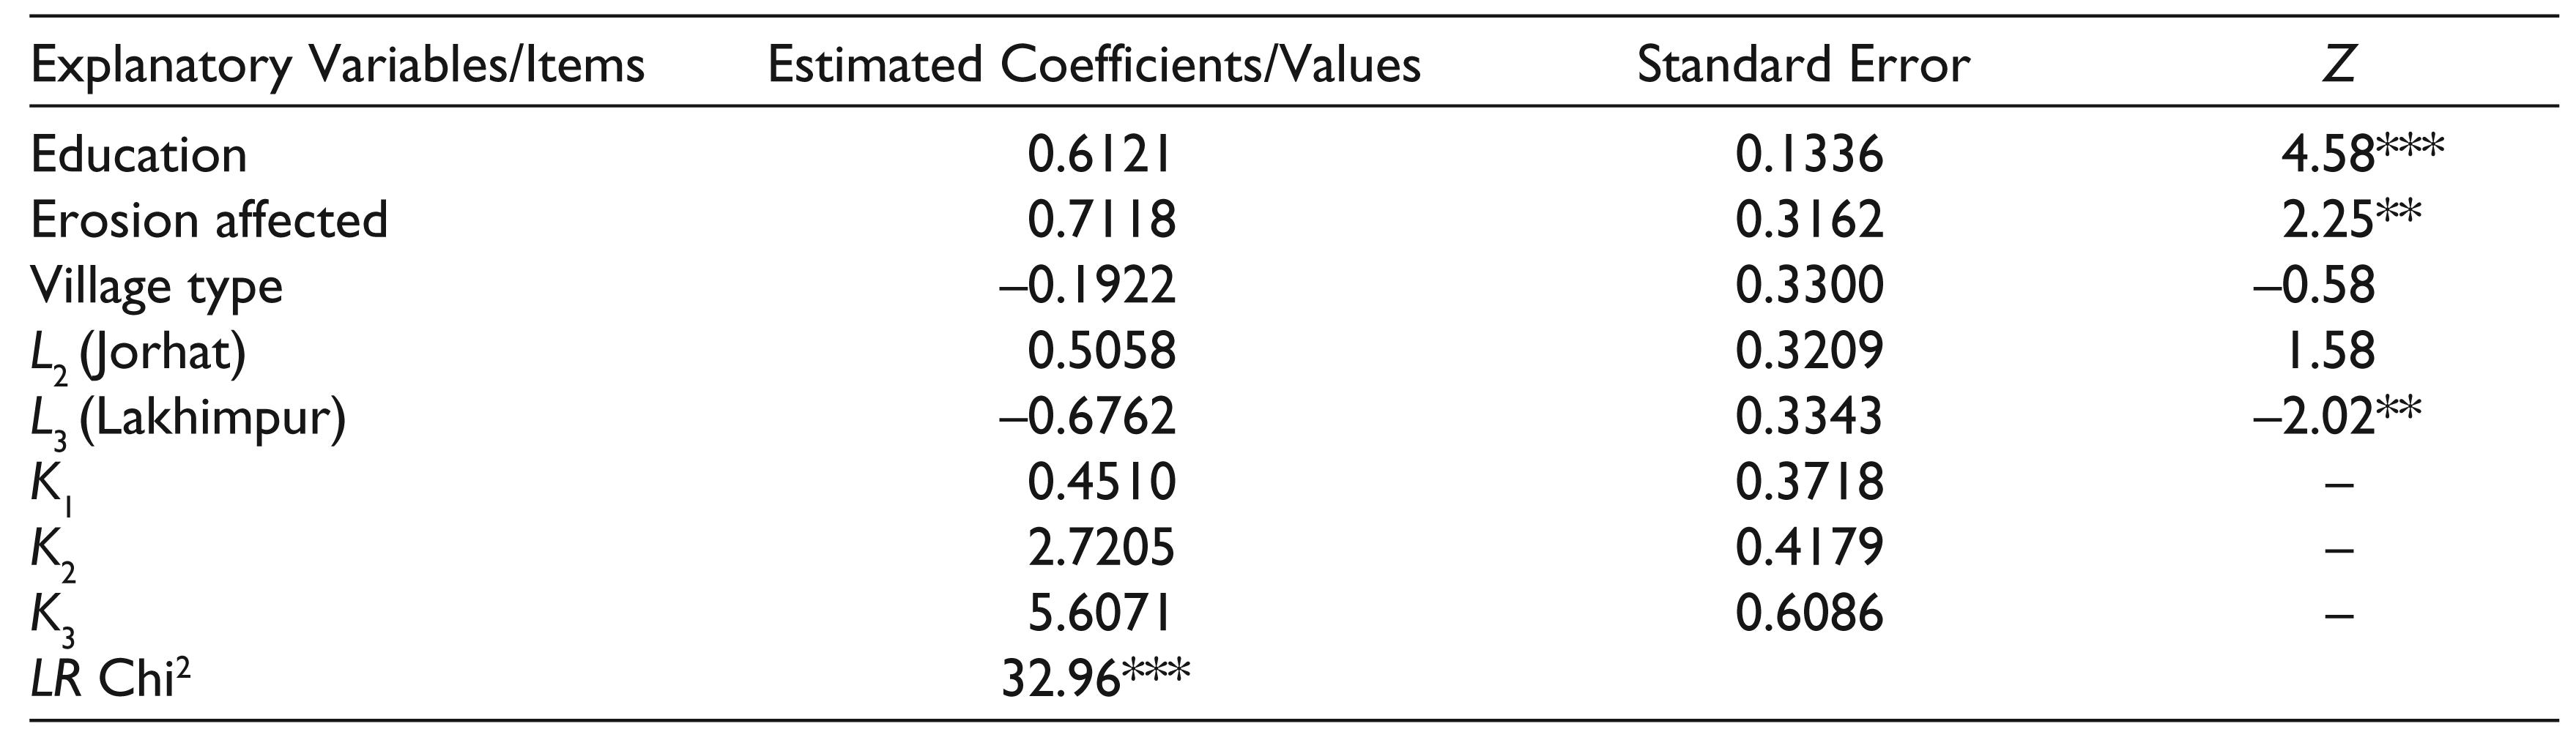
The results show that the educational level is the most significantly influencing factor for enabling households to move up to higher occupational categories. The other two statistically significant factors influencing occupational shift are effect of erosion (EE) and the location dummy L3 which takes the value 1 for Lakhimpur district and 0 for the other two districts. Positive sign of the coefficient for erosion indicates that households affected by erosion are forced to shift to non-traditional occupations. Negative coefficient of L3 indicates that households from the Lakhimpur district are less inclined to occupational diversification than households in the other two locations. It may be recalled that sample households in Lakhimpur on the average possess landholdings of larger size than those from Jorhat and Golaghat. Their larger land possessions seem to make it less compulsive for them to shift away from their farming-oriented traditional occupations.
Implementation of Development Programmes: Effectiveness of the Delivering Institutions
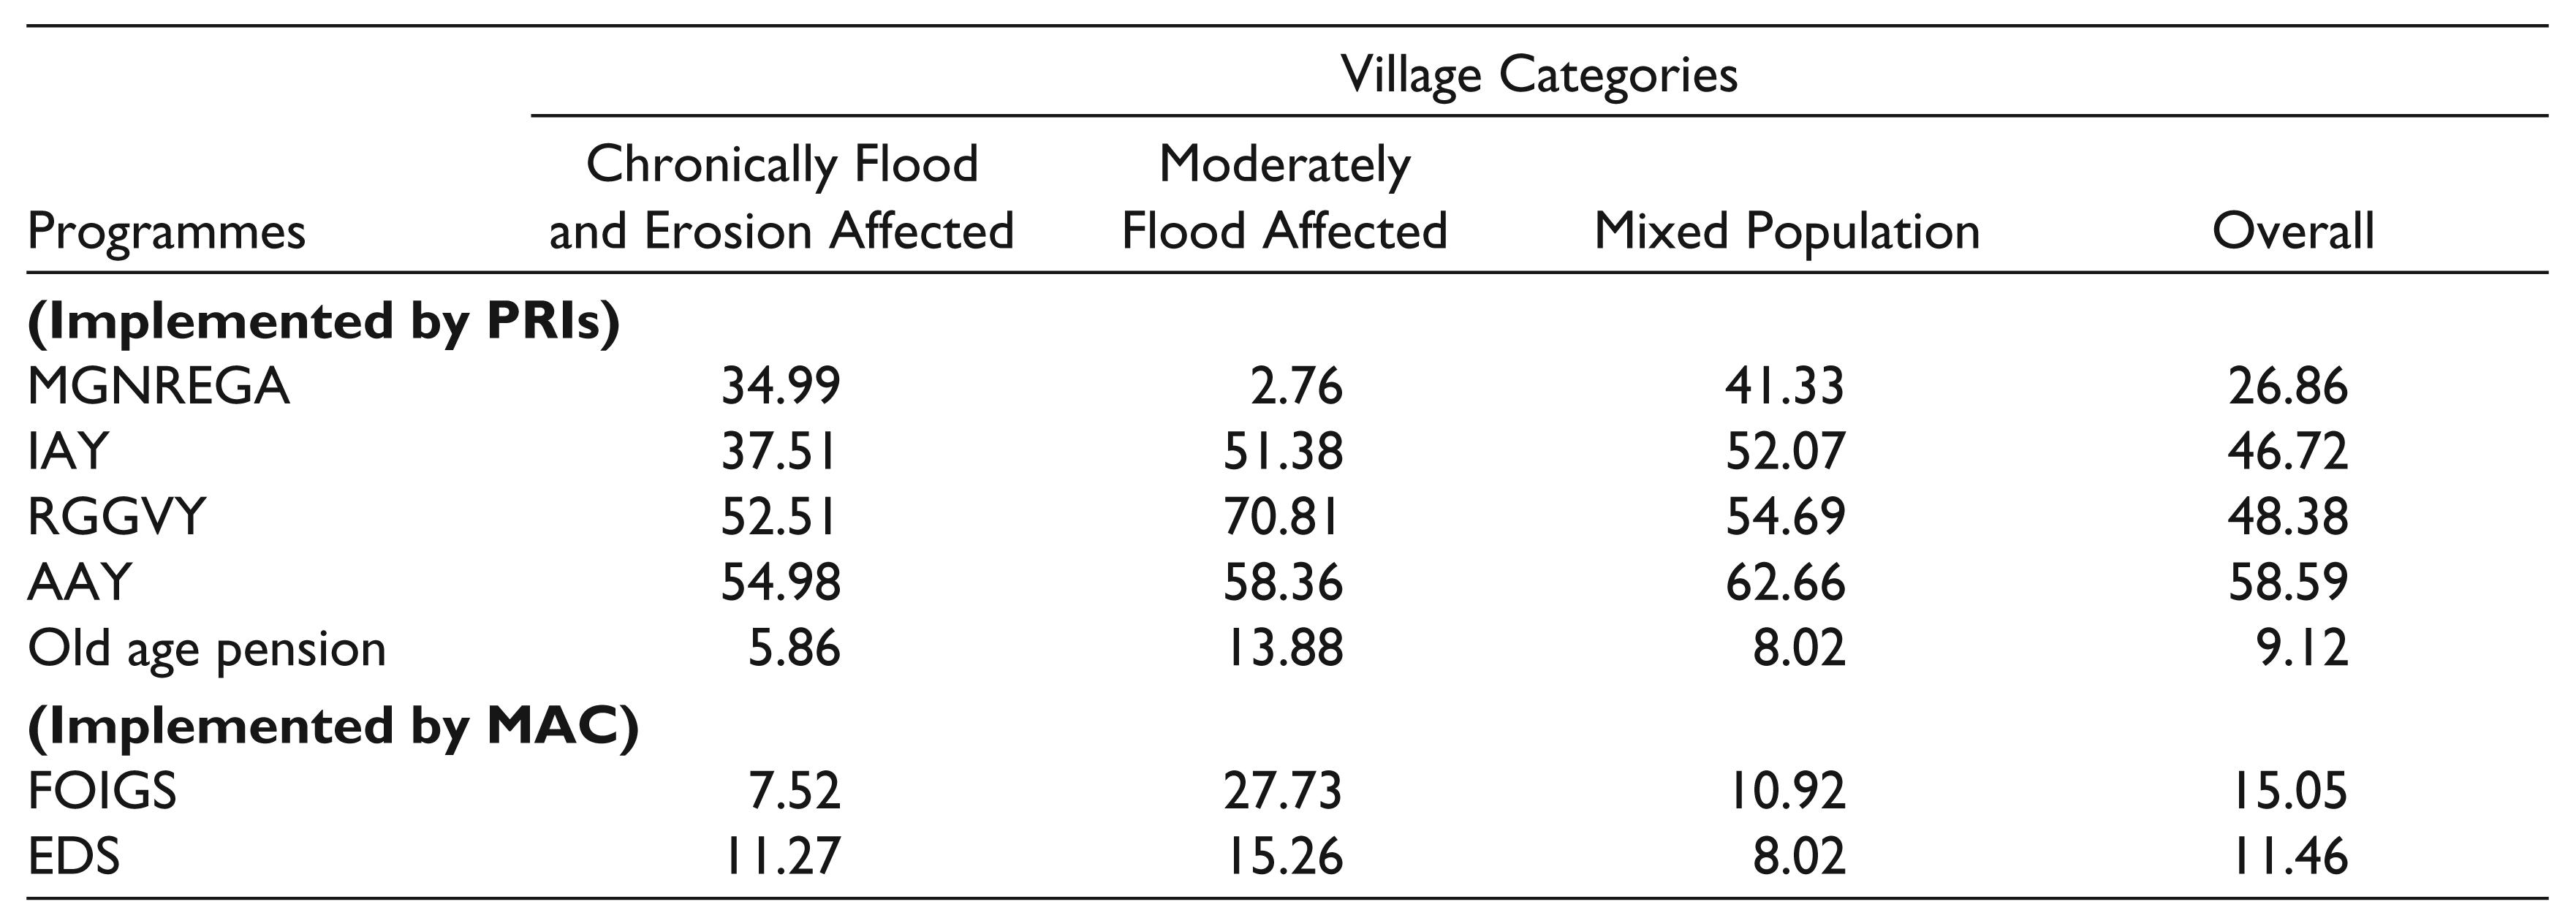
The present study also aimed to investigate the delivery and impact of special programmes and schemes for uplifting the socio-economic status of the tribe. Apart from the usual rural-oriented development programmes—such as Mahatma Gandhi National Rural Employment Guarantee Scheme (MGNRES), Indira Awaas Yojana (IAY), etc.—there are special schemes, namely, “Family Oriented Income Generating Scheme” (FOIGS) and “Educational Development Schemes” (EDS) meant specifically for STs people. Percentages of sample households in the surveyed villages receiving benefits under these programmes are shown in Table 13. Coverage of the programmes meant specifically for tribes has had fairly limited reach in the sample villages. Overall, only 15.05 per cent and 11.46 per cent of the sample households were found to have received benefits under FOIGS and EDS, respectively. In contrast, implementation of general rural development schemes has had better coverage. For instance, the percentage of households availing IAY and MGNREGS were 46.72 and 26.86, respectively. The difference in the implementation of the two types of programmes reflects difference in the effectiveness of the two agencies entrusted with the execution of the programmes. While the usual rural-oriented development programmes are implemented under Panchayati Raj Institutions (PRIs), the specialized tribal-oriented programmes are implemented for the Misings tribe by the Mising Autonomous Council (MAC). 5 Awareness about the schemes implemented through MAC was found to be rather limited among sample households. It is therefore not surprising that the coverage of these programmes has also remained limited. Relatively better coverage of the development schemes implemented by the PRIs indicates that the functioning of the PRIs such as the gram panchayat has been more effective than the specialized institution for the community, namely the MAC.
Percentage of Sample Households Availing Benefits of Government Schemes Across Village Categories
Conclusion
The Misings in Assam have made steady progress in educational attainment since 1971. By 2011, the literacy rate among the Misings nearly caught up with that of the tribes of the state in general and also of the overall population of the state. Among the available development indicators, the progress in literacy over the period has been most remarkable. Workforce participation rate has somewhat declined among both the males and females of the tribe which may indeed be an indicator of progress as explained earlier. While the sex ratio among the Misings has remained higher than the sex ratio for the state of Assam as a whole, the ratio has been somewhat lower for the Misings than all tribes’ average. While the overall sex ratio recorded significant improvement from 1991 through to 2011 among the Misings as well as the other population groups of the state, there was a disturbing decline in the child sex ratio in the state during the same period. Indeed, the decline was sharper for the Misings than for the state as a whole.
Census data also show that there is a slow shift of occupational pattern away from cultivation, towards non-agricultural occupations. The survey data from the villages confirm that the spread of education has been the significant dynamic force in the developmental transition of the tribe. Near universal enrolment of boys and girls in the age group of 6 to 16 years and significant share of allocation in household consumption expenditure on child education augur well for taking this transition process forward. The consumption expenditure pattern also confirms sustenance of traditional social capital with continued household allegiance to the village community. On the other hand, the stereotypes like tribal households squandering away income in intoxication is contradicted by grass roots inputs.
On the whole, the signs of developmental transitions among the Misings are clearly visible. Yet within the tribe, those who are more vulnerable to floods and erosion are relatively disadvantaged and have been lagging behind in the developmental parameters such as access to sanitization, incidence of diseases like malaria, extent of immunization of children, size of landholding and access to institutional finance. Policy intervention is needed to offset the greater disadvantages of the population living in inaccessible pockets, to which the basic services cannot be effectively delivered by conventional modes. The developmental transition among the Misings and their convergence to the average level of development of the state is already under way. The process seems to be driven by forces such as the spread of education and resulting occupational diversification. To make this process more inclusive, institutional strengthening for better delivery of health care and other basic services is the need of the hour.
Appendices
Appendix 1
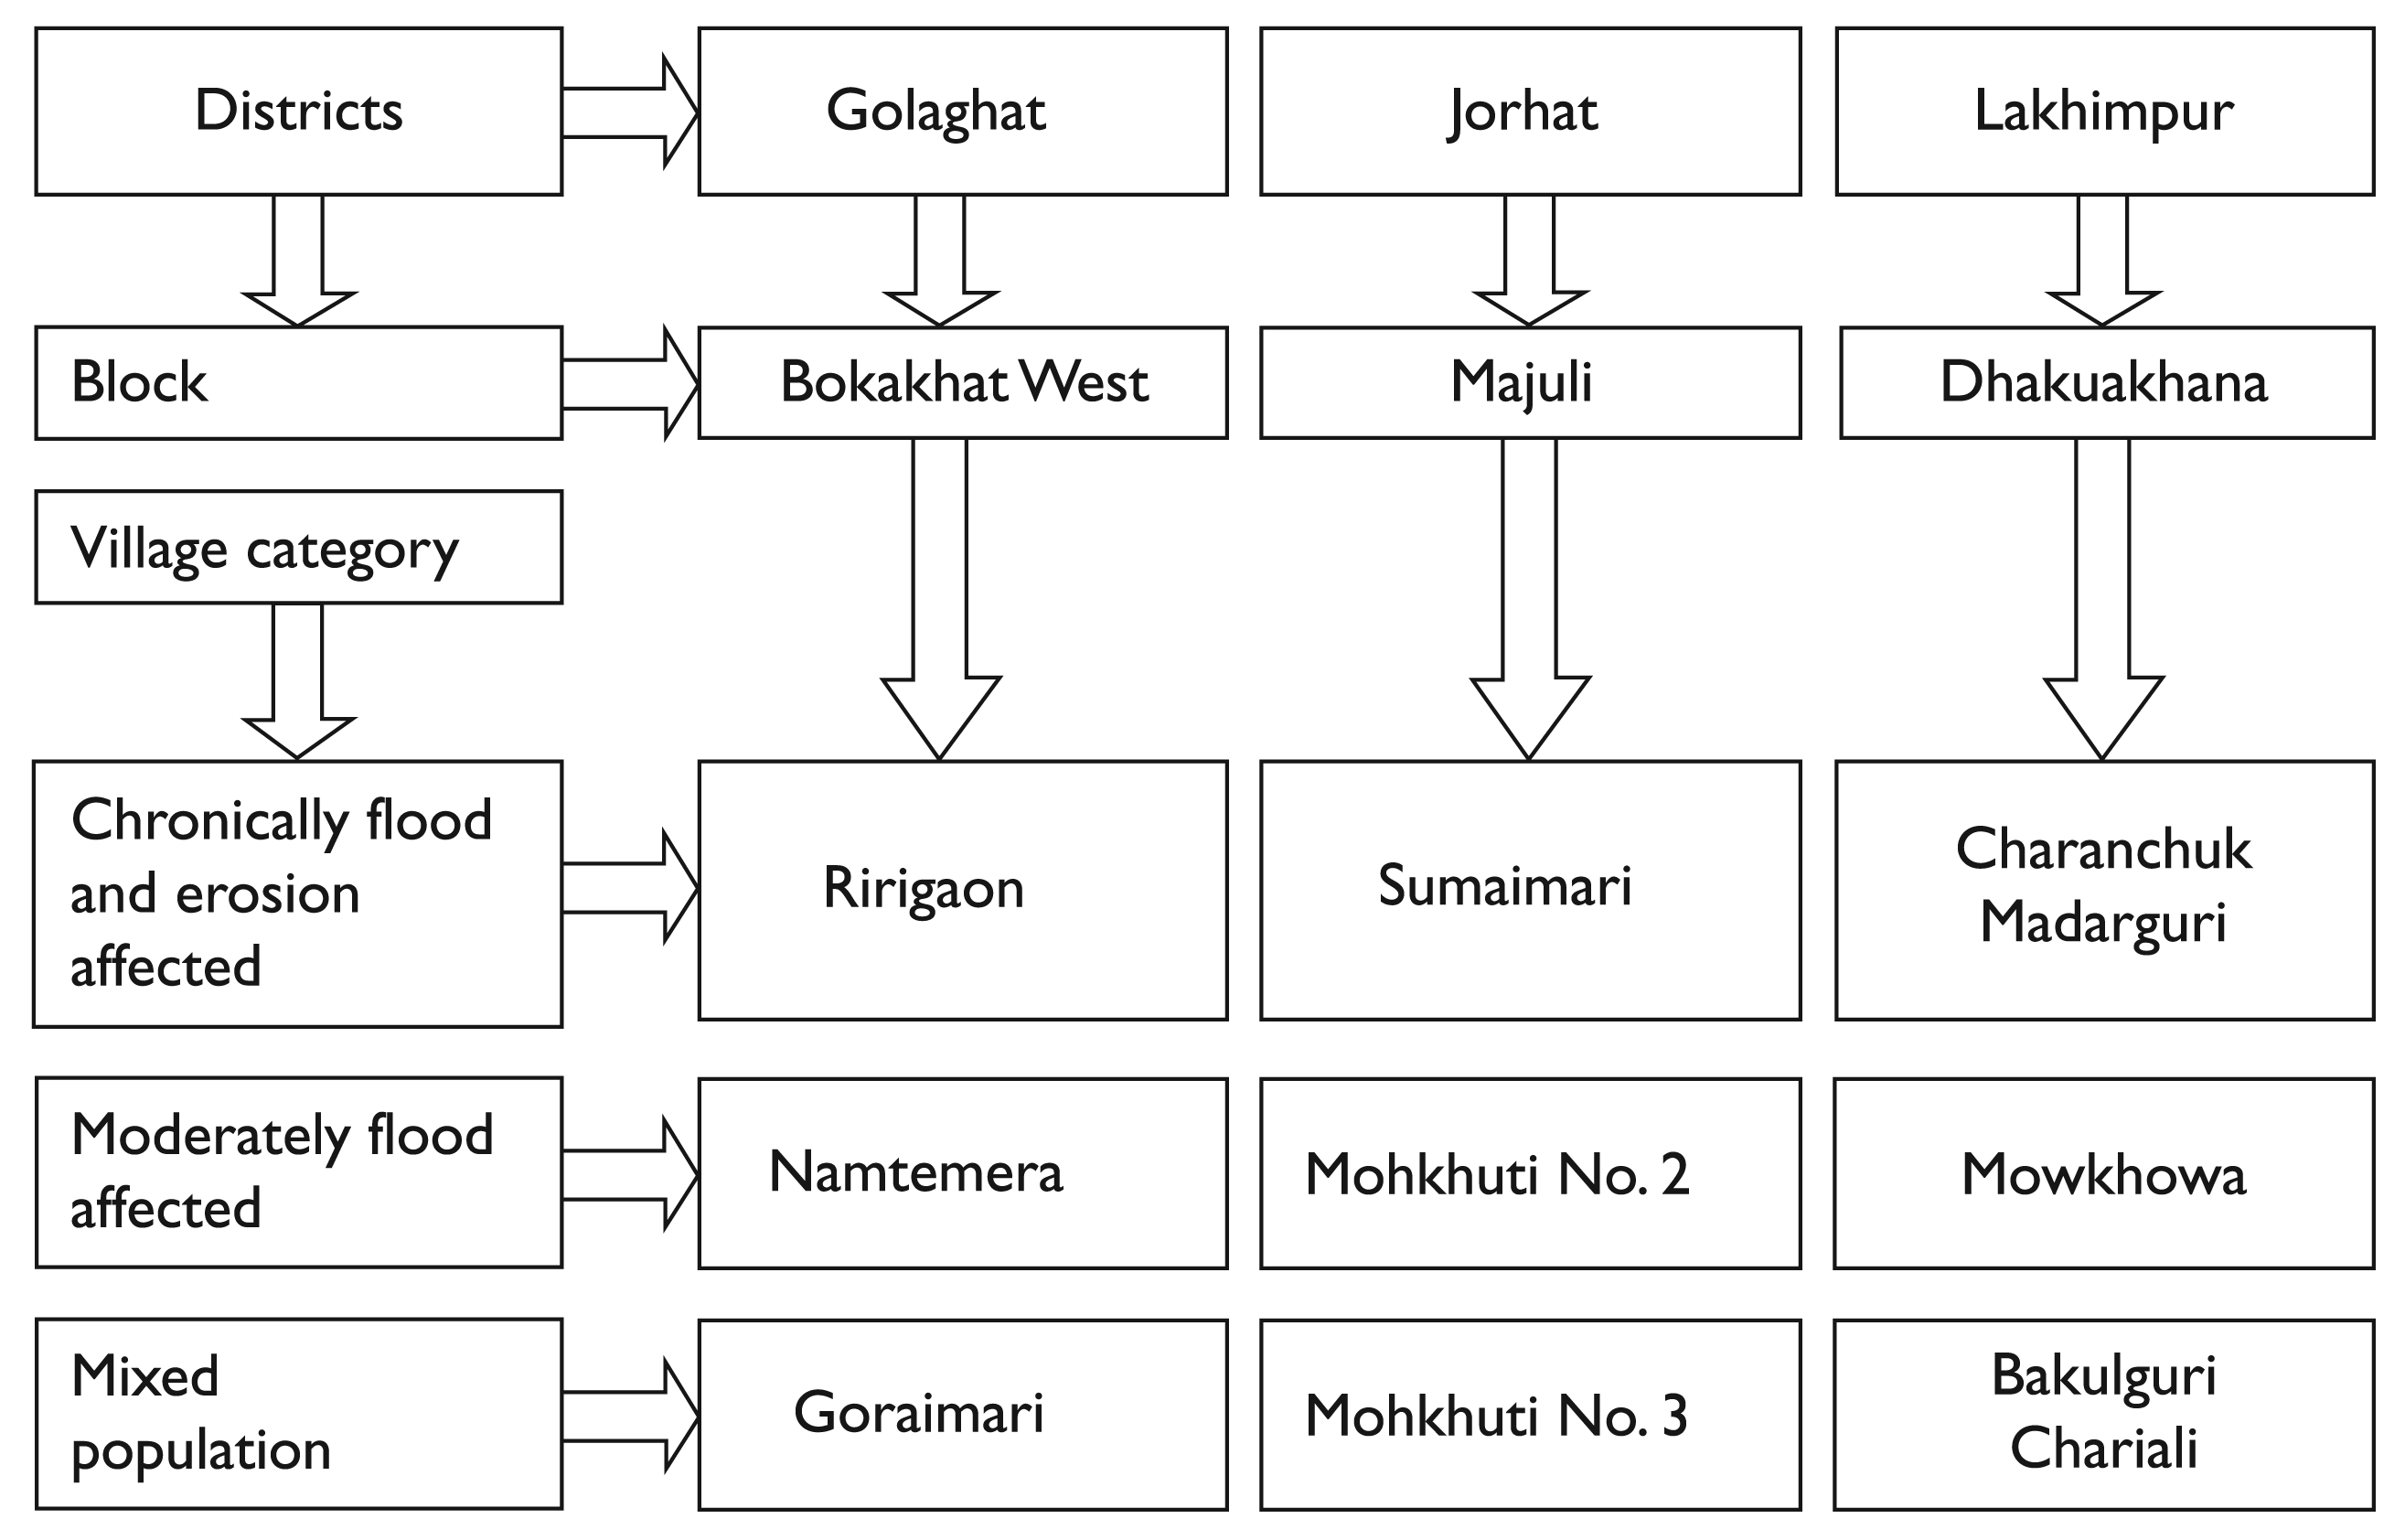
The broad location of the field investigation consisted of eight contiguous districts comprising the upper Brahmaputra Valley which have sizable concentration of the Misings population. The sample has been selected following a multistage selection procedure. At the first stage, three districts, namely, Golaghat, Jorhat and Lakhimpur have been purposively selected. Lakhimpur is on the north bank of the Brahmaputra and Golaghat is on the south bank. Jorhat district contains Majuli, the largest river island in the world in which the Misings constitute nearly a half of the population. In the second stage, one development block from each of the three districts has been selected on the consideration of high concentration of the Misings population. From each of these blocks, three villages were selected on the consideration of representing the three broad types of habitats of the Misings population—chronically flood- and riverbank erosion-affected habitats, moderately flood-affected habitats, and habitats with mixed population of the Misings households and households belonging to other communities. The purpose for selecting this third category of villages is to see if exposure to ways of life of people of other communities has had any distinct impact on the lives and practices of the Misings there. The sample procedure up to the village level and names of the selected villages are presented in the following chart.
Results from Alternative Ordered LOGIT Regression of Occupational Diversity
Appendix 2
Robustness Check of the Ordered LOGIT Regression Results
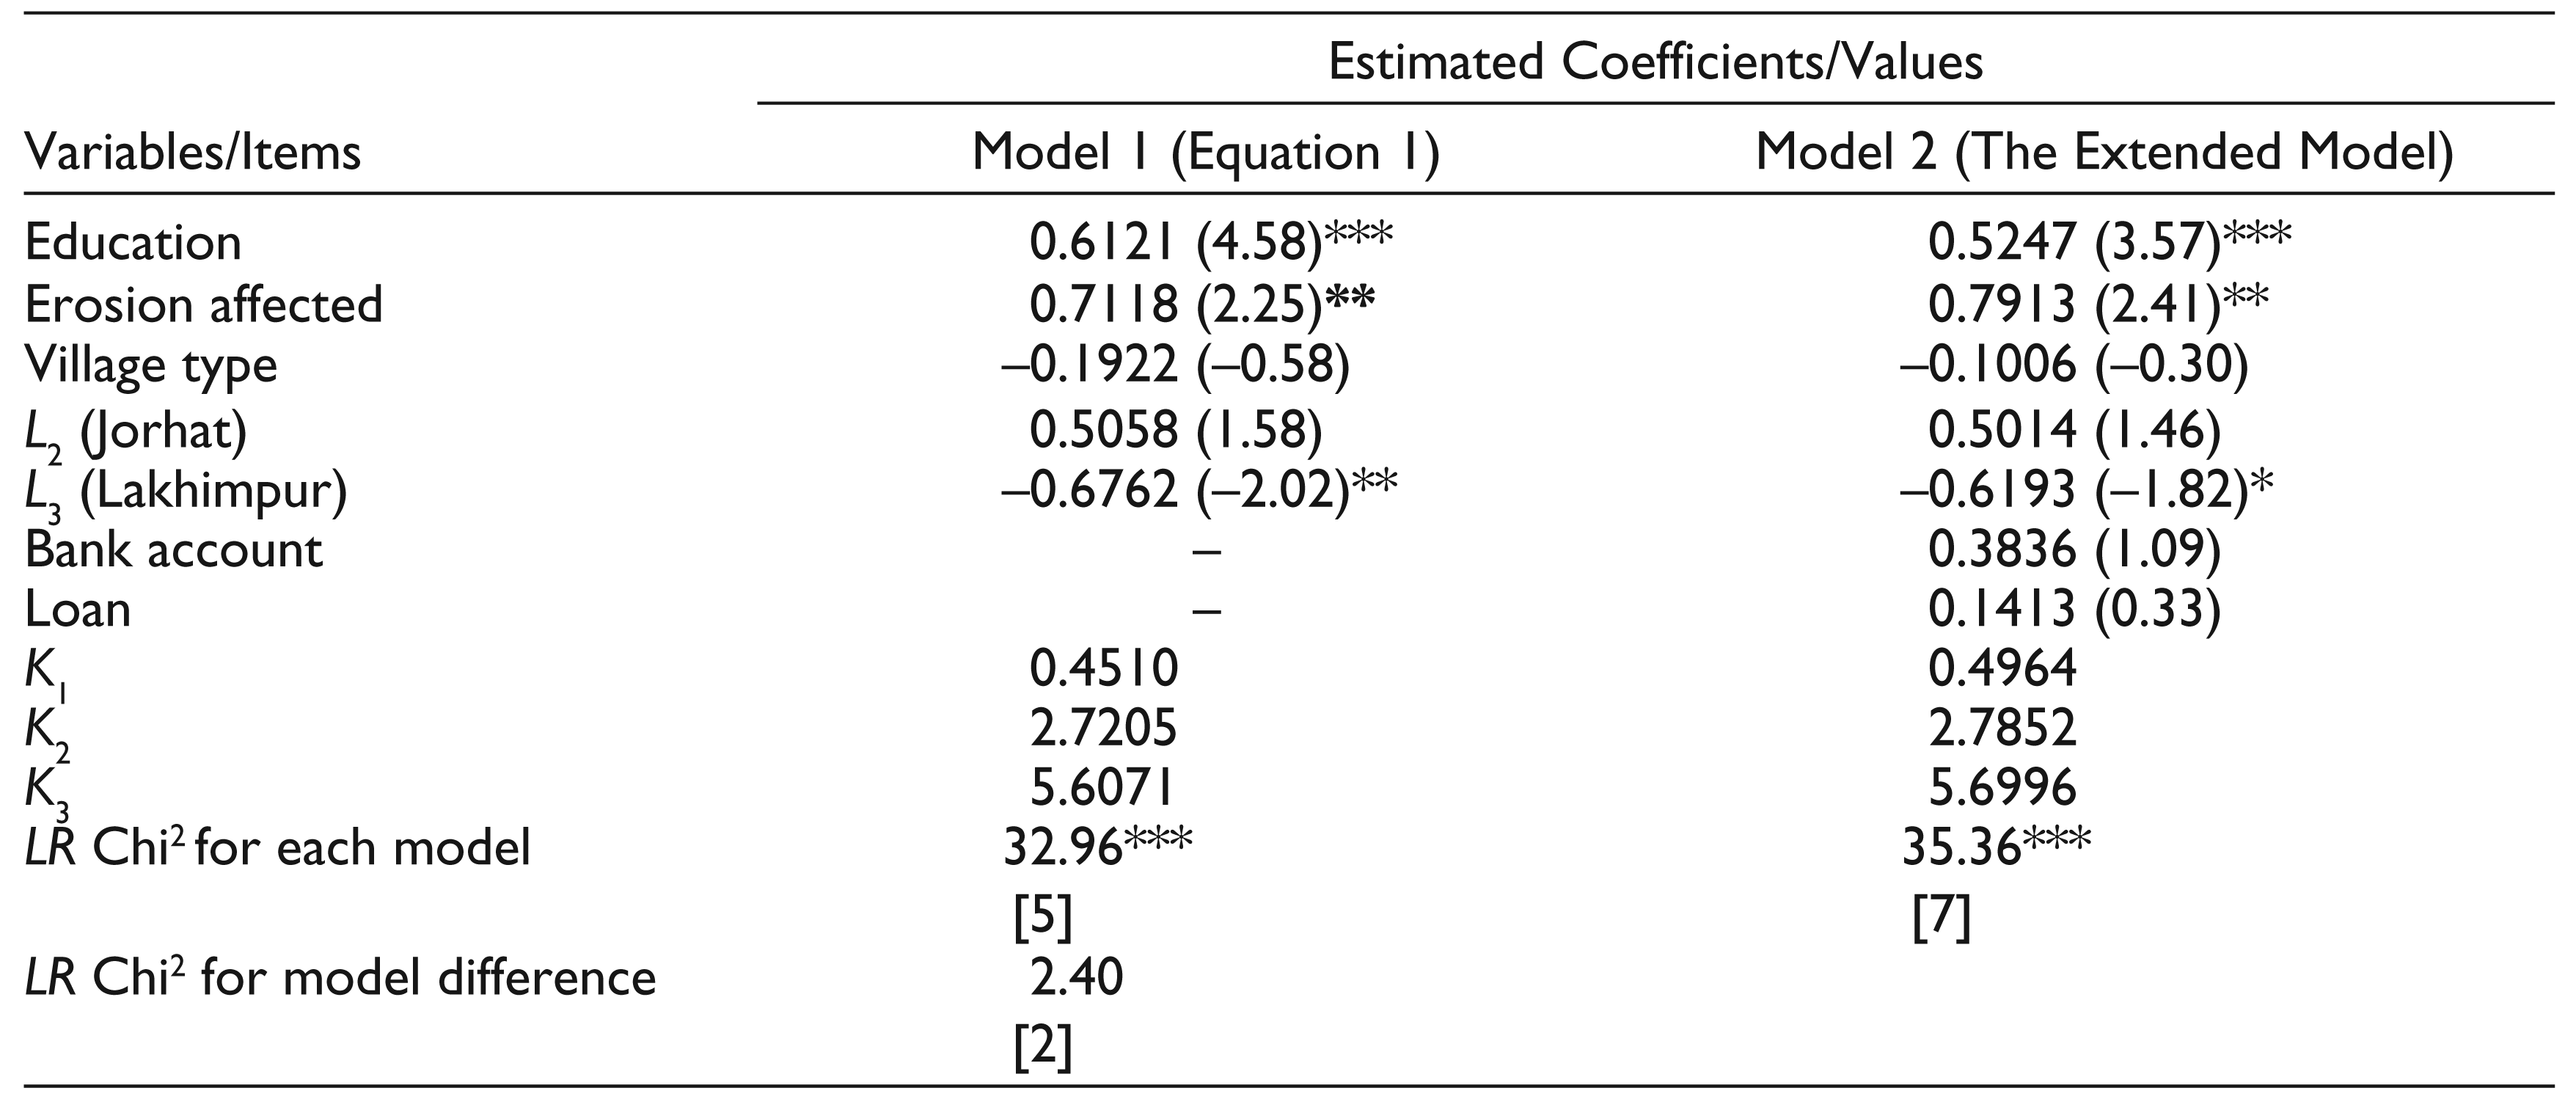
To check the robustness of the results of the Ordered LOGIT Regression reported in Table 12, an extended model was also run. Two new dummy variables, namely, bank account and loans have been introduced in the extended model. Thus, households having a bank account have been given “1” and “0” otherwise. Similarly, households having access to loan have been given “1” and “0” for otherwise. Comparative results of the two modes are reported in Table A1.
The results of the extended model are in accordance with our initial model. The extended model also reveals significant effect of education in transition to higher occupational categories. Similarly, EE and the location dummy L3, which takes value “1” for Lakhimpur district and “0” otherwise are also found to be statistically significant factors in the occupational shift among the Misings in the study area. Coefficients of both of the additional variables, that is, bank account and loans are found insignificant. Thus, the regression results presented in Table 12 are found fairly robust and stable.
Declaration of Conflicting Interests
The authors declared no potential conflicts of interest with respect to the research, authorship and/or publication of this article.
Funding
The authors received no financial support for the research, authorship and/or publication of this article.
Footnotes
Acknowledgements
The authors are thankful to the anonymous reviewers for the useful comments and the editors for accepting the revised version of the paper.