





Abstract
This article aims to estimate a forward-looking reaction function for the Central Bank of the Republic of Turkey (CBRT) considering possible asymmetries in the reaction function. For this purpose, it uses quarterly data over the period 2006:1–2018:1 and performs the nonlinear autoregressive distributed lag (NARDL) cointegration test. The findings obtained from the NARDL test indicate that the CBRT has an asymmetric reaction function and considers increases in inflation and decreases in output while adjusting short-term interest rates. Theoretical and practical implications for these findings are also discussed.
JEL Classification: C22, E52, E58
Keywords
Introduction
To avoid inflation caused by time inconsistency, 1 a monetary policy strategy usually relies on a nominal anchor which is also an intermediate target. This intermediate target prevents the central bank from raising output by applying unexpected expansionary monetary policy (Mishkin, 2004; Mishkin & Posen, 1997). In the monetary economics literature, it is widely accepted that monetary policy is more efficient when there exists a nominal anchor and the public understands the nominal anchor well (Bernanke, Laubach, Mishkin, & Posen, 2001). A central bank that implements a monetary policy strategy tries to affect the intermediate target through its policy tools and expects this intermediate target in turn to affect the ultimate target, namely inflation. The reasons why a central bank needs an intermediate target are (i) that it cannot directly control inflation, and (ii) monetary policy has a lagged effect on inflation (Belke & Polleit, 2009).
After the breakdown of the Bretton Woods system in 1973, monetary targeting suggested by the Monetarist School (Brunner, 1968; Friedman, 1968) became very popular for central banks, and many of them adopted it (Bofinger, Reischle, & Schachter, 2001). Monetary targeting, which is essentially based on the quantity theory of money, uses a monetary aggregate, namely the monetary base, M1, M2, or M3, as the intermediate target and the central bank manipulates this monetary aggregate under the monetary targeting strategy. For the monetary targeting to be successful, some conditions must be fulfilled: (i) the central bank must control the monetary aggregate well, and (ii) there must be a strong relationship between the monetary aggregate and inflation. On the other hand, new fiscal instruments developed in the 1980s and high volatility in the velocity of money in many countries as a result of financial liberalisation have made the control of monetary aggregates very difficult for central banks and weakened the relationship between monetary aggregates and inflation (Mishkin, 1997; Mishkin & Posen, 1997). Therefore, many central banks adopting monetary targeting in the 1970s abandoned the strategy in the 1980s (Mishkin & Posen, 1997).
As a result of the view that monetary policy can be implemented more efficiently with the existence of a nominal anchor, many countries have begun to adopt an inflation-targeting strategy since it was first introduced in New Zealand in 1990. Under such a strategy, a central bank (i) announces an explicit inflation target, (ii) tries to reach this target by using all available information, and (iii) tries to affect inflation expectations as there is a positive and high correlation between inflation expectations and inflation rates (Svensson, 1997, 2000). Accordingly, inflation expectations become the intermediate target for the inflation-targeting strategy.
The main policy instrument of the central bank is the short-term (overnight) interest rate, and the central bank tries to influence long-term interest rates on bonds, credits, and deposits by controlling short-term interest rates. If a central bank considers output stability along with low inflation rates, so that its loss function includes both the output gap (the difference between actual gross domestic product [GDP] and potential GDP) and the difference between the inflation rate and inflation target, then the inflation-targeting regime is denominated as a flexible inflation-targeting regime (Svensson, 1998). Within this scope, the reaction function of a central bank indicates how it steers short-term interest rates according to changes in inflation and the output gap (Bulut, 2016). In his pioneering work, Taylor (1993) shows the interest rate adjustments of the Federal Reserve with regard to changes in the inflation and output gap. Clarida, Gali, and Gertler (1998) suggest a New Keynesian forward-looking reaction function including the expected inflation rate instead of the actual inflation rate, as Taylor (1993) uses values for variables at the current period and does not consider the lagged effect of monetary policy on inflation. Subsequently, Clarida, Gali, and Gertler (2000) propound a reaction function that considers monetary policy has lagged effects on both inflation and the output gap. There has been an expanding empirical literature on the estimation of reaction functions of central banks especially since the works of Taylor (1993) and Clarida et al. (1998).
From the empirical literature on the estimation of monetary policy reaction functions, it is clear that the greater part of the literature has assumed a quadratic loss function for central banks including the squares of the difference between inflation and the inflation target and of the output gap (Aragon & Medeiros, 2013; Dolado, Maria-Dolores, & Naveira, 2005; Hasanov & Omay, 2008). Put differently, these papers have focussed on the estimation of a linear reaction function by neglecting the possible asymmetric behaviour of central banks (Bec, Salem, & Collard, 2002; Oge-Guney, 2018). However, some papers in the monetary economics literature argue that a central bank may have asymmetric preferences for output and inflation when monetary policy is under the influence of a government with short-term goals, whose priority is to stabilise output and employment (Cukierman, 2000). Within this scope, Bec et al. (2002) denote that monetary policy may be affected by business cycles even though the central bank’s independency is guaranteed by law. For instance, it seems to be easier to pursue the price stability objective when output is above its potential level.
After these studies, some papers have considered possible asymmetries in the monetary policy reaction functions of some central banks (see, e.g., Apergis & Payne, 2018; Bec et al., 2002; Bruggemann & Riedel, 2011; Caporale, Helmi, Catik, Ali, & Akdeniz, 2018; Dolado et al., 2005; Hasanov & Omay, 2008; Kim, Osborn, & Sensier, 2005; Klose, 2011; Oge-Guney, 2018; Ruge-Murcia, 2004; Surico, 2007, among others). Most of these papers have employed a threshold model by selecting output or inflation as the threshold variable to examine the possible asymmetric preferences of central banks for output and inflation. Accordingly, while some of them used output as the threshold variable and estimated a monetary policy reaction function for economic expansion and recession periods, others selected inflation as the threshold variable and estimated reaction functions in high inflation and low inflation periods.
The goal of this article is to estimate an asymmetric reaction function for the Central Bank of the Republic of Turkey (CBRT) by following a completely different estimation methodology. To that end, it employs the nonlinear autoregressive distributed lag (NARDL) approach suggested by Shin, Yu, and Greenwood-Nimmo (2014) using quarterly data spanning the period 2006:1–2018:1.
The rest of the article is organised as follows: Section 2 presents an overview of monetary policy in Turkey after the 2001 economic crisis. Section 3 provides the empirical literature on the reaction function of the CBRT along with the contribution of the paper to the monetary economics literature. Section 4 introduces the model and dataset. Estimation methodology and findings are depicted in Section 5. Section 6 concludes the article.
Overview of Monetary Policy in Turkey Since the 2001 Crisis
The Turkish economy experienced high budget deficits, very high inflation rates, great uncertainty, and economic crises in the 1990s. At the end of the 1990s, the Turkish government decided to implement an International Monetary Fund (IMF)-supported stabilisation programme, including both monetary targeting and exchange rate targeting, for the period 2000–2002. As the economy did not have strong macroeconomic fundamentals and the banking sector had serious maturity and currency mismatches, Turkey faced two economic crises in November 2000 and February 2001, respectively. After the crisis in 2001, the CBRT announced it had given up exchange rate targeting, floated the Turkish Lira (TL), and said it would adopt an inflation-targeting strategy in the following years. On 25 April 2001, the CBRT’s law was amended to say that: (i) its main primary objective was to maintain price stability, (ii) it would determine monetary policy tools to maintain price stability, and (iii) it could not directly lend to the Treasury and to other government institutions, or purchase bonds issued by the Treasury in the primary market.
On 2 January 2002, the CBRT announced that it had begun to implement a new monetary policy framework by adopting a forward-looking approach and that the new regime could be denominated as an implicit inflation-targeting strategy. The Turkish government sent a letter of intent to the IMF on 18 January 2002, indicating that the CBRT would follow an inflation-targeting strategy after some preconditions were fulfilled. 2 In a report published by the CBRT, it was stated that (i) the implicit inflation-targeting strategy was a convergence strategy to the inflation-targeting strategy; (ii) the CBRT would set an inflation target and announce this target under the implicit inflation-targeting strategy; (iii) the main policy tool would be the short-term interest rate; and (iv) monetary policy would focus on future inflation rates (CBRT, 2006). The main difference between an inflation-targeting strategy and the implicit inflation-targeting strategy was that the CBRT would have another target, namely the monetary base, along with the inflation target. With the implicit inflation-targeting strategy, the inflation rate fell from 29.7 per cent to 7.7 per cent in Turkey between 2002 and 2005. Further, the inflation rates remained below the targets over the years 2002–2005 (see Table 1).
In 2006, the CBRT adopted an inflation-targeting strategy, and this period can be classified into two sub-periods. The ultimate goal of the CBRT was to maintain price stability, so it used monetary policy instruments to achieve its inflation targets from January 2006 to October 2010. Throughout this period, the inflation rate in Turkey decreased except in 2008, when the crisis in the US financial markets progressed into a global and real sector crisis. Turkey’s inflation rate fell from 9.7 per cent in 2006 to 6.4 per cent in 2010. However, it was above the targets in 2006, 2007, and 2008. Additionally, the growth rates of the Turkish economy were, respectively, 0.8 per cent and −4.7 per cent in 2008 and 2009, as a result of the global crisis.
In October 2010, the CBRT noted that the marked appreciation of the TL against foreign currencies and the rapid credit growth stemming from the reductions in interest rates and quantitative easing policies in developed countries had resulted in increases in the macroeconomic risks and current account imbalances in Turkey (CBRT, 2011). Accordingly, the CBRT substantially changed its monetary policy framework with a focus on maintaining financial stability along with price stability through short-term interest rates and macro-prudential tools such as the asymmetric interest rate corridor, required reserve ratio, and reserve option mechanism. 3 The CBRT has tried to achieve both price stability and financial stability since then. Table 1 presents some selected indicators for the Turkish economy since 2002.
Selected Indicators for the Turkish Economy, 2002 to 2017
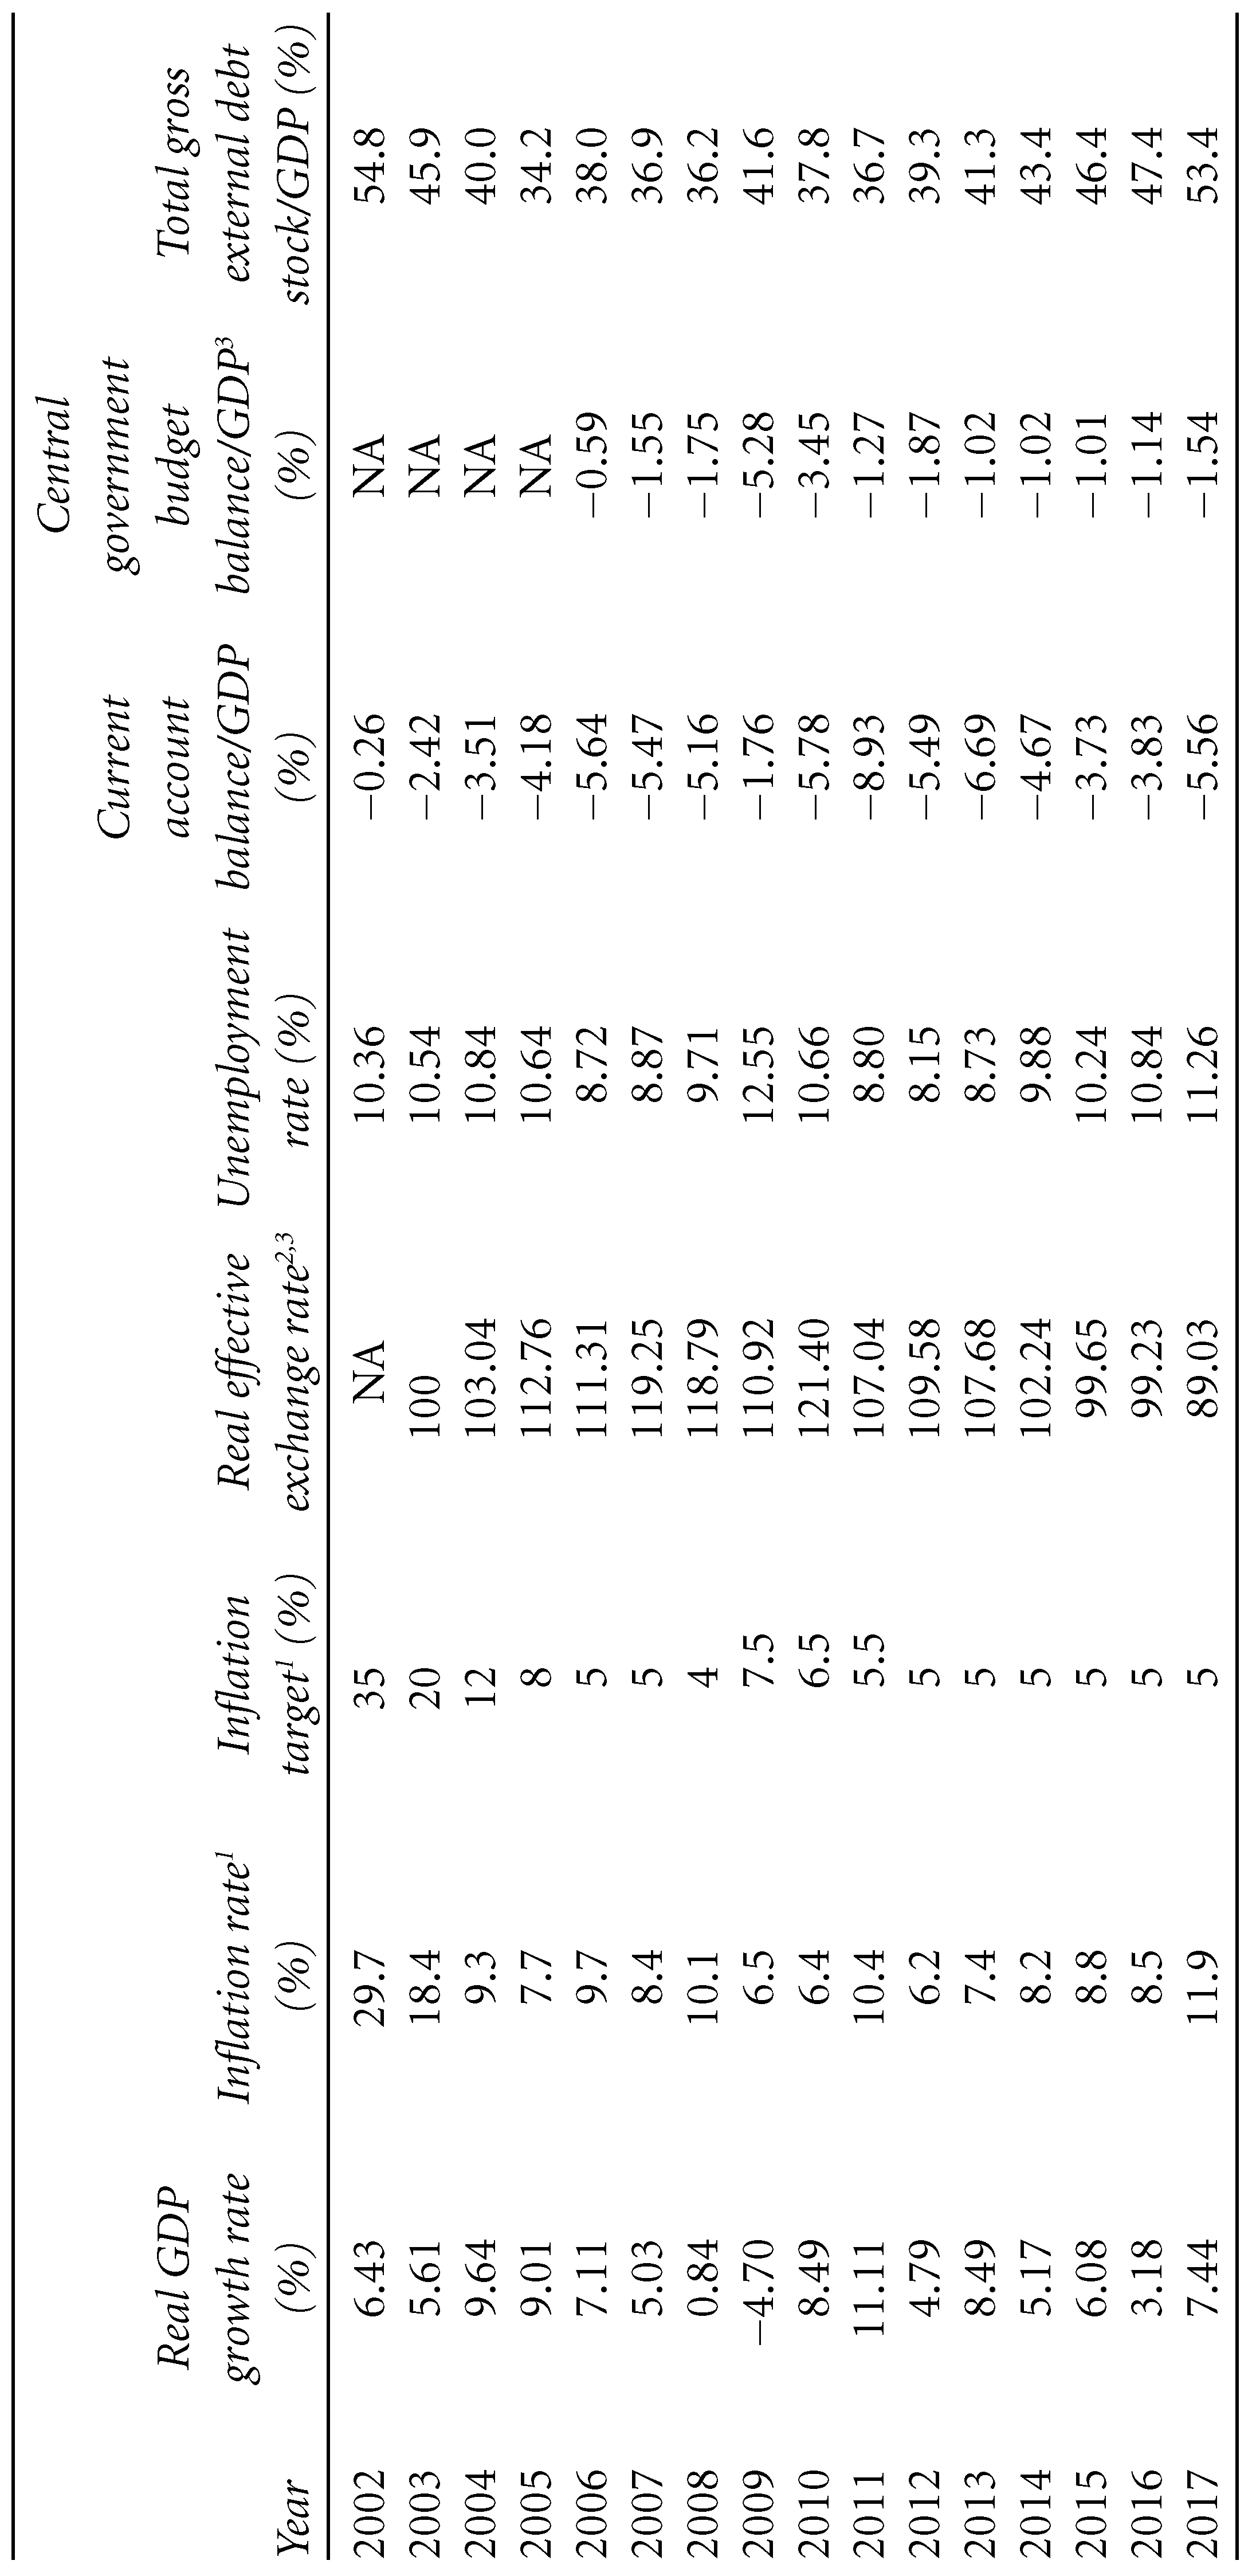
Selected Indicators for the Turkish Economy, 2002 to 2017
Some observations from Table 1 are as follows: (i) The growth performance of the Turkish economy was remarkable in some years; (ii) during inflation-targeting period, the actual inflation rate was above the inflation target in all years, except 2009 and 2010; (iii) while the TL had a tendency to appreciate during the period 2003–2010, it significantly depreciated against foreign currencies over the period 2010–2017; (iv) despite high growth rates, the unemployment rate in Turkey was always above 8 per cent throughout the observed period; (v) the economy had high current account deficits over the period 2002–2017. Given the low budget deficits of the government, these great current account imbalances can be assumed to stem mainly from the savings-investment imbalance of the private sector; (vi) finally, as is depicted in the last column of the table, the increasing current account deficits led to considerable rises in the external debt of the Turkish economy.
This article classifies the studies estimating monetary policy reaction functions for the CBRT into two groups. The first group of studies estimates a linear reaction function for the CBRT. For instance, while Berument and Malatyali (2000) found that the CBRT considers past inflation rates rather than expected inflation rates, Adanur-Aklan and Nargelecekenler (2008) concluded that it is concerned with both past inflation and expected inflation rates. Berument and Tasci (2004) found that the central bank deals with only the output gap while Yazgan and Yilmazkuday (2007) concluded that it responds to changes in both expected inflation rates and the output gap. Besides, Gozgor (2012) and Erdem, Bulut, and Kocak (2017) concluded that the CBRT considers inflation rates, the output gap, and exchange rates while adjusting short-term interest rates. Bulut (2016) discovered that the CBRT follows only expected inflation rates to adjust the short-term interest rates, while Oge-Guney (2016) deduced that it considers not only expected inflation but also growth and inflation uncertainties. Finally, Daglaroglu, Demirel, and Mahmud (2018) stated that, in the period following the new monetary policy framework, the CBRT was concerned with some global financial indicators, such as VIX (Volatility index) and EMBI (Emerging market bond index), along with inflation, output, and exchange rates.
The second group includes the papers which estimate a nonlinear reaction function for the CBRT. To the best of our knowledge, Hasanov and Omay (2008), Caporale et al. (2018) and Oge-Guney (2018) have estimated a nonlinear reaction function for the CBRT so far. While Hasanov and Omay (2008) and Oge-Guney (2018) used output as the threshold variable and estimated the CBRT’s reaction function for the expansionary and recessionary periods, Caporale et al. (2018) used the inflation rate as the threshold variable and estimated a reaction function for the CBRT during high and low inflation periods. Hasanov and Omay (2008), who use data spanning the period 1990–2000, concluded that the CBRT considers both inflation and output in both expansionary and recessionary periods. Besides, it reacts more aggressively to inflation during expansions than recessions, but more aggressively to the output gap during a recession than an expansion.
The findings of Hasanov and Omay (2008) concur with the views in the literature and imply that monetary policy in Turkey is affected by business cycles and that it appears to be easier for the CBRT to pursue the price stability objective as the economy grows. Oge-Guney (2018), using data over the period 2002–2015, found that the CBRT deals with inflation in both expansionary and recessionary periods, while it is concerned with output only in recessionary times. Additionally, the coefficient of inflation during a recession period is higher than that in expansionary periods. Put differently, the CBRT responds more aggressively to inflation during recessions than expansions. Accordingly, the findings of Oge-Guney (2018) contradicted those of Hasanov and Omay (2008) and the theoretical literature. Finally, Caporale et al. (2018), who used data for the period 2006–2015, discovered that the CBRT responds to inflation and the output gap only during low inflation periods.
At this stage, this article makes some implications. Accordingly, a central bank will be aware of that the positive coefficient of inflation, especially in slumpflation periods, may exacerbate a recession. In addition, the positive coefficient of inflation can prevent a government who has short-term goals from enjoying high growth rates during expansionary periods. Then, irrespective of whether there exists an economic expansion or an economic recession, a central bank can prioritise output and conduct monetary policy by focussing on output. More clearly, a decrease in the expected inflation rate can lead to a decrease in short-term interest rates, while an increase in the expected inflation rate may not result in an increase in short-term interest rates, or may lead to a lower increase in short-term interest rates compared to the effect of a decrease in the expected inflation rate, because the central bank may be of the view that an increase in short-term interest rates may negatively affect economic growth. The threshold models in the empirical literature are not able to investigate this possible scenario.
However, the NARDL approach can examine possible asymmetric relationships in a reaction function without considering business cycles. This method lets us empirically observe the different effects of the increases and decreases in the variables in the reaction function on the interest rates. This article therefore employs the NARDL approach to estimate an asymmetric reaction function for the CBRT. To the best of our knowledge, this is the first article performing this technique to estimate a reaction function for a central bank in the empirical literature.
Model and Data Set
Following Clarida et al. (1998), this article employs a forward-looking reaction function specified as:

where i,
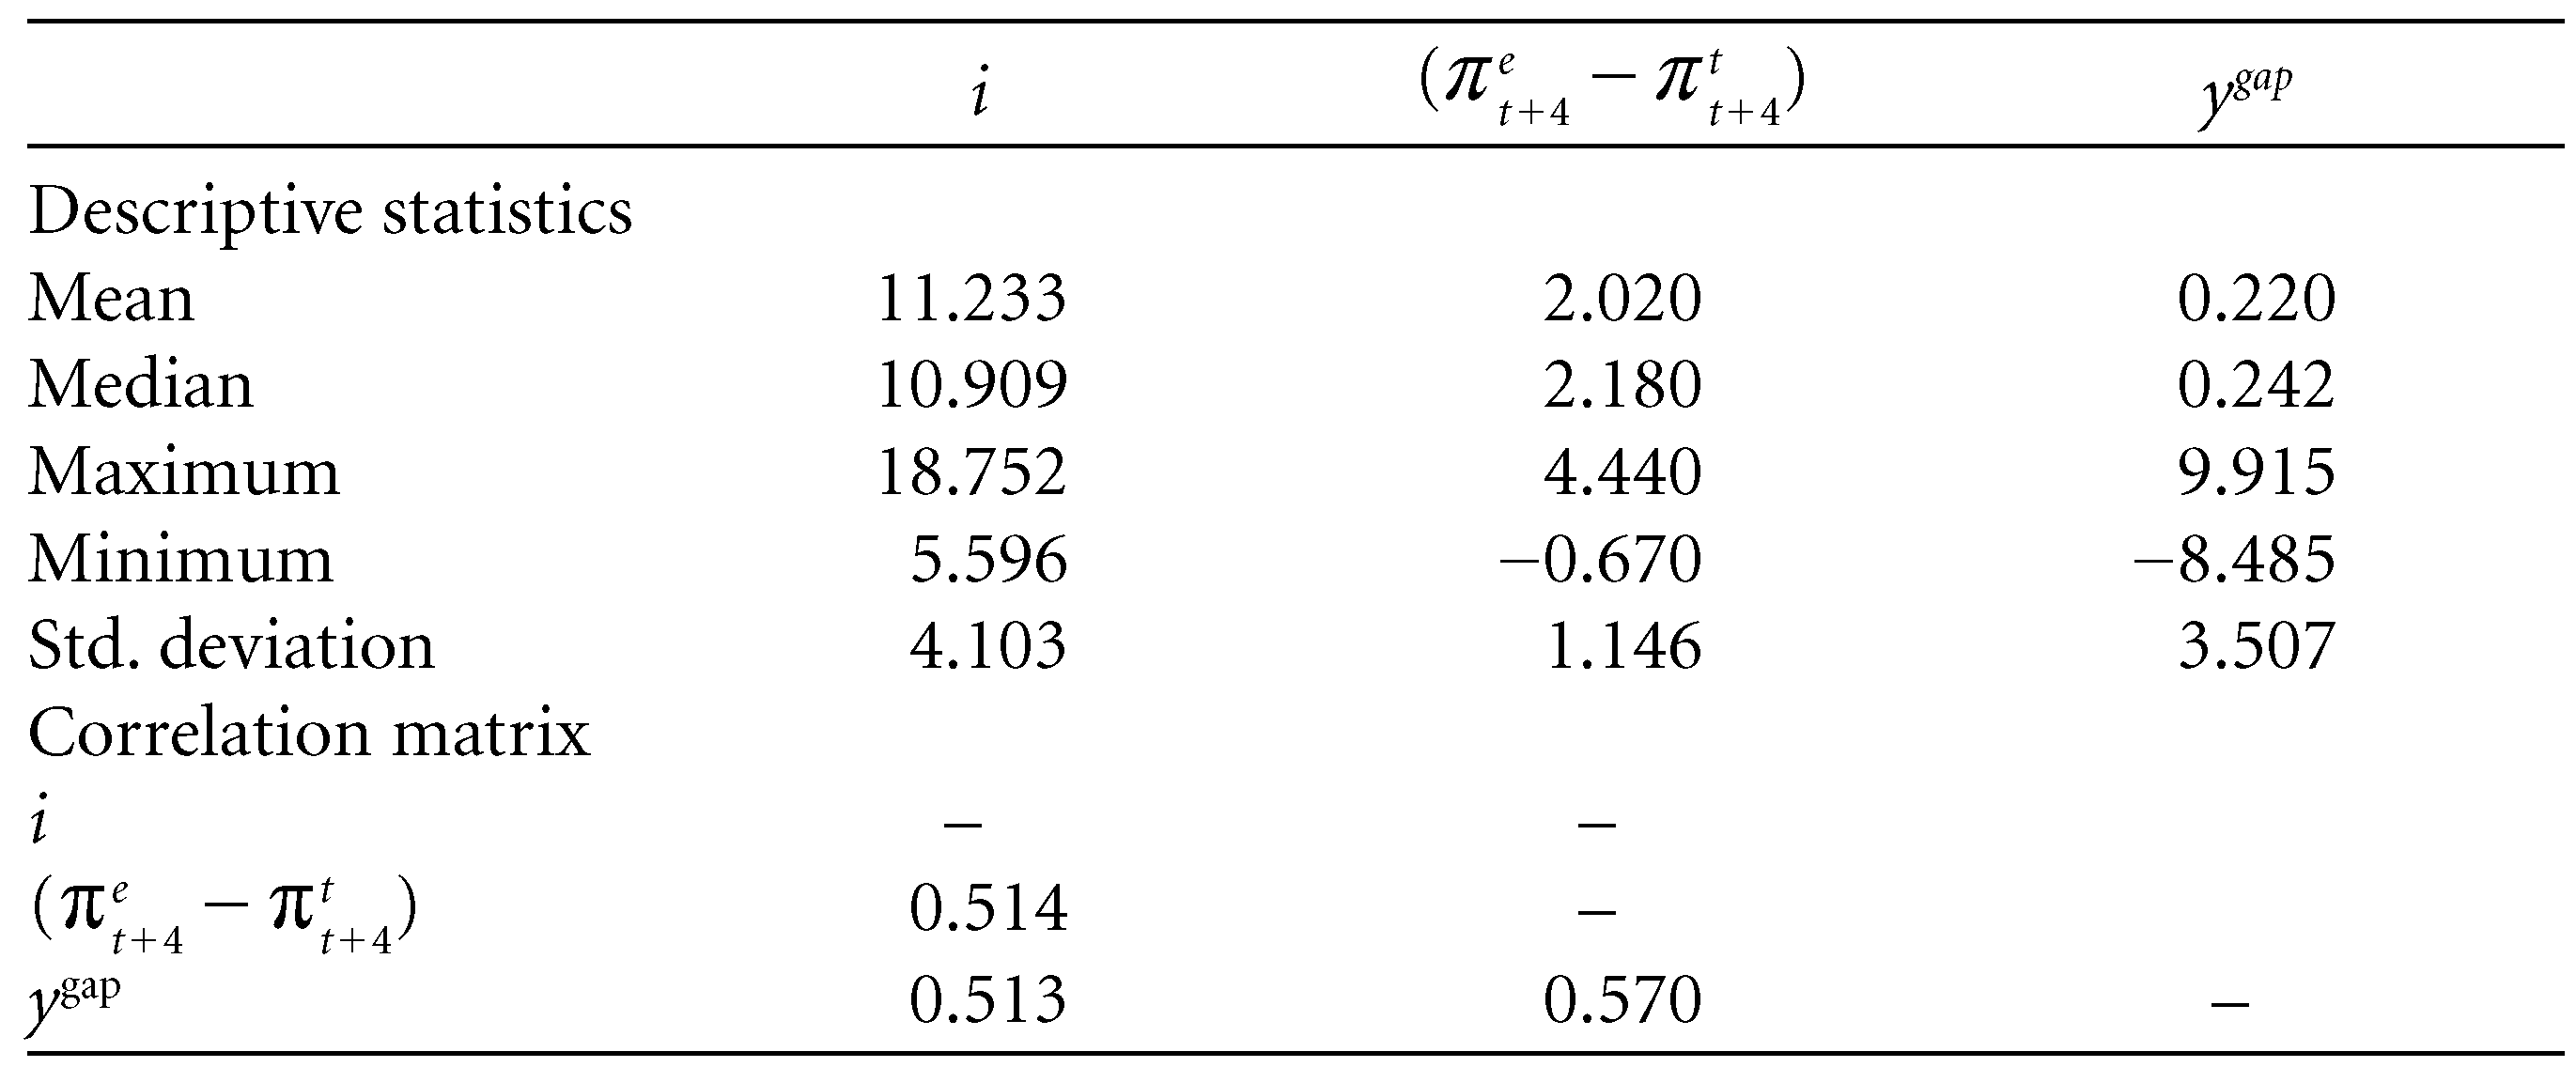
Table 2 reports descriptive statistics and correlation matrix for the variables. Accordingly, all descriptive statistics of i are higher than those of
Descriptive Statistics for the Variables
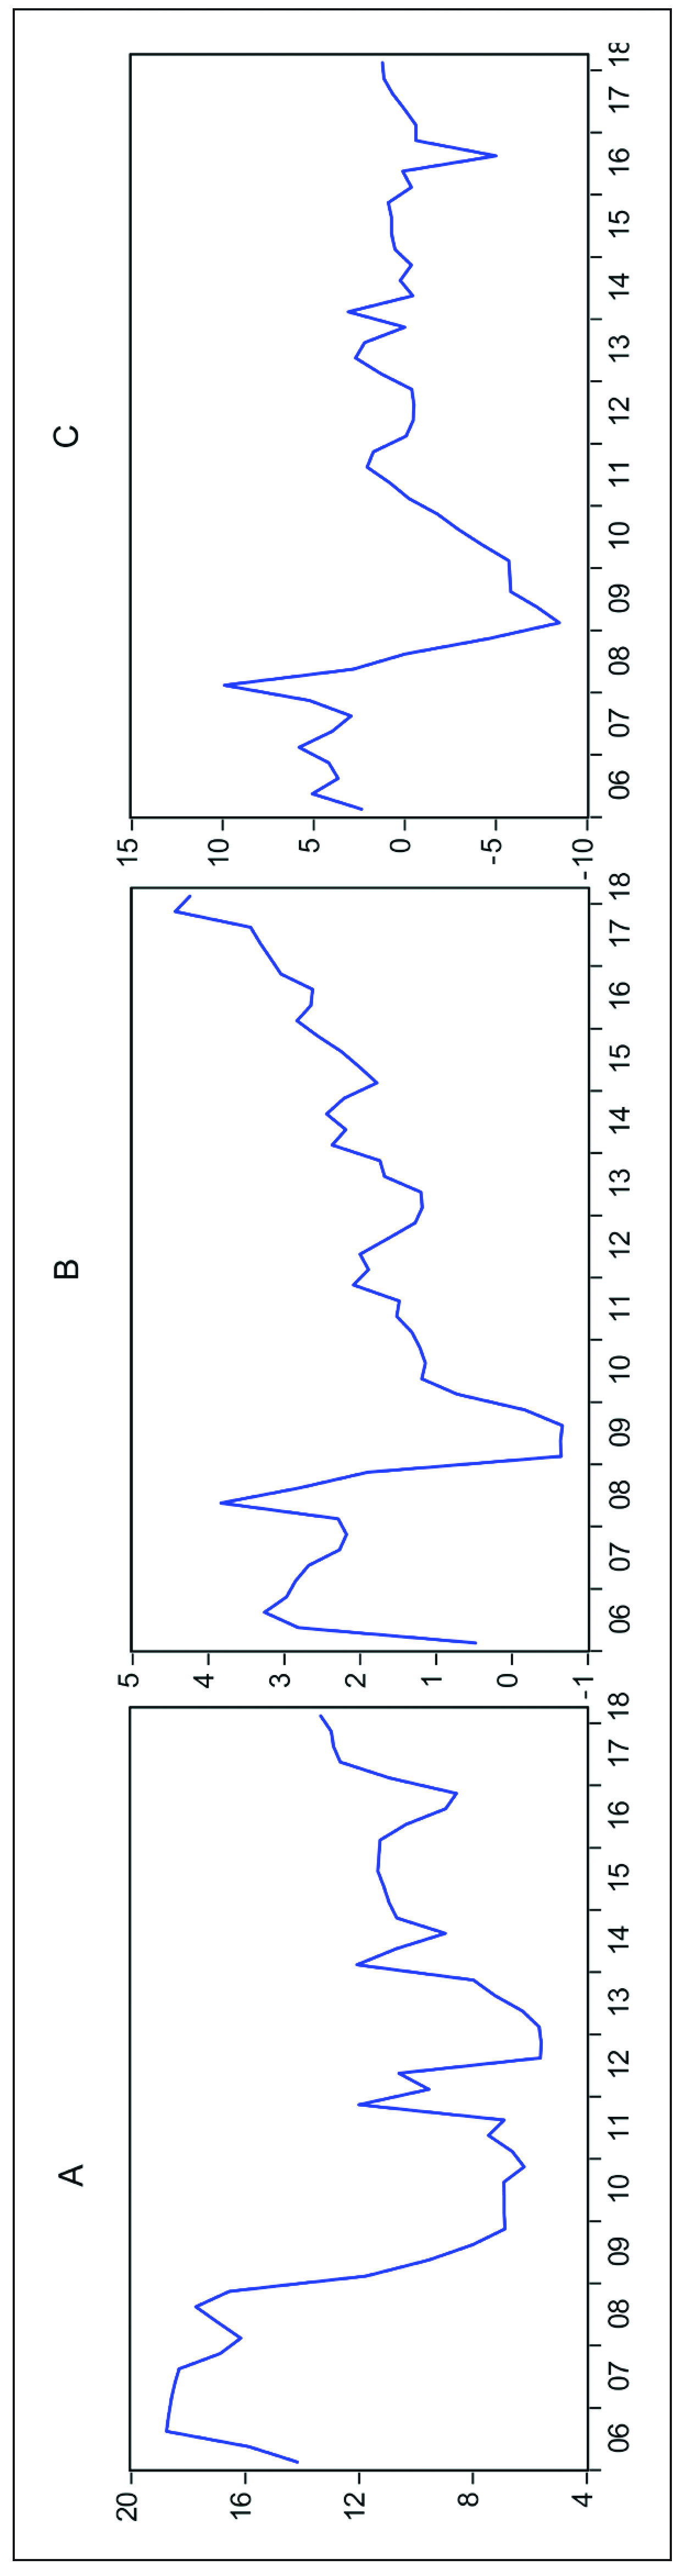
The descriptive statistics and graphical observations provide researchers with some preliminary inspection of the variables. However, researchers should consider some statistical/econometric approaches, such as unit root and cointegration tests, beyond these analyses to obtain efficient output about the relationships between the variables. Hence, the next section provides the methodology and reports the findings from these econometric approaches.
Prior to investigating the possible asymmetric cointegration relationship between the variables in the empirical model, this article employs some unit root tests to investigate the order of integration of the variables in the empirical model. The article carries out the Dickey and Fuller (1981, hereafter ADF [Augmented Dickey-Fuller]) and Phillips and Perron (1988, hereafter PP) unit root tests. These methods test for the null hypothesis of the existence of a unit root.
The findings for ADF and PP (Phillips-Perron) unit root tests are depicted in Table 3. Accordingly, the null hypothesis of a unit root can be rejected at first differences for all variables. Hence, the NARDL method can be employed in order to investigate an asymmetric cointegration relationship in the empirical model.
Unit Root Test Results
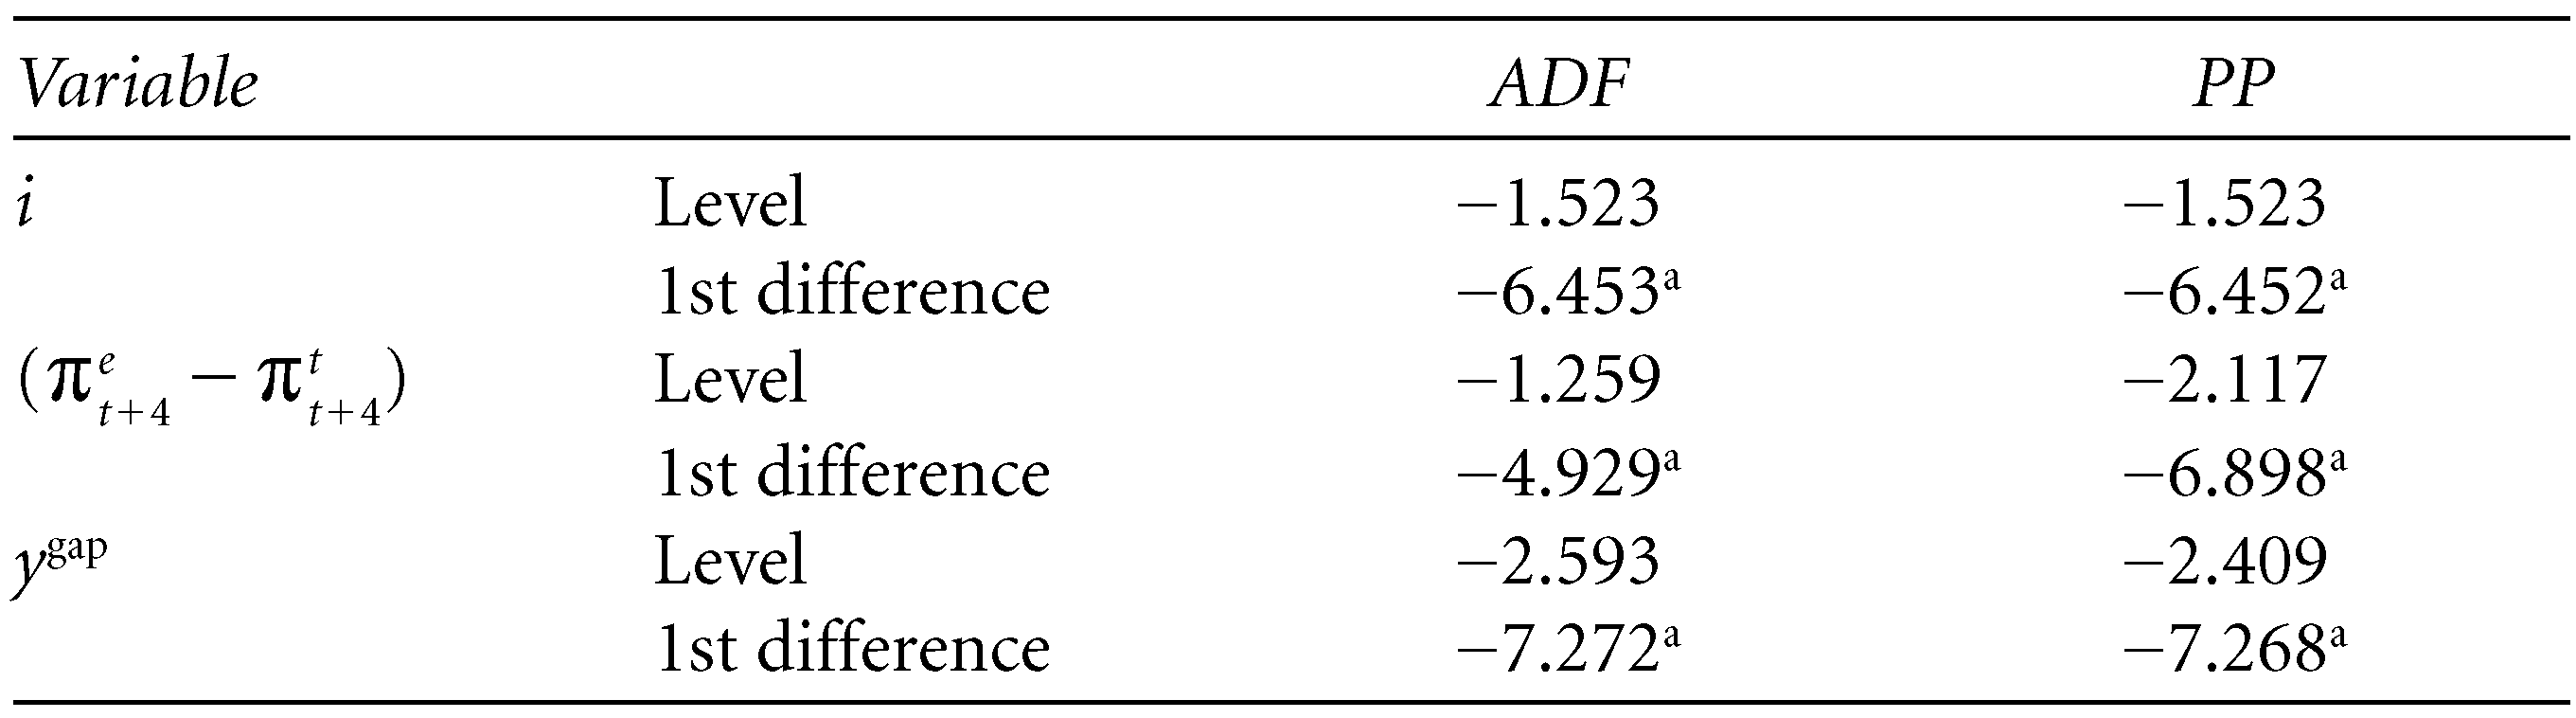
Unit Root Test Results
Shin et al. (2014) stated that a large section of earlier empirical studies on cointegration assumes the existence of a linear and symmetric long-run relationship between the variables. They, therefore, propound the NARDL approach which allows researchers to examine asymmetric relationships between variables. They first demonstrate the asymmetric long-run regression as follows:


where yt and xt,, respectively, denote dependent and independent variable(s). Additionally, xt is separated as 

Shin et al. (2014) produced a dynamic framework to examine the asymmetric relationship between variables by extending the ARDL method developed by Pesaran and Shin (1999) and Pesaran, Shin, and Smith (2001). They use the following NARDL (p, q) model:

where xt stands for a k x 1 vector of multiple independent variables defined as
Equation (6) can be described in the error correction form by following Pesaran et al. (2001) as follows:

where
The results of the NARDL cointegration test are reported in Table 4. Accordingly, panel A of the table shows that the null hypothesis of symmetry is rejected. This finding means that the NARDL approach must be used rather than the ARDL method. Panel B of the table depicts whether or not there is a cointegration relationship among variables in the empirical model. As is seen, the null hypothesis of no cointegration can be rejected, indicating that there is a cointegration relationship in the empirical model. Thus, long-run coefficients of the independent variables can be estimated through the NARDL method. These long-run coefficients are exhibited in panel C of the table.
NARDL Cointegration Test Results
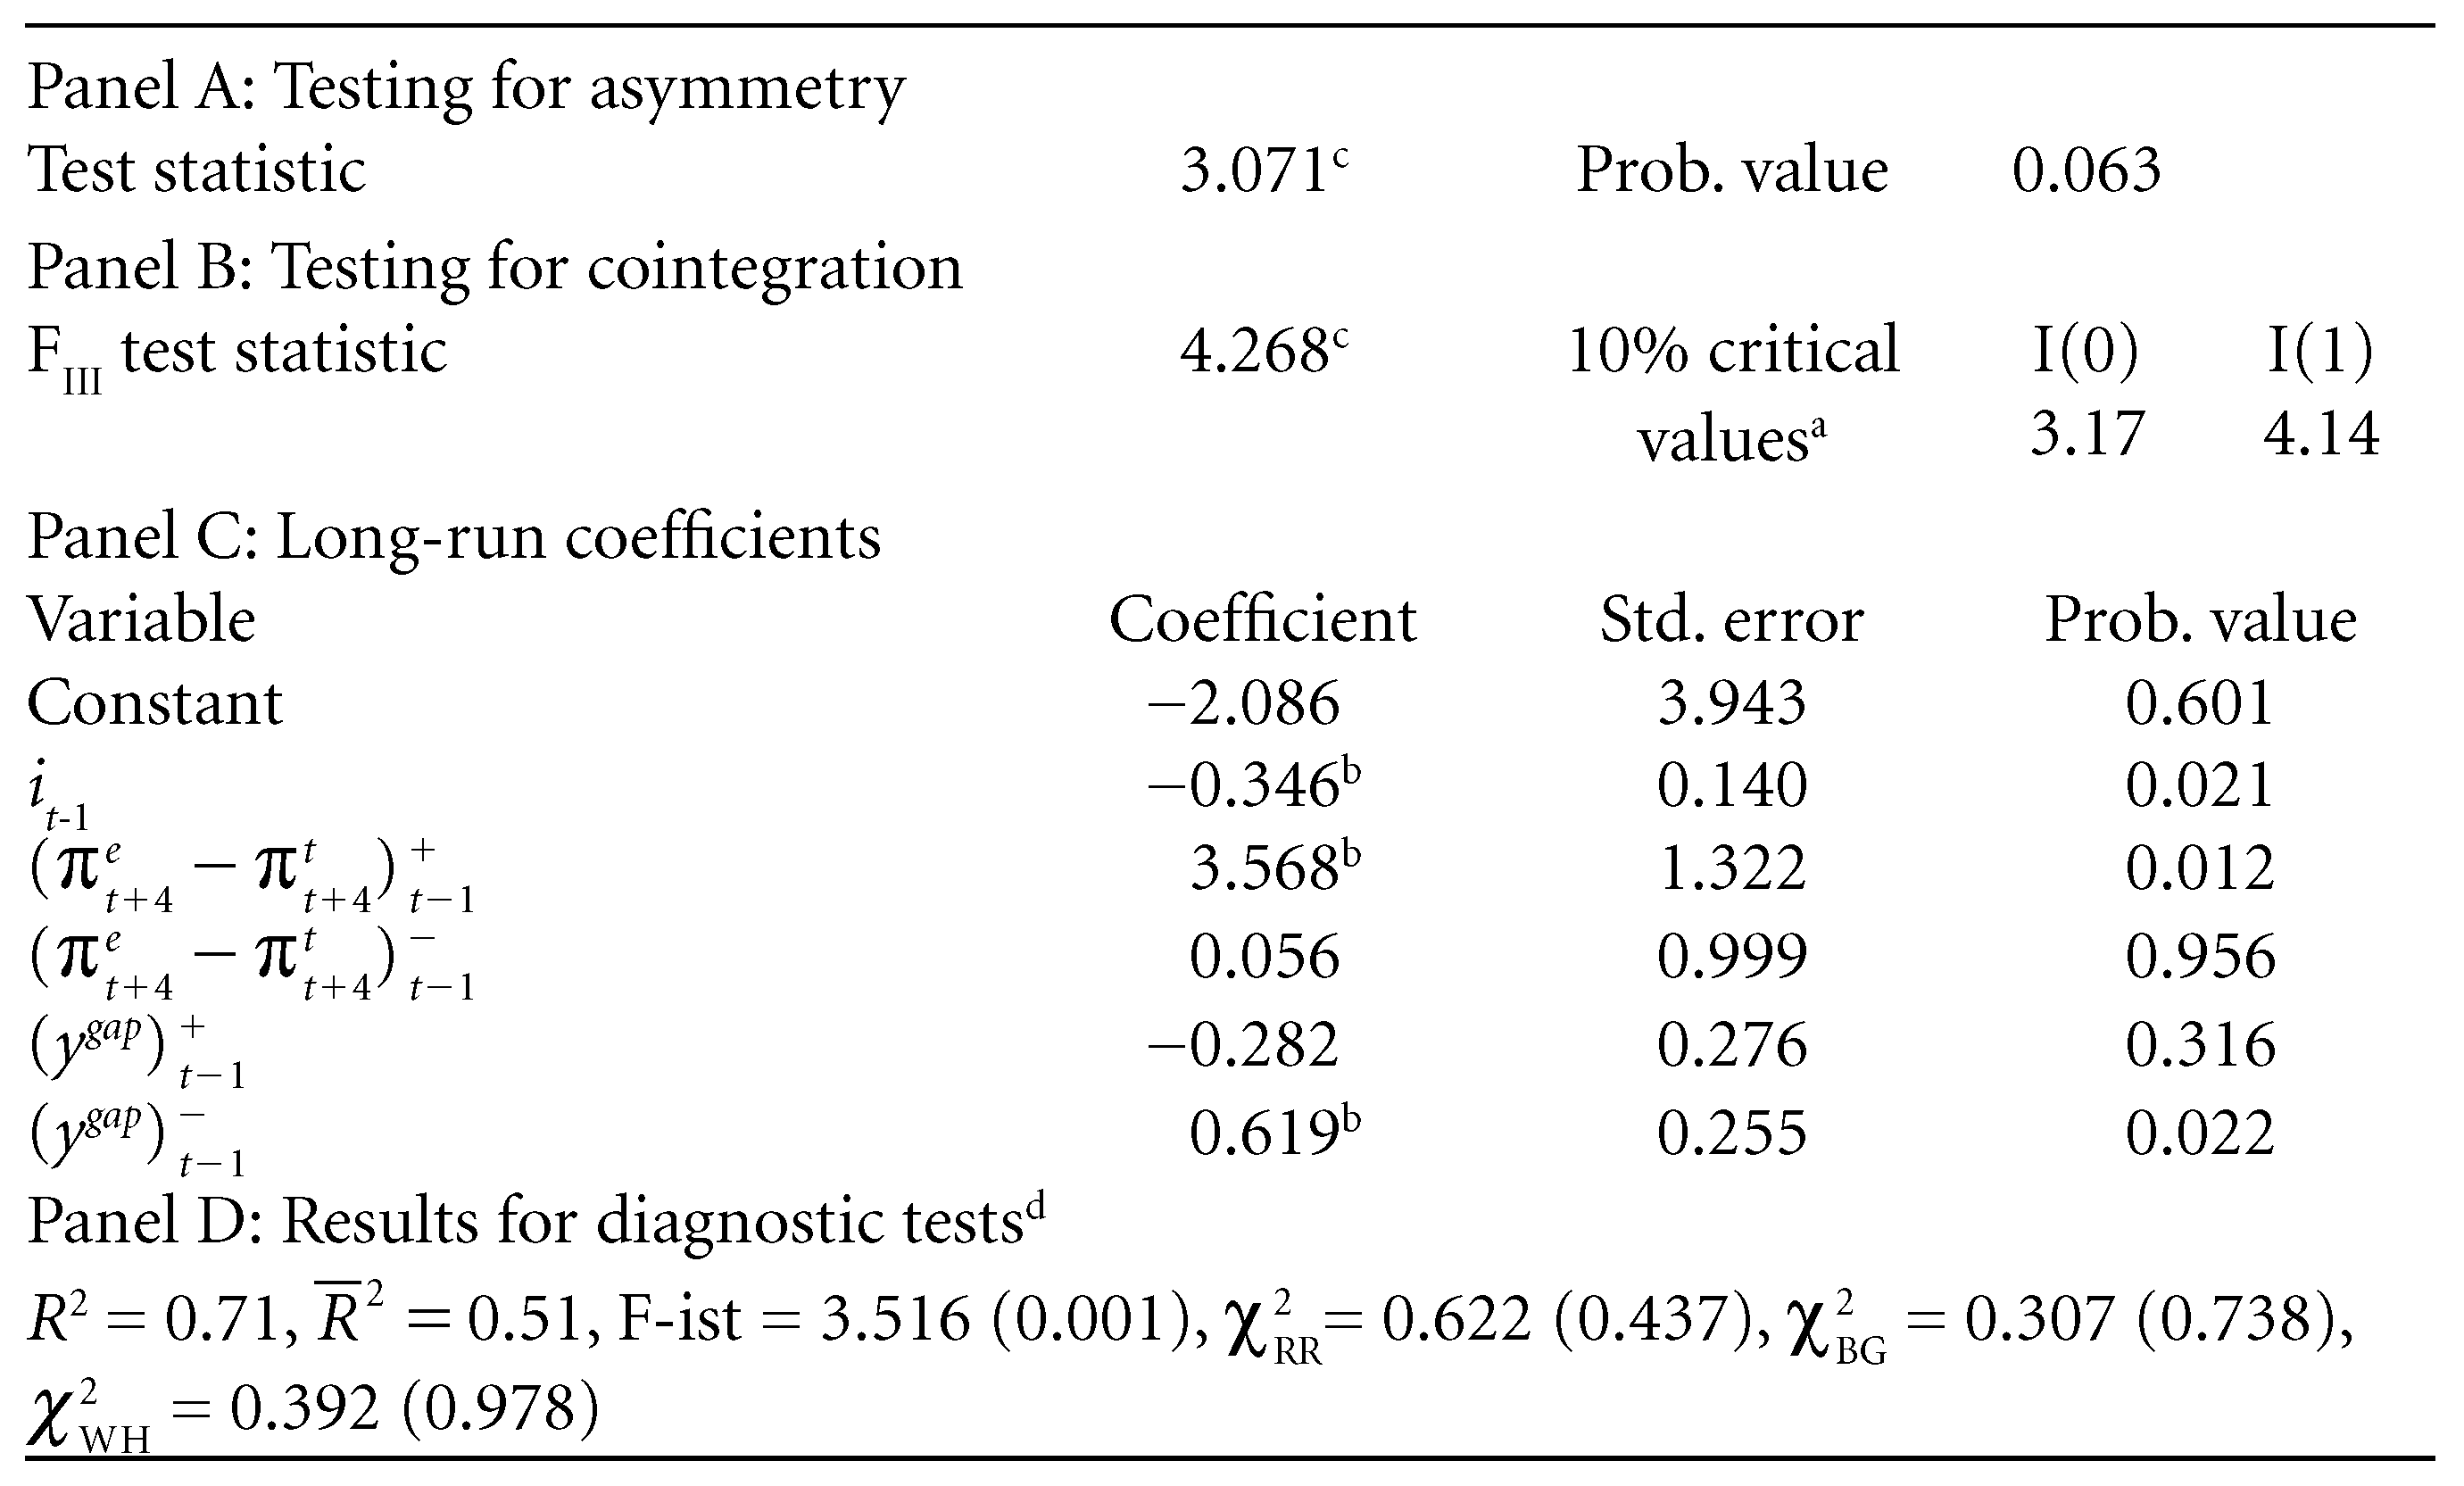
The calculations of long-run parameters are indicated above. Accordingly, the long-run coefficients of
These findings show that changes in the variables in the reaction function have asymmetric effects on the interest rate adjustments of the CBRT. Accordingly, a positive shock in the difference between expected inflation and the inflation target results in an increase in short-term interest rates, while a negative shock in the difference between expected inflation and the inflation target does not affect short-term interest rates. In other words, the CBRT increases short-term interest rates as a response to an increase in the difference between expected inflation and the inflation target, but does not decrease short-term interest rates when the difference between expected inflation and the inflation target decreases. Further, it decreases short-term interest rates against a decrease in the output gap, whereas it does not increase short-term interest rates against an increase in output gap.
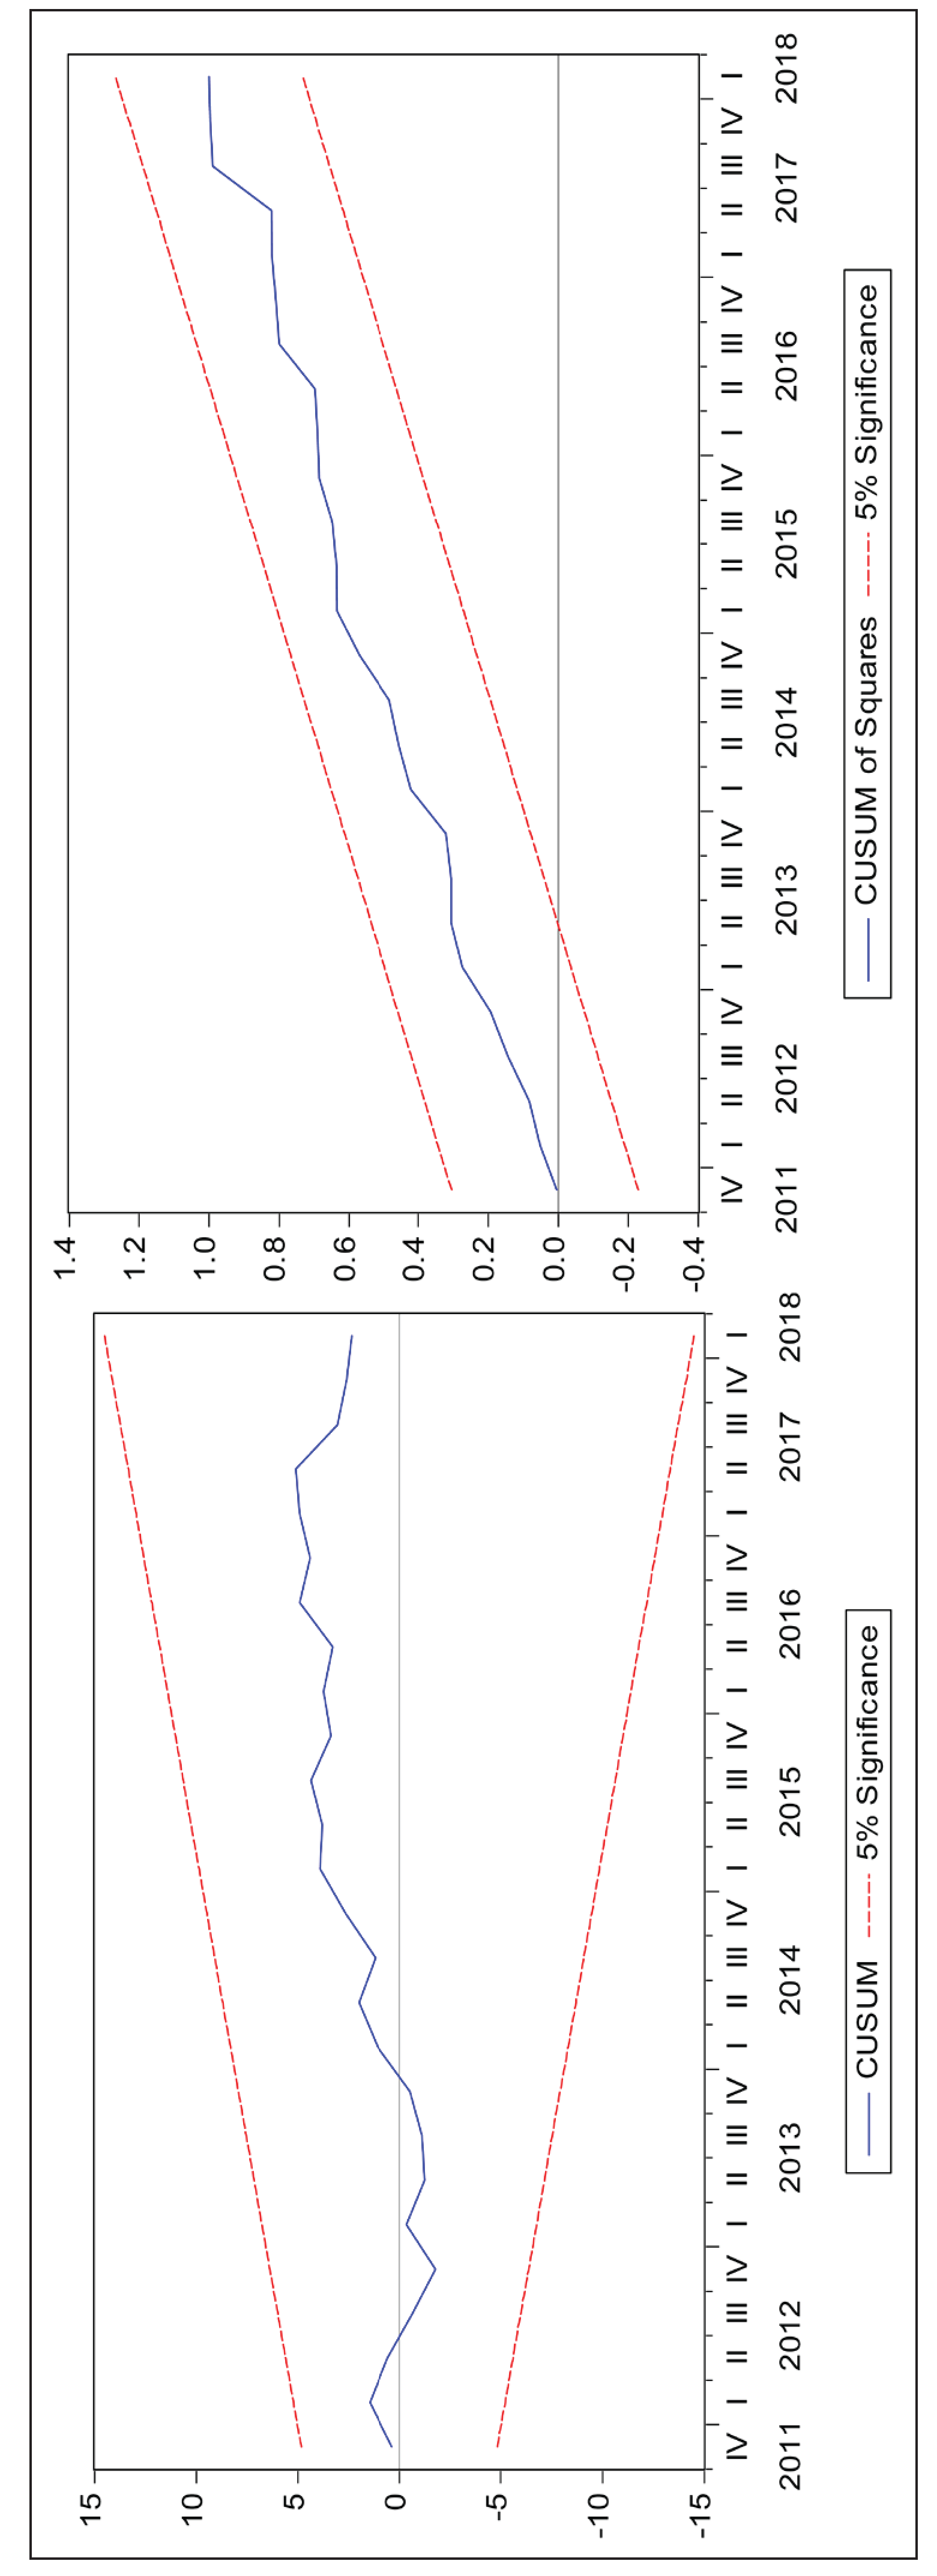
Finally, the long-run parameters’ stability is investigated via the CUSUM (Cumulative sum) and CUSUM-Q tests from Brown et al. (1975). The results for CUSUM and CUSUM-Q tests are illustrated in Figure 2. While the CUSUM test is based on cumulative residuals, the CUSUM-Q test rests on the cumulative squares of residuals. As both statistics take part in the critical bounds at the 5% significance level, the paper yields that the long-run parameters are stable over the sample period.
This article has estimated an asymmetric reaction function for the CBRT using quarterly data spanning the period 2006:1–2018:1. After carrying out unit root tests and detecting the order of integration for the variables, we applied the NARDL cointegration method developed by Shin et al. (2014) to examine the asymmetric effects of changes in inflation and in the output gap on the interest rate adjustments of the CBRT. The finding is that the CBRT considered increases in expected inflation and decreases in the output gap. Accordingly, it increased short-term interest rates in response to an increase in the difference between expected inflation and the inflation target and decreased short-term interest rates as a response to a decrease in the output gap. Therefore, the article found that decreases in the difference between expected inflation and the inflation target and increases in the output gap did not lead to any changes in the interest adjustments of the CBRT.
These findings have some important implications for monetary policy in Turkey and the Turkish economy. First, the CBRT has an asymmetric reaction function and a linear loss function. Therefore, the CBRT appears to consider only increases in inflation and decreases in output. Second, the CBRT increases short-term interest rates when expected inflation exceeds inflation target and decreases short-term interest rates when output declines. Therefore, one can argue that the CBRT not only tries to achieve price stability but also tries to support the growth and employment policies of the government.
Third, Turkey appears to experience cost-push inflation rather than demand-pull inflation because the CBRT sharply increases short-term interest rates to decelerate expenditures as a result of a rise in the difference between expected inflation and the inflation target. Some recent studies support this view. Yunculer and Ogunc (2015) investigated the cost structures of 38,997 non-agricultural firms with more than 20 employees in Turkey and found that raw materials have the greatest share in costs (41.5%), while the share of financial expenses is only 3.6 per cent. Besides, some studies focus on the exchange rate pass-through effect in Turkey: Tunc and Kılıc (2018), for instance, found a strong exchange rate pass-through to prices, Ertug, Ozlu, and Yunculer (2018) concluded that imported inputs in the manufacturing industry and the sensitivity of domestic prices to external shocks have increased in Turkey. Taking into account the cost structures of firms and findings from Tunc and Kilic (2018) and Ertug et al. (2018), one could argue that depreciation of the TL against foreign currencies (see Table 1) made imported raw materials more expensive and led to high inflation rates in Turkey and that high inflation did not stem from interest expenses in Turkey.
Fourth, food and non-alcoholic beverages have the largest share in Turkey’s CPI, 23.03 per cent in 2018. During the period 2006–2018, the price of food and non-alcoholic beverages increased on average by about 10 per cent in Turkey, while global food price inflation was only 1.7 per cent (Food and Agriculture Organization of the United Nations, 2019; Turkish Statistical Institute, 2019). Therefore, increasing food prices play a considerable role in the high inflation rates in Turkey. Fifth, the prices of alcoholic beverages and tobacco are manipulated by the government, as taxes on these items are an important source of government revenue. As a result of increases in taxes, the prices of alcoholic beverages and tobacco increased by 10 per cent over the period 2006–2018. Clearly, the rise in these prices has a role in the high inflation rates in Turkey.
Overall, this article argues that (i) the CBRT tries to achieve price stability by sharply tightening monetary policy when expected inflation exceeds the inflation target, but (ii) it cannot achieve inflation targets because of supply-side reasons, such as the depreciation of the TL, increases in imported inputs in the manufacturing industry, the presence of high exchange rate pass-through to prices, and increases in the prices of items which cannot be controlled by the CBRT.
Footnotes
Declaration of Conflicting Interests
The author declared no potential conflicts of interest with respect to the research, authorship, and/or publication of this article.
Funding
The author received no financial support for the research, authorship, and/or publication of this article.