
Abstract
This study investigates whether the consumption of households that include individuals with physical disabilities (IWPD) depends on the employment status of such individuals. Data from the 2012 Panel Survey of Employment for the Disabled (PSED) conducted by the Korea Employment Agency for the Disabled were used to ascertain the consumption patterns, consumption functions, income elasticity, and Engel coefficient of households that include IWPD. An independent t test was used to differentiate between employment and unemployment status. The results revealed that the consumption patterns of such households were similar to those of a typical poor household. Although these patterns did not differ according to the employment status of IWPD, the number of items in the consumption expenditure of a household that includes employed IWPD was larger than that of a household that includes unemployed IWPD. Income had a significant effect on all expenditure items. Furthermore, only savings were classified as a luxury, regardless of employment status. The analysis results of this study could enable researchers to capture the problems facing IWPD and provide greater insight into their economic status.
Quality of life (QOL) references the general well-being of individuals and societies. Researchers have suggested various approaches to defining and measuring QOL through social indicators such as health and levels of crime, subjective well-being measures accessing people’s reactions to their lives and societies, and economic indices (Diener & Suh, 1997). The use of objective as well as subjective measures is desirable for public policy purposes because each approach to measuring QOL reveals information that the other does not (Diener, Lucas, Schimmack, & Helliwell, 2009). In the measurement of QOL of the general population, the preference of economic indicators to policies is criticized. Although economic indicators and resources are important measures of subjective well-being, people’s well-being is dependent on other factors as well (Diener & Suh, 1997).
However, this argument is not applicable to individuals with physical disabilities (IWPD), owing to insufficient reporting data. Rigorous studies on the economic status of IWPD are comparatively scarce (Braithwaite & Mont, 2008), and specific information on IWPD is difficult to find. A reason for this lack of information is the difficulty of objectively identifying them in survey data because disability is not a clearly defined condition as compared with attributes such as race, gender, or family composition (Haveman & Wolfe, 1990). A criticism in relatively recent policies (Burkhauser, Houtenville, & Rovba, 2005) is that working-age individuals with disabilities receive negligible attention from government authorities in the United States, because unlike in the case of many sub-populations, the U.S. Bureau of the Census does not officially track the employment and economic well-being of such individuals. Recently, the Panel Survey of Employment for the Disabled (PSED) conducted by the Korea Employment Agency for the Disabled collected economic information such as income, consumption, employment, and assets according to different types of disability; these data enable the analysis of objective economic well-being. Thus, in this study, we investigate the objective economic well-being of households that include IWPD by using 2012 PSED data and analyzing the households’ consumption patterns.
Notably, overall reports on the economic status of individuals with disabilities do not provide a very good understanding of the disability policy in that country. Although the reports of the U.S. Census Bureau summarize the household economic status of Americans with disabilities using collected data from the Survey of Income and Program Participation (SIPP; Brault, 2012), we find only general information on the financial circumstances of the average individual with disability. Furthermore, the population with disabilities is extremely diverse. That is, the educational status, employment status, income level, asset level, and other economic indicators of individuals with disabilities are varied (Baldwin, 1999). The different types of disabilities are a major factor leading to the varied results in research related to the aforementioned aspects of life in such individuals. Thus, we must bear in mind that every person with a disability is an individual with his or her own specific experiences and disability-related needs.
Nevertheless, existing data and studies have often overlooked the varying characteristics of individuals with disabilities. The effectiveness of policies depends on the extent to which they are able to meet the needs of the population. However, merely understanding the economic consequences of disability is insufficient (Metts, 2000; Yeo & Moore, 2003). To obtain meaningful information on their economic well-being, it is probably best to focus on groups of individuals with different disabilities. Of course, data on the economic well-being of individuals with all types of disabilities are necessary for formulating evidence-based policies; however, collating such data would involve extensive research, which cannot be achieved in a single study, and hence, we decided to focus on individuals with any one type of disability. Accordingly, we observe that the proportion of IWPD in the total population of individuals with disabilities in the United States is relatively high. In 2010, the U.S. Census Bureau reported the physical domain of disability types for those aged above 15: 12.6% had lower body limitations, 1.5% used a wheelchair, and 8.2% had upper body limitations (Brault, 2012). The large proportion of IWPD shows that they are recognized as a major group for vocational rehabilitation and related policies. The panel data used in present study showed 61.1% (n = 2,685) of IWPD.
Disability is associated with worsened economic outcomes (Hoogeveen, 2005; Pandey, 2012). Such individuals are exposed to poor living conditions and have more difficulties in earning an income (Rosano, Mancini, & Solipaca, 2009). Despite receiving a large amount of government-provided benefits, individuals with disabilities are poor compared with individuals without disabilities (Palmer, 2011). The most commonly accepted measure of relative low income in the United Kingdom is to be living on less than 60% of median household income of individuals with disabilities, with data on the population without disabilities used for comparison (Parckar, 2008). As per the 1986–1993 panel data of the SIPP, the average real annual income of men with disabilities was only $18,423 compared with $30,376 for men without disabilities; moreover, the average earnings of the former were only $12,568 compared with $26,790 for the latter. Furthermore, only 43.2% of men with physical disabilities were employed (DeLeire, 2000). Therefore, the present study focuses on analyzing the economic well-being of households that include IWPD, given that such individuals constitute a significant proportion of the population with disabilities. Individuals with long-term physical disabilities are reported to have the lowest QOL. This is believed to be owing to their socio-economic status, health, and social participation (van Campen & Santvoort, 2013; Ville & Ravoud, 2001). Furthermore, IWPD appear to be particularly vulnerable financially owing to reduced earning capacity that is often associated with functional limitations and their high susceptibility to certain financial shocks (Batavia & Beaulaurier, 2001). Recently, the relatively low economic status of households that include IWPD was reported by analyzing a large data set (Brault, 2012). Those with only communication disabilities had median earnings of $2.838, which is not statistically very different from the median earnings of those with no disability—$2.724. Significantly, those with only physical disabilities had median earnings of $1.998. Furthermore, those with only communication disabilities had the highest median monthly family income, while those with only physical disability showed the lowest median monthly family income. The relatively low economic status of IWPD is one more reason that the present study focuses on analyzing the economic well-being of households that include them.
Income and consumption are common monetary measures of economic well-being. Economic theory suggests that there is a more direct relationship between economic well-being and consumption than between well-being and income (Magrabi, Chung, Cha, & Yang, 1991; Meyer & Sullivan, 2007). Consumption may be defined as the utilization of economic goods or services to satisfy needs. Conceptually, income is subject to transitory fluctuations caused by events such as changes in job or family composition. For example, living standards may remain unaffected despite adverse income changes because savings can be utilized (Cutler & Katz, 1991). Consumption is widely used as a good indicator of the pressures that consumption can impose on the environment. Consumption is a part of people’s way of life and is determined by their existing living conditions, social and physical environment, and culture (Uusitalo, 1980). Research on consumption helps reveal aspects such as lifestyles and consciousness, and changes in consumption are determined by analyzing the status of and changes in consumption behavior (M. J. Kim & Choe, 2009).
The consumption levels of those who are socio-economically disadvantaged are more accurately reported than their income levels. There is substantial evidence suggesting that income is under-reported. For example, Meyer, Mok, and Sullivan (2009) found that major household surveys heavily under-report many types of government transfer incomes and that this trend is rising. Furthermore, Meyer and Sullivan (2003) argued that income was inappropriately measured for those who are at the bottom of the resource distribution chain, probably because this group has many small, irregular sources of income. Analyzing consumption may reduce or even eliminate many of these problems. Therefore, to evaluate the economic well-being of households that include IWPD, we attempt to analyze whether factors related to the consumption of such households depend on their employment status. Most studies on consumption inequalities have used models that treat expenditure categories as partially independent. This approach implies that little attention was paid to the multidimensionality of relationships among social groups (Katz-Gerro & Talmud, 2005).
Economic well-being can be measured by analyzing consumption patterns, consumption functions, income elasticity, and the Engel coefficient. A consumption pattern is the manner in which various elements of consumption are combined to form the overall consumption level. A consumption pattern is ascertained by measuring consumption using household expenditure (Uusitalo, 1980). Elements of consumption are incorporated into the standard of living because of specific consumption values (Kyrk, 1923). The consumption function is represented by a mathematical formula based on the relationship between the consumption expenditure and various factors determining it (D’Orlando & Sanfilippo, 2010). This function shows the manner in which the desired consumption expenditure of every individual or household varies with the factors that affect such expenditure. Furthermore, income elasticity refers to the sensitivity of the quantity demanded of a certain product in response to a change in the consumer’s real income. This elasticity can be used as an indicator of future consumption patterns. The Engel coefficient, a traditional indicator of economic well-being, measures how much of a family’s income is spent on food.
The following four questions regarding IWPD are addressed in this study: First, does the household consumption pattern vary according to whether its IWPD are employed? Second, does the consumption function of households that include IWPD vary depending on whether they are employed? Third, does the elasticity of consumption of these households differ according to whether they are employed? Fourth, does the Engel coefficient of these households differ according to whether they are employed?
Our study differs from the literature in several ways. First, the concepts of consumption pattern, consumption function, income elasticity, and the Engel coefficient are used to analyze consumption and determine economic well-being. Second, we analyze a comprehensive range of variables that capture the consumption of IWPD: food, education, transportation, housing, medical services, leisure, consumer goods, communication, clothing, public insurance, interests/tax, and savings. Third, we utilize the most recent data: the 2012 PSED provided by the Korea Employment Agency for the Disabled.
Method
Data
This data set encompasses those registered with the Ministry of Health and Welfare as suffering from various types of disability as defined by the “Disability Welfare Act” enacted in 2008 for systematic information provision and evaluation with regard to employment of individuals with disabilities. In this study, we used fourth-year PSED materials and limited coverage to 2,685 IWPD engaged in competitive employment to determine whether the consumption patterns, consumption functions, income elasticity, and Engel coefficient of their households depend on whether they are employed. Specifically, we used data on the socio-demography, employment, and financial status of IWPD to conduct our analysis.
Table 1 presents the general characteristics of the participants. Of the total, 1,735 were male and 950 were female; the number of unemployed respondents was higher than that of employed ones, regardless of gender. Most of the individuals were between 40 and 60 years of age, and the number of employed decreased with an increase in age. In terms of academic background, high school graduates or higher did not have a different employment rate. However, the employment rate of graduates from middle school and those with lower education qualifications than theirs was slightly low. In terms of monthly income, monthly consumption, and net worth, the average values for the employed were higher than that for the unemployed.
Characteristics of Participants.
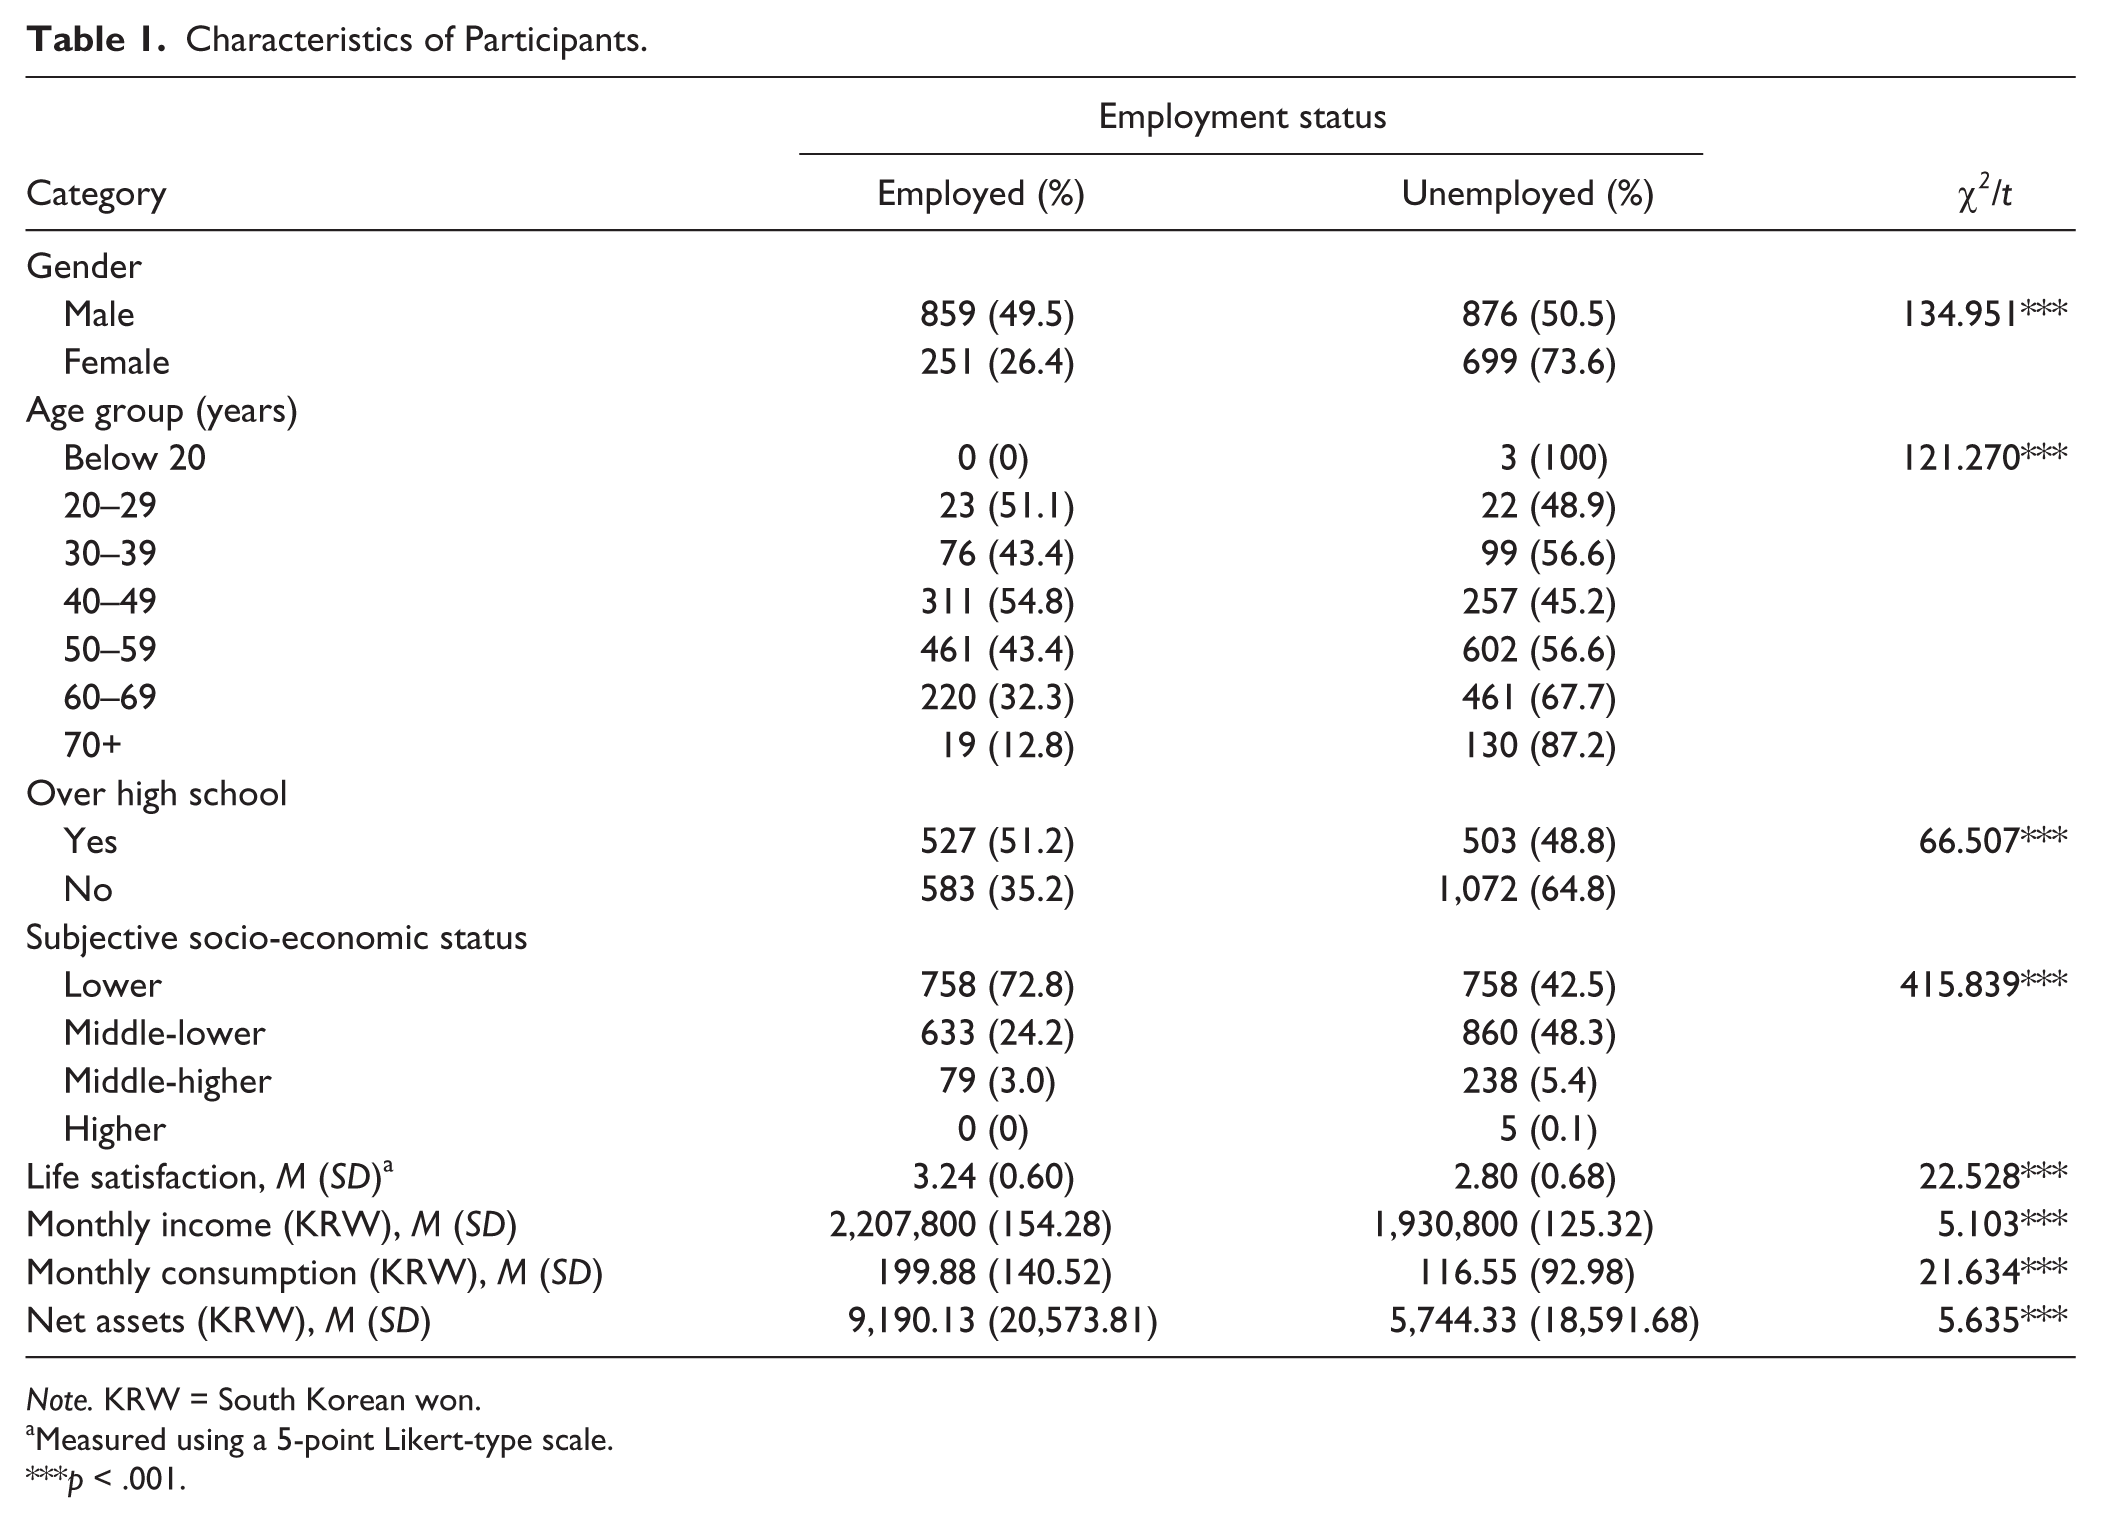
Note. KRW = South Korean won.
Measured using a 5-point Likert-type scale.
p < .001.
Measures
First, because a consumption pattern is related to the structure of expenditure on consumption items (food, education, transportation, housing, medical services, leisure, consumer goods, communication, clothing, public insurance, interests/tax, savings, etc.), we measured the amount spent by households that include IWPD on each consumption item and its ratio to total consumption expenditure. Moreover, we used a t test to ascertain the difference between employment and unemployment statuses.
Second, we derived a consumption function based on employment status by conducting a multiple regression analysis (ordinary least squares [OLS]) of the socio-economic variables that affected each expenditure item. The consumption function is shown in Equation (a); the independent variables include monthly income (In), net worth, gender, educational background, and age.

where
Third, the income elasticity
Fourth, the Engel coefficient represents the proportion of household income that is spent on food. According to Engel’s Law, as household income increases, the proportion of income spent on food gradually decreases. The following is the formula for the Engel coefficient:
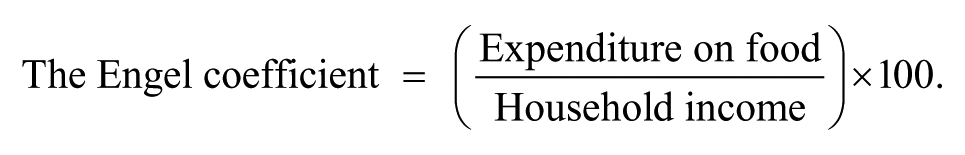
Engel’s law indicates that the increase in the proportion of food expenditure in total consumption expenditure is lesser than the increase in income. Thus, the relationship between income and food expenditure is an indicator of economic well-being. When the Engel coefficient increases, it is an indication that the household is relatively poor; however, when the Engel coefficient decreases, it is an indication of improvement in economic well-being.
Results
Variance in Consumption Patterns of Households That Include IWPD
The consumption patterns of households that include IWPD are based on employment status, as depicted in Figure 1.
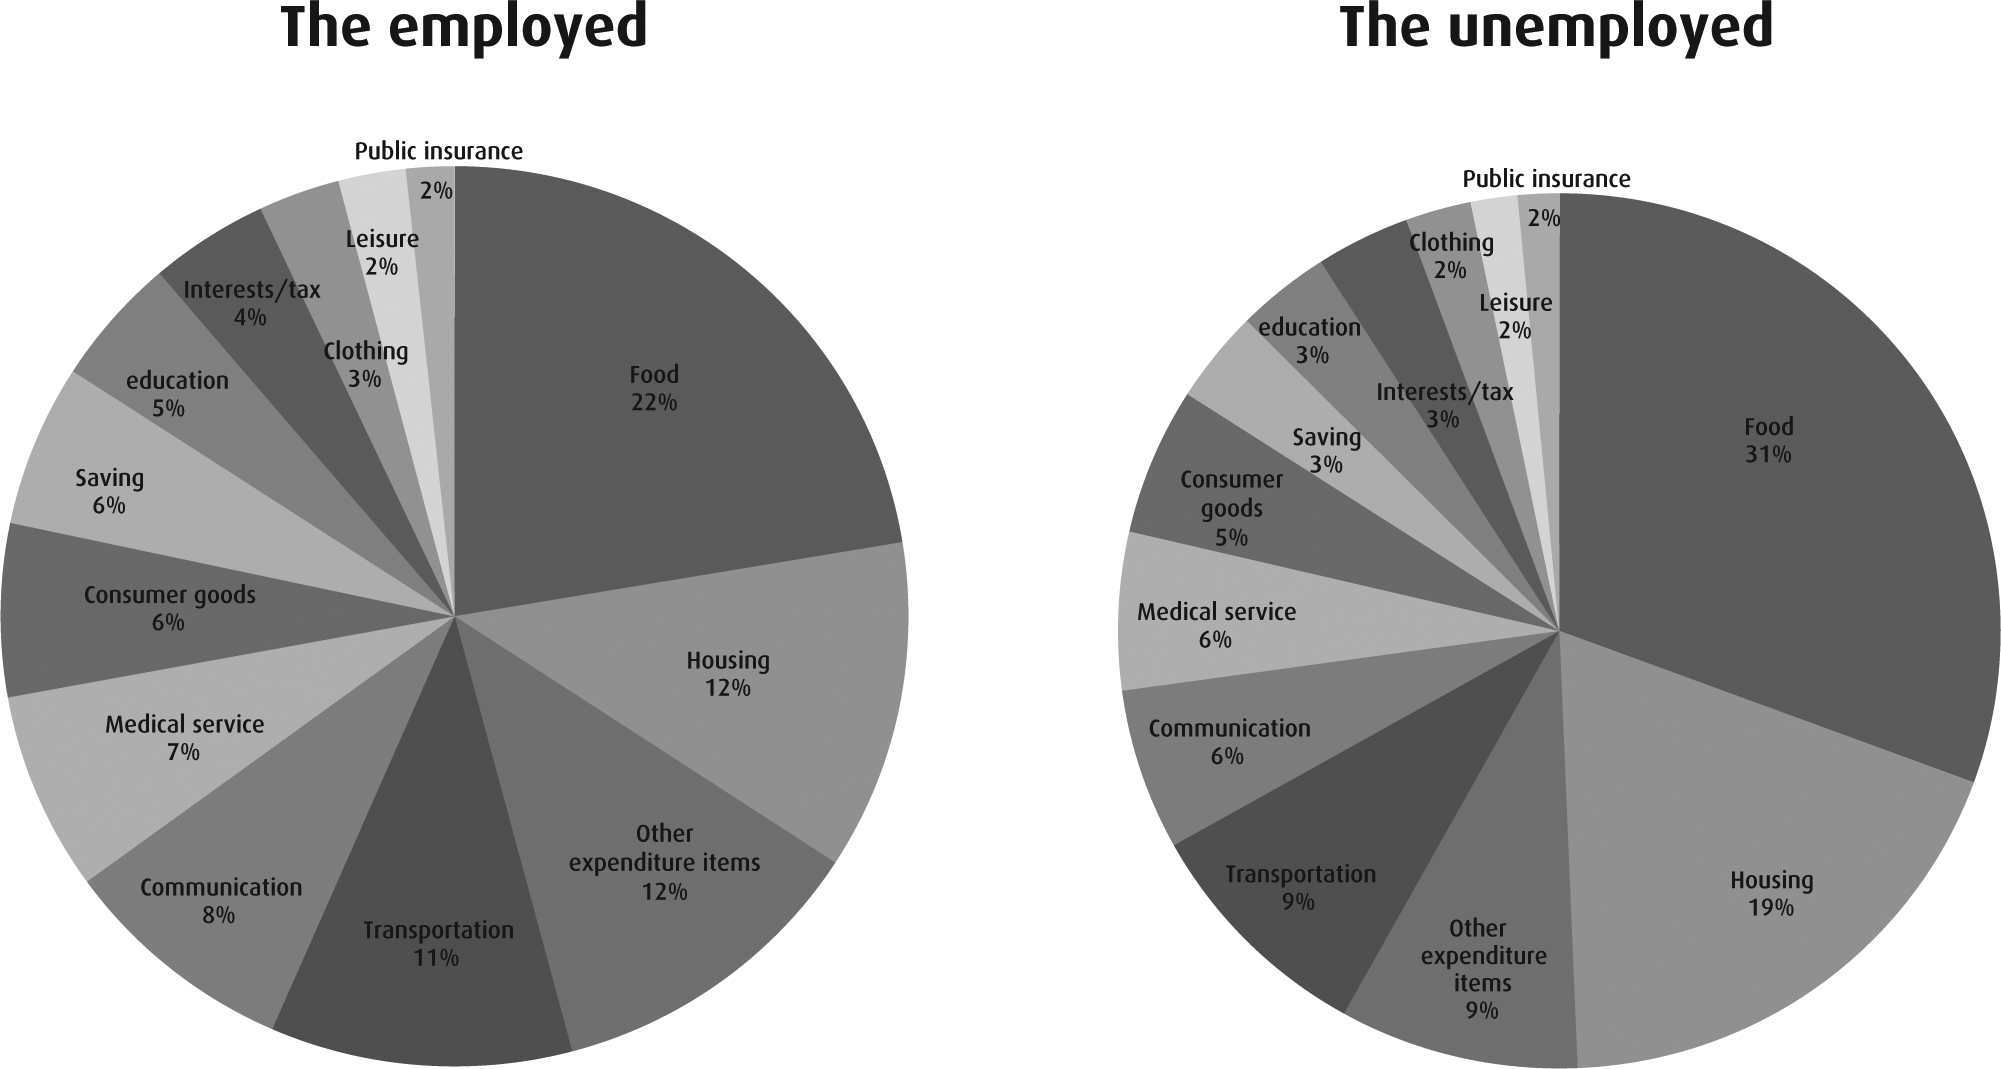
Consumption pattern of households that include IWPD.
The biggest household expenditure item of employed IWPD was food (22.3%), followed by other expenditure items (11.8%), housing (11.6%), transportation (10.7%), savings (8.4%), education (7.1%), interests/tax (6.2%), communication (5.8%), consumer goods (4.6%), medical services (4.2%), public insurance (2.9%), clothing (2.4%), and leisure (1.7%).
Similar to employed IWPD, unemployed IWPD also spent the most on food (30.4%), followed by housing (18.6%), other expenditure items (8.7%), transportation (8.7%), communications (5.9%), medical services (5.8%), consumer goods (5.4%), savings (3.4%), education (3.4%), interests/tax (3.4%), clothing (2.4%), leisure (1.7%), and public insurance (1.5%). Food and housing accounted for the largest proportion of consumption expenditure for the unemployed; thus, this consumption pattern was disproportionate.
Clothing, leisure, and public insurance accounted for the smallest proportion of expenditure for both employed and unemployed IWPD, while savings were relatively high for employed IWPD (8.4%) but low for unemployed IWPD (3.4%).
Table 2 presents the effect of the employment of IWPD and the number of employed members on the consumption patterns of a household. It is evident that their employment affected all the items, except for interests/tax. Of the affected items, medical services had a negative relationship with the employment of IWPD. Thus, the expenditure of the households that include employed IWPD was less than that of the households that include unemployed IWPD. However, other items such as food, education, transportation, housing, medical services, leisure, consumer goods, communication, clothing, public insurance, and savings had a positive relationship with their employment; thus, the expenditure of the households that include employed IWPD was more. In addition, the number of individuals employed in households had a positive relationship with food, transportation, housing, leisure, communication, clothing, public insurance, interests/tax, savings, and so on; thus, the expenditure of households with a greater number of employed members was more. However, the number of individuals employed in a household had a negative relationship with education; thus, the households with more employed members spent less on education.
Consumption Patterns According to Employment Status.
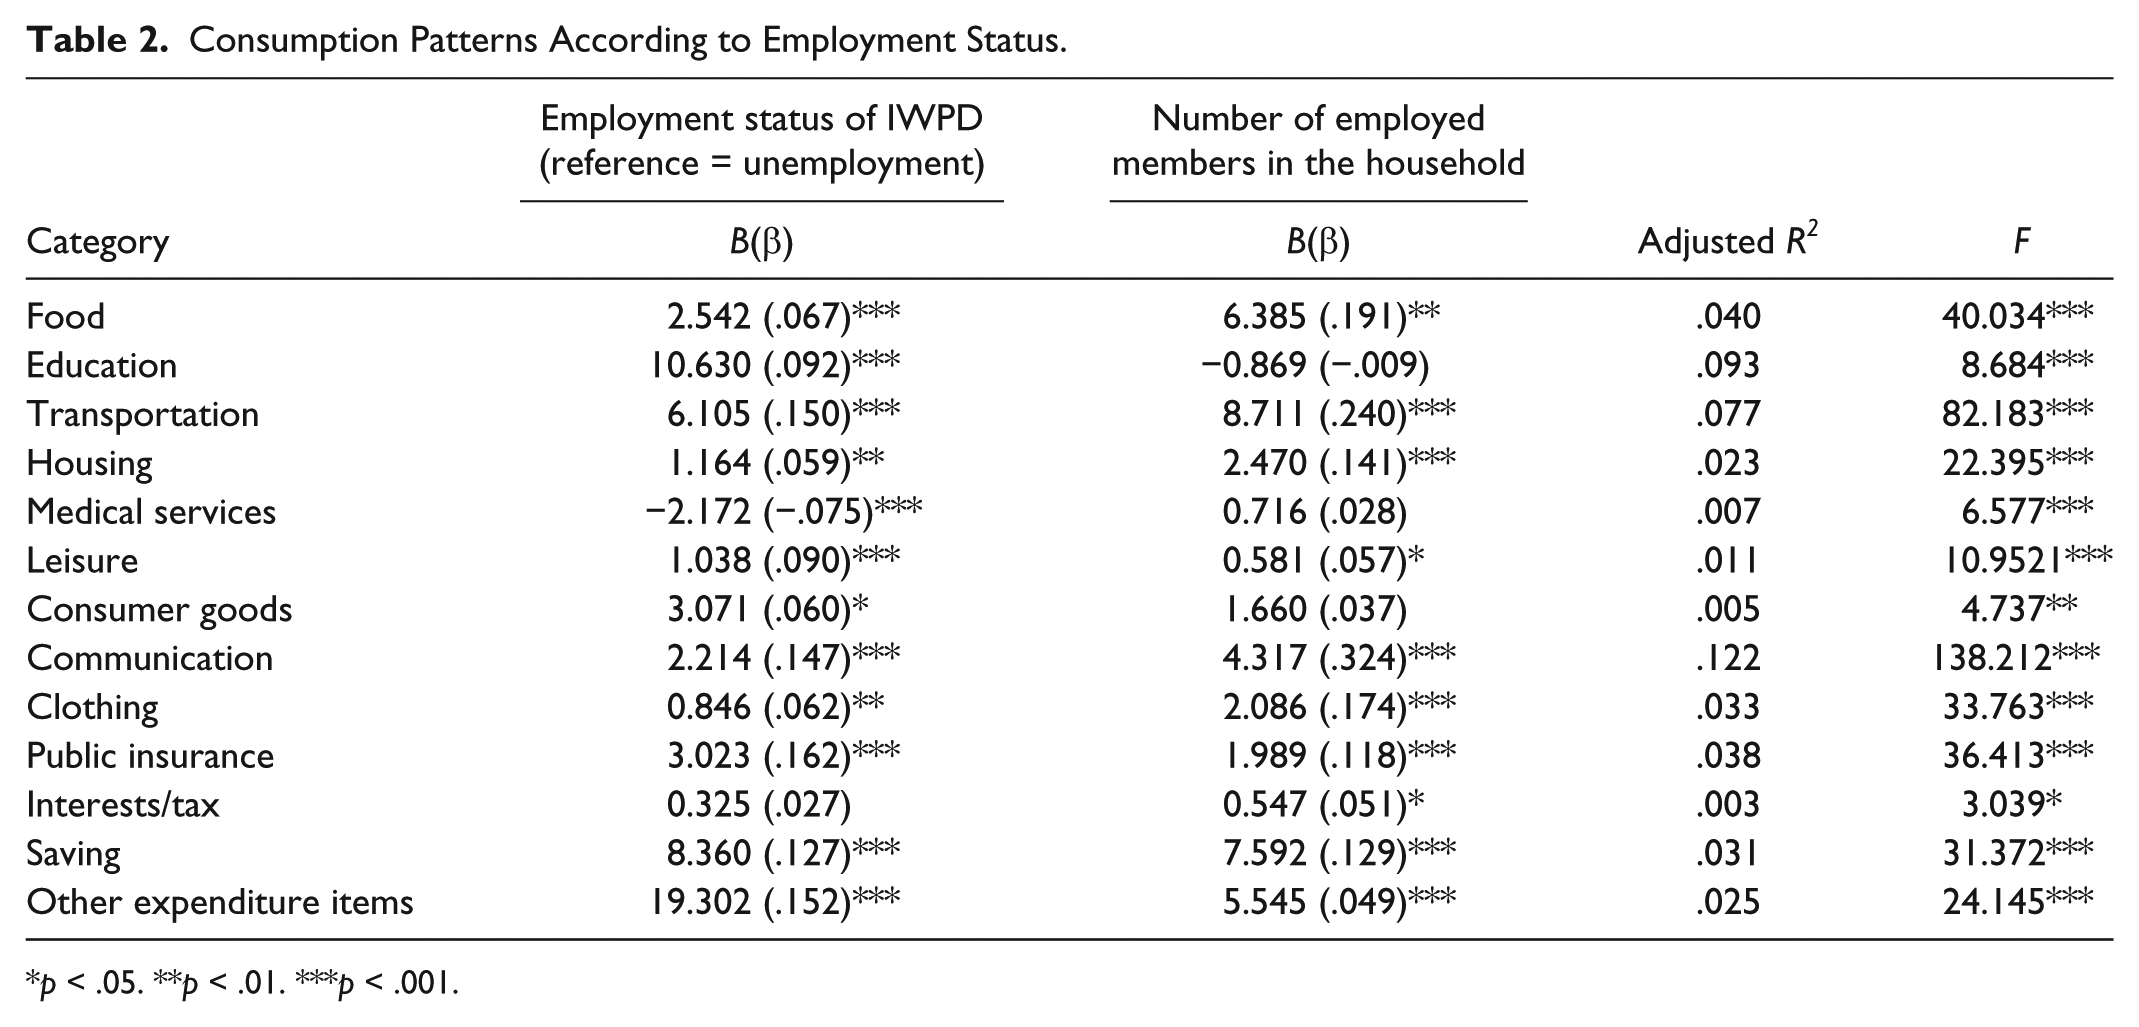
p < .05. **p < .01. ***p < .001.
The Consumption Function of Households That Include IWPD
The consumption functions of households with employed IWPD and of those with unemployed IWPD are presented in Table 3. Income (In) affects all expenditure items of these households, and its impact was relatively greater than that of the other independent variables. Therefore, it is safe to state that income (In) growth leads to more expenditure on each consumption item. The net worth of households that include employed IWPD affected expenditure on transportation, medical services, leisure, clothing, public insurance, interests/tax, savings, and so on. However, this net worth affected only medical services, leisure, and public insurance for households that include unemployed IWPD. For both types of households, the higher the net worth, the more their expenditure. For households that include employed IWPD, expenditure on food, transportation, medical services, communication, public insurance, and savings was also influenced by gender. Among them, females spent more than males on medical services and savings, while males spent more than females on food, transportation, communication, and public insurance. For households that include unemployed IWPD, only education was influenced by gender, with females spending more than males.
Consumption Function According to Employment Status.
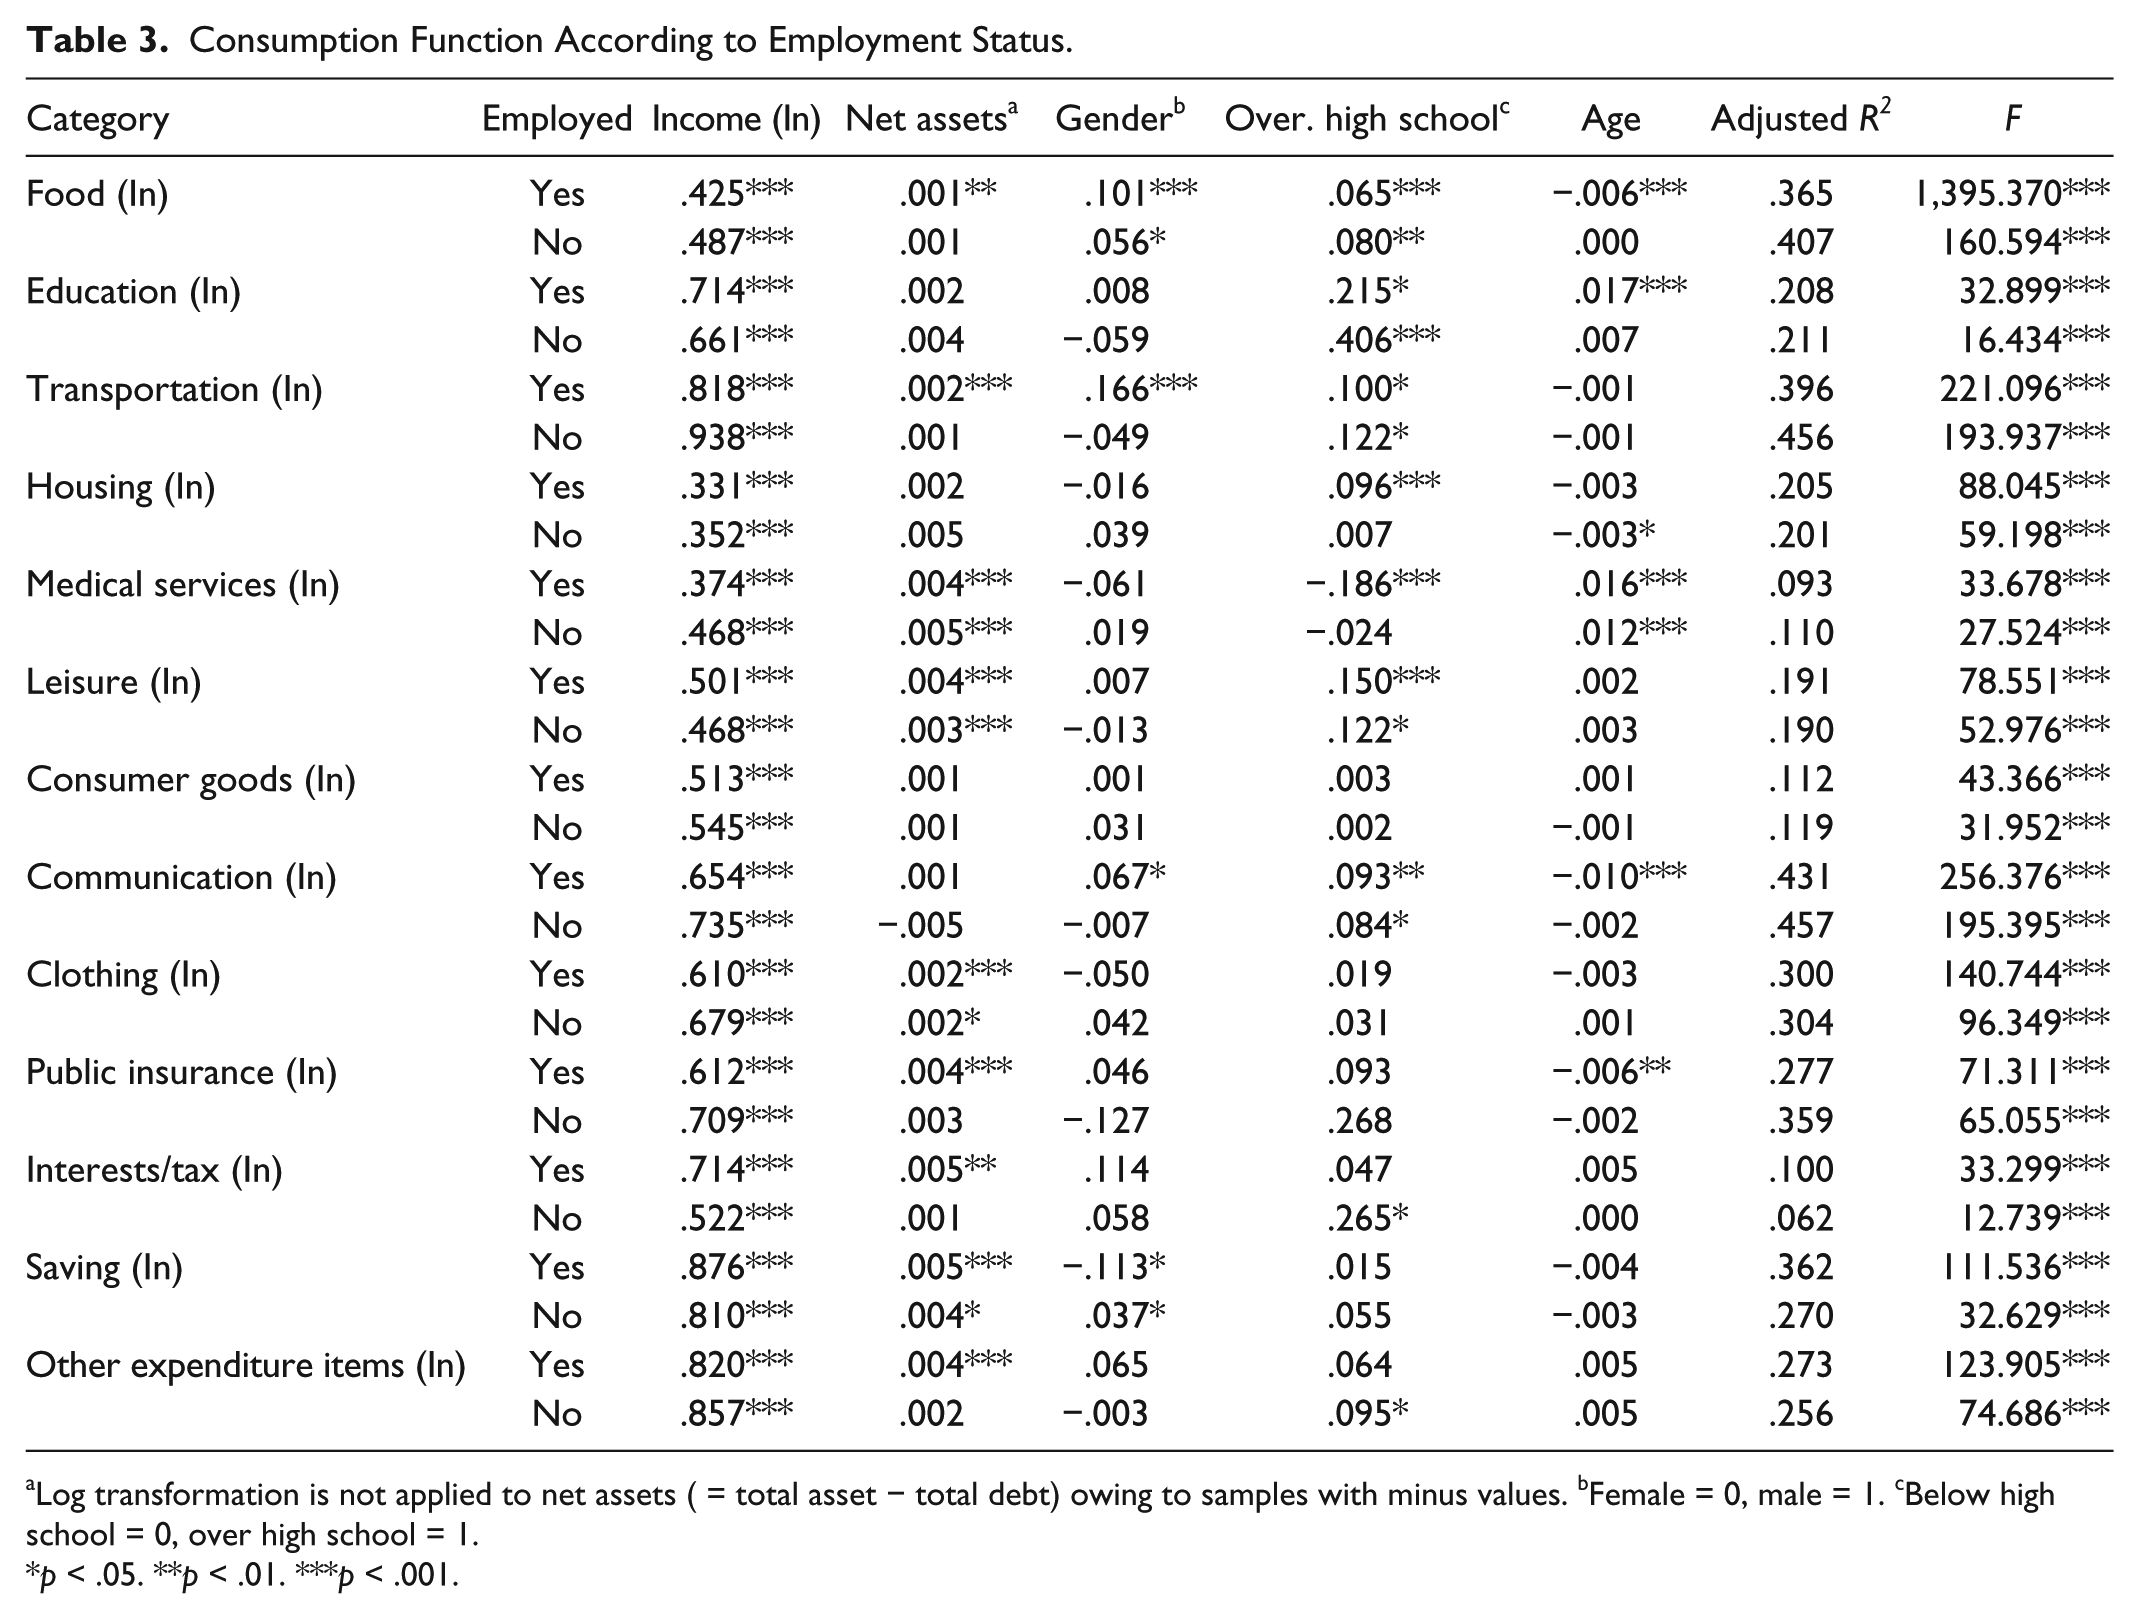
Log transformation is not applied to net assets ( = total asset − total debt) owing to samples with minus values. bFemale = 0, male = 1. cBelow high school = 0, over high school = 1.
p < .05. **p < .01. ***p < .001.
In terms of educational background, graduates from high school or above spent more on food, education, and housing if they were employed. However, they spent more on education and interests/tax if they were unemployed.
Furthermore, age affected the expenditure on food, education, housing, medical services, communication, clothing, and savings of households that include employed IWPD. Among these, the only expenditure item that was higher for older families was medical services. All the other items showed the opposite effect. In households that include unemployed IWPD, age affected education, medical services, and savings. Similar to households that include employed IWPD, expenditure on medical services of households that include unemployed IWPD was higher among older families, while that on education and savings was lower.
Income Elasticity of Consumption Items in Households That Include IWPD
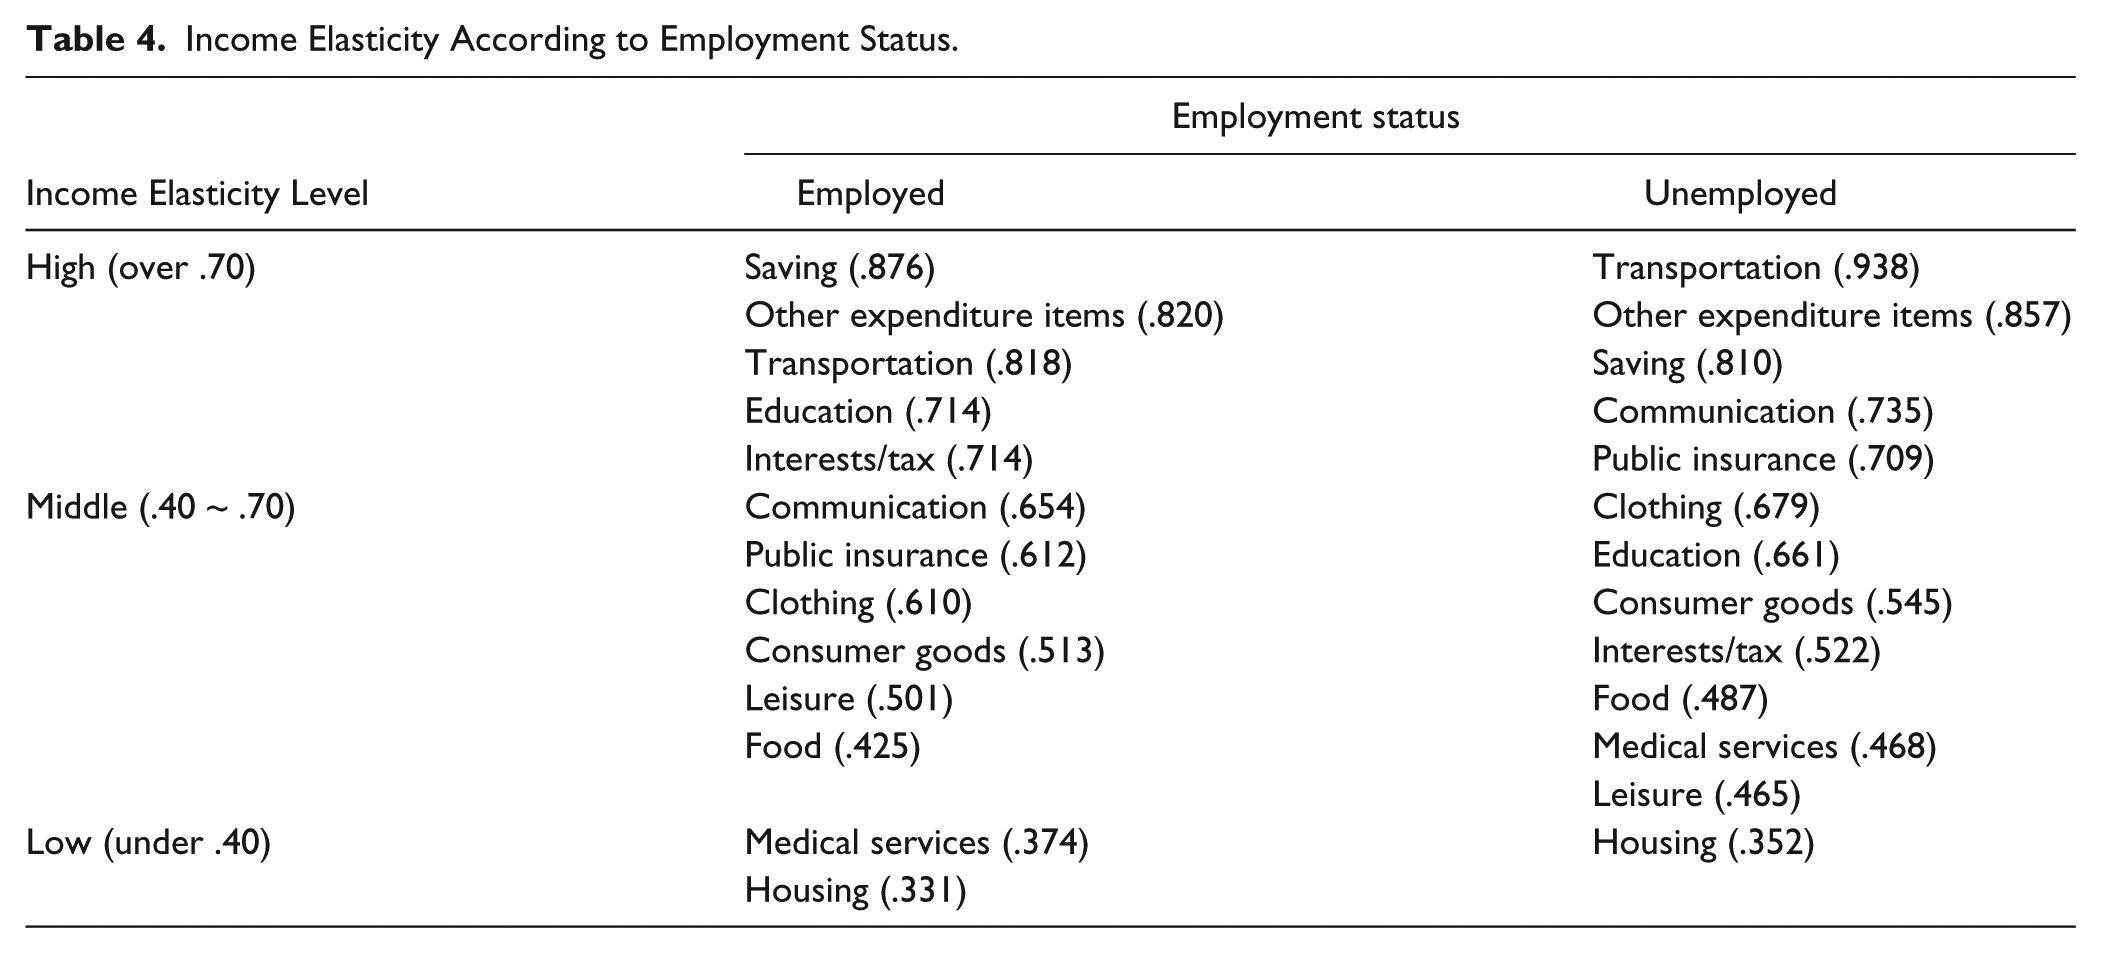
Table 4 presents the income elasticity of consumption items of households that include IWPD based on their employment status. The analysis results indicate that where households include IWPD, whether employed or unemployed, savings, transportation, and other expenditure items had an income elasticity of 0.8 or higher. As shown in Table 4, we divided income elasticity into the following categories for grouping expenditure: 0.7 or higher, 0.4 to 0.7, and lower than 0.4. For households that include employed IWPD, the following items have an income elasticity of 0.7 or higher: savings (0.876), other expenditure items (0.820), transportation (0.818), education (0.714), and interests/tax (0.714). Transportation (0.930), other expenditure items (0.857), savings (0.810), communication (0.735), and public insurance (0.709) showed an income elasticity of 0.7 or higher for households that include unemployed IWPD, thereby indicating that for both types of households, savings, transportation, and other expenditure items showed higher income elasticity. Meanwhile, housing showed low-income elasticity for both types of households, and medical services showed a low-income elasticity of 0.374 for households that include employed IWPD.
Income Elasticity According to Employment Status.
The Engel Coefficient in Households That Include IWPD
The Engel coefficients of households with employed IWPD and those with unemployed IWPD are 22.3 and 30.4, respectively. In terms of overall amounts, the former spent 7.55% more than the latter on food. However, the Engel coefficient of households that include unemployed IWPD was higher than that of households that include employed IWPD by 8.1. Similarly, the income elasticity of food expenditure of the former was higher than that of the latter by 0.062.
Discussion
Although the correlation between disability and poverty is well established, relatively little public policy research identifies the exact definition of disability poverty in real terms or its root causes (Parckar, 2008). A few studies on the economic well-being of individuals with disabilities focused on the general effect and characteristics of income (Mitra, 2006). To understand the ways by which consumption, and thus well-being, can be improved, one must understand the process by which household commodities become available (Magrabi et al., 1991). Well-being is influenced by the balance among the various elements or categories of consumption. Welfare could be improved by establishing a balance among expenditures on various consumption items, without an increase in the total amount of consumption expenditure (Hoyt, 1959). We assumed that a household whose consumption comprises mostly necessities is less well-off than one with a substantial proportion of its consumption expenditure allocated to luxuries (Magrabi et al., 1991). The consumption patterns of households that include IWPD showed that food, housing, and transportation that are typically classified as necessities ranked high in the total consumption expenditure. By contrast, the proportion of expenditure on leisure, generally classified as a luxury, was the lowest in a typical poor household. These results suggest the need of institutional support for providing welfare services such as leisure, education, and pension for IWPD who do not receive food and housing assistance.
In normal situations, the consumption expenditure of a household is determined by income because consumption is possible only when there is an income source. However, when income increases, decisions on increasing or decreasing the expenditure on certain items are to be taken solely by each individual household. Thus, while an increase in income is accompanied with an increase in consumption expenditure, the amount of increase is not identical among all consumption items. Individual households do tend to increase expenditure when income increases. If households already have all the necessities (e.g., food and housing), expenditure on luxuries could increase. However, if households do not have all the necessities, expenditure on necessities could increase. Therefore, the welfare status of a household is affected by its income level as well as its consumption pattern. For example, a household that satisfies its needs by balanced expenditure has a better welfare status compared with a household that spends most of its income on a few necessities. In an extreme scenario, despite no increase in the total income, the welfare status of households could be improved by balanced spending (Moon & Joung, 1997). In this regard, the present study showed that the average monthly income of households that include employed IWPD is higher than that of households that include unemployed IWPD, which leads to more spending on most consumption items, except medical services. However, the consumption patterns of both types of households are similar and unbalanced in that they spend a lot on essential items (e.g., food and housing).
Although the consumption pattern did not differ according to the employment status, the expenditure on all consumption items, except medical services, was larger in households that include employed IWPD than in households that include unemployed IWPD. Furthermore, savings showed the biggest gap; the savings of households that include employed IWPD were 3.03 times higher than those of households that include unemployed IWPD. Expenditure on other consumption items, namely, education and public insurance, also showed considerable difference. Expenditure on education and public insurance of households that include employed IWPD was 3.09 and 2.397 times higher, respectively, than that of households that include unemployed IWPD. Expenditure on public insurance by the former was higher than that by the latter because of their differing employment status. Education plays a vital role in reducing inequality and preparing people for inclusive economic growth. The low expenditure on education and public insurance indicates that the government’s focus is on programs that provide for the old age and future security of unemployed IWPD; hence, primarily, provision of employment opportunities through various vocational rehabilitation programs is important.
The one factor with a significant effect on all expenditure items of both types of households was income. The effect of net worth was partial. Expenditure on only some consumption items was affected. Expenditure on medical services was the only item that was higher for older families; other items showed the opposite effect. Generally, family structure is one of the most important factors that determine the differences in the consumption behavior and pattern of households, and the number of members and employment are considered as very significant variables (Rubin & Koelln, 1996). Specifically, Zhong, Titus, and Johnson (1993) investigated elderly households and found that employment affects the socio-economic status and consumption pattern of such households. Furthermore, Schwenk (1993) reported that unemployment of the head of a household causes income instability, thereby changing the consumption pattern of the household. However, not only the employment of the head of the household but also that of other household members affects the economic status of the households. Specifically, a greater number of employed members in a household increase both income and consumption, thereby changing the household’s consumption pattern. For example, a few studies reported increased expenditure of double-income households on items such as dining out, convenience food, transportation, and education (Jacobs, Shipp, & Brown, 1989). This study shows that the employment of individuals with disabilities affects consumption patterns by increasing the consumption expenditure in most items. However, in the case of medical services, the expenditure of the households that include unemployed IWPD was more than that of households that include employed IWPD. In addition, the number of employed IWPD had a positive relationship with expenditure in most consumption items, except education. Thus, the consumption pattern of a household seems to change depending on the employment of members with disabilities and the number of employed members.
To understand the features of expenditure items based on the employment status of households that include IWPD, this study analyzed income elasticity, which indicates the increase in expenditure on a consumption item resulting from an increase in income by 1%. According to Kyrk (1923), if the income elasticity of an item is greater than 0 and less than 1, it is classified as a necessity, and if the income elasticity is greater than 1, it is classified as a luxury. More specifically, with an increase or decrease in income, spending on a necessity moves in the same direction; however, the expenditure ratio is lower than the ratio of the increase or decrease in income. However, with an increase or decrease in income, the percentage change in expenditure on a luxury is greater than the percentage change in income. However, the analysis indicated that in the case of households that include IWPD, whether employed or unemployed, only savings had a high-income elasticity. Accordingly, only savings are classified as a luxury in classical theory. Leisure and housing showed low-income elasticity in both types of households. This result has the same implication as that of the consumption pattern. Among households that include employed IWPD as well as those that include unemployed IWPD, education showed the greatest difference in income elasticity. This finding shows that education is a luxury for households that include employed IWPD but a necessity for households that include unemployed IWPD.
The Engel coefficient, which is a significant empirical measure in consumption economics, also indicated the low well-being of households that include IWPD. In the 1970s and the 1980s, the Engel coefficient of Korea was in the 30% to 40% range. The nation’s index fell below the 20% range in the mid-1990s and stood at 13.3% in the first half of 2012 (S. A. Kim, 2012); panel data for this study were collected for the latter period. In particular, employment status significantly affects economic well-being in 30.4% of households that include unemployed IWPD.
The significant decline in individuals’ incomes after disabilities occur translates into substantial reductions in their economic well-being. The labor income of IWPD is a primary determinant of their economic well-being (Burkhauser & Daly, 1998). The economic well-being of IWPD is dependent on whether they are employed. Programs centered on creating and providing employment are used to replace lost earnings (Burkhauser & Daly, 1998). The large differences in all consumption expenditure items between households that include employed and those that include unemployed IWPD suggest that employment is the most important factor for economic well-being.
Unbalanced consumption patterns suggest that government programs provide an insurance against the shock of disabilities and focus on balancing consumption patterns. They also show the insufficiency of data for examining the role of employment in the economic well-being of IWPD. The analysis of the consumption patterns of households that include IWPD could provide implications for creating effective policy measures to compensate for the extra costs (Mitra, 2006).
IWPD is the largest population in the total population of individuals with disabilities. On considering disabilities in only one domain of disability, IWPD in the groups aged 15 years and older and in that aged 65 years and older were 9.3% and 26.0%, respectively (Brault, 2012). Furthermore, the population with disabilities is rather diverse with respect to age, health condition, work, and income (Bennefield & McNeil, 1989); this is also true for IWPD and their sub-groups. Meyer and Mok (2008) stated that a group with the least disabilities does not exhibit large changes in consumption expenditures, unlike a group with the most disabilities. In this study, consumption was analyzed only on the basis of employment status. However, future studies must consider the diversity of IWPD while analyzing consumption for effective policymaking.
Implications for Policy
While it is well known that individuals with disabilities have a high cost of living, little is known regarding their specific expenses (Batavia & Beaulaurier, 2001). The results of this study provide basic data for policymaking based on an understanding of the consumption patterns of IWPD.
The first implication for policymakers is that they should aim to increase the employment rate of IWPD. Economic well-being is significantly associated with paid employment (Fleming, Fairweather, & Leahy, 2013). Increasing the employment rate of IWPD needs to be the primary objective in policymaking because job loss leads to poverty. The findings of the present study are consistent with those of previous studies that state employment has a significant effect on economic well-being. Specifically, the life satisfaction of employed IWPD was 3.24 and was higher than that of unemployed IWPD at 2.80. In addition, the analysis results related to consumption showed that households that include employed IWPD have more positive aspects such as larger consumption expenditures than households that include unemployed IWPD. Although governmental efforts to improve the employment rate of IWPD are ongoing, they are not satisfactory. National surveys worldwide reported the low socio-economic status of IWPD. For instance, the U.S. Department of Labor (2013) reported 20.3% labor force participation and 14.7% unemployment rate for IWPD. The 2011 Korean Disability Survey indicated that their labor force participation was 38.5% and employment rate was 35.5% (S. Kim et al., 2011). Generally, in developing countries, 80% to 90% of IWPD of working age are unemployed, and in industrialized countries, this figure is between 50% and 70% (United Nations, 2007). The results of this study and global employment statistics suggest that employment improvement policies should evolve continually to ensure the economic well-being of IWPD.
The analysis of households’ consumption pattern provides detailed information on differences in expenditure needs of households that include IWPD. The results of this study are consistent with those of previous research, according to which individuals with disabilities face extra costs from paying for adaptations to their home, social care support, mobility aids, and communication aids related to managing their impairment (Parckar, 2008; She & Livermore, 2007). Furthermore, in households that include unemployed IWPD, food and housing expenditure accounted for more than 50% of overall consumption expenditure and transportation and communication expenditure accounted for a significantly large proportion as well. Such a consumption pattern that reveals a large proportion of income is spent on basic needs indicates that the government must provide support to these households for meeting their living expenses. In particular, a housing policy must be designed for their benefit. Furthermore, the revealed consumption patterns also imply that providing financial assistance for transportation and communication will be an efficient measure for improving the economic well-being of households that include unemployed IWPD.
Another policy issue that is evident from the consumption analysis of the present study is that the increase of income from employment did not lead to a change in the related consumption pattern, despite the difference in the total amount of consumption. Households that include IWPD have extra costs (Palmer, 2011). In the present study, the consumption patterns of households that include IWPD were found to be similar to those of a typical poor household and were not affected by employment status. S. Kim et al. (2011) stated that a monthly household income of 1,982,000 KRW (South Korean won; equivalent to US$1,772) indicated the lowest quintile or poverty line among respondents with disabilities. In the present study, the monthly income of households that include employed and those that include unemployed IWPD was 2,207,800 KRW and 1,930,800 KRW, respectively. In the United Kingdom, 30% of adults with disabilities lived below the poverty line (Parckar, 2008). In the United States, 23% of working-age IWPD were classified as poor, compared with 9% of individuals without disabilities (Stapleton, O’Day, Livermore, & Imparato, 2006). The large proportion of poor among IWPD and the fact that employment has no effect on their consumption pattern indicate the government needs to enlarge public financial assistance to support the minimum living expenditure of low-income households headed by IWPD.
Furthermore, the results revealed the difference in the income elasticity of education between employed and unemployed IWPD. The income elasticity of education among unemployed IWPD is lower than that among employed IWPD. This means that education is a luxury for households that include employed IWPD but a necessity for households that include unemployed IWPD. Moreover, educational attainment can have a direct impact on future life opportunities. Policies related to education must be designed for households that include unemployed IWPD; governmental support for the cost of education (basic and higher) for IWPD is recommended. Furthermore, the income elasticity pattern of savings is similar to that for education. Savings play an important role in preparations for retirement. Policymakers should be able to predict the longitudinal effect of savings among IWPD and identify the possible deteriorating relationship between aging and disability. In addition, a financial education program for IWPD should be designed.
Analysts of policies for IWPD have long recognized the central role of employment for effective financial assistance. Tracking the relative well-being of important socio-economic groups is central to understanding the anatomy of economic inequality. Despite the obvious association between disability and poverty, IWPD are not given sufficient importance and little reliable statistical information pertaining to them is available. The results of this study could enable researchers to capture the problems faced by IWPD and provide greater insight into their economic status.
Footnotes
Declaration of Conflicting Interests
The author(s) declared no potential conflicts of interest with respect to the research, authorship, and/or publication of this article.
Funding
The authors received no financial support for the research, authorship, and/or publication of this article.