
Abstract
Background
Terminally ill patients benefit from earlier engagement in palliative care. However, this does not always occur. This project assessed if an already available risk score, the Care Assessment Needs (CAN) score, would be able to identify patients at greatest risk for mortality within 30 days of hospital admission within the Veterans Health Administration (VHA).
Methods
The cohort of this retrospective analysis included all VA acute are patients over 18 years of age with a recent CAN score. The CAN score is an automatically calculated VA risk score that was repurposed to determine if it could predict risk of mortality after acute care admission. Univariate logistic regression was performed to obtain the probability of mortality within 30 days of admission, based on their CAN score.
Results
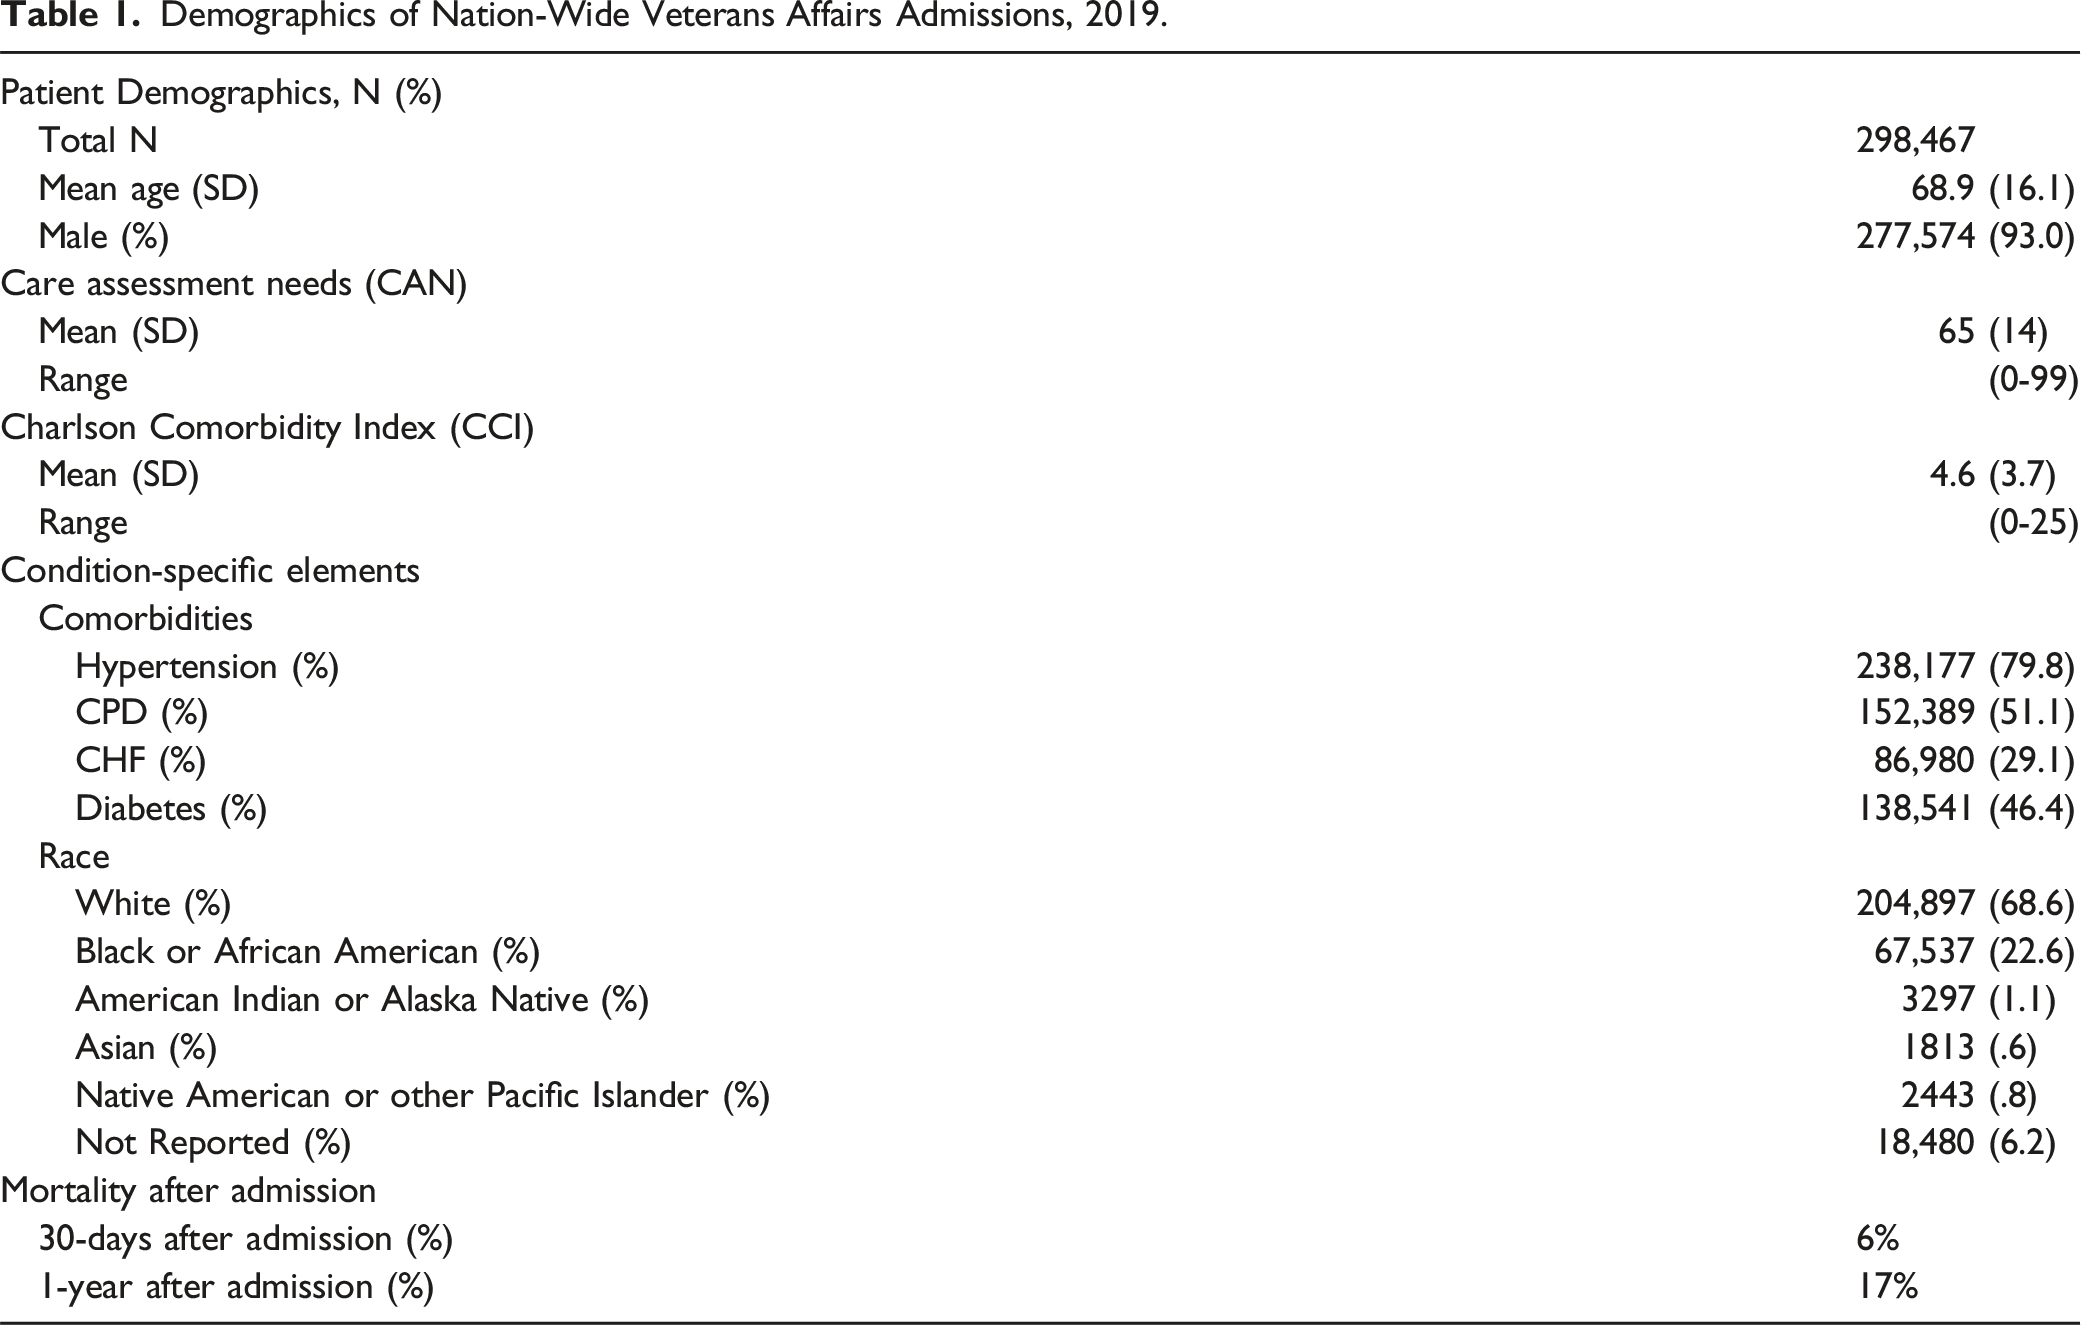
298,467 patient records were assessed from January 1, 2019, to December 31, 2019. There was 6% mortality after 30 days of admissions, and 17% mortality within 1-year post-admission. Mean CAN score was 65 (SD: 29). On average, each incremental increase in the CAN score increased the probability of mortality by 7%. Patients with a CAN score of 90 had a 10% probability of 30-day post-admission mortality.
Conclusion
A readily available risk score, automatically calculated from EHR data, was able to identify patients at high risk for 30-day mortality in the acute care setting. Next steps will be to assess how the CAN score can be utilized to in improve end of life care for high-risk hospitalized Veterans.
Introduction
Palliative care has many benefits for both the patient and the healthcare system including reduced hospital mortality, care costs, emergency department visits, readmissions, and invasive high acuity care at the end of life.1-5 Early palliative care also improves quality of life, illness understanding, symptom management, and survival.6-11 Yet many patients receive this care too late, if at all. 12 One factor is that clinicians have been shown to be inaccurate in determining prognosis for terminally ill patients, typically erring towards optimism, which may adversely affect end-of-life care. 13 This inaccurate prognostication results in delay of care, with the median time in hospice being less than 2 weeks prior to death and many only referred within days before death. 14 A process to improve clinician’s ability to quickly identify patients with high risk of mortality is needed.
Healthcare systems are overburdened and new processes for risk assessments require valuable time and resources. Thus, repurposing available automated tools to assess risk of mortality is attractive. The Veterans Health Administration (VHA) has developed a risk stratification tool called the Care Assessment of Needs (CAN) score that utilizes a patient’s existing electronic health record (EHR) data to automatically calculate a numerical mortality risk score. The CAN score was designed to support ambulatory care teams in the systematic identification of outpatients with high risk of near-term hospitalization or mortality (depending on the model) to better identify individuals with high healthcare utilization needs (i.e., palliative care, emergency services, etc.). 15 Prior work has also demonstrated the value of repurposing this score to predict outcomes for a variety of other specific healthcare situations, including surgical risk, cancer survival, and COVID-19 outcomes.16-18 The CAN score is already calculated weekly on all Veterans in VHA and used in the ambulatory settings, which lowers the barriers to implementation.
This quality assessment and improvement project was designed to assess the potential of repurposing the CAN score to identify patients at high risk for short-term mortality after admission to the VHA inpatient setting.
Materials and Methods
This project was performed within VHA, which is the largest integrated health care system in the United States (US), serving over 9 million patients. 19 The assessment utilized the latest versions of the CAN score (version 2.5), which uses binary logistic regression probability models to produce a single cumulative score from 0 to 99. A higher CAN score represents a higher risk patient compared to their peers. CAN scores are automatically calculated from the VHA’s national EHR database, utilizing multiple structured data elements, including socio-demographics, clinical diagnoses, vital signs, medications, lab values, and health care utilization data (S1). The scores are updated weekly on all living Veterans who receive primary care services within VHA. There are currently six different CAN scores, with the 1-year mortality model being the score selected for this assessment. 20
This assessment was conducted using VHA acute care admissions data from January 1, 2019, to December 31, 2019. Patients were excluded from the assessment if they were below age of 18, if they did not have a CAN score calculated within 6 months of the assessment period, or if they had erroneous death dates, such as the date of death was listed prior to admission. The admissions data was obtained from VHA’s Corporate Data Warehouse (CDW), which aggregates EHR data from all VHA facilities. In the event of multiple admissions during the assessment timeframe, we only utilized the most recent admission. Only admissions that were considered “acute care” were counted in the analysis, which included medical, surgical, specialty, and mental health. Patients admitted only as “observation” status were not included. Patients that were initially admitted under an observation status and later converted to full admission status counted as two separate admissions in the record. To appropriately account for this potential overcounting issue, we combined these types of admissions data by using the observation admission as admission date and the discharge from full admission as the discharge date. To further ensure individual patients were only counted one time during the assessment period, we only assessed the patient’s latest admission. The patient’s most recent CAN score that immediately preceded the admission date was utilized.
Univariate logistic regression was performed to obtain the probability of mortality within 30 days of admission, based on a patient’s most recent pre-admission CAN score. Demographic predictors (e.g., age and sex) were not included since they were already integrated into the existing CAN score model. Analyses was performed using Microsoft SQL Server 18. And SAS JMP 16.1 (SAS Institute). This project received a Determination of Non-Research from Stanford IRB (Stanford University, Stanford, CA, USA), Protocol # 64459.
Results
A total of 316,917 unique inpatient stays qualified for the initial inclusion. Patients who did not have a CAN score calculated within 6 months were excluded, along with 18 patients with erroneous death dates, resulting in the final cohort of 298,467. (S2).
Demographics of Nation-Wide Veterans Affairs Admissions, 2019.
Overall Logistic Regression Model Parameters for CAN Score as a Predictor of 30-Day Mortality in Hospitalized Patients for Acute Care.
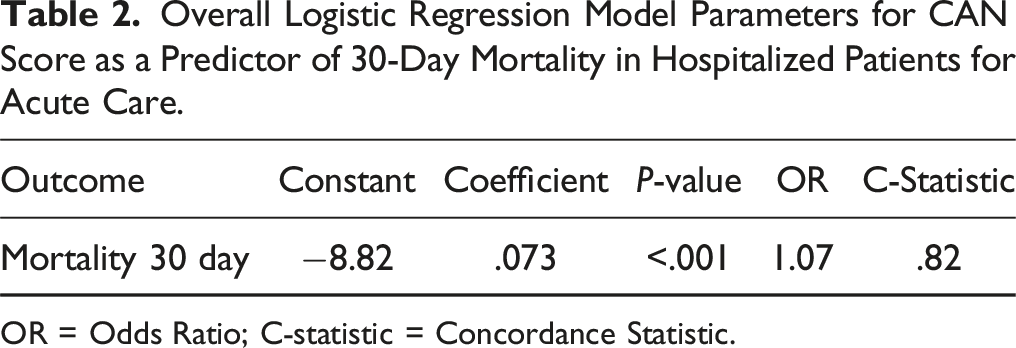
OR = Odds Ratio; C-statistic = Concordance Statistic.
Calibration of Regression Model for CAN Score Across Deciles of Predicted 30-Day Mortality in Hospitalized Patients for Acute Care.
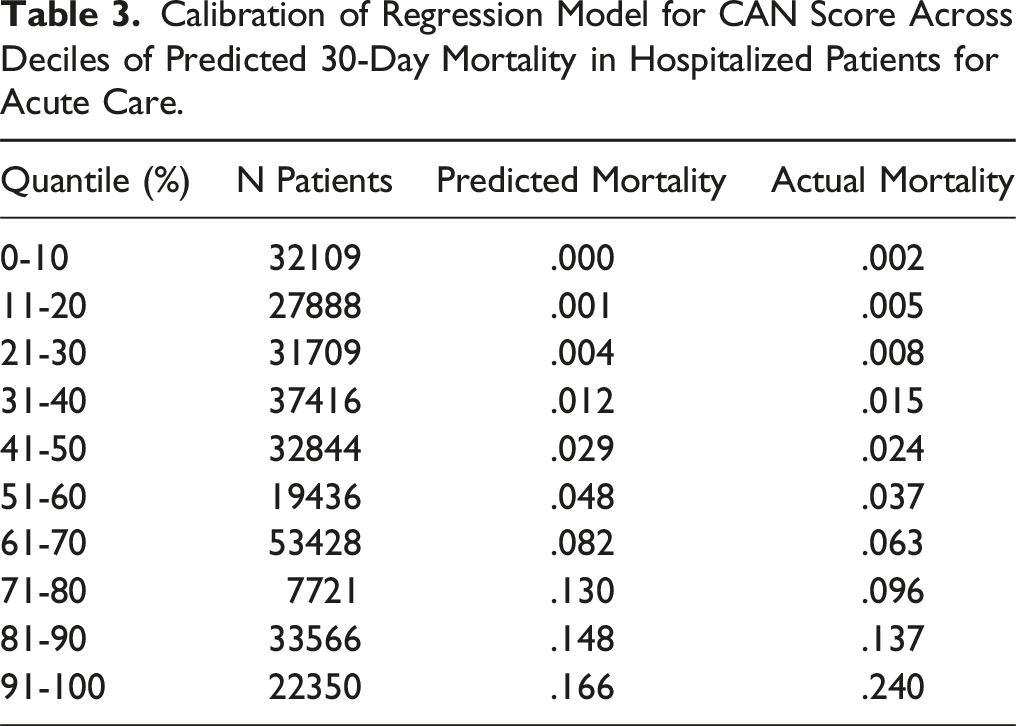
We plotted the probability of post-admission 30-day mortality, with each CAN score increment between 0-99, to better assess if there was a linear or non-linear increase in mortality risk as the CAN score increased (Figure 1), while also modeling the proportion of post-admission 30-day mortality per CAN score. This demonstrated that, on average, the probability of mortality increased by 7% (odds ratio [OR]: 1.07), with each incremental increase in the CAN score. As the probability of mortality is significantly low with a CAN score of 0 (P < .001), there was a minimal increase in mortality odds until a CAN score of approximately 50. Notably, risk started to exponentially increase at 50 going up to a score of 99. This was expected, as the increase in risk of mortality becomes progressively larger with each incremental increase in CAN score, with a 7% increase in mortality risk between each CAN score value. For example, a CAN score of 65 is associated with a 2.0% risk of mortality, and a CAN score of 66 is associated with a 2.14% (2.0% previous mortality risk x 1.07 odds of mortality) chance of mortality (actual increase = .14%). At a CAN score of 90, the actual mortality risk is 10.0% and 10.7% (10% previous mortality risk × 1.07 odds of mortality) at a CAN of 91 (actual increase = .7%). At the approximate mid-inflection point of the probability distribution, there was a 10% risk of mortality probability corresponding to a CAN score of 90. Probability of death within 30 Days of an acute care admission in 2019 by CAN score (1-year mortality model). The probability of death within 30 days following admission to an acute care unit based on a patient’s most recent pre-admission CAN score was modelled using univariate logistic regression. The bars in the graph depict the average proportion of mortality for each incremental value of the CAN Score model of mortality (1 Year).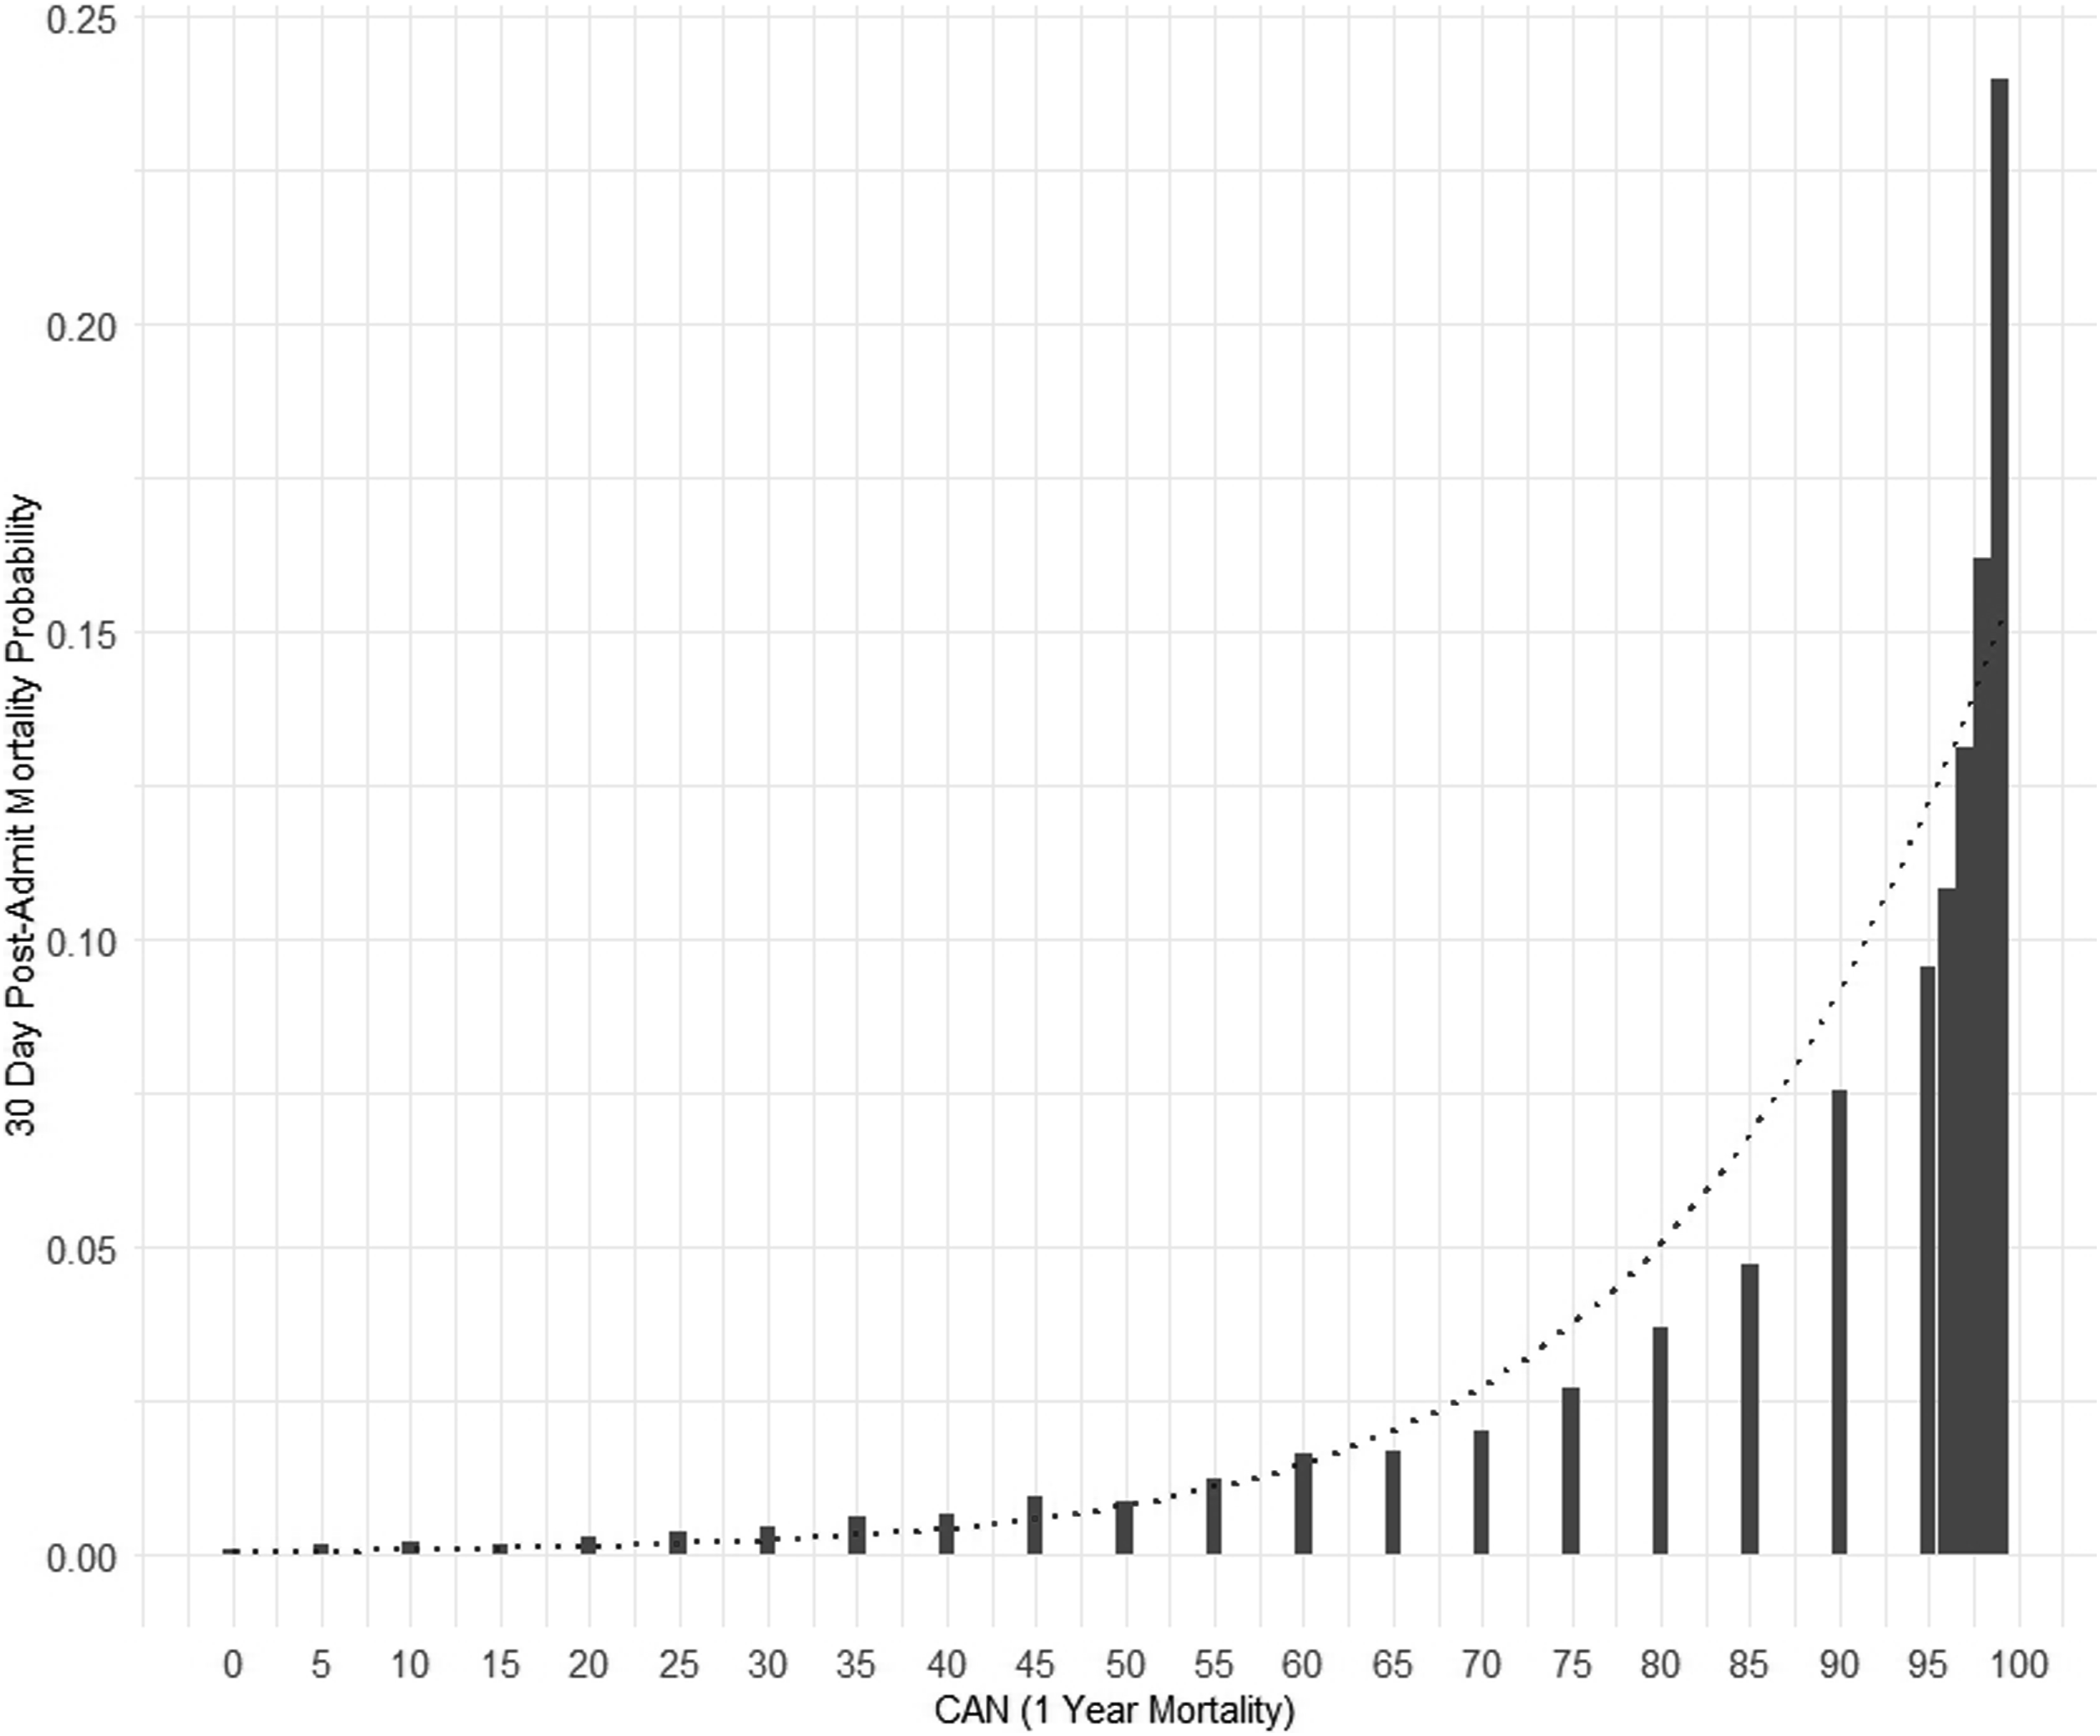
Discussion
Improving the process that connects high-risk patients to end-of-life discussions and resources can improve the patient experience, quality of life, and efficiencies at the hospital level. Furthermore, predictive tools that can assist clinicians in understanding each patient’s risk of mortality could ensure high-risk patients are connected with the appropriate resources for palliative care in a timely manner. In doing so, clinicians may be empowered to ensure patients and their families are prepared for the path ahead and have an opportunity to thoroughly discuss goals of care with the family and the entire care team in a controlled setting.
The VHA serves patients who are typically older with more comorbidities and complications than the general US population. 21 Therefore, having tools that facilitate end of life discussions and care plans, when appropriate, is of significant value. Our assessment demonstrated that, on average, each 1 increment increase in CAN score increased the probability of mortality by 7%. At a CAN score of 90, there was 10% 30-day post-admission mortality probability. At a CAN score of 91, that number grows to 10.7%, which is a 7% actual increase. Although advanced directives and end of life preference discussions are appropriate for all patients, there is often limited time to do so. 12 Therefore, repurposing available tools, such as the CAN score, prioritize increasing efficiency Another metric utilized by VHA and other healthcare facilities is the post-admission 30-day standardized mortality ratio (SMR30), which is the number of observed deaths that occur within 30 days of hospital admission compared to the number of deaths predicted to occur within 30 days of hospital admission.22-24 SMR30 is calculated retrospectively, which prevents its use as a proactive tool to flag at-risk patients and, therefore, prompt end of life care discussions.
A strength of this assessment is our large cohort that allowed statistically significant insights. Additionally, since the CAN score is automatically calculated from routinely collected EHR data, it offers a convenient reference marker for time constrained clinicians. This assessment provides important data intended to inform quality improvement projects that can utilize threshold values as a flag to initiate and empower important palliative care discussion to those at greatest risk. A constraint of this assessment is that it has limited generalizability to other patient populations as our unique Veteran population tends to be older, male, and are more likely to have multiple comorbidities when compared to other US healthcare systems.20-26 In addition, the CAN score is a VHA specific tool that is not available in other healthcare systems outside the VHA. Importantly, as with any clinical decision support tool, predictive scores must be used cautiously as a guide to clinicians in the context of clinical care circumstances and patient preferences.
Conclusion
A risk score, automatically calculated from EHR data, was able to effectively identify patients at high risk for 30-day mortality in the inpatient- acute care setting for a population where the majority of patients are male, older, and predominately White. Further investigation is needed to identify the utility of the CAN score in improving coordinated care for high-risk hospitalized Veterans.
Supplemental Material
Supplemental Material - Automated Electronic Health Record Score to Predict Mortality Risk at the US Department of Veterans Affairs
Supplemental Material for Automated Electronic Health Record Score to Predict Mortality Risk at the US Department of Veterans Affairs by Thomas F. Osborne, Zachary P. Veigulis, Anna Ware, David M. Arreola, Catherine Curtin, and Marianne Yeung in American Journal of Hospice and Palliative Medicine®
Footnotes
Declaration of Conflicting Interests
The author(s) declared no potential conflicts of interest with respect to the research, authorship, and/or publication of this article.
Funding
The author(s) received no financial support for the research, authorship, and/or publication of this article.
Supplemental Material
Supplemental material for this article is available online.
References
Supplementary Material
Please find the following supplemental material available below.
For Open Access articles published under a Creative Commons License, all supplemental material carries the same license as the article it is associated with.
For non-Open Access articles published, all supplemental material carries a non-exclusive license, and permission requests for re-use of supplemental material or any part of supplemental material shall be sent directly to the copyright owner as specified in the copyright notice associated with the article.