






Abstract
Network analysis is one of the instruments in the communication audit toolbox to diagnose communication problems within organizations. To explore its contribution to a communication audit, the authors conducted a network analysis within three secondary schools, comparing its results with those of two other instruments: interviews focusing on critical incidents and a communication satisfaction questionnaire. The results show that network analysis may complement interview and survey data in several ways, by uncovering unique problems or by explaining or corroborating problems that were uncovered by the critical incidents or the survey. The results also show that additional data are sometimes needed to make sense of network characteristics.
Keywords
In 1979, Goldhaber and Rogers published the International Communication Association (ICA) communication audit, which consisted of various research instruments for assessing the quality of organizational communication. A communication audit is a thorough evaluation of the strengths and weaknesses of an organization’s internal communication system. The purpose of such an audit is to diagnose communication problems and propose strategies for improvements. Typically, the communication audit tool kit includes not only general research methods, such as interviews, focus groups, surveys, and observations, but also more specialized ones, such as communication diaries, the critical incident technique (CIT), and content analysis. In the following decade, several scholars published books about the communication audit methodology (Booth, 1986, 1988; Downs, 1988; Hamilton, 1987). After a period of silence, new books about communication audits started to emerge in the 2000s (Downs & Adrian, 2004; Hargie & Tourish, 2000, 2009). Throughout the years, the literature about communication audits has been rich in handbooks, but methodological research comparing the pros and cons of separate instruments is relatively scarce.
One of the instruments included in all communication audit handbooks is network analysis. From the start, network analysis has received a lot of attention from practitioners and scholars of organizational communication. For a while, network analysis was even considered “the heart and soul of organizational communication theory and analysis” (Heath, 1994, p. 202). Today, it is widely used by scholars from various research areas to map the relationships between people in societies, organizations, and other groups.
The literature on network analysis within organizations comprises two research streams. The first focuses on the emergence and effects of communication networks in organizations (e.g., Brass, Galaskiewicz, Greve, & Tsai, 2004; Cravens, Piercy, & Shipp, 1996; Ferlie & Pettigrew, 1996; Monge & Contractor, 2001, 2003). Monge and Contractor (2003) provided an overview of the reasons why networks emerge. Based on many studies, they concluded that employees engage in interactions for various reasons: They are physically proximate, they have similar personal and demographic characteristics (the homophily principle), or they need other’s (material) resources (the self-interest principle). But most of the research so far has focused on the effects of networks. For instance, Burt (1992) showed how employees’ position in a communication network affects their exposure to and control over information. Granovetter (1973) argued that weak ties are often responsible for providing people with information that is new to them (“the strength of weak ties”). Such ties also appear to affect information dissemination within organizations (Weenig, 1999). Since network relations make employees aware of the attitudes and behaviors of other organization members, the patterns of relationships may help explain why people develop certain attitudes or beliefs regarding their organization (Feeley & Barnett, 1996; Ibarra & Andrews, 1993; Meyer, 1994; Pollock, Whitbred, & Contractor, 2000). Employees who are part of a separate social group may develop a collective view of the organization or evaluate job-related aspects in more or less the same way (Lucius & Kuhnert, 1997).
The second research stream addresses methodological questions regarding network analysis. Researchers have investigated which data collection techniques best map communicative relationships between people (Bailey & Marsden, 1999; Bass & Stein, 1997; Marsden, 2003, 2005; Van Tilburg, 1998; Zwijze-Koning & De Jong, 2005). For example, Marsden (2005) concluded that asking specific questions about the communicative relationships between employees (e.g., With whom do you communicate about problems regarding your work?) results in more reliable data than does asking more general questions about such relationships (e.g., With whom do you communicate about work-related matters?). Other researchers have focused on analyzing network data, resulting in a broad range of measures that can be used to describe the communicative patterns in networks (cf. Freeman, White, & Romney, 1992; Monge & Contractor, 2001; Rice & Richards, 1985; Scott, 2000; Wasserman & Faust, 1994). These measures usually include the density of a network, the level of network centralization, or an individual’s level of centrality within the network.
All these efforts have greatly increased our understanding of communication and organizational phenomena as well as of network data analysis. But such network analysis has seldom been studied in the context of communication audits. Network analysis was originally included in the communication audit toolbox to uncover (a) where information flows get blocked or communicative overload exists in an organization’s communication system and (b) who is blocking the information flow or experiencing the overload (Downs & Adrian, 2004). As such, network analysis was assumed to help uncover communication problems within organizations. Many researchers writing about communication audits have simply adopted the technique that Goldhaber and Rogers (1979) presented and discussed it in its most basic form. In the more recent handbooks on communication audits, Downs and Adrian (2004) and Hargie and Tourish (2009) incorporated some of the advances in network analysis, but in the previous handbooks, this information has not been integrated (Booth, 1988; Hamilton, 1987; Hargie & Tourish, 2000). Because the technique’s potential to uncover the communicative strengths and weaknesses of an organization has hardly been explored, systematic research into the extent to which it provides such insight is needed.
In this article, we describe a first study into the use of network analysis as a communication audit instrument. In three organizations, we conducted a network analysis and compared its results with those of two other instruments: interviews based on the CIT and a survey of communication satisfaction. Before we describe the design and results of our study, we first discuss in more detail the methodology of network analysis, focusing on data collection, and the way that network measures may be used to detect and diagnose communication problems.
Network Analysis: Goals and Data Collection Methods
More than a research methodology, network analysis has become a unique perspective from which researchers view the world, societies, organizations, and so on (Harland, 1996; Nohria, 1992; Oberg & Walgenbach, 2008; Rogers & Argawala-Rogers, 1995; Stohl, 1995). The most typical feature of network analysis is that it focuses on relationships between people instead of on the characteristics of individuals. Researchers who conduct network analysis try to explain people’s behavior and attitudes by studying the communicative patterns within their social or professional relationships. In organizations, such patterns may include the extent to which people exchange information on a given topic or seek each other’s advice in important matters.
In an earlier study, we provided an extensive overview of the possible goals and data collection methods for network analysis in communication audits (Zwijze-Koning & De Jong, 2005). We concluded that network analysis mainly involves mapping communication patterns within organizations and that two strongly related goals are identifying groups with an organization and establishing the communicative roles of employees (e.g., stars and isolates). In addition, we distinguished a number of optional goals that depend on the method of data collection: investigating communication channels, the relationship between information types and network characteristics, employees’ perceived communication load, communication styles, the perceived effectiveness of communication, message distortion, and possibilities for bottom-up communication.
We identified six data collection methods for conducting a network analysis (Zwijze-Koning & De Jong, 2005). The most common method focusing on more or less stable and organization-wide network patterns is the use of sociometric questions (Bovasso, 1996; Feeley, 2000; Friedkin & Slater, 1994; Human & Provan, 1997). Using sociometric questions to map communicative relationships involves asking participants to report their contacts with other members of the organization. The network analysis in the original ICA communication audit (Goldhaber & Rogers, 1979) used one sociometric question (“During a typical workday, I usually communicate about work-related matters with the following people through the following channels”). Other examples of sociometric questions are “With whom do you discuss important organizational issues?” and “Whom do you go to for advice within this organization?” Sociometric questions may also investigate the frequency of contact between employees, the medium used, or the subject matter discussed. The other data collection methods are communication diaries, observation, archival data (e.g., mail, e-mail, phone traffic), and two specialized approaches to following the routes of specific messages: the Episodic Communication Channels in Organizations (ECCO) approach and the Small World Technique.
In this study, for our network analysis, we used sociometric questions aimed at uncovering the communication patterns, subgroups, and communication roles of employees.
Measures for Detecting and Diagnosing Communication Problems
Because network analysis can result in a confusing depiction of tangled network relationships (imagine depicting a network of 300 employees and their relationships), many researchers have developed network measures that describe the patterns of relationships between employees (Carrington, Scott, & Wasserman, 2005; Freeman et al., 1992; Rice & Richards, 1985; Scott, 2000; Wasserman & Faust, 1994). Monge and Contractor (2001) distinguished three types of network measures. The first type measures the relationships between employees, such as the frequency of contact between two employees, the strength of their relationship, and the extent to which the relationship is reciprocal (both employees acknowledge the relationship). The second type measures the position of individuals in a network, such as in-degree (the number of incoming relationships) or betweenness centrality (the extent to which an employee mediates the communication between two other employees). The third type measures the characteristics of an entire communication network, such as its inclusiveness (the extent to which all employees have relations), its density (the number of contacts within an organization), or its centralization (the extent to which only a few employees are responsible for communication within the organization).
Although it is not hard to imagine that such measures may be linked with the communicative strengths and weaknesses of an organization, these links have received little research attention. The focus has predominantly been on the mathematical background of network measures and how to calculate them. Although the importance of such efforts is beyond dispute, the ways in which these network measures uncover actual communication processes in organizations are underexposed. Network analysis seems to have developed primarily as a computational and mathematical tool for addressing fundamental research questions about network structures rather than a method for detecting and diagnosing communication problems within organizations.
Few researchers have explicitly connected network measures to the quality of an organization’s communication system. Haythornthwaite (1996) related network measures to information exchange processes in organizations and, more specifically, to employees’ information needs and opportunities. She assumed that the strength of an employee’s relationship with a colleague affects the degree to which the employee can legitimately deliver information to that colleague and that the patterns of relationships within an organization indicate the dominant information routes within the organization (top-down vs. bottom-up communication). Downs and Adrian (2004) discussed several measures that can be used to describe networks, such as density, complexity, and centralization, and explored the communicative consequences of these measures. Centralized networks, for example, may be associated with less democratic processes of decision making, and multifaceted relationships (communicative relationships about multiple topics) may indicate influential relationships. Downs and Adrian also presented a case study in which they touched on the potential of network analysis for uncovering communication problems within an organization. They discussed the visualization of communicative relationships in an organization, stressing the importance of looking for surprises in the network.
In this study, we visualized the network structures of the organizations and calculated several well-known network measures that we tried to connect to the quality of these organizations’ communication systems.
Method
In this section, we outline the method of our study—our research setting and participants, the data collection, and analysis.
Research Setting and Participants
The data that we used for this study come from a larger research project. Other studies stemming from that project address the validity of the CIT as a communication audit instrument (Zwijze-Koning, De Jong, & Van Vuuren, 2014), compare critical incidents with the results of the Communication Satisfaction Questionnaire (CSQ; Zwijze-Koning & De Jong, 2007), and examine the communication issues in large secondary school organizations (Zwijze-Koning & De Jong, 2009).
Three large organizations in the Netherlands participated in our study. These were all secondary schools, with staff varying from 249 to 326 employees (see Table 1). All three schools had undergone multiple mergers since the Dutch government had recently imposed a new educational system. The schools all had several departments that were responsible for the different types of education and were situated in separate buildings. As a result, the schools were dealing with many organizational and communicative challenges and a general feeling of dissatisfaction with the organizational communication of the board of directors. The first school approached our university with a request for research; after completing the first case study, we successfully tried to find two similar schools in the same region to expand our number of cases to three. Before we started collecting data, the study was approved by the Institutional Review Board at our university.
Information About the Organizations Studied.
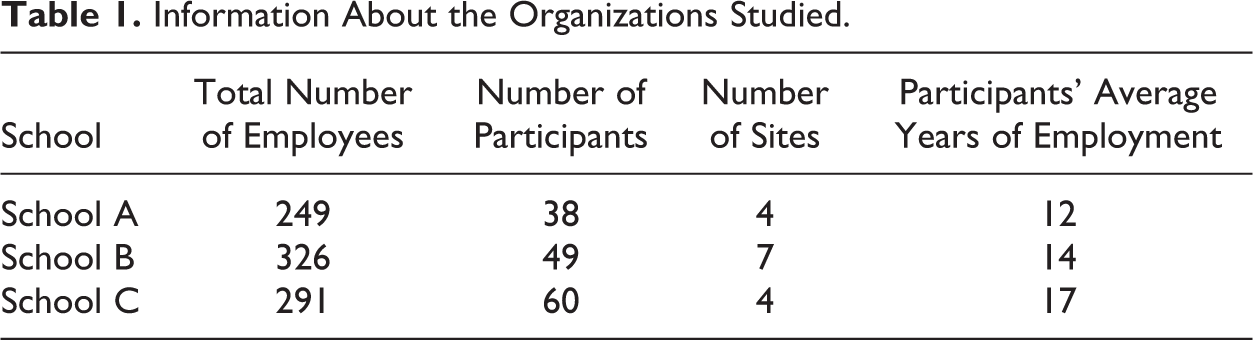
In total, 147 employees participated in this study. We selected participants according to a stratified sample that included all direct supervisors and a representative number of their subordinates. In this way, our sample included a broad range of employees varying from top management executives, senior and middle managers, to teachers, receptionists, and janitors, with representative numbers of participants from the different sites of each school. Of these participants, 70% were male. The participants’ mean age was 44 years, and they had worked for their current employer for an average of 15 years. There were no significant differences between the three schools for gender or age, but participants from School C had worked for their current employer significantly longer, on average, than had those from School A, F(2, 162) = 3.310, p < .05.
Data Collection
One of us (Zwijze-Koning) interviewed all of the participants individually for one hour on average. During this session, the participants carried out three different types of tasks. First, on a roster containing all their colleagues’ names, they indicated how often they had contact with every other employee in their organization (the network analysis). Second, they were asked to name and discuss several critical communication events (the CIT) from which the schools derived communication problems and strengths. And third, they filled out a questionnaire regarding their overall communication satisfaction.
In the first task (the network analysis), the participants indicated the frequency of their contacts with colleagues, excluding interactions that consisted merely of greetings. They could choose from four contact categories (daily, weekly, monthly, or yearly) and specify the number of times per day, week, month, or year. For example, if participants communicated with a colleague three times a week, they would mark 3W behind the colleague’s name. When they only communicated four times a year, the participants would write 4Y. From these reported contacts, we were able to construct an overall communication network. Then the participants indicated the topics that they usually discussed with the colleague in question. They could choose from three prestructured categories: coordination issues (e.g., organizing a parent’s evening or deciding on a time and place to give an examination), strategic issues (school policy matters, e.g., the school’s identity or the effects of the national educational policy), and personal issues (e.g., the news, hobbies, or home events). Participants could mark more than one category per contact. After we introduced the categories, the participants filled out the roster. Most participants spent about 20 minutes on the network task.
The second task (the critical incidents interview) started with general questions about the participants’ work responsibilities and daily work routines. After that, we used the CIT to map specific communication problems and strengths that participants experienced in their work (Tourish & Hargie, 1998). This technique, which Flanagan (1954) originally developed, was introduced as a communication audit instrument by Goldhaber and Rogers (1979). In another study, we evaluated the validity of the CIT as a communication audit tool by analyzing whether the method worked according to its rationale (Zwijze-Koning et al., 2014). The results of that evaluation were positive: Participants generally focused on specific (unique or recurring) communication events, many of which had a clear relationship with sensemaking processes. We implemented the CIT in the interview by first asking participants to mention a noteworthy recent communication incident about which they had experienced either positive or negative feelings. We asked several follow-up questions to collect an in-depth and complete account of the event (e.g., What happened exactly? Who was involved? What were the consequences of the incident?). We then asked the participants to describe another incident. This procedure was repeated until the participants were no longer able to mention new critical incidents. Using the CIT thus revealed the schools’ communication problems and communicative strengths that the participants considered most salient.
In the third and final task, participants filled out the CSQ (Downs, 1994) that addresses relevant communication characteristics such as organizational integration and media quality. We added one question about the participants’ overall communication satisfaction, and for participants from Schools A and B, we added another ten questions about top management and interdepartmental communication (as suggested by Downs & Adrian, 2004). Participants could respond to the questions on a scale from 1 (very dissatisfied) to 7 (very satisfied). Downs (1994) summarized the research findings in support of the construct validity and concurrent validity of the CSQ. In an earlier study, we compared the results of the CSQ with those of the CIT, concluding that the two methods provided similar results although the diagnostic contribution of the CIT might be higher.
The sessions were all held in consulting rooms at the various school sites. We assured the participants that the sessions would be private and confidential. The second part of the session, involving the critical incidents, was audio recorded with the participants’ permission.
Data Analysis
We analyzed the network data using the software package UCINET (Borgatti, Everett, & Freeman, 2002) and visualized them by means of NETDRAW, the network visualization package that comes with UCINET. We constructed actor-by-actor matrices in UCINET for each type of network, with 1 representing a relationship between one employee (actor) and another and 0 representing the absence of such a relationship. Using the matrices, we could calculate several network measures, such as the participants’ in-degree (the number of times a participant was chosen as a contact) and out-degree (the number of contacts a participant indicated). We also calculated the density of the different networks based on participants’ out-degree. We then made the matrices symmetrical by recoding the nonreciprocated ties as reciprocated relationships and calculated participants’ betweenness centrality and their connectivity.
We used three levels of analysis. First, we analyzed the schools’ networks as a whole, focusing on the overall networks and not distinguishing between coordinative, strategic, and personal networks. To make sense of the network data, we compared the visualizations and relevant computations of the three schools and then confronted our findings with relevant results of the CSQ and the CIT.
Second, we analyzed the network positions of subgroups within the schools. We focused on differences between school sites and occupational groups (managers, teachers, and staff members). In this analysis, we used both the overall networks of the schools and the three specific networks (coordinative, strategic, and personal). Again, we confronted our network findings with the CSQ and critical incident results of the subgroups involved.
Third, we analyzed individuals’ positions within the networks. We focused on participants’ network roles—for instance, differentiating between isolates, stars, and gatekeepers—in comparison to their job type. We also compared the findings from specific networks with those from the CSQ and the CIT.
The CSQ and the CIT provided three types of information with which we compared the network data. The CSQ surveys ten dimensions of communication satisfaction; we used participants’ mean scores on these dimensions in our quantitative analyses. We used the critical incidents to complement the CSQ data. Because several topics that emerged from the CIT data were not covered by the ten CSQ factors, we used grounded theory principles (Strauss & Corbin, 1998) to develop four new categories: decision making, communication flow, responsibilities, and rules and agreements (Cohen’s κ > .75). We confronted these four additional categories with the network results by looking at the numbers of positive or negative incidents. Furthermore, we used our qualitative analysis of CIT data (the specific critical incidents that participants mentioned) to see whether these data explain or illustrate the network findings on the subgroup and individual level.
In our analysis of the network data for each school as a whole, we used the CSQ dimensions and the four additional CIT categories. Based on the network results, we selected dimensions that could theoretically be connected to these findings and quantitatively analyzed whether the network differences corresponded to CSQ or CIT results. On the subgroup level, we used the same quantitative approach but complemented it with the qualitative analysis of the critical incidents. On the individual level, we only used our qualitative analysis of the critical incidents.
Results
In the following discussion of our results, we compare our findings for the networks of each of the schools as a whole, the networks of subgroups, and the networks of individuals.
Comparison of the Networks for Each of the Three Schools as a Whole
Figure 1 shows the overall communication networks for the three schools. A single line within these networks (an arrow pointing in one direction) means that an employee indicated communicating with this particular colleague on a regular basis. When the line is reciprocal (an arrow pointing in both directions), both employees claimed that they had been in contact with each other. In this visualization of the three networks, two things stand out. First, employees at School C appear to have considerably more relationships than do the employees at Schools A and B. This finding is confirmed by the density of the three networks (calculated by dividing the number of relationships found by the total number of relationships possible). On average, the density of the School C network was 0.25 whereas Schools A and B had densities of 0.15 and 0.11, respectively. Second, the School C network appears to be considerably more centralized than that of the other two schools.
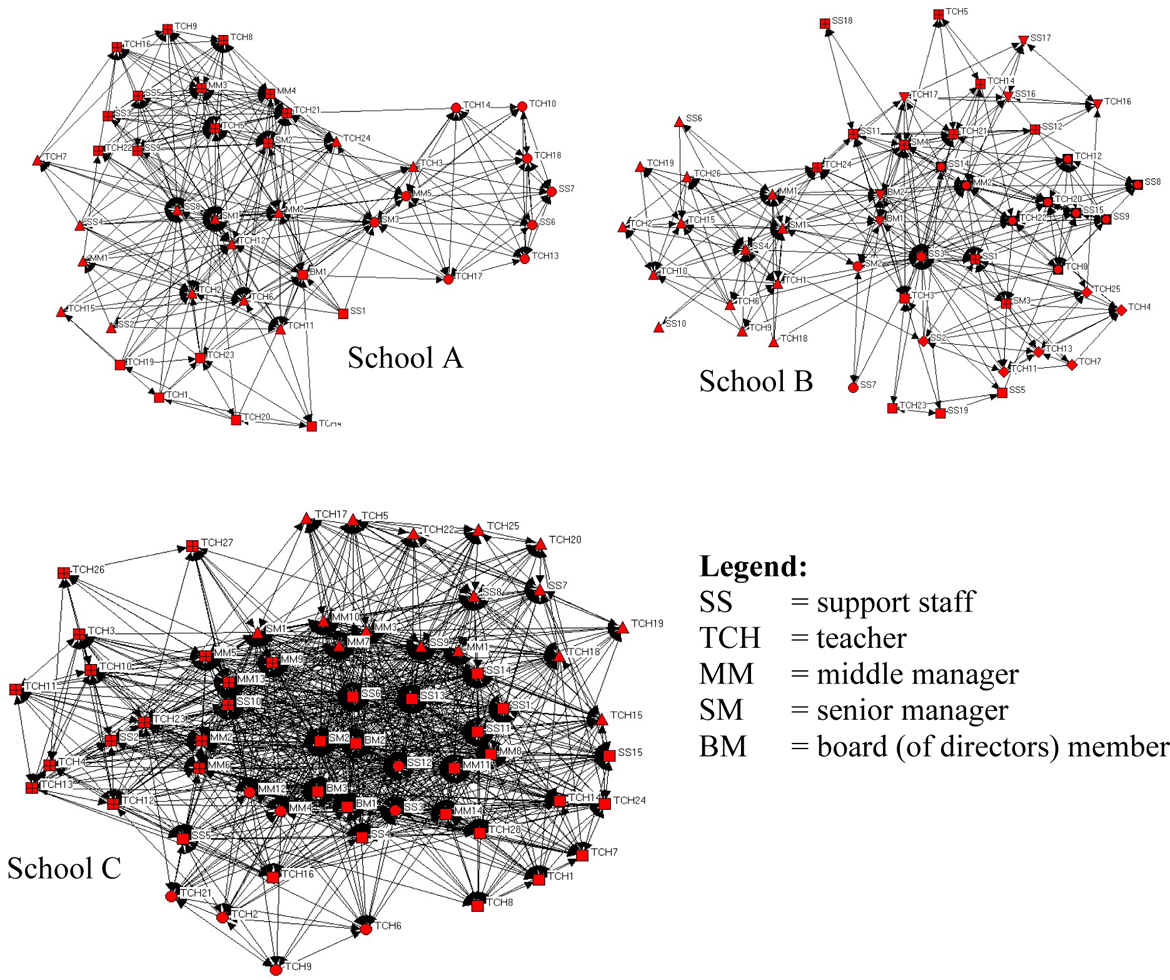
The overall communication networks for the three schools.
Based on these differences in density, we would expect the School C employees to have stronger feelings of informedness and organizational integration than would the employees of Schools A and B. In checking whether the results for the CSQ dimensions of organizational integration, organizational perspective, and horizontal communication confirmed such differences between the three schools, we found that employees of School C were significantly more satisfied with their horizontal communication than were employees of the other two schools, analysis of variance (ANOVA), F(2, 141) = 7.615, p < .001, Tukey’s b, p < .05. But we found no significant differences for the other two dimensions. Apparently, the relatively strong centralization and dense network relations in School C corresponded to employees’ satisfaction with their contacts with colleagues but were unrelated to their feelings of being informed about organizational issues.
We expected that the degree of centralization in School C would lead to more problems regarding decision making and communication flow. Although we did not find any differences in our CIT data regarding decision making, we found significantly more problems in School C regarding communication flow, F(2, 162) = 4.678, p < .05, Tukey’s b, p < .05. The strong centralization within School C seemed to cause communication to flow less effectively and efficiently. Participants especially complained about long communication lines and a lack of responsiveness to communication initiatives.
In sum, the network data and the CSQ and CIT data complemented each other in several ways. The CSQ and CIT findings corroborated some (not all) of the network findings. Indeed, differences in network characteristics corresponded to participants’ experienced communication quality. More important, the combination of methods proved to be additionally valuable. First, the network findings provided factual foundations that helped us explain a significant difference in the CSQ data regarding participants’ satisfaction with horizontal communication. That is, their satisfaction with the communication in their immediate work environment may be attributed to their intensive network relations. Second, the CIT data provided insight about an important practical consequence of the centralization of one of the networks. Without CIT data, it would be hard to determine whether the overall network characteristics were problematic or not. The CIT thus served as a diagnostic tool.
Our analyses also point out an important limitation of network analysis. Although network density seems to lead to participants’ satisfaction with their (horizontal) network contacts, it does not seem to affect participants’ informedness about organizational issues. Network relations must not be mistaken for effective information exchange.
Network Positions of Subgroups
For each school, we compared the network positions of subgroups of employees: those working in different sites and those with different jobs (managers, teachers, and staff members). First, we analyzed differences between sites. The networks of Schools A and B appeared to be very different in this respect from that of School C. The networks of School A and School B show that one of the school sites is clearly separated from the other sites. In both cases, the separated sites house many teachers and staff members who have few or no contacts with employees from other sites. Only the manager in each of the separated sites and one teacher maintain strong relationships with organizational members from other sites. From a management perspective, it seems undesirable for a school community to have a group of employees with so few relationships with colleagues at other sites.
We examined the critical incidents and communication satisfaction results to determine whether the isolated position of the sites was also reflected in employees’ perceptions. In the CSQ data, we expected that employees working at the isolated sites would have relatively low scores for organizational integration, organizational perspective, top management communication, and interdepartmental communication. But we did not find any significant differences for these four dimensions. In the CIT data, we expected more incidents concerning communication flow and decision making for these employees, and again we did not find significant differences. We also expected CIT participants to mention incidents about the lack of communication between sites, but we did not find any such incidents.
The result of our analysis between sites represents a unique contribution of network analysis to the communication audit results. Although from an organizational perspective, it is undesirable to have a more or less isolated school site, the employees at that site may still be satisfied with their communication experiences. In the CSQ and CIT, employees seem to have limited their evaluations of the communication system to their own site, either because they were inclined to focus on existing communication and ignore nonexisting communication or because they did not consider communication between sites to be important. It therefore seems useful to combine audit measures that are based on employee experiences with the organizational and instrumental perspectives on organizational communication that a network analysis provides.
Second, we analyzed differences between occupational groups. We compared the network position of managers, teachers, and support staff members. Within School C, the strategic network appeared to be even more centralized than its overall network. Every senior and middle manager and board member of the school was found in the center of the strategic network, and all support staff and teachers were positioned at the outer edges of the network. Thus, only a small number of employees (all of them in managerial positions) appeared to communicate about the school’s strategic issues on a regular basis. The desirability of such a network structure could be disputed because the teachers were all highly trained professionals who could make valuable contributions to the school’s further development. Furthermore, both teachers and support staff members were responsible for executing the strategic plans in daily practice, so their marginal position in the strategic network could affect both the quality and the degree of support for decisions. As the networks in Schools A and B show, teachers and support staff members are not always excluded from the center of the strategic network.
We expected this difference to be reflected in the CSQ results for organizational perspective because this dimension addresses participants’ satisfaction with the information about school strategy and policies. We conducted an ANOVA with occupational position and school as independent variables and organizational perspective as the dependent variable and found a significant difference between occupational groups, F(2, 143) = 4.737, p < .05, with managers being more satisfied with organizational perspective than are teachers and staff members (Tukey’s b, p < .05). But we did not find an interaction effect between the two independent variables: The effect of occupational position in School C did not differ from that in the other two schools.
In our quantitative analysis of the CIT data, we expected a difference in incidents regarding decision making between the managers and the other two occupational groups in School C. Although we did not find a significant difference regarding the number of negative incidents mentioned, managers appeared to mention significantly more positive incidents regarding decision making than did teachers and support staff members, F(2, 62) = 6.979, p < .005. In our qualitative analysis of the CIT data, however, we found many instances of problematic decision-making processes. Teachers as well as staff described incidents in which the board of directors or managers had simply imposed new policy without consulting interested parties and without gathering sufficient information about the practical implications. As a consequence, many strategic decisions were not tailored to real-life organizational settings, sometimes resulting in noncompliance or indifference toward management decisions in general.
Again, our network analysis revealed a communication problem that was not sufficiently addressed by the CSQ and the CIT. The CSQ was sensitive enough to differentiate between the three occupational groups, but it did not uncover consequences of the exceptional network structure of School C. The CIT only highlighted one small aspect (i.e., that managers were more positive about decision making than were teachers and support staff) of the much more fundamental problem within School C: the absence of teachers and staff members in the strategic network. Even our qualitative analysis of critical incidents would not lead auditors to the far-reaching conclusion that could be drawn from the network results.
Network Positions of Individuals
The network data enabled us to focus on specific network roles of individual employees. Specifically, we found a number of employees with few network relations (isolates), employees with a central role in the network (stars), and employees with a crucial position in the system of information dissemination in the schools (gatekeepers).
Isolates were particularly found in the schools’ strategic networks. Some of these marginal positions can be easily explained by the auxiliary or temporary appointments of the employees. One of the isolated employees, however, was a full-time teacher, which makes his marginal participation in the strategic network remarkable. His isolated position corresponded with his extremely negative CIT interview. He mentioned eight critical incidents, all of them negative. He had experienced no support from his colleagues and his supervisor during his first year at the school: He stated that he was never really introduced to his colleagues and was not properly informed about his exact duties and responsibilities. During his second year, he received a negative job evaluation—not in person but by means of a letter in his mailbox—that did not address the reasons for the assessment. Later, he received another letter in his mailbox, stating that he would not be allowed to teach advanced classes anymore.
In this way, both the network analysis and the CIT drew attention to an isolated and disenchanted individual among the employees of the school. But the CIT provided much stronger and richer evidence of this employee’s problematic position within the school. Network analysis may be used to identify employees who require special attention, but qualitative data are indispensable to diagnose the nature of the communication problem.
Another remarkable isolate position was that of the headmaster at School C. Although the headmaster had a rather central position in the strategic network of his school, he had only a marginal position in the personal network (see Table 2). Apparently he had many relationships within the school, but most of these were limited to strategic issues. He took little time to discuss personal matters with other employees.
Normalized Betweenness Centrality Index for the Headmaster of School C.
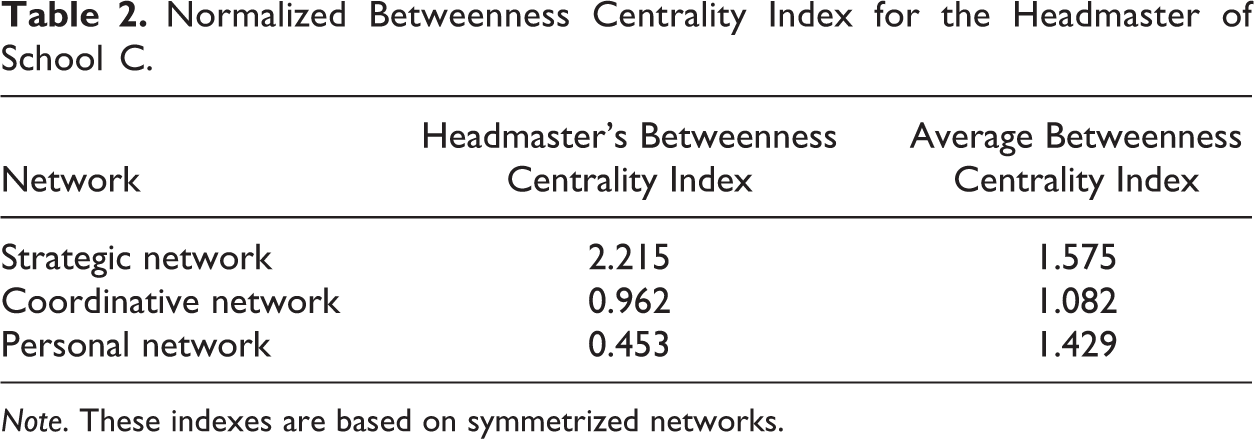
Note. These indexes are based on symmetrized networks.
This observation based on network analysis corresponded with the CIT results. Many employees experienced a lack of involvement, especially concerning more personal issues, with members of the board of directors, particularly with the headmaster. Employees described several incidents in which the headmaster was on-site for a meeting but did not even greet any of the people as he passed them in the hall. Other incidents involved his impersonal handling of issues that were personally important to employees and his lack of personal attention to teachers and managers. For example, one participant recalled this incident: A while ago I celebrated that I’ve been at this school for 25 years. I wanted to really celebrate it, because I thought it was such an important milestone. So I bought this big cake, and we all enjoyed it during our coffee break. When I saw our headmaster in the hall that morning, he did not even greet me, and a little while later he came to our cafeteria to celebrate with us (I guess), yet he did not even shake my hand to congratulate me! Sure, there was a card in my mailbox from the board of directors, and his name was under it too, but why doesn’t he come to me and congratulate me? Is that too much trouble?
We found a star position in School B’s network. One of the support staff members appeared to be situated closely to the board of directors in the coordinative network. Our calculation of betweenness centrality confirmed that this staff member was by far the most central person in the coordinative network (having an index score of 26.620 when the average index score was only 2.536). This particular staff member was responsible for the school’s financial administration and worked as the first assistant to the board of directors. At the time of the study, the school was dealing with serious financial problems, and this employee was frequently asked to gather information from all school sites regarding, for example, the number of employees and students on each site or salary costs. In this role, the employee often communicated with employees of other school sites about high-priority topics. The centrality of this employee was probably only temporary, lasting only as long as the school suffered from financial problems. As a result, this finding did not call for structural adjustments of the communication system but did raise questions about the current situation. The board of directors depended heavily on this individual, who, at the same time, indicated experiencing a high workload. If the employee was to be absent for a longer period of time, the organization would have an urgent communication problem.
In the CIT interviews, none of the participants drew attention to this staff member’s special position in the network. At best, they mentioned their own intensive contacts with the administration, but they never highlighted the crucial role of this particular employee. This result suggests a potential strength of network analysis: Unlike analyses that depend on the self-reports of individuals, who tend to limit their evaluation to their own experiences, network analysis focuses on the quality of the communication system as a whole.
We found gatekeepers in Schools A and B (the two schools that each have one site that is separated in location from the other sites; see Figure 1). Only the manager and one teacher (TCH 3 in School A and TCH 24 in School B) at each of the separated sites maintained strong relationships with organizational members from other locations. Given their position in the network, these managers and teachers appear to be very influential in their schools’ communication system. They can control the information that reaches subordinates and colleagues at their site and influence the interpretation of this information. From an organizational perspective, the schools’ top-down and bottom-up communication with their isolated sites appears vulnerable and dependent on relatively few individuals.
But this vulnerability was not reflected in the CIT results of either school. Employees cannot tell whether they are well-enough informed about school issues beyond their own site and do not foresee the problems that could occur because of weaknesses in the existing communication structure.
The managers’ gatekeeping role may also raise issues of loyalty for the board of directors, subordinate employees, and the managers themselves. At School B, the CIT data complemented the network data by shedding light on this matter. Both managers at the isolated sites were positive about the communication with their own employees yet critical toward the board of directors. They seemed to be negative about the directors’ lack of vision regarding the school’s future and disagreed with their strategic plans and their handling of school finances. This attitude may reinforce the isolated position of their site. Thus, the combination of the CIT and network analysis proved informative in this respect.
Discussion
In this study, we have evaluated network analysis as a communication audit instrument by visualizing the various communication networks of three organizations and calculating several network measures. To establish the technique’s value for uncovering communicative strengths and weaknesses in organizations, we analyzed (a) the characteristics of the school networks as a whole, (b) the network positions of separate sites and occupational groups, and (c) the network positions of individual employees. In addition to the overall communication networks of the organizations, we distinguished strategic, coordinative, and personal networks. Then we compared the results of our network analysis with our findings from two other audit instruments: the CSQ and the CIT.
Our study shows that network analysis can make an important contribution to the evaluation of an organization’s communication system in two ways. First, our network data complemented our findings from the other audit instruments. The network results uncovered communication problems that employees did not address in their self-reported evaluations of the communication system. The employees seemed to have difficulty in predicting whether certain communication lines that are currently absent would be valuable to their communication system. Furthermore, individual employees might not judge the communication system from a management perspective. Our data showed that a collective of employees seemed perfectly satisfied with their isolated school site and did not mention this isolated position as a communication problem. More than any other audit technique, network analysis is capable of uncovering these types of problems. In the same vein, self-reporting employees may not be able to foresee the communication problems that can occur when individuals have certain crucial network positions (e.g., a star or gatekeeper position) or to evaluate the strengths and weaknesses of the communication system (e.g., the network’s level of centralization) beyond their individual perceptions. The quality of an organization’s communication system is more than the sum of its employees’ individual judgments about the organizational communication. By uncovering various communication characteristics of the three schools, the network analysis appeared to be an important addition to the self-report data collected from the CIT and the CSQ.
Second, the network analysis underlined some of the results from the CIT or the CSQ. In some cases, the network data appeared to converge with the CSQ and CIT results. The compatible findings of the three methods constitute a form of triangulation: The fact that more or less the same findings originate from three distinct types of data collection strongly supports the validity of these findings. The complementarity of the network, CIT, and CSQ results works in two ways. On one hand, in several instances, the CSQ and particularly the CIT results were necessary to make sense of the network characteristics. For instance, only the CIT results indicated that the headmaster’s marginal position in the personal network of School C was problematic or that the degree of density and centralization of School C’s overall communication network should be diagnosed as a problem. On the other hand, the network analysis provided factual foundations for the subjective perceptions of individual employees and helped us draw more fundamental conclusions about the strategic network in School C: Practical problems with decision-making processes appeared to correspond with an absence of teachers and support staff in the strategic network. Thus, network analysis was essential for such a far-reaching conclusion about the school’s communication system.
Apart from these conclusions about the contribution of network analysis in general, our study also draws attention to the importance of studying different types of communication networks in organizations. By visualizing several networks, we were able to study the extent to which individuals communicate differently in different networks, thus adding to our understanding of individual communicative behavior. Likewise, our study underlines the usefulness of comparing networks of different organizations to each other. We were able to identify the separated sites at the first two schools and the centralization of the third school because we compared the three networks. Benchmark data allowed us to uncover the unique characteristics of each network. In this way, collecting network data from more than one organization seems to add value to network analysis.
Our study is a first attempt to empirically investigate the contribution of network analysis as a part of a communication audit. An important limitation of this study is the relatively small number of cases that we examined. In a network analysis, the unit of analysis ranges from individual participants to the organization as a whole. Although only three organizations were involved in our research, the network analysis proved useful in all three organizations. Another limitation of this study is that it included only a specific type of organization. Only large secondary schools with multiple sites participated. Similar research in different organizations might lead to different findings.
More research is needed on the use of network analysis as a communication audit instrument. In particular, it would be useful to further study the relationship between network characteristics (at the organizational, subgroup, and individual level) and the problems experienced in the communication system of organizations. A possible approach would be to conduct a network analysis and then follow-up interviews to explore the implications of the network characteristics. In addition, comparative research into the use and results of various data collection techniques for network analysis is needed (e.g., comparing different kinds of sociometric questions or comparing sociometric questions to communication diaries).
Conclusion
Our study confirms the value of network analysis in communication audits. But an important contribution of network analysis that we ignored here is that it describes the real and informal communication system and compares it to the formal communication system of an organization. This background information is relevant for virtually any communication audit (Johanson, 2000; Rank, 2008). In this article, we mainly focused on the potential of network analysis to evaluate an organization’s communication system. We found that network analysis made a distinctive contribution toward diagnosing communication strengths and weaknesses in the three schools and appeared to complement data derived from employees’ self-reports. Based on our findings, we would argue that network analysis deserves a more central position on the palette of communication audit techniques.
Footnotes
Declaration of Conflicting Interests
The authors declared no potential conflicts of interest with respect to the research, authorship, and/or publication of this article.
Funding
The authors disclosed receipt of the following financial support for the research, authorship, and/or publication of this article: The authors received a partial compensation from the participating schools for the communication audit and a summary of the findings.