
Abstract
Check, Connect, and Expect (CCE) is a secondary tier behavioral intervention that provides students with levels of support including a dedicated “coach” for check-in and check-out procedures, and social skills instruction. Elementary students (n = 22) in an alternative education school setting received CCE for 13 weeks following 4 weeks of baseline data collection. Measures included (a) daily progress reports (DPR), (b) direct observation of academic engagement, and (c) curriculum-based measures of academic growth (math calculation and oral reading fluency). These measures were used to examine the relationship between CCE and student outcomes using an interrupted time series design and multilevel growth curve modeling. This quasi-experimental within-subjects design compared the slopes and intercepts of baseline student data with intervention student data. Results demonstrate that students displayed statistically significant improvement on DPRs at the onset of CCE and demonstrated positive behavioral growth during CCE. There was also a statistically significant improvement of academic engagement at the onset of CCE. There was no statistically significant change in academic performance. A description of potential moderating variables, future research directions, and practical significance is presented.
Keywords
Students with emotional and behavioral disorders (E/BD) experience school failure in academic, behavioral, and social domains, which often worsens over time (Hayling, Cook, Gresham, State, & Kern, 2008). Negative pre- and post-school outcomes that are common for students with E/BD include weak social relationships, poor academic achievement, movement to more restrictive settings, school dropout, involvement with the juvenile justice system, and lack of gainful employment. Students with E/BD display considerable and persistent fundamental academic deficits (Lane, Barton-Arwood, Nelson, & Wehby, 2008; Nelson, Benner, Lane, & Smith, 2004; Rutherford, Quinn, & Mathur, 2004). Students with E/BD achieve academically 1 or more years below same-age students without disabilities, similar to students with learning disabilities (Kauffman, 2003; Levy & Chard, 2001). Disruptive behavior and distractions contribute to decreased teacher-led academic instruction (Steinberg & Knitzer, 1992). Rather than highly structured, instructive, and positive educational experiences required by students with E/BD, typical instruction is composed primarily of (a) high rates of reprimands, (b) excessive independent seatwork, (c) minimal dedicated, teacher-led instructional time, (d) minimal positive instructional interactions, (e) minimal opportunities to respond, and (f) minimal praise (Lane et al., 2008). In the behavioral and social domains, students with E/BD demonstrate poorer social skills (Gresham, Lane, MacMillan, & Bocian, 1999), a lack of bonding to school, and disruptive behaviors requiring unique supports beyond the scope of general education supports (Landrum, Tankersley, & Kauffman, 2003).
This may lead to increasing the likelihood of being placed in more restrictive environments such as alternative education settings (Quinn, Poirier, Faller, Gable, & Tonelson, 2006). Alternative education settings are charged with providing supports and interventions that are aligned with the aforementioned components in small group classes with low teacher to student ratios, increasing opportunities for individualized, intensive intervention (Lane, Wehby, Little, & Cooley, 2005).
Specific interventions within Positive Behavioral Interventions and Supports (PBIS) aimed at improving social behaviors in alternative education settings for students with E/BD should balance academic and social skills instruction with behavior management (Gagnon & Leone, 2006). Specifically, Tobin and Sprague (1999) described effective supports and interventions for students with E/BD educated in alternative education schools including (a) small class sizes; (b) structured, routine behavior management support; (c) positive philosophies; (d) positive school-based mentors; (e) function-based interventions; (f) social skills instruction; (g) effective academic instruction; and (h) collaboration with parents. There is a substantial need for research in effective interventions for students with E/BD in alternative education settings.
One evidence-based intervention researched primarily when implemented in traditional education settings, which may be effective in alternative education settings for students with E/BD, is Check, Connect, and Expect (CCE; McDaniel, Flower, & Cheney, 2011). CCE is a secondary tier intervention within the traditional PBIS framework (Cheney, Flower, & Templeton, 2008; Cheney et al., 2009). CCE is grounded in more than 15 years of research beginning with the Behavior Education Program (BEP) and Check-in/Check-out (CICO; Filter et al., 2007; Hawken, 2006). CCE focuses on building meaningful relationships with a full-time behavior coach as a means to address behavioral deficits.
There are six primary CCE components including (a) goal setting, (b) progress monitoring and data-based decision making, (c) relationship building, (d) social skills and problem-solving instruction, (e) home–school collaboration, and (f) tiered support. CCE involves levels of support (Cheney et al., 2008). Students are assigned to a level based on daily progress-monitoring data. Overall, results from CCE studies (Cheney et al., 2008; Cheney et al., 2009) have yielded (a) decreased problematic behavior from participating students measured by number of office discipline referrals (ODRs), (b) decreased referrals of students at risk of E/BD to special education, (c) decreased disruptive behavior measured by direct observation, and (d) increased social skills ratings by classroom teachers. With these positive behavioral outcomes measured, it can be expected that over time, students participating in CCE with improved behavior should also demonstrate improved academic outcomes. This expectation is founded in the correlation between decreased time in exclusionary discipline practices such as ODRs and suspensions and increased instructional time and academic engaged time. A paucity of research measuring correlating academic outcomes with improved behavior exists.
The purpose of this study was to implement CCE within a self-contained alternative education setting for elementary students with E/BD and respond to calls for research in alternative education settings to include PBIS and effective strategies. This study addressed the following research questions:
Method
Setting
Due to the paucity of research in alternative education settings for students with E/BD, this study took place in a self-contained alternative education setting for elementary students with primary eligibilities of E/BD who displayed serious behavior problems in the traditional school setting. Alternative education settings such as this school are complex environments that serve students who are not successful in traditional school settings, thus requiring more adult attention with increased monitoring and intensive behavioral and academic supports. The target school for this study was chosen because of the population of students with severe E/BD in kindergarten through fifth grade. In addition, this school’s remediation model required students to remain at the self-contained school until behavioral goals were met and a measured transition process through a self-contained classroom in a traditional school was in place, assuring that participants would remain in the alternative program throughout the study. The school was located in a suburban area in a Southeastern state that served approximately 45 students in kindergarten through fifth grades per year. Placement changes to the more restrictive setting were determined during an Individualized Education Plan (IEP) meeting. The self-contained school was determined to be the least restrictive environment for students by the IEP team due to persistent histories of physical aggression and/or elopement. Students were placed in the target self-contained school due to displaying behavior considered a danger to the students themselves or to other students and adults at their traditional school setting. Students were identified at such young ages due to their extremely disruptive, pervasive, and high-risk behaviors, beginning in the early grades.
The targeted alternative education setting was in the beginning phases of implementing Tier 1 PBIS and a school-wide comprehensive behavior management system, which was comprised of a token economy and level system. The broad school-wide behavioral expectations were to (a) stay quiet, (b) treat others nice, (c) accept directions, (d) respond appropriately, and (e) stay safe. A universal, school-wide student recognition system was in place to provide positive reinforcement for expected behaviors outside of the classroom. Students continued to receive points through their token economy in their therapeutic classrooms. These two systems were integrated and did not compete with one another as school-wide supports.
The typical school day at the target school consisted of skill-level reading and math instruction, ongoing behavior support, physical education, computer skill training, and either science or social studies. Academic instruction in reading and math consisted of targeted small group instruction with a focus on remediation rather than standards-based delivery. Due to the intensive behavioral needs, teachers focused heavily on academic-related behavioral skills during math and reading such as staying on task, completing assignments, and asking for help. Because of the nature of academic instruction, a majority of instructional time was spent modeling and rehearsing behavioral skills and practicing foundational reading and math skills such as reading fluency and math calculation.
Student Participants
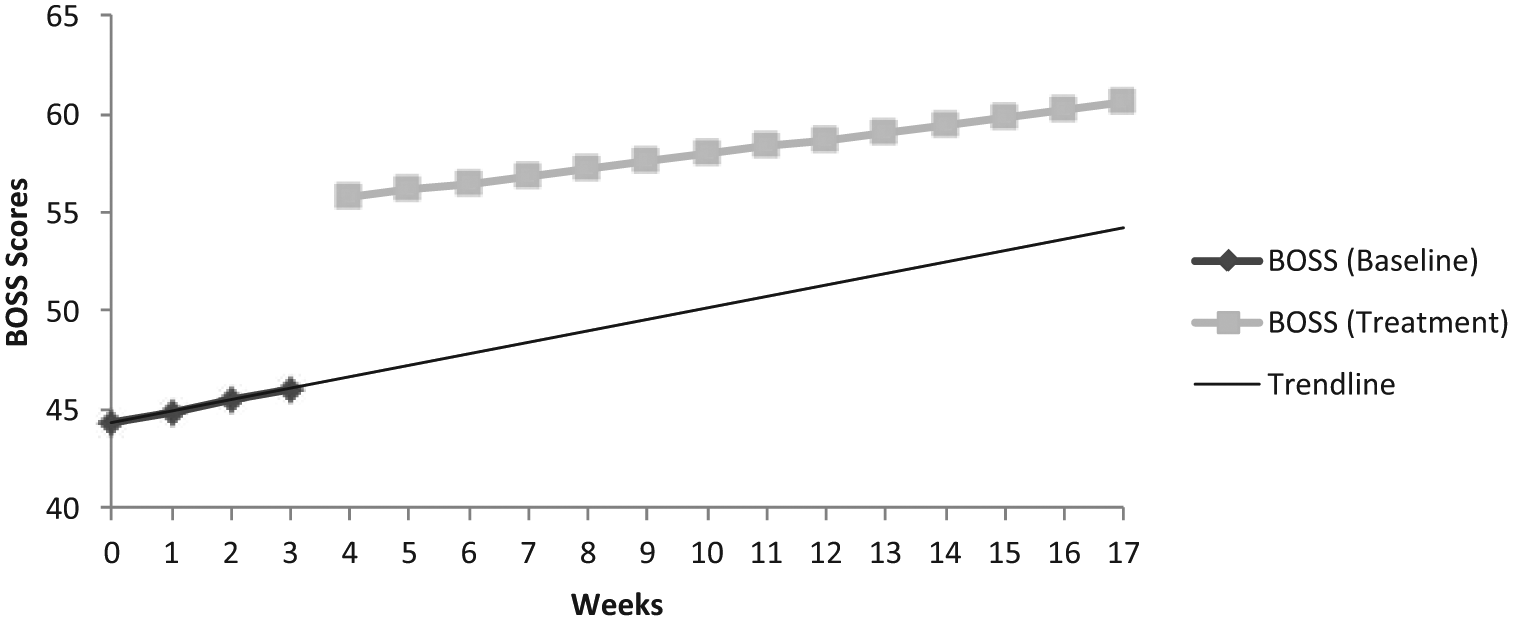
All 22 eligible students with primary E/BD special education eligibilities provided parental consent and student assent and participated in the study without any attrition. The first inclusionary criterion of having at least one baseline data point was required due to the necessity of baseline data for the analysis. After inspecting the baseline data, all 22 participants had at least two data points in baseline. The secondary inclusionary criterion of being in Grades 2 to 4 was required due to the developmental levels and academic skills being related in Grades 2 to 4 with participants ranging in age from 7 to 10. Student participants ranged in age from 7 to 10 (M = 8 years 7 months, SD = 11.5 months) and were in second through fourth grades. Due to the overrepresentation of African American males identified with E/BD and served in alternative education settings such as the target school, the participants in this study were majority male and African American (see Table 1 for student participant information).
Student Demographics.
Note. EBD = emotional and behavioral disorder; OHI = other health impaired; LD = learning disability.
School Staff Participants
CCE is an intensive behavioral intervention, which requires a full-time behavioral “coach” who implements all of the CCE components. With sufficient training and support, the coach can be hired at the paraprofessional level and does not require teaching certification or expertise in behavior training. The coach was a graduate student at a local university and was hired based on references from faculty members and instructors regarding professional strengths. The coach was a teacher-in-training and therefore was not a certified teacher and did not have extensive experience with students with behavior disorders. The coach was employed full-time for the 13 weeks of intervention. In addition to the coach, a post-graduate education student served as a research assistant.
Assessments
Behavior
Several instruments were used to measure student behavior. Daily Progress Reports (DPR; Stage, Cheney, & Lynass, 2012) were used as a measurement of student classroom behavior. The use of DPR provided a measure of teacher perceptions of student behaviors over time. Due to the severity of behaviors in the self-contained school, a modified DPR from the CCE intervention (Cheney & Lynass, 2009; Stage et al., 2012) was used. Participating teachers requested a simple DPR that capitalized on the existing school-wide behavior management system in place (i.e., token economy). Thus, a DPR with one expectation, “following directions,” was used to evaluate behavior in terms of the number of reminders or corrections required per class period. Students earned an “excellent” 5-point rating for 0 reminders or corrections, a “way to go” 4-point rating for needing only 1 reminder or correction, a “good” 3-point rating for requiring 2 to 3 reminders or corrections, an “ok” 2-point rating for needing 4 to 5 reminders or corrections, and a “tough time” 1-point rating for needing more than 5 reminders or corrections in 1 period. In addition, if students were removed from the classroom for an office referral or processing an office referral, they earned no points for that period. Students were rated a total of 6 times per day on the 5-point scale for a total of 30 possible points earned per day.
Partial interval recording of academic engagement was used as a secondary measure of student behavior to either confirm or contradict teacher ratings of student behavior through DPRs and to inform whether correlating academic improvement due to increased instructional time and time on-task would be expected. Fifteen-minute observations were conducted weekly for each participant on a quasi-random schedule by day and academic period to insure that all participants were observed on different days and academic periods to mitigate teacher quality, time of day, and day of week. The direct observation procedures, modified from the Behavior Observation of Students in Schools (BOSS; Shapiro, 2004), were similar to those used by Briesch, Chafouleas, and Riley-Tillman (2010) in their experimental examination of measures of student engagement. Observations were conducted only during times in which students were expected to be engaged in an academic task, which also required the quasi-random schedule of observations. If a different type of activity was taking place at the scheduled observation time, the observation was rescheduled at a different time or on a different day. During the 15-min observations, 15-s intervals to record on- and off-task behavior were used. On-task behavior was defined as the student demonstrating one or more of the following: (a) taking notes, (b) answering or asking questions, (c) contributing to group discussion, (d) working actively on assigned seatwork, (e) helping another student, or (g) looking at and facing the teacher (passive listening). Off-task behavior included (a) verbal disruptions, (b) out of seat or assigned area, (c) head down, (d) not facing the teacher, or (e) receiving teacher feedback for negative behavior. The total number of on-task, engaged behaviors (with a total possible of 60) during the 15-min observation was recorded as the weekly direct observation data point. Due to the measurement of academic engaged time, direct observation data were triangulated with academic measures to determine oral reading and math fluency outcomes, directly related to academic engaged time.
Academic achievement
Oral reading fluency (ORF) and math calculation fluency (MCF) curriculum-based measures (CBM; Shinn, Deno, & Epsin, 2000) measured academic achievement growth over time in the foundational areas of math and reading. CBMs are reliable and valid progress-monitoring tools that evaluate individual performance on academic tasks (Shinn et al., 2000). CBMs are highly sensitive to individual academic growth over short periods of time and are used to inform responsiveness to academic intervention through frequent, repeated measurements. To collect CBM data that were comparable across students for the multilevel growth model, and at or near participants’ instructional level, teacher and administrator input in the form of current grade-equivalent levels of achievement in reading and math was used to determine the appropriate grade-level AIMSweb (www.aimsweb.com) probes to be completed by all participants. This level was determined to be the second-grade level for both ORF and MCF. Teachers suggested that second-grade level probes would be appropriate because probes were neither at any student’s independent level nor at their frustration level, particularly for the low-achieving students. These CBM procedures were used in accordance to other research conducted in an alternative education setting with varying ages and levels of achievement (Shippen, Morton, Flynt, Houchins, & Smitherman, 2012) and the AIMSweb administration guidelines for progress-monitoring procedures for students with special needs, which suggests the acceptable use of varying accommodations for students with special needs if the accommodations are applied consistently throughout the progress-monitoring process.
Weekly ORF assessments were given individually with each student. Students received a fluency reading passage weekly to read aloud with approximately 236 words per passage. Students were asked to read aloud for 1 min. After assessing errors (e.g., omissions, insertions, misread words, and words that the students could not sound out within 3 s) and total number of words read, the number of words read correctly were calculated by taking the number of words read and subtracting the number of errors.
MCF assessments (AIMSweb) were delivered to students individually with a possible of approximately 41 digits correct. Students were provided with a 1-page probe and were asked to answer as many calculation problems as possible in 1 min. The total number of digits correct was calculated and recorded as the weekly MCF data point for each student.
Moderating variables
The Systematic Screener for Behavior Disorders (SSBD; Walker & Severson, 1992) was used to identify severity of behavior prior to intervention to determine whether severity of behavior predicted response to CCE. Extensive research suggests the SSBD is both reliable and valid (Walker & Severson, 1992). The SSBD is designed to identify students at high- and low risk levels for developing E/BD using teacher ratings in a three-gate system. In the traditional three-gate model, the first gate consists of teachers nominating and rank ordering students with externalizing and internalizing behaviors. The second gate requires teachers to rate students on Critical Events, Adaptive, and Maladaptive characteristics, and the third gate consists of direct observation of problem behavior. The purpose for this three-gate process is to improve efficiency so that only students who meet criteria for externalizing and internalizing behaviors are rated on the measure, and only those at the third gate receive direct observation assessments. The SSBD assesses both externalizing and internalizing behaviors and categorizes at-risk status as high or low. Given the participants’ E/BD eligibilities and placement in a self-contained school, the first gate was not completed and the second gate provided the descriptive information regarding intensity of problem behavior needed to identify each participant accordingly.
The second gate includes the Critical Events Index and the Combined Frequency Index. These tools assess varied intensities and frequencies of targeted behaviors in adaptive and maladaptive areas. The Critical Events Index has 33 items. The teacher rates student behavior on a 3-point Likert-type scale according to presence and severity of the behavior corresponding to each item (e.g. “has tantrums”). The Combined Frequency Index requires 11 teacher ratings on a 5-point Likert-type scale (e.g., “child tests or challenges teacher-imposed limits, e.g., classroom rules).
Each student’s classroom teacher completed the second gate of the SSBD during the baseline phase of the study. Teachers rated intensity and frequency of problematic behaviors in adaptive and maladaptive areas, based on informal classroom observation that occurred during the first 4 weeks of the school year. Results were compiled and categorized into two categories of severity of behavior (high and low), which was used as a dichotomous predictor variable in analysis.
The Functional Assessment Checklist for Teachers and Staff (FACTS; March & Horner, 2002) is a brief assessment of maintaining function of behavior. The FACTS were completed in accordance to the methods and procedures outlined in validation studies (March et al., 2000) including the teacher interview and direct observation, and hypothesis statements were completed during the third and fourth weeks of the baseline phase of the study. The function of behavior identified was then recorded accordingly as escaped-based or attention-based.
Scores on the Student–Coach Relationship Scale (SCRC; Cheney et al., 2009) and the Coach–Student Relationship Scale (CSRC; Cheney et al., 2009) adapted from the original tool (Pianta & Steinberg, 1992) were used to measure perceived relationship strength between the coach and each student and students and the coach. The SCRC is a 15-question, 5-point Likert-type scale tool. The CSRC is a 6-item questionnaire with a 4-point Likert-type scale. The coach completed the CSRC for each participating student during the last week of the intervention phase. Similarly, the research assistant read aloud the statements and responses on the SCRC to participating students during the last week of the intervention phase. Coach and student responses were categorized as reflecting either high or low relationship strength based on the Likert-type scale ratings.
Social validity
Teachers and paraprofessionals of student participants completed the Teacher Evaluation Inventory (Cheney et al., 2009) during the last week of the intervention. This tool is composed of 10 statements and comments that were rated on a 5-point Likert-type scale. High scores were between 40 and 50, and low scores were between 10 and 49.
Intervention
Numerous components comprise the CCE intervention. These components include (a) goal setting; (b) progress monitoring with corresponding data-based decision making; (c) relationship building; (d) social skills and problem-solving instruction; (e) home–school collaboration; and (f) tiered support. CCE involves three levels of support: Basic, Basic Plus, and Self-Monitoring (Cheney & Lynass, 2009). Students are assigned to a level based on daily progress-monitoring data. The Basic level provides the most intensive supports including CICO procedures, weekly social skills and problem-solving-skills lessons, and home–school collaboration. The Basic Plus level incorporates faded CICO procedures and home–school collaboration. The Self-Monitoring level requires students to monitor their own behavior on a faded schedule.
Procedures
General procedures
University and school district level institutional review board approval was obtained prior to involving participants in research. Teacher and paraprofessional consent was obtained 2 weeks prior to baseline data collection.
Training
Coach training procedures were based on the CCE implementation guide (Cheney & Lynass, 2009). The coach was trained in two 5-hr sessions. During this time, background information of the PBIS framework, the existing PBIS framework at the research site, followed by in-depth information about CCE was described. The coach was provided with purpose of and primary components of CCE with an overview of daily coach duties, detailed steps to completing all of the duties providing examples and non-examples, and CICO procedures emphasizing adherence and quality of student–coach interactions and procedural details. Then, the coach was instructed on how to teach the social skills lessons and described how to form and schedule targeted student groups for social skills instruction. Then, detailed instructions on home–school collaboration through DPRs and the classroom teacher were provided. Coach skills on CICO, social skills instruction development and lesson delivery, and collecting and scoring measures were assessed using developed fidelity measures. The coach reached 95% mastery or above on all tasks prior to training completion.
Teacher and paraprofessional training based on the CCE implementation guide (Cheney & Lynass, 2009) was conducted during this time. This training instructed teachers and paraprofessionals how to deliver positive feedback, record number of corrections and reminders on the DPR card, and complete the SSBD teacher ratings. Teacher and paraprofessional training was presented in a 2-hr training session after school hours. Teachers and paraprofessionals discussed and practiced transferring student data to the DPR until 95% mastery or above on practice DPR ratings was reached.
The research assistant was trained to collect BOSS, ORF, MCF, treatment fidelity, interrater reliability (IRR), and interobserver agreement (IOA) data. The academic engagement, MCF, and ORF assessment materials, and all fidelity measures were used to train for adherence quality in the 2-hr training session. Practice scenarios were provided to rehearse data collection and insure mastery at a minimum of 95% on all measures.
Baseline phase
The purpose of the baseline phase was to gather data regarding students’ behavioral and academic growth trends without CCE. During the 4-week baseline phase, DPR ratings were recorded by the teaching staff throughout the day at the end of each of the six class periods without giving feedback to students regarding the number of corrections or reminders for behavior problems. During the fourth week of the baseline phase, teachers completed the second-gate behavior ratings for all participating students on the SSBD.
Intervention phase
All six CCE components were put in place during the intervention phase. The coach began implementing the CCE program the fifth week of the study and continued for a total of 13 weeks. All participants entered CCE at the Basic Plus level.
Students who met the 75% DPR criteria of 22 out of 30 possible points per day for 6 weeks moved to the less intensive, Basic level. The Basic level includes daily CICO procedures and home–school collaboration but does not include targeted social skills instruction.
Treatment fidelity
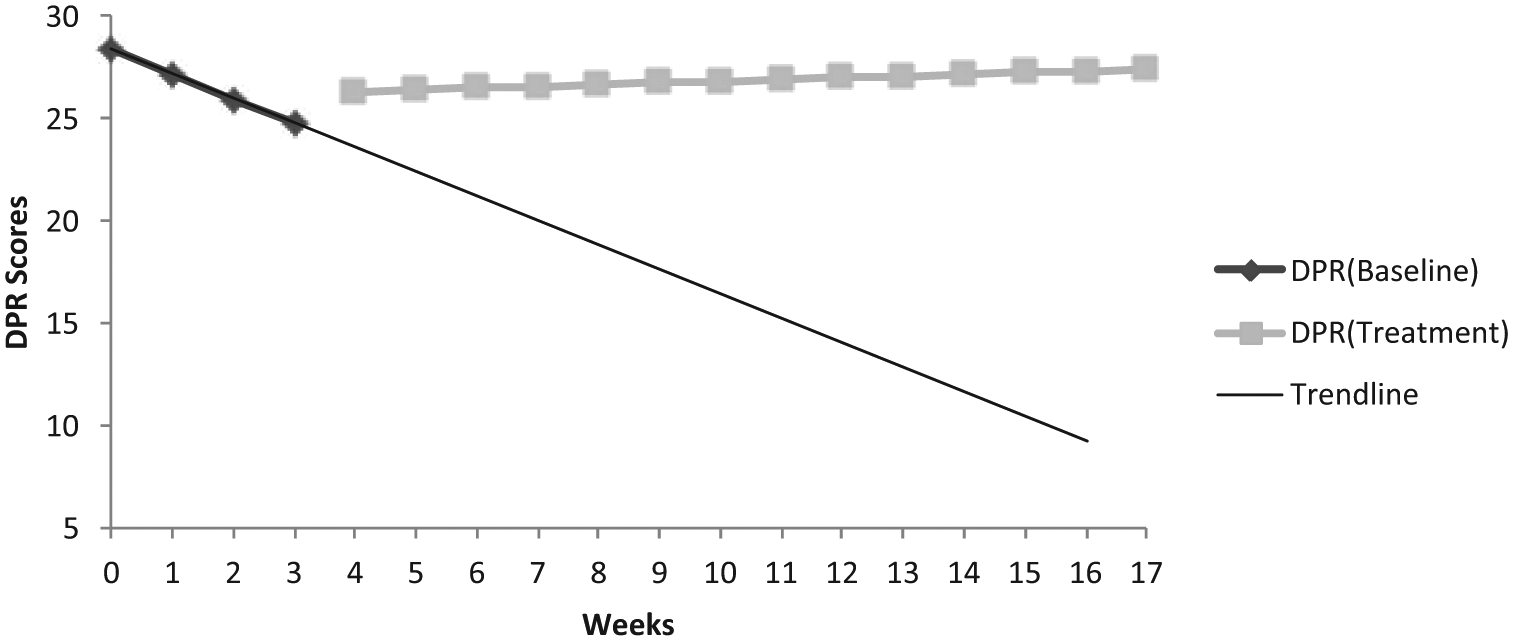
Fidelity for this study was aligned with fidelity procedures in existing CCE research. First, the Teacher Adherence and Quality Form (TAQF; Cheney et al., 2009) assessed the degree of fidelity to which the teachers and paraprofessionals provided students with feedback regarding their behavior each time period (eight per day) and their adherence to the rating procedures and quality of feedback according to completed training. Procedural fidelity was rated on a provided 5-point Likert-type scale reflecting the extent to which the teacher or paraprofessional adhered to the protocol provided during training. Fidelity data were recorded with each participating teacher and paraprofessional during one rating instance per week across the day. Overall collected teacher adherence and quality data over a total possible score were converted into a percentage. Fidelity was assessed on 25% of the teacher/paraprofessional student ratings during or at the end of the class period. Fidelity for teacher adherence was 92%.
Check-in procedural fidelity was assessed through observing the coach on 23% of all check-in activities. This assessment occurred weekly during the morning check-in activities. The Check-in Adherence and Quality Form (CIAQF; Cheney & Lynass, 2009) assessed both adherence to trained check-in procedures and quality of delivery of support. The extent to which the coach performed the tasks was indicated based on a 4-point Likert-type scale. Overall collected check-in adherence and quality data over a total possible score were converted into a percentage of 92%. Check-out procedure fidelity was assessed with the Check-out Adherence and Quality Form (COAQF; Cheney & Lynass, 2009). The procedures for this assessment were the same as the check-in fidelity measure with the same expected percentages of adherence and quality. Check-out adherence and quality were measured 22% of the total check-out activities, and fidelity was found to be 96%.
Social skills instruction fidelity was also assessed with the Social Skills Instruction Training Checklist provided by the CCE Program Manual (Cheney & Lynass, 2009). Social skills fidelity took place during small group social skills and problem-solving instruction on a total of 21% of all social skills lessons and resulted in 98% fidelity with the checklist (see Table 2 for fidelity result summaries).
Percentages of Fidelity, IRR, IOA, and Completion Rates.
Note. IRR = interrater reliability; IOA = interobserver agreement; DPR = daily progress report; ORF = oral reading fluency; MCF = math calculation fluency.
IRR
IRR was measured to determine the extent to which accurate fidelity data were collected on all four fidelity measures. A total of 20% of all teacher adherence fidelity ratings were assessed, and IRR matched fidelity ratings at 98%. Check-in procedure IRR was completed on 21% of the check-in fidelity measures, and agreement was reached on 100% of the check-in measures. Check-out IRR was completed on 23% of all check-out fidelity measures, and agreement was reached 100% of those measures. Social skills IRR was completed on 23% of all social skills lessons measured for fidelity, and agreement was reached at 100% (see Table 2 for IRR summaries).
IOA
In addition, IOA was completed for the BOSS, MCF, and ORF weekly measures. The procedure for these IOA checks had two research team members complete the weekly procedures simultaneously and score participants separately with agreement between the two scores calculated and converted into percentages. For the BOSS, IOA was completed on 21% of the weekly measures, and agreement was reached at 97%. MCF scores were checked for IOA 22% of all weekly measures and reached 100% agreement. ORF IOA was completed on 22% of all ORF fidelity measures and reached agreement at 95% (see Table 2 for IOA summaries).
Experimental Design and Analyses
This study involved a design in which data were collected on all 22 student participants during baseline and intervention phases. This allowed for a comparison of growth during the baseline to student growth data during the intervention period. The 4-week baseline phase data were collected to determine baseline behavioral and academic growth prior to the introduction of the intervention. Individual 13-week intervention period data were used in combination with baseline data to develop growth models predicting behavioral and academic trajectories in both phases. For the research questions investigating function, severity of behavior, and relationship status as predictors of response to intervention, only intervention period data were used to develop growth models of rates of behavioral response given the specific person-level variables considered.
Analyses
The interrupted time series (ITS) design is a type of quasi-experimental design that presents an alternative to randomized control trials in applied settings when randomized experimental designs are not reasonable (Duncan, Duncan, & Strycker, 2009). ITS allows for the identification of whether there is a change in the level and slope of the series from baseline to intervention across a single sample of participants whose individual intercept and slope differences are compared from baseline to intervention phases (Duncan et al., 2009; West, Biesanz, & Pitts, 2000). This approach does not allow for reporting cause and effect, but does protect against two threats to causal inference. First, the within-subjects design of ITS guards against unmeasured confounding variables and increases the likelihood that changes are the result of an association between the stated cause and effect (Bollen, 1989; Shadish, Cook, & Campbell, 2002). Second, the temporal sequencing from baseline to intervention protects against reverse causation to ensure temporal sequencing where the cause must precede the effect (Bollen, 1989; Shadish et al., 2002). For example, if researchers were measuring how an intervention aimed to improve motivation affected academic achievement, it is possible that better-performing students with regard to academic achievement would respond more favorably to a motivation intervention. For these reasons, ITS design is considered a sound substitute when randomized control trial designs are not feasible.
Due to the barriers of randomized experimental conditions in the applied setting of an alternative education setting, an ITS design was utilized in the current study. An ITS approach allows all students who require the intervention to take part in implementation rather than having the intervention withheld altogether or presented later. To test the ITS design, longitudinal growth models were used to analyze differences in between the level and slope in baseline and intervention phases within individuals. Growth models strengthen an ITS design by allowing for individual-level variance, rather than pooled variance in a repeated-measures approach (Singer & Willett, 2003). Finally, this design is appealing to classroom teachers primarily because it creates limited disruption to the school, teachers, and students.
Two growth models were used to assess whether CCE affected student behavior, and two models were used to assess whether CCE affected academic achievement. All four models were parameterized in the same way, using notation from Singer and Willett (2003).


Model 1 Combined:

Within this parameterization,
A second parameterization was used to generate models that tested whether there were any variables that moderated the relationship between behavioral and academic outcomes and CCE. These models were developed by adding invariant measures within the Level 2 parameters from the previous models.
Results
Behavior
Teacher ratings (DPRs)
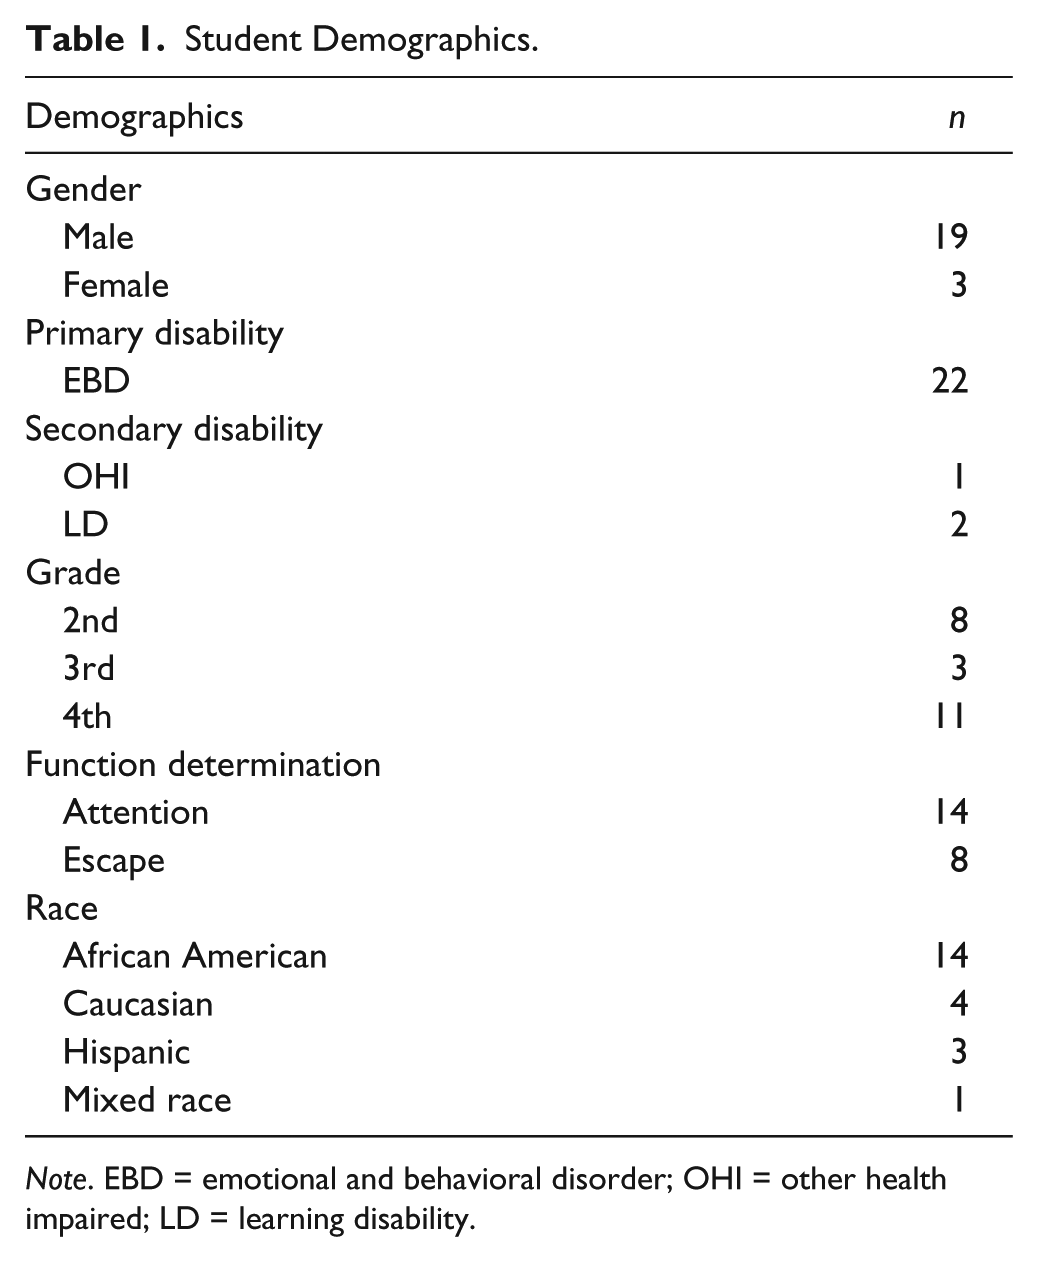
The average initial DPR scores at the start of baseline was 28.35, which was statistically significantly different from 0, t(21) = 51.72, p < .001. There was a statistically significant decrease in appropriate behavior over time during the baseline phase indicating behavioral improvement, t(21) = −2.95, p = .008. For every unit increase in time (day) during the baseline phase, there was a DPR score decrease of 0.24.
DPR scores statistically significantly increased by 2.76 at the onset of the CCE, t(21) = 2.33, p = .03. There was also a statistically significant difference in the slopes of DPR scores between baseline and CCE, t(21) = 3.08, p = .006. For every day of CCE, there was a DPR score increase of .26. Combined, the results indicate that there was a significant increase of DPR scores at the onset of CCE, and there was continued significant growth throughout the CCE intervention, as scores continued to increase. The results are graphically represented in Figure 1.
Estimated DPR scores reported by week during baseline and CCE.
There was a significant amount of variance in the measure of DPR scores at the onset of CCE,
Direct Observation of Behavior (BOSS)
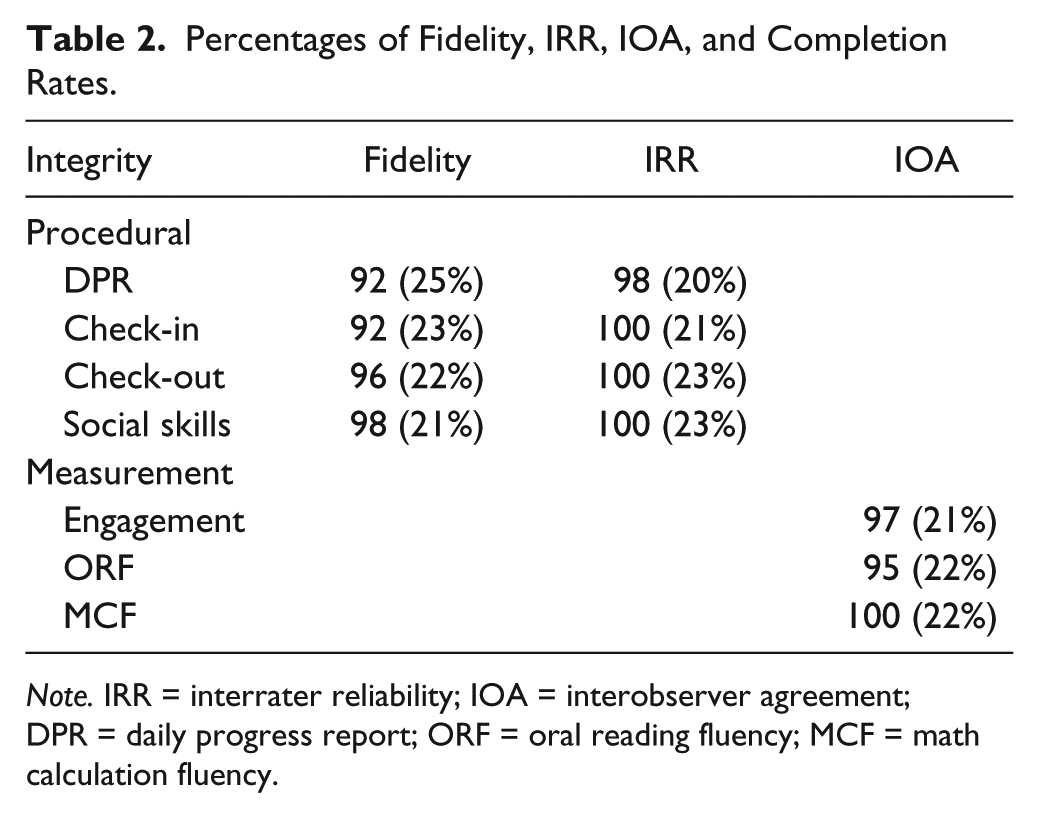
The average initial value of engagement scores at the start of baseline was 44.32, which was statistically significantly different from 0, t(21) = 22.25, p < .001. There was no statistically significant difference change in observed behavior over time (week) during baseline, b = .58, t(21) = .81,p = .426.
Engagement scores increased by 9.11 points at the onset of CCE, t(21) = 4.21, p < .001. There was also no statistically significant difference in slopes of engagement scores between baseline and CCE, b = −0.21, t(21) = −0.28, p = .779. Combined, the results indicate that there was a significant increase of engagement scores at the onset of CCE, and improvement, yet not significant during CCE. The results are graphically represented in Figure 2.
Estimated BOSS scores reported by week during baseline and CCE.
There was not a statically significant amount of variance in the measure of engagement scores at the onset of CCE,
Academic Achievement
Reading
Reading scores varied across participants from 0 to 183 words correct per minute throughout the study with the highest level of participant achievement not reaching the ceiling on probes provided (approximately 236). Although some students scored as low as 0 words per minute at the start of the study and start of the new academic year, the average value of reading scores at the start of baseline was 55.56, which was statistically significantly different from 0, t(21) = 4.80, p < .001. There was no statistically significant change in reading scores over time during the baseline phase, b = 1.62, t(21) = 1.37, p = .172. Reading scores increased by 6.63 points at the onset of CCE, but the increase was not statistically significant, t(21) = 1.84, p = .07. There was also no statistically significant difference in the slopes of reading scores between baseline and intervention, b = −0.55, t(21) = −0.46, p = .645. Combined, the results indicate there was no statistically significant increase in reading scores at the onset of CCE, or significant growth of reading scores during CCE.
Math
The second-grade math probes provided had an approximate ceiling of 41 digits correct. Participants varied in their scores from 0 to 25 digits correct throughout the study; thus, no participants neared the probe ceilings. The average value of math scores at the start of baseline was 6.41, which was statistically significantly different from 0, t(21) = 5.14, p < .001. There was no statistically significant change in math over time during the baseline phase, b = 0.49, t(21) = 1.75, p = .081. Math scores increased by 0.28 points at the onset of CCE, but the increase was not statistically significant, t(21) = .33, p = .743. There was also no statistically significant difference in the slopes of math scores between baseline and intervention, b = −0.40, t(21) = −1.41, p = .159. Combined, the results indicate that there was no statistically significant increase in math scores at the onset of CCE, or significant growth of reading scores during CCE.
Moderating variables
Given the significant amount of variance within the growth models for DPR and academic engagement, four Level 2 moderators were introduced into the models to potentially account for this variance: Function determined to maintain the behavior, severity of behavior (SSBD), coach–student relationship (CSRC), and student–coach relationship (SCRC) served as moderators.
Results indicate that for the DPR models, SCRC moderated the relationship between the onset of CCE and DPR scores, b = −2.71, t(1,616) = −2.45, p = .01; all other moderators were not significant (p > .05). SCRC also moderated the relationship between the difference in slope between baseline and CCE and DPR scores, b = 0.063, t(1,616) = 2.20, p = .03; all other moderators were not significant (p > .05). However, the addition of the moderators did not improve the model fit, as Akaike information criterion (AIC) increased from 10,488.0 in the original model to 10,491.3 in the moderated model. Therefore, this moderator was not included in the final analysis of DPR scores. The model from the previous section is the preferred model. The results of the model estimates are graphically represented in Figure 1.
Results indicate that for the student engagement models, these variables did not moderate the relationship between the onset of CCE and student engagement, nor the relationship between the difference in slope between baseline and CCE and student engagement (all p > .05). Therefore, none of the moderators were included in the final analysis of student engagement scores. The model from the previous section is the preferred model. The results of the model estimates are represented in Figure 2.
Social Validity
Results from the social validity scale completed by all three classroom teachers and paraprofessionals at the self-contained school suggested that CCE was a desirable intervention. Five out of six (83%) adults rated it as desirable.
Discussion
Alternative schools for students with E/BD including self-contained schools, and residential and juvenile justice facilities should serve as therapeutic, restorative settings when the behavioral issues (primarily E/BD and mental health) are beyond the scope of traditional school setting supports (Quinn et al., 2006). Integrating effective interventions in alternative education settings is complex and requires intensive resources and a concentrated decision-making process, which should be available to such settings at a level sufficient to yield positive student outcomes (Jolivette, McDaniel, Sprague, Swain-Bradway, & Ennis, 2012; Quinn et al., 2006).
CCE is a Tier 2 intervention with the primary purpose of providing a positive adult who establishes relationships with students with social and behavioral deficits. The current study aimed to extend the CCE intervention, which had previously been implemented only in traditional school settings to elementary students with E/BD in an alternative, self-contained school. The purpose of this study was to compare the behavioral and academic outcomes during baseline and CCE intervention to determine effectiveness for elementary students with E/BD in a self-contained setting. Potentially moderating person-level variables predicting response to CCE were also investigated. Overall, students demonstrated improvement on teacher-rated and non-biased direct observer-rated behavior during intervention. For the DPR, the trend in the data during baseline was negative indicating deterioration in behavior but with the introduction of the intervention, the trend turned positive and was significantly different from that in baseline. No moderators tested could explain the variance in the DPR model. Although CSRC was statistically significant, it was not meaningful in improving model fit.
The BOSS measured incidences of time on task by an outside observer. A significant main effect indicating that the introduction of CCE significantly improved student behavior was established. Although positive growth was demonstrated on the BOSS during baseline, the trend was flat, indicating slow behavioral change. With the introduction of CCE, BOSS scores improved significantly with a 15.2% increase and continued with a positive trend. By Week 10, BOSS score estimates reached 60 and maintained this score, which was the maximum score on the measure. This finding indicates that with the introduction of CCE, behavioral growth was rapid and sustained throughout the intervention to the point that the average participant was displaying on-task behavior about 90% of the time. These findings correspond to appropriate levels of on-task behavior expected in traditional schools. The consistency of behavioral data from teachers and outside observers suggests that the behavioral measures used to test the intervention had validity and reliability. In addition, the DPR and BOSS scores in the baseline phase presented an interesting difference in that, DPR scores declined over time and BOSS scores increased slightly. It is possible that teachers rated students at elevated rates during the start of the academic year in which baseline data were collected. Future research should investigate the correlation between DPR scores and direct observation tools. Another possible explanation for the difference is that the presence of the observer might have affected student behavior even during baseline observations.
None of the moderating variables predicted DPR growth during baseline or intervention except CSRC scores, which moderated DPR scores during intervention only. With the introduction of CCE, DPR and BOSS scores improved significantly compared with baseline suggesting CCE may be effective in improving student on-task behavior and decreasing the number of corrections and reminders given per day.
The results from the academic measures indicated that reading fluency and calculation fluency improved during baseline and intervention, but no significant changes in growth during intervention were noted. Although growth during intervention was positive and significant, further investigation is needed to determine the cause of academic growth during intervention having a more stable slope than during baseline. The results from this investigation highlight the importance of (a) addressing academic growth with effective teaching practices and (b) developing social and behavioral interventions that improve academic growth in alternative education settings.
Limitations
The primary consideration for ORF and MCF data collection and result interpretation is that CCE provided social and behavioral support and did not account for integrity of effective teaching practices or match the CBM tools to grade- or ability-level instruction occurring in the classrooms because all student participants received second-grade ORF and MCF probes. The measures were designed in this way so academic growth could be compared between students. Ideally, students would be assessed for academic growth specified to content presented in the classroom between measurement occurrences.
Consideration should also be made when interpreting the results from the SCRC due to emotional and developmental deficits inherent in elementary students with E/BD in self-contained settings. Student participants may not have accurately rated their relationship strength with the coach over the 13-week intervention and may not have fully understood the Likert-type score rating made available on the SCRC.
Implications
First, future research should closely examine the needs of students in alternative education settings with E/BD with regard to Tier 2 identification and interventions. Existing research describes validated practices in these areas for traditional schools and effective Tier 1 and Tier 3 assessment and intervention for students with problem behavior, yet little research is available validating efficient and effective Tier 2 interventions for students with E/BD in self-contained schools, and residential and juvenile justice settings. Specifically, future research should determine the degree to which validated Tier 2 interventions for traditional schools such as CCE are effective in more intensive, complex alternative settings. The purpose of Tier 2 interventions is to provide targeted support to students with problem behavior, reducing the reliance on resource intensive, individualized Tier 3 assessment and interventions (i.e., functional behavior analysis and behavior intervention plans). It is unclear whether tiered supports in alternative settings serve the same purpose as those in traditional settings. Future research on Tier 2 interventions in alternative settings should inform validated interventions that may require fewer resources as Tier 2 interventions, thus decreasing reliance on Tier 3 practices.
Second, the overall results were positive, although not significant in all cases, but should be replicated with specific focus on improving measurement of behavioral and academic data to reflect increments of growth over time. For instance, triangulation of the behavioral data with both teacher ratings and direct observations was attempted. Future research could determine the most effective, sensitive, and objective behavioral measures to use for behavioral progress monitoring, and academic measures should be able to compare students across grade levels using one standard probe.
Third, additional research questions that could be addressed in replicating this study include measuring time spent out of class for processing office discipline referrals and attendance rates. Further investigation could also attempt to replicate this study with participants in secondary alternative education settings such as middle school, self-contained schools, or high school classes in juvenile detention facilities.
In summary, CCE was an effective behavioral intervention for elementary students whose behavioral deficits were so severe that they were best educated in an alternative education setting. Although CCE is typically a Tier 2 behavioral intervention in traditional schools, it is possible that CCE could be an effective Tier 1 intervention for students in alternative education settings due to the increased need for behavioral support and the responsive nature of the intervention. Students with severe behavioral deficits have complicated needs, and their educational settings are typically just as complex. Nonetheless, effective, efficient strategies and interventions are required to support students in transitioning back to traditional educational settings. The results of this study suggest that CCE may be an appropriately matched, responsive intervention for improving student behavior, regardless of the function maintaining the behavior, and further, improved behavior may lead to more time on task and improved academic achievement, fulfilling the charge of restorative alternative education settings.
Footnotes
Declaration of Conflicting Interests
The author(s) declared no potential conflicts of interest with respect to the research, authorship, and/or publication of this article.
Funding
The author(s) received no financial support for the research, authorship, and/or publication of this article.