






Abstract
Students with early indicators of behavior risk have predictable, negative outcomes, and those with co-existing academic problems have significantly more negative outcomes. Identifying academic subclasses of students with behavior risk can inform integrated interventions and school-based problem-solving teams. In addition, identifying academic strengths among a population of children typically only differentiated by severity of maladaptive behaviors may offer insight into academic resiliency. Using a sample of 676 elementary school students identified as behaviorally at risk, latent class analysis of reading and math indicators was conducted. Results indicated a three-class structure was the best fit for these data, with Class 1 (25%) having the least academic risk, Class 2 (37%) as below average reading and math, and Class 3 (38%) with significant academic deficits. Class membership was found to significantly predict end of year statewide assessment performance. While those behaviorally at-risk students with co-occurring academic deficits were very likely to fail the end of year assessments (Class 3; 88%–99% failure rates), those with stronger academic skills (Class 1) were increasingly more likely to pass (47%–56% pass rates). Practical implications, including intervention selection, and future directions are discussed.
Substantial research has been conducted to document the early risk factors for students with behavior difficulties (Loeber, Green, Lahey, Christ, & Frick, 1992; Loeber et al., 1993; Schaeffer et al., 2006), as well as long-term negative outcomes for these students if intervention is not introduced (see Wagner, 1995; Wagner & Davis, 2006). Early behavior issues can lead to behavioral outcomes progressing from frequent office discipline referrals (ODR), to detention, suspension, dropout, and even incarceration (Darney, Reinke, Herman, Stormont, & Ialongo, 2013). In addition to documented negative behavioral consequences, academic outcomes can also be impacted when children exhibit behavioral difficulties. The novel purpose of this study was to determine the academic profiles and related characteristics of students identified as behaviorally at risk. Furthermore, the association of these classes with distal academic outcomes was evaluated, as these findings can be used to inform targeted early intervention services.
Students at Risk
For parents, teachers, and administrators, significant time is spent each school year attempting to identify students who are at risk behaviorally and academically, as well as providing early intervention or remediation services to these students. According to Bruhn, Woods-Groves, and Huddle (2014), 12% of school-age children exhibit characteristics that correspond with the diagnosis of Emotional and Behavioral Disorder (EBD) at any given point in time. Furthermore, Burns and Hoagwood (2004) have suggested that 20% of school-aged children should be receiving treatment for emotional and behavioral problems, yet approximately only 1% receive services in the form of special education (Severson, Walker, Hope-Doolittle, Kratochwill, & Gresham, 2007). These studies suggest that schools are not effectively identifying students who may benefit from important early intervention services.
For decades, researchers have investigated the pathway leading to problem behaviors. Sprague and Walker (2000), positing a life course theory, suggest that the path to negative outcomes begins very early in life when children are exposed to risk factors in multiple settings including family, neighborhood, school, and community. Such risk factors include poverty, parent criminality, and emotional, physical, or sexual abuse. Exposure to these and other risk factors can then lead to the development of antisocial behaviors, including aggression and defiance of authority figures. When children display these antisocial behaviors, they are susceptible to negative short-term outcomes, including peer and teacher rejection, and academic underachievement. In the absence of intervention, these short-term outcomes can lead to more severe, long-term, destructive outcomes, including school failure and dropout, drug and alcohol use, and adult criminality (J. Reid, Patterson, & Snyder, 2002). This pathway becomes more stable over time in the absence of intervention (Gottlieb, 1991).
Given that the problems associated with behavior risk continue to not only become more pervasive in nature, but also increase in severity over time, it is essential to intervene with these children as early as possible. This necessity has not only been recognized by the research community, but also by the government and policy makers as evidenced by initiatives such as No Child Left Behind and the Presidential Commission on Excellence in Special Education (Severson et al., 2007). Research has shown that the longer children are exposed to risk factors, the more likely they are to develop negative outcomes, further highlighting the importance of early identification and intervention (McIntosh, Reinke, & Herman, 2010; Walker, Severson, Feil, Stiller, & Golly, 1998). While some have doubted the ability to accurately identify those at risk of later negative outcomes so early in life, Sprague and Walker (2000) have found that it is possible to accurately identify children as early as age 5, and in some cases even earlier. In a study by Walker and colleagues (1998), kindergarten students identified as being at risk for antisocial behavior were rated as less aggressive by their teachers and were observed as spending a greater amount of time academically engaged after completing the First Steps to Success intervention. Not only can at-risk children be identified early, but intervention efforts have shown promise in reducing behavioral difficulties.
Measuring Behavior Risk
Behavioral risk is defined as “problem behaviors and characteristics that are associated with the development of emotional and behavioral problems” (Burke et al., 2012). Schools have attempted to measure behavioral risk in a multitude of ways, including screening students for exposure to risk factors associated with the development of EBD, tracking the number of ODRs a student receives, and using behavior screening measures (Severson et al., 2007). The most commonly used form of identification of behavioral risk in the United States is use of ODRs. Although examining ODR data provides insight into behavioral difficulty, this method has several limitations. The first limitation of using ODRs as a measure of behavioral risk is that it is a reactionary, “wait to fail,” rather than proactive approach (Kilgus & Eklund, 2016). For a child to earn an ODR, that child must be exhibiting elevated levels of problem behavior. Another limitation is that this form of identification is not systematic; behaviors that result in ODRs are not consistent across or even within schools (Bruhn et al., 2014). Finally, ODRs have been found to be disproportionally applied to minority students, with teacher bias as an area of concern (Pas, Bradshaw, Hershfeldt, & Leaf, 2010; Skiba et al., 2008).
Universal screening of problem behaviors was designed to address these limitations. By rating all students’ behavior on the same scale, this form of identification is both proactive and systematic. However, despite having these tools available since the 1980s, behavior is the area second least screened in the U.S. school system, with tuberculosis being the only area that is less screened (Bruhn et al., 2014; Severson et al., 2007). In a survey conducted by Bruhn and colleagues (2014), with 454 school or district administrators responding across 48 states, they found that only 12.6% reported using schoolwide emotional or behavioral screeners. Some have suggested that the infrequent use of these screeners may be due to schools viewing academics, rather than social-emotional well-being, as their main goal (Severson et al., 2007). Another reason schools may not universally screen for behavior risk is the perceived or actual cost and difficulty of the process.
In their seminal paper, Glover and Albers (2007) suggest usability and appropriateness of screeners is as important as technical adequacy. Validation studies, including the examination of psychometric properties, are important for establishing an evidence base for screening instruments. However, practitioners and researchers must also consider the practical use of psychometrically sound instruments. Universal behavior screening has the potential to come at extensive cost to schools, particularly if triannual screening is implemented. However, if screeners can accurately identify at-risk students who are likely to benefit from targeted intervention, without large expenditures of time and money, then the benefits may well exceed the costs.
Behavior Screeners
There are two main types of behavior screening instruments: (a) those that rely on teacher nomination of students, and (b) universal behavior screeners that are completed for every student regardless of hypothesized risk status. The Systematic Screening for Behavior Disorders (SSBD; Walker & Severson, 1992) is arguably the most widely used among the teacher nomination type of behavior screening. This system uses a multiple gating procedure to identify children at risk, with teacher nomination of students who are exhibiting internalizing and externalizing risk. Nominated students are then evaluated with standardized rating forms, followed by systematic direct observation of students determined to be most at risk. Although the multiple gating procedure can be a long process, requires expertise in analyzing data, and can be susceptible to nomination bias, the potential benefits are significant. One such benefit is this process has been found to adequately differentiate between students with internalizing and externalizing behavior problems (Severson et al., 2007). The SSBD has also been used to accurately identify children with behavioral risk at the middle- and junior-high school levels (Caldarella, Young, Richardson, Young, & Young, 2008).
Among universal behavior screeners, the Behavioral and Emotional Screening System (BESS; Kamphaus & Reynolds, 2007) is the most widely used. This tool, available as part of the AIMSweb family of measures or as a standalone assessment, is completed for every student, up to three times per year, and is norm referenced to indicate risk status. The subject of extensive research in recent years, the BESS has been found to have adequate evidence of reliability and validity. Teacher ratings on the BESS are associated with both behavioral and academic outcomes, including end of year academic success (King, Reschly, & Appleton, 2012). There are several other universal screening instruments available, each with implications for technical adequacy, usability, and appropriateness.
Measuring Academic Risk
Measuring student academic risk has become streamlined, if not efficient, with the advancement of curriculum based measurement (CBM) instruments and screening practices. Originating in the early 1980s within special education, CBM was developed as a method of evaluating educational instruction (Deno, 2003). Specific and repeatable, CBM tools were designed to be efficient indicators of academic proficiency. These instruments, most of which require less than 3 min to administer, have been found to be strongly correlated with broader academic skill in the same content area, thus serving as proxies of student academic achievement (Deno, 2003).
Since development many decades ago, the use of CBM has been widely implemented across the United States. CBM measures now serve an essential role in tiered models of support, such as Response to Intervention (RtI) or Multi-tiered Systems of Support (MTSS), as they have been found to quickly and accurately identify students at risk for academic failure. Given the feasibility of the measures, many school districts now screen every child in reading and math as frequently as three times per year. Among the many other uses of CBM tools, including progress monitoring and determining response to intervention for special education eligibility determination, data obtained through CBM have been found to be predictive of high-stakes achievement testing (Good, Simmons, & Kame’enui, 2001).
CBM measures are easily accessible to schools, as they can be cost-effective, include multiple academic areas and behavior, span most grade levels, and are increasingly web-based for administration and scoring. The Dynamic Indicators of Basic Early Literacy Skills (DIBELS; Good, Kaminski, Smith, Laimon, & Dill, 2003) offers basic probes and hand-scoring options at no cost to schools. AIMSweb (Shinn & Shinn, 2002), a paid service, offers a wide variety of CBM tools for nearly every grade level and academic area, and includes universal behavior screening.
Relationship Between Behavior and Academics
Academic difficulties and disruptive behavior problems co-occur at rates that are higher than would be explained by chance (Hinshaw, 1992). A significant amount of previous research has identified relationships between behavior and most academic skill areas, including reading, spelling, mathematics, science, social studies, and listening comprehension (Nelson, Benner, Lane, & Smith, 2004; R. Reid, Gonzalez, Nordness, Trout, & Epstein, 2004; Rutter & Yule, 1970).
Research in this area consistently concludes that, for students with co-existing academic and behavior problems, outcomes are significantly more negative than for students with deficits in either area alone (Bub, McCartney, & Willett, 2007; Darney et al., 2013; Lane, Barton-Arwood, Nelson, & Wehby, 2008; Reinke, Herman, Petras, & Ialongo, 2008). One study found that academic skill deficits among children with EBD worsened over time until these skill deficits were more significant than those of peers with learning disabilities (Anderson, Kutash, & Duchnowski, 2001).
The exact nature of the relationship between behavior problems and academic skill deficits is unclear, and it is likely that many individual factors are involved. One plausible explanation, supported by significant research findings, is the co-occurrence of attention problems that negatively impact both academics and behavior (Fleming, Harachi, Cortes, Abbott, & Catalano, 2004). Other researchers suggest classroom behavior problems lead to less time academically engaged, thus resulting in academic skill deficits (Dishion, French, & Patterson, 1995). Another plausible explanation is, for children with academic skill deficits, disruptive behavior is a method used to escape aversive academic tasks (McIntosh, Horner, Chard, Dickey, & Braun, 2008).
In 2008, Reinke and colleagues examined latent classes of first grade students using both behavior and academic indicators. Results of their study indicated that class structure varied by gender, with boys having a “behavior problems only” class, whereas girls did not. In both gender class solutions, the class of students with both behavioral and academic problems was associated with the highest likelihood of negative outcomes in middle school (Reinke et al., 2008). In a 2016 study, King and colleagues examined latent classes of students using CBM screening measures. Results of that study indicated that not only did meaningful latent classes of students exist, these classes were also predictive of success on a statewide achievement measure. With predictable negative outcomes in the same school year as the screening, implications of this study include the importance of targeted intervention efforts early in the school year for students with demonstrated risk (King, Lembke, & Reinke, 2016). Although these important findings can be used to inform early intervention efforts, a significant limitation of previous work has been the failure to identify academic skill patterns among students with behavioral risk.
Importance of Understanding Academic Problems Among Behavioral Risk Samples
Students exhibiting behavior problems in schools comprise a statistically small yet practically significant portion of the student body. Sprague and Walker (2000) found that less than 10% of children account for more than 50% of discipline referrals and almost all serious offenses. As described above, these students have predictable and negative long-term outcomes and benefit from early identification. Accurately identifying children in need of more intensive intervention has been the focus of universal behavior screeners, and gains are being made in this area. As well, identifying and implementing appropriate interventions is becoming more commonplace in schools. However, research and school practices have been slow to adopt an integrated approach to intervention, wherein one team of professionals works to identify intervention need regardless of origin. Commonly, schools have one problem-solving team to handle behavior referrals and a separate team for academic referrals. Lane, Oakes, Jenkins, Menzies, and Kalberg (2014) argue that this approach is inefficient at best, and can be detrimental to student improvement. Thus, more research is needed to examine the outcomes of varying patterns of academic and behavioral skills within individual students.
A significant limitation, however, is that when school-based research (with the exception of that done in alternative school settings) includes all students in the sample, the subsample of children with behavior risk is often too small to generate enough power to find meaningful differences within the group. When the entire student body is included in analysis (see King et al., 2016), data from students with behavior problems are diffused by those of the majority of students without behavior risk. For this reason, it is almost impossible to examine patterns and latent profiles of academic skill among this population of students without a large sample size. The result is a body of literature focusing on the behavior problems of at-risk students, while ignoring potential academic strengths and difficulties, further perpetuating the chasm between academic and behavior intervention. Identifying meaningful academic subclasses of students with behavior risk has the potential to inform integrated interventions and school-based problem-solving teams. Furthermore, identifying academic strengths among a population of children typically only differentiated by severity of maladaptive behaviors may offer insight into academic resiliency and the relationship between behavior and academics.
Study Purpose
The purpose of this study was to identify and examine academic subclasses within a population of students identified as behaviorally at risk, based on reading and math indicators. The utility of these classes to predict end of year academic achievement was then examined. We hypothesized that a minimum of three classes would emerge, including a class with poor reading and math that is associated with Tier 3 normative cut scores, a class corresponding to Tier 2 level academic supports and cut scores, and a class with less academic risk consistent with Tier 1 normative cut scores. It was hypothesized the class meeting Tier 3 cut-score criteria would have poorer end of year academic outcomes.
Method
Participants
This study is an analysis of data gathered as part of a multi-year, district-level screening initiative in an urban, Midwestern school district. This initiative, which began in 2009, includes screening all children in kindergarten through 12th grade three times per year with academic and behavior screeners, following standard benchmarking procedures. The school district is diverse, with a total enrollment of 17,882 students, 72% of whom are African American, 57% who are eligible for free or reduced lunch, and 13% of whom receive special education services.
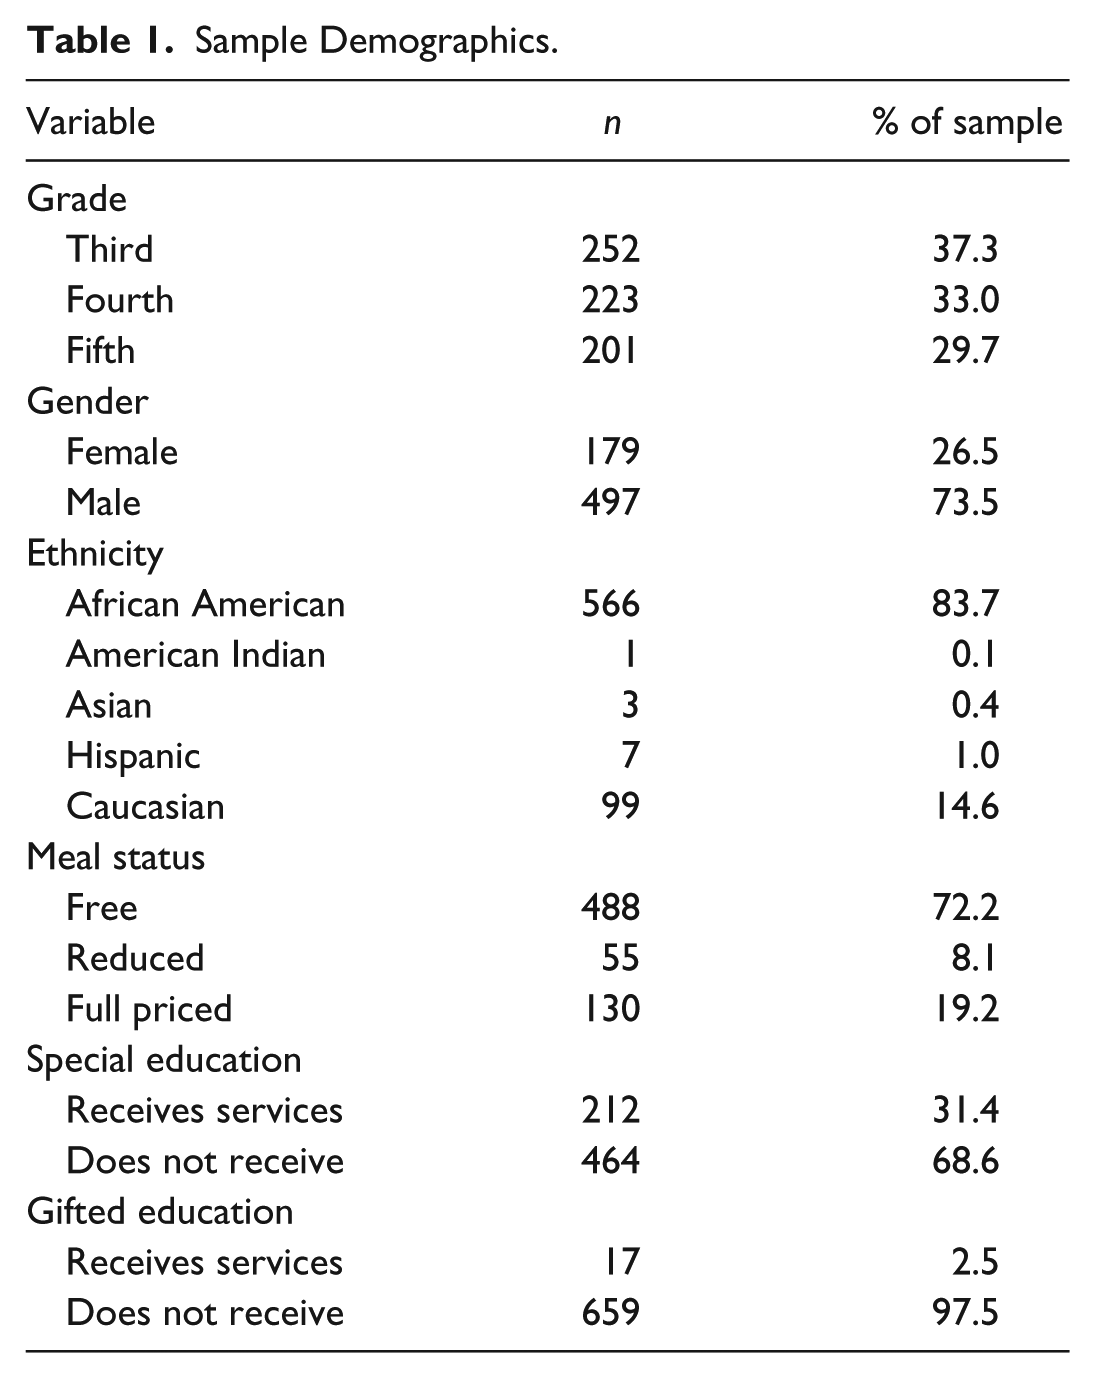
The data analysis for the current study utilizes academic and behavior screening data from 676 students in Grades 3 through 5 who were identified as at risk on a behavioral screening indicator. Specifically, each of the students in the sample was rated as “at risk” or “clinically significant” on a teacher-completed, behavior screening instrument in the fall of the school year. The sample of students included in the current study consisted of 252 third graders (37.3%), 223 fourth graders (33.0%), and 201 fifth graders (29.7%). The majority of the students in the sample were male (73.5%), general education (68.6%), and receiving free or reduced lunches (80.3%). The ethnic diversity of the sample was as follows: 83.7% African American, 14.6% Caucasian, 1.0% Hispanic, 0.1% American Indian, and 0.4% Asian. Seventeen (2.5%) of the children rated by their teachers as having behavioral risk were receiving gifted education services. See Table 1 for sample demographics.
Sample Demographics.
Measures
Universal screening data as indicators
Universal screening measures of academic and behavioral risk were used as indicators of class membership. Using AIMSweb measures of reading, math, and behavior, students were screened as a component of their typical educational programming, with standard benchmarking procedures, in September of 2012. The current study includes children in Grades 3 through 5 who were identified at that time as having behavioral risk. For the purposes of this study, each universal screening measure was made categorical by using AIMSweb grade-level cut-score criteria (see Table 2), and labeled to coincide with tiered models, such as RTI and MTSS. Tier 1 includes children who meet benchmark in that area and are at minimal risk of academic difficulties, Tier 2 indicates slightly below benchmark performance and an increased risk, and Tier 3 includes students who do not meet benchmark in a given area and are at the most risk of academic failure. Categorizing the scores based on grade-level cut scores allows for comparison and grouping of students across grades by tier level of risk.
Cut Scores for Determining Tier Level of AIMSweb Measures.

Note. MAZE = AIMSweb reading comprehension measure; R-CBM = AIMSweb Reading Curriculum-Based Measurement; M-CAP = AIMSweb Math Concepts and Applications; M-COMP = AIMSweb Math Computation; BESS-T = Behavioral and Emotional Screening System, Teacher Form.
Measures of reading skill
Student reading skill was assessed using AIMSweb Reading Curriculum-Based Measurement (R-CBM) and AIMSweb MAZE (available at www.aimsweb.com). R-CBM is an individually administered measure of oral reading fluency that is highly correlated with grade-level standards. Student R-CBM scores are based on the number of words read correctly aloud during the 1-min test. Oral reading fluency measures, such as AIMSweb R-CBM, have been found to be valid and reliable indicators of overall reading skill (Good & Jefferson, 1998; Reschly, Busch, Betts, Deno, & Long, 2009). Student R-CBM scores from this sample were compared with grade-level AIMSweb national normative data to determine level of risk.
As an additional indicator of reading skill, AIMSweb MAZE scores were used. MAZE probes consist of passages with every seventh word replaced with a choice of three words. Students completing MAZE tasks are instructed to read the passage and choose by circling the correct missing word from among the three choices. This test is then scored by summing the number of correctly identified words during the 3-min administration. Both the criterion and content validity of MAZE probes have been measured with adequate findings (Jenkins & Jewell, 1993).
Measures of math skill
Two AIMSweb measures were included in the study as indicators of skill in mathematics: Mathematics Concepts and Applications (M-CAP) and Mathematics Computation (M-COMP; available at www.aimsweb.com). The M-COMP test is a measure of basic grade-level computational math skills, whereas the M-CAP measures applied mathematics skills. Each is an 8-min, open-ended, paper-based test that can be administered at the group or individual student level. Test content is aligned to grade-level curriculum and standards. The M-COMP includes mixed problems such as addition, subtraction, multiplication, and division. The content of the M-CAP includes numbers and operations, geometry, algebra, and measurement. Each test is scored as total correct responses (weighted for difficulty) and compared with the national normative sample to determine level of risk. The technical adequacy of these measures has been evaluated in validation studies and was found to provide acceptable evidence of reliability and validity (AIMSweb & Pearson Education, 2009, 2010).
Measure of behavior risk
Students were included in the current sample based on behavioral risk status as determined by teacher ratings on the BESS System (Kamphaus & Reynolds, 2007). The BESS is a universal behavior screener that has been added to the AIMSweb system, although it also can be purchased independently (www.pearsonassessments.com). The BESS, which has been adapted from the full-length Behavioral Assessment System for Children, Second Edition (BASC-2; Reynolds & Kamphaus, 2004), includes Teacher, Parent, and Student report forms. For the current study, Teacher BESS scores, gathered during the fall screening, were used to determine student risk. This form, which reportedly takes 5 to 10 min per child to complete, consists of 27 items scored on a 4-point Likert-type scale. The psychometric properties of the BESS, including reliability and validity estimates, have been found to be adequate (Kamphaus & Reynolds, 2007; King et al., 2012).
Distal outcome measure
The Missouri Assessment Program (MAP) is a statewide, end of year, grade-level achievement test. Included in this study are the Communication Arts and Mathematics scores of the spring 2013 administration of the test. MAP score reports include both scaled scores and proficiency levels, which are Below Basic, Basic, Proficient, and Advanced. Students scoring at the Proficient and Advanced levels of proficiency are considered to have “passed” the test. Using proficiency levels of achievement, as opposed to scaled scores, on the MAP tests allow for comparison and grouping of students across grade levels.
Each year, the psychometric properties of the MAP tests are evaluated by an independent firm. The tests used as outcome measures in this study produced acceptable Cronbach’s alpha reliability coefficients. Specifically, reliability of the communication arts test was 0.91 for each grade, and the mathematics test produced reliability coefficients of 0.91 for third grade and 0.92 for the fourth and fifth grade versions of the test.
Statistical Methods
Latent, or underlying, classes among students exhibiting at-risk behaviors were identified using reading and math indicators in the fall of the school year. Latent class analysis (LCA), a person-centered approach, allows for the identification and formation of groups of individuals with similar patterns of scores on categorical indicator variables (McCutcheon, 1987). In LCA, model fit indices and theoretical relevance are used to determine the appropriate number of latent classes for the data (B. Muthén, 2004). Adhering to the principal of parsimony, the goal of LCA is to identify the smallest number of classes that explain the relationship between indicator variables. The likelihood of an individual being in each latent class is calculated, and probability is used to form meaningful classes of individuals. After the appropriate number of classes for these data was determined, these classes were used to predict student performance on the end of year achievement test. Individual student outcome data on these tests was known to the researchers, thus, the Mplus known class function (L. K. Muthén & Muthén, 2014) was used to determine the probability of each latent class of students passing each section of the end of year exam.
Determining model fit
Analyses were conducted using Mplus 7.3 (L. K. Muthén & Muthén, 2014). When determining the best model for data using LCA, it is important to consider model fit indices and substantive theory. Mplus software provides several model fit indices, including Akaike information criterion (AIC; Akaike, 1987), the Bayesian information criterion (BIC; Schwarz, 1978), and the Bayesian information criterion after adjusting for sample size (aBIC; Sclove, 1987). The BIC is typically given the most consideration when determining model fit, as it has been shown to be the most reliable indicator of true model fit (Nylund, Asparouhov, & Muthén, 2007). Models of increasing class size are compared on model fit indices, with smaller information criteria typically indicating better model fit to data. In addition, the precision of classification is estimated with entropy, with scores closest to 1.0 indicating greater precision (Muthén, 2004; Ramaswamy, DeSarbo, Reibstein, & Robinson, 1993). Finally, the Vuong-Lo-Mendell-Rubin Likelihood Ratio Test (VLMR LRT) is used in determining model fit. This test provides a p value of model strength over a model with one fewer class, with significant p values indicating that the current model is a significantly better fit for these data (Nylund et al., 2007).
Treatment of missing data
The Mplus program allows several options for the handling of missing data. These data are assumed to be missing at random (MAR) and are treated with the full information maximum likelihood estimation (Arbuckle, Marcoulides, & Schumacker, 1996; Little, 1995). Maximum likelihood estimate is a robust and acceptable method of handling missing data that uses all available information, making this method preferable to both imputation and deletion in this situation (B. Muthén & Shedden, 1999; Schafer & Graham, 2002).
Results
LCA
LCA was conducted to determine optimal number of classes for these data, using reading and math skill as class indicators and controlling for behavioral screening score and gender. All students selected for inclusion in this study were identified as behaviorally at risk on the BESS-T; however, t scores were used as covariates to control for severity of at-risk behaviors. Thus, classes were identified based solely on academic profiles while controlling for gender and behavior.
Model fit indices, entropy values, and VLMR scores were examined to determine the appropriate number of classes to retain. These results, presented in Table 3, indicated a three-class solution was the best fit for these data. This solution provided the lowest BIC score, which is the most important indicator of class retention. In addition, VLMR indicated this model was significantly better than the two-class solution, and entropy values were adequate. Finally, based on substantive theory, parsimony, interpretability, and findings in related studies (King et al., 2016), a three-class solution was further indicated as optimal model fit.
Unconditional Model Fit Indices for Two- to Four-Class Solutions.

Note. Bold values indicate the best fitting model based on BIC score. Smaller values indicate better fit of the model. Entropy values close to 1.0 indicate higher classification precision. LC = latent class; AIC = Akaike information criterion; BIC = Bayesian information criterion; aBIC = adjusted Bayesian information criterion; VLMR LRT = Vuong-Lo-Mendell-Rubin Likelihood Ratio Test.
Percentage of behaviorally at-risk students within each class that met Tier 1 (minimal risk), Tier 2 (some risk), and Tier 3 (most risk) cut points across academic indicators are presented in Figure 1. After examining the profile of students comprising each class, labels were assigned based on overall pattern of academic skills within each class. Class 1, the smallest class (25%), was characterized as having the least academic risk, with the majority of the students in this class meeting Tier 1 cut scores in reading and Tier 2 cut scores in math. Class 2 (37%) was characterized as Tier 2, with student scores exceeding the criteria for Tier 2 classification in reading and math. Class 3, the largest class (38%), had the most significant academic deficits, with reading and math scores on the indicator variables exceeding AIMSweb criteria for Tier 3 classification.
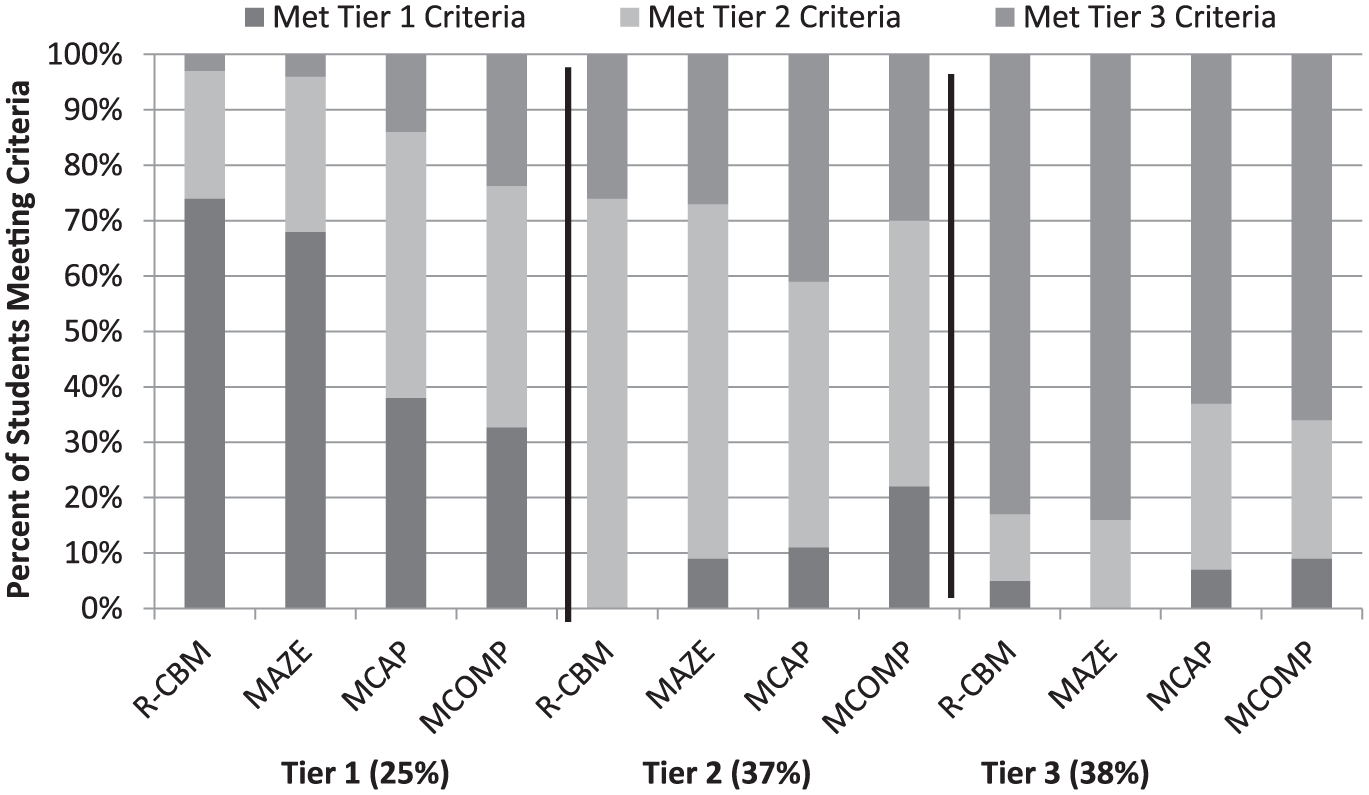
Percentage of students within each class meeting Tier 1, Tier 2, and Tier 3 criteria across indicators.
Distal Achievement Test Outcome by Class
Once latent classes were identified, these classes were used to predict scores on the statewide end of year achievement tests (see Table 4). Overall, the majority of students in this at-risk behavior sample did not pass the state test (82% failed reading; 86% failed math); however, differing patterns of success emerged among the latent classes. Significantly, of those students falling into the most at-risk class (Tier 3 class), only 1% passed the reading subtest on the end of year test, and 4% passed the math subtest. In addition, for students falling into the Tier 2 academics class, only 12% passed the reading test, and 8% passed the math test. Finally, the students in the Tier 1, but with some math risk class, had a higher probability of passing the state test. Specifically, 56% of students in this class passed the reading portion of the end of year test, and 47% passed the math, indicating that despite behavioral risk status, students with stronger academic skills, particularly in the area of reading, are more likely to pass the end of year exam.
Achievement Test Outcomes by Subject and Class Membership.

Note. MAP is the end of year achievement test. Pass includes students at both the Advanced and Proficient levels of competency per grade-level cut scores. Fail includes Basic and Below Basic scores. MAP = Missouri Assessment Program.
Discussion
The purpose of this study was to determine if latent classes of academic skill patterns exist among children identified as having behavioral risk. This study addresses a needed area of research examining concurrent academic and behavior skill among children with behavior risk. Only those students who were rated as behaviorally at risk by their teachers were included in the study to allow for a more systematic analysis of the academic risk patterns of these students and the associated outcomes. In schools using RTI or MTSS models of service delivery, these are typically the students who are identified as in need of behavioral interventions. Identification of academic patterns among children with behavioral risk is important as schools work to better define and integrate interventions that result in the best outcomes for these students. Students with both behavioral and academic risk require more comprehensive interventions if we are to truly impact the negative trajectories observed among many of these students (Darney et al., 2013; Reinke et al., 2008).
Results of the LCA identified three classes of students, differentiated by academic skill patterns: a class of students with average reading but at-risk math skill (meeting Tier 1 reading and Tier 2 math cut scores), a class with at-risk reading and math skill (Tier 2), and a class of students with significant deficits in both reading and math (Tier 3). Interestingly, this Tier 3 class of students was the largest, comprising 38% of the sample, and the class of students with Tier 1 reading skill was the smallest (25%). This highlights the substantial co-occurrence between academic and behavioral problems among students.
Classes identified through these analyses were similar to those identified by King et al. (2016) and Reinke et al. (2008). Specifically, previous studies have identified three to four classes of children that are primarily differentiated by academic skill level. The unique contribution of the current study is the sample was comprised of only children with some level of behavior risk, thus allowing for an examination of academic skill patterns and identification of areas of potential intervention. The class with the least academic risk demonstrated an interesting pattern in which 68% to 71% of the students in this class showed minimal reading risk, but only 32% to 39% were at minimal risk in math, highlighting a relative strength in reading. The fact that CBM scores, and Oral Reading Fluency (ORF) specifically, predict end of year achievement on standardized exams is not a new finding (Good et al., 2001; McGlinchey & Hixson, 2004); however, the finding that these scores vary widely among children with behavioral risk is novel.
As further indicated by this study, behavioral risk status was widely associated with failure on end of year assessments, as the majority of the students in the sample, regardless of academic tier, failed the end of year test in both subjects. Although the severity or odds of failure varied by latent class, pass rates among the students in this sample were far lower than expected given previous research regarding the use of CBM scores to predict success on high-stakes achievement tests (Stage & Jacobsen, 2001). While those behaviorally at-risk students with co-occurring academic deficits were very likely to fail the end of year assessments (88%–99% failure rates), those with stronger academic skills (Tier 1 in reading) were increasingly more likely to pass (47%–56% pass rates). It should be noted, however, that these pass rates were still lower than would be expected from students without co-occurring behavioral risk (Keller-Margulis, Shapiro, & Hintze, 2008). In other words, Tier 1 classification is typically considered to be associated with minimal risk; however, the students in this sample, while scoring in the Tier 1 category of reading, were still at substantial risk of failing the end of year exam. Co-occurrence of behavioral risk is the most plausible explanation for the poor pass rates of this sample.
Not only do these results identify a range of academic skills among children with behavior risk, but also demonstrate how this range has significant implications in terms of high-stakes assessment and potential intervention areas. End of year test outcomes for students with average reading skills despite behavioral risk (Tier 1 class) are far more positive than for those students with the same behavioral risk but weaker academic skill (Tier 2 and 3 classes); however, these students are still at risk of failing the end of year exam. This discovery further highlights the importance of integrated problem-solving teams through which interventions are implemented not based on the title of the team or expertise of the members, but rather on the pattern of malleable risk factors of individual students. Although schools are encouraged to intervene early to promote appropriate behavior, early academic intervention may be what differentiates students who pass and fail end of year exams. Behavioral intervention should not be the only source of intervention for students with both behavioral and academic risk. Academic intervention cannot be reserved for students without behavioral risk. With limited resources, schools may feel unable to provide intervention in more than one area, particularly outside of special education; however, the consequence for students with deficits in both behavior and academics is overwhelming end of year failure.
Study Limitations
Data for this study were drawn from one school district in the Midwest. Although this district was large, diverse results cannot be generalized to other populations. Data used in this study were collected as part of a larger, ongoing partnership with this school district. Because this was an existing dataset, additional data sources could not be added, thus eliminating the possibility of examining teacher- and school-level variables within these analyses.
These results are also limited by the nature of the measures used to form the latent classes and determine outcomes. CBM measures, although predictive of academic success, are brief indicators of academic skill at one point in time. Scores on these measures are widely used by schools to inform intervention efforts (among other uses), but they are not deterministically representative of academic potential and can be influenced by outside factors. Likewise, the outcome measure of success used in this study was statewide, standardized achievement testing. Pass/fail rates on these tests are extremely important to schools as they can influence funding, teacher evaluations, and district report cards. However, scores on these tests are by no means the only significant outcomes for individual children, especially children with behavioral risk. For these children, who have predictable negative outcomes when intervention is not implemented, academic achievement may seem less critical than longer-term outcomes, such as high school graduation and involvement in the criminal justice system. However, increasing academic success for children with behavioral difficulties improves the likelihood of high school graduation, and in turn reduces the probability of adult criminality (Kennelly & Monrad, 2007; Moretti, 2005).
Future Directions
This study further investigates the link between behavior and academics by identifying predictive patterns of academic skill among children with behavioral risk. However, many questions regarding cause, order of onset, and intervention effectiveness are yet to be answered. With a longitudinal dataset of behavioral and academic risk indicators, researchers may consider the use of latent transition analysis to study the children who move between groups of risk status. In other words, this analysis might reveal similar groups of children who transition from behavioral risk only to combined behavioral and academic risk, and vice versa. Patterns of children who transition between groups of risk status, and the timing of the transition, have implications for early intervention and prevention efforts.
Future research investigating intervention efforts based on these findings is encouraged. In particular, results of this study indicated that students with stronger reading skills, despite behavioral risk, were more likely to pass the end of year exams. It may prove beneficial to implement joint reading and behavior interventions for children who have behavioral risk and reading deficits. In addition, there was not a class of students in this sample with Tier 1 math skills. Both CBM math and end of year achievement scores in math were low, to varying degrees, throughout the sample. More research is needed to determine if there is a unique relationship between behavior and math skills and if this relationship is found in other samples.
Finally, although beyond the scope of the current study, a critical review of the demographic makeup of this sample and universal screening practices must be conducted. Although 72% of the students in the entire district are African American and 57% are eligible for free or reduced lunch, the behavior risk sample was 84% African American, 80% free or reduced lunch, and 74% male. Universal behavior screening is often promoted as a less biased identification method than traditional teacher referral; however, this study found a disproportionate number of economically disadvantaged African American males were identified as behaviorally at risk. The next steps for researchers are to examine potential bias in the universal screening process, as well as underlying reasons why this demographic subgroup of students continues to be identified as at risk.
In conclusion, the co-occurrence between academic and behavioral risk has been repeatedly demonstrated in the literature. Thus, standalone interventions that target one and not the other for some students is limiting the potential for positive impacts. In this study, the majority of the sample had significant academic risk in addition to behavioral risk. Using academic and behavioral screening in combination and reviewing these data together using a problem-solving process can lead schools to identify early those students exhibiting co-occurring risk and implement prevention and early intervention efforts targeting academic and behavioral risk. Continued work in understanding the patterns and subclasses of students who are at risk behaviorally can help to inform the development of intervention that includes strategies for both behavior and academic risk, rather than having two separate interventions occurring in the school (e.g., pull out for social skills training and pull out for reading recovery). As research demonstrates the need for combined academic and behavior interventions, prevention scientists and school practitioners are encouraged to find feasible methods for integrating and streamlining interventions that will produce the greatest impact on behavior and academic issues. These efforts are imperative if we are to reduce the long-term negative outcomes of students with early behavioral risk.
Footnotes
Declaration of Conflicting Interests
The authors declared no potential conflicts of interest with respect to the research, authorship, and/or publication of this article.
Funding
The authors received no financial support for the research, authorship, and/or publication of this article.