
Abstract
What is the minimum black population necessary to elect African-American state lawmakers? We offer the most comprehensive examination of the election of black state legislators in the post-Thornburg v. Gingles (1986) era. We begin by charting changes in the partisan affiliation of state legislators and the percentage of black legislators from 1971 to 2016. This descriptive assessment is undertaken according to important regional (Non-South and South) and subregional (Rim South and Deep South) contexts in American politics. We then perform multivariate analyses of the likelihood of electing black legislators across three periods following the marked increase in the creation of majority-minority districts (1993–1995, 2003–2005, 2013–2015). Because of sectional variation in the partisan strength of the major parties, the probability of achieving black representation is significantly different depending upon whether a contest occurs in the Non-South, Rim South, or Deep South, with the latter constituting of the highest threshold of black population necessary to elect an African-American. By merging an original dataset on state legislative elections with the most complete evaluation of the factors shaping the election of black lawmakers, our findings shed new light on minority representation and how sectional differences greatly affect the electoral success of African-Americans.
Keywords
Ever since the United States moved toward a more inclusive and democratic system of elections, the color of representation has been a major concern of American politics scholars (Whitby 1997). Particularly in the American South, 1 the end of Jim Crow and the subsequent massive re-enfranchisement of African-Americans via the 1965 Voting Rights Act (VRA) made it evident that eventually there would be many local settings where blacks would finally have the ability to elect one of their own (Bullock and Gaddie 2009; Davidson and Grofman 1994; Valelly 2004). Indeed, in the five Deep South states (Alabama, Georgia, Louisiana, Mississippi, and South Carolina) containing the region’s highest African-American populations, all of their upper and lower legislative chambers now consist of majority-black Democratic state legislative delegations that face off against much larger and almost entirely white Republican delegations controlling these legislatures (McKee and Springer 2015).
In this context, descriptive representation—meaning the election of black legislators who represent the interests of mostly African-American constituencies (Swain 1993; Tate 2003)—is a major feature of the contemporary American political landscape, especially in southern states where the black electorate is substantial. The rise in black representation, however, has raised some notable normative issues (Canon 1999), specifically in terms of party politics. The work of Epstein and O’Halloran (1999, 2000, 2006) makes it clear that with the emergence of the southern Grand Old Party (GOP), the growth in the number of majority-minority districts has come at the direct electoral expense of white Democrats, as the attendant increase in the number of neighboring majority-white districts now greatly favors Republicans (Black 1998; Hill 1995; Kousser 1999; Lamis 1999).
The crowding out of white Democrats in electoral politics would not (perhaps) be that great a concern if it did not also contribute to an overall reduction in the size of Democratic delegations. But the replacement of white Democrats with black Democrats has been anything but one-to-one (McKee 2010; Petrocik and Desposato 1998), as Republicans have been the primary beneficiaries of the increase in black representation. In many instances, packing minority voters into fewer districts has directly contributed to Republican takeovers of congressional and state legislative delegations (Hill 1995; Hood and McKee 2013), and particularly so in the South as compared with the rest of the country (Black and Black 2002). Furthermore, this partisan trade-off triggered by drawing majority-minority districts also entails a trade-off between descriptive versus substantive representation (Cameron, Epstein, and O’Halloran 1996; Epstein and O’Halloran 2006). Although there is some disagreement with respect to what substantive representation exactly encompasses and how it should be measured (see Grose 2011), it is hard to deny that white Democrats are more responsive to minority interests than are Republicans (LeVeaux Sharpe and Garand 2001, 2003; Overby and Cosgrove 1996). Hence, the overall reduction in elected white Democrats may result in the paradox of “less” representation of black interests if majority-minority districts foster Republican legislative majorities (Lublin 1997b).
We revisit the matter of majority-minority districts and black representation because several features still have not received their due. First, the extant literature is dominated by congressional analyses. Yet, because of the size of state legislative delegations and the election of hundreds more black legislators, there is considerably more analytic purchase when evaluating black representation in state legislative elections. Second, race has been and continues to be the driving factor for the election of black legislators (Grofman 2006; Lublin et al. 2009), but it is not the only factor. With this in mind, most existing scholarship fails to include many controls when assessing the likelihood of electing a black lawmaker (Lublin 1997a and Lublin et al. 2009 are exceptions). With the most comprehensive dataset on state legislative elections, we rectify concerns over underspecified models by including numerous factors that potentially affect black officeholding. Third, nearly all previous studies offer only a static snapshot of black electoral success in a given year, either immediately prior to or following a decennial redistricting. In contrast, we look dynamically at how the threshold for electing black state lawmakers may fluctuate over time.
Finally, although much of the literature on black representation makes the appropriate distinction between the Non-South and South because of sectional variation in black electoral success rates, few have taken the next step of distinguishing between Rim South and Deep South states (but see Black and Black 2002; Bullock and Gaddie 2009). As we will demonstrate, the Deep South subregion drives the disparity in the probability of electing a black legislator; in the heart of Dixie, where black populations are the greatest, it is most difficult to achieve black representation because these electorates are the most racially polarized (Black and Black 2012; Grofman 2006; Hood, Kidd, and Morris 2012; McKee and Springer 2015; Valentino and Sears 2005; White 2014).
Our study proceeds as follows. First, we document changes in the partisan profiles of state legislators and the share of black lawmakers from 1971 to 2016. Our descriptive data stress that regional (Non-South and South) and subregional (Rim South and Deep South) changes to the partisan affiliations of state legislators is the broader context in which the attainment of black representation occurs. The most telling development in black representation transpired with the Supreme Court’s ruling in the 1986 North Carolina redistricting case, Thornburg v. Gingles. In the wake of this decision, which compelled North Carolina and other states, particularly those in the South, to greatly expand their number of majority-minority districts (Cunningham 2001), there has been a marked increase in the share of black state legislators. Our data analysis begins in earnest in this post-Thornburg era of legislative politics. We offer preliminary evidence of the relationship between the electoral success of African-Americans and the black population in their state legislative districts according to where these lawmakers reside: Non-South versus South, and Rim South versus Deep South. We then move beyond these descriptive presentations to perform several multivariate analyses that model the likelihood of electing black lawmakers across regions and subregions. We conclude by discussing the important political and representational implications of our findings.
Partisan Change and Black State Legislators, 1971–2016
The basic delineation between the Non-South and South reveals some palpable differences in the party affiliations of state legislators from 1971 to 2016. Although some scholars have further subdivided regions within the Non-South (see Black and Black 2007), we adhere to the more common Non-South/South bifurcation because variation in the likelihood of achieving black representation is typically expected to be substantially different between these two major regions, not within Non-South subregions. However, because of greater racial polarization in voting patterns between the Rim and Deep South subregions, we do emphasize the significance of this division. 2
In the figures that follow, the time-series run from 1971 to 2016. As is the case for all the data presented in this section, we weight state legislative seats so that the upper chamber is proportional to the lower chamber in the computation of these partisan splits (see the online appendix for further details). Combining state house and state senate chambers, Figure 1a displays the partisan composition of the Non-South, and Figure 1b shows it for the South. In the early 1970s, the non-southern partisan split leans in favor of Democrats and then it quickly and vastly expands in a Democratic direction (the short-term advantage in the wake of Watergate is clearly evident here). After the late 1970s, there is a somewhat choppy but notable Democratic decline until the parties achieve parity in the mid-1990s. A smaller Democratic trend commenced in the mid-1990s until the sharp Republican increase in the 2010 midterm. In 2012, Democrats recovered only to see another short-term decline leaving them with just a slight majority of Non-South seats heading into 2016.
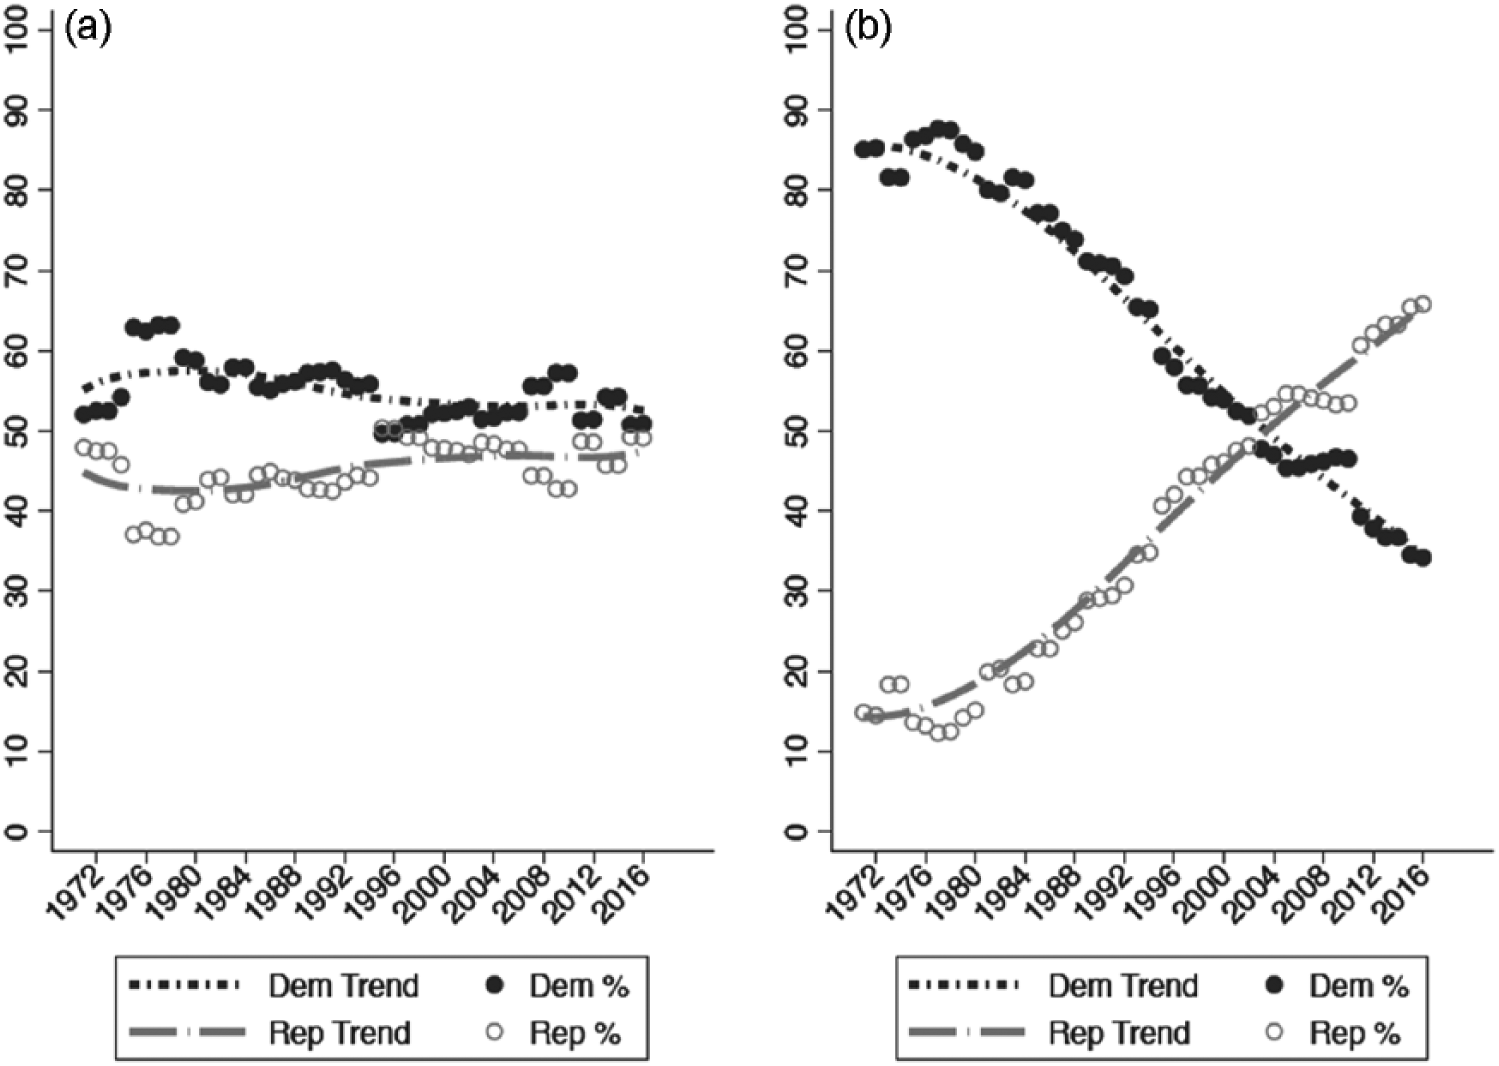
Partisan sort in the Non-South and South: (a) percent Democratic and Republican non-southern state legislators, 1971–2016 (population weighted); (b) percent Democratic and Republican southern state legislators, 1971–2016 (population weighted).
By comparison, the southern pattern is elegantly simple, depicting the decline of the Solid Democratic South and the rise of Republicans. Given the general pattern of Republican top-down advancement (Aistrup 1996), we should note that whereas the South became majority Republican in U.S. House contests in 1994, we see that the Republican state legislative majority emerges a decade later. Democrats managed to halt the Republican advance in the very electorally favorable years of 2006 and 2008, but thereafter, the GOP ascent reboots. The “southern x” pattern in Figure 1b is a common feature of the Republican electoral realignment in Dixie (Black and Black 2002); it also appears in other contexts, such as congressional delegations, statewide elective offices, and the party identification of white Southerners. Because we make no distinction here between state houses and state senates, we note that Republicans now comprise a majority in all twenty-two upper and lower state legislative chambers in the South.
The increase in black Democratic state legislators is a fundamental component of the southern partisan sort because the growth in this segment of state lawmakers effectively crowded out a large swath of white Democrats as more majority-black districts were created after the Thornburg v. Gingles (1986) decision. We display the percentage of black Democrats elected (out of all state legislators) in the Non-South and South regions (Figure 2a), and in Rim South and Deep South subregions (Figure 2b) from 1971 to 2016. With its history of severe racial discrimination, it is no surprise that in the early 1970s, black Democrats comprised a smaller share of state legislators in the South than in the Non-South (Figure 2a). Regional parity, though, is attained by the early 1980s, and henceforth, the election of black Democrats has been far more prevalent in southern states vis-à-vis the rest of the country. The widely documented increase in the creation of majority-black districts in the 1990s redistricting round is evident by the steeper growth in the percentage of black Democrats shortly after 1990. Black Democrats now comprise just under 16 percent of southern state legislative delegations, whereas they make up only 8 percent of non-Southern state legislative delegations.
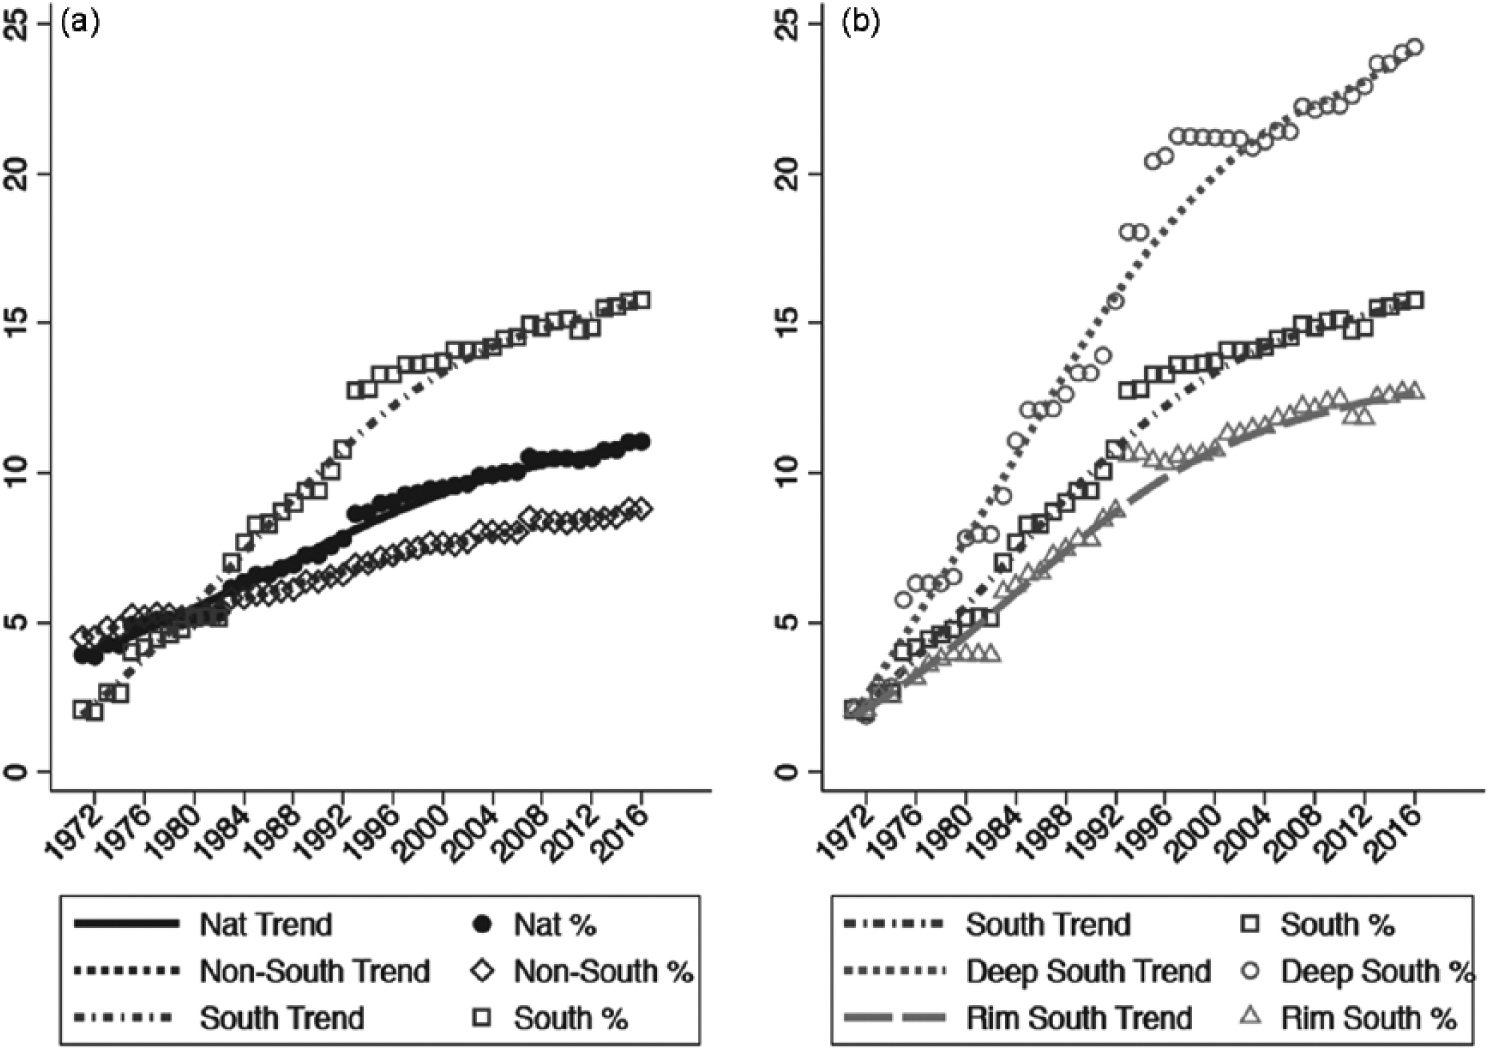
Percent state legislators who are black Democrats by national regions and South subregions: (a) percent by region, 1971–2016 (population weighted); (b) percent by South subregion, 1971–2016 (population weighted).
Figure 2b displays the percentage of all state legislators in the two southern subregions who are black Democrats, from 1971 to 2016. Figure 2b offers another visual reminder of the stark barriers that were in place forty years ago that impeded the election of African-Americans in the South. In the most heavily black region of the country, black Democrats comprised a mere 2.5 percent of the South’s state legislative delegations in the early 1970s. Over the next four decades, the Deep South states would witness the greatest increase in the election of black Democratic state lawmakers. As early as the mid-1970s, the share of black Democrats in the Deep South exceeds that of the Rim South; both groups grow at a relatively steep clip until the early 1990s when their ascent is hastened by the expansion in the number of majority-black districts. Around 1996, the rise in black Democratic lawmakers flattens out but then a slight uptick is evident in the Deep South starting in 2004. By 2016, black legislators accounted for about 12 percent of state legislative delegations in the Rim South and a much more substantial 24 percent of Deep South state legislative delegations. 3
The Importance of Southern Subregions
Unlike previous studies that limit the analysis of electing black lawmakers to a Non-South/South dichotomy, we take an additional step examining southern subregions. Until now, this further parceling of the data has been overlooked in estimating the likelihood of electing black state legislators. We stress this subregional distinction because, although the southern partisan sort manifests in both places, it is much more pronounced in the Deep South. 4 Given the Supreme Court’s 2016 decision in Cooper v. Harris that “racial considerations predominated” in North Carolina’s redistricting that created two congressional districts in excess of 50 percent black voting age population, appreciating subregional differences in the likelihood of electing African-American lawmakers in the South has taken on even greater importance. 5
Figures 3a and 3b present a graphical depiction of the southern realignment by subregion from 1971 to 2016. The distinct “southern x” pattern shows up in both regions, but in the Rim South, we find the shift in favor of the GOP occurs earlier, in the late 1990s compared with the mid-2000s in the Deep South. Democratic dominance in both subregions in 1975 is impressive, but the 95 to 5 percent Democrat-to-Republican advantage in the Deep South is a jarring reminder of the erstwhile Solid South. For Rim South legislators, the partisan sort in favor of the GOP spans a remarkable 62 percentage-point Democratic decline. By 2005, Rim South Republicans were a comfortable 57 percent majority of this subregion’s delegations, whereas Deep South Democrats were still the majority party, at 53 percent. By 2015, however, the partisan split in both subregions was practically the same: 66 percent and 64 percent Republican in the Rim and Deep South, respectively. Since 1971, the share of Deep South Republicans has increased by 59 percentage points. What makes the partisan transformation of the Deep South’s state legislative delegations most astounding is that the subregion’s black population is proportionally much larger than the Rim South’s, 6 an indication of the racial polarization among Deep South voters (Black and Black 2012).

Partisan sort for Rim South and Deep South state legislators: (a) percent Rim South Democratic and Republican state legislators, 1971–2016 (population weighted); (b) percent Deep South Democratic and Republican state legislators, 1971–2016 (population weighted).
Piecing together the findings in these sequential figures suggests that race is driving the southern partisan sort. First, southern blacks permanently realigned to the Democratic Party in 1964 (Black and Black 1987; Carmines and Stimson 1989), and, thus, the lion’s share of the southern realignment to the GOP is explained by changes in white political behavior (Abramowitz and Saunders 1998; Green, Palmquist, and Schickler 2002). This is a fact so commonly known that it hardly warrants repeating, but what is evident from these descriptive statistics is that in southern state legislative delegations, the growth in the share of black Democrats contributes to the decline in the overall number of white Democrats because the number of Republican lawmakers keeps climbing. Correlation is not causation, but the decline in the number of white Democrats and the rise in the number of black Democrats elected to office in state legislatures over the past thirty years is palpable. In the three-year initial snapshot of our dataset (1993–1995), 507 black Democrats and 3,384 white Democrats were elected to state legislatures; by the 2013–2015 time period, the number of black Democrats elected increased to 626, but a thousand fewer white Democrats (2,324) were elected. The negative correlation is stronger when limited to the South. During the first three-year snapshot (1993–1995), 281 black Democrats and 889 white Democrats were elected; by the 2013–2015 period, the number of elected black Democrats in the South increased to 337, as white Democrats plummeted to just 273, more than a threefold decline. Hand-in-hand with the partisan sort has been a racial sort. Yet, the growth in the number of black Democratic legislators is hardly a threat to the Republican majority in southern state legislatures. Indeed, Republicans’ ostensible defense of majority-minority districts—most recently in Cooper v. Harris—makes sense, as they are the net beneficiary in electoral politics (Altman and McDonald 2015; Grofman 2006; Lamis 1999).
Black Representation in the Post-Thornburg v. Gingles Era
As demonstrated in the previous section, the largest increase in the portion of African-American state legislators takes place in the early 1990s, and this surge is most pronounced in the South where a higher percentage of blacks made it relatively easier to create majority-minority districts. Although at the time, most southern state legislatures were controlled by Democratic majorities responsible for drawing the new state legislative districts (Niemi and Abramowitz 1994), in the aftermath of the Thornburg decision, the Department of Justice, in its enforcement of the Section 5 preclearance provision of the VRA, pushed most of the covered southern states to maximize their number of newly created majority-black congressional and state legislative districts (Bullock 2010; Cunningham 2001). Interestingly, although it is certainly true that the number of districts with black populations in the 30 to 50 percent range declined in the 1990s redistricting round versus the 1980s round as a direct consequence of the large increase in majority-black districts, even after this surge, the higher portion of African-Americans in the Deep South still registers in these high-minority but less than majority-minority districts. For instance, in the Deep South, where roughly one-quarter of all legislative seats have a population that is at least 50 percent black in all three time periods of our analysis—this subregion has a higher percentage of seats with at least 30 percent (but less than a majority) black population than neighboring Rim South states, and roughly five times as many as Non-South states. 7
Our data on the racial composition of state legislative districts begins in the post-Thornburg era in which we have segmented all of the subsequent analyses into three election periods: (1) 1993–1995, (2) 2003–2005, and (3) 2013–2015. We start each period with an election that follows the initial decennial redistricting cycle to avoid this substantial disruption to electoral politics. We also merge three successive elections because some states hold their legislative contests in odd years (e.g., Virginia in the odd year following a presidential year, and Louisiana and Mississippi, which hold their elections in the odd year preceding a presidential year). Finally, some states have senate contests that occur every four years (e.g., Alabama) instead of two (as is the case for house elections). By combining the data in this fashion for three separate election periods, we provide the most comprehensive empirical examination of the likelihood of electing black state legislators over time and across all American states.
Before turning to our multivariate analyses, in Table 1, we show both the mean and median district percent black, Hispanic, and Asian, for all black state legislators elected in 1993–1995, 2003–2005, and 2013–2015. This presentation further crystalizes the demographic realities associated with black representation. First, the typical black legislator, regardless of region, represents a majority-minority constituency. Second, whether it is the mean or median percent black population in the district, this statistic has declined over each election period in all three sections of the United States (Non-South, Rim South, and Deep South). No doubt, part of the reason for this downward trend in the black district population is because there has been a steady and across-the-board increase in both the mean and median percent Hispanic in districts represented by black lawmakers, and this can foster electoral coalitions. Also worth noting is that the difference in the percent black district populations is not nearly as great between the Non-South and Rim South as in either of these sections vis-à-vis the Deep South. Whether one considers the mean or the median district percent black, in the Deep South from 1993 to 2015, it is 66 % this is a much higher black district percentage than that found in districts represented by black lawmakers in the Non-South or Rim South. Finally, the Deep South is the most racially monolithic—to this day, it remains a politics of black versus white as Hispanics and Asians comprise trivial shares of these black lawmakers’ minority-district populations.
The Racial Composition of State Legislative Districts Represented by African-Americans.
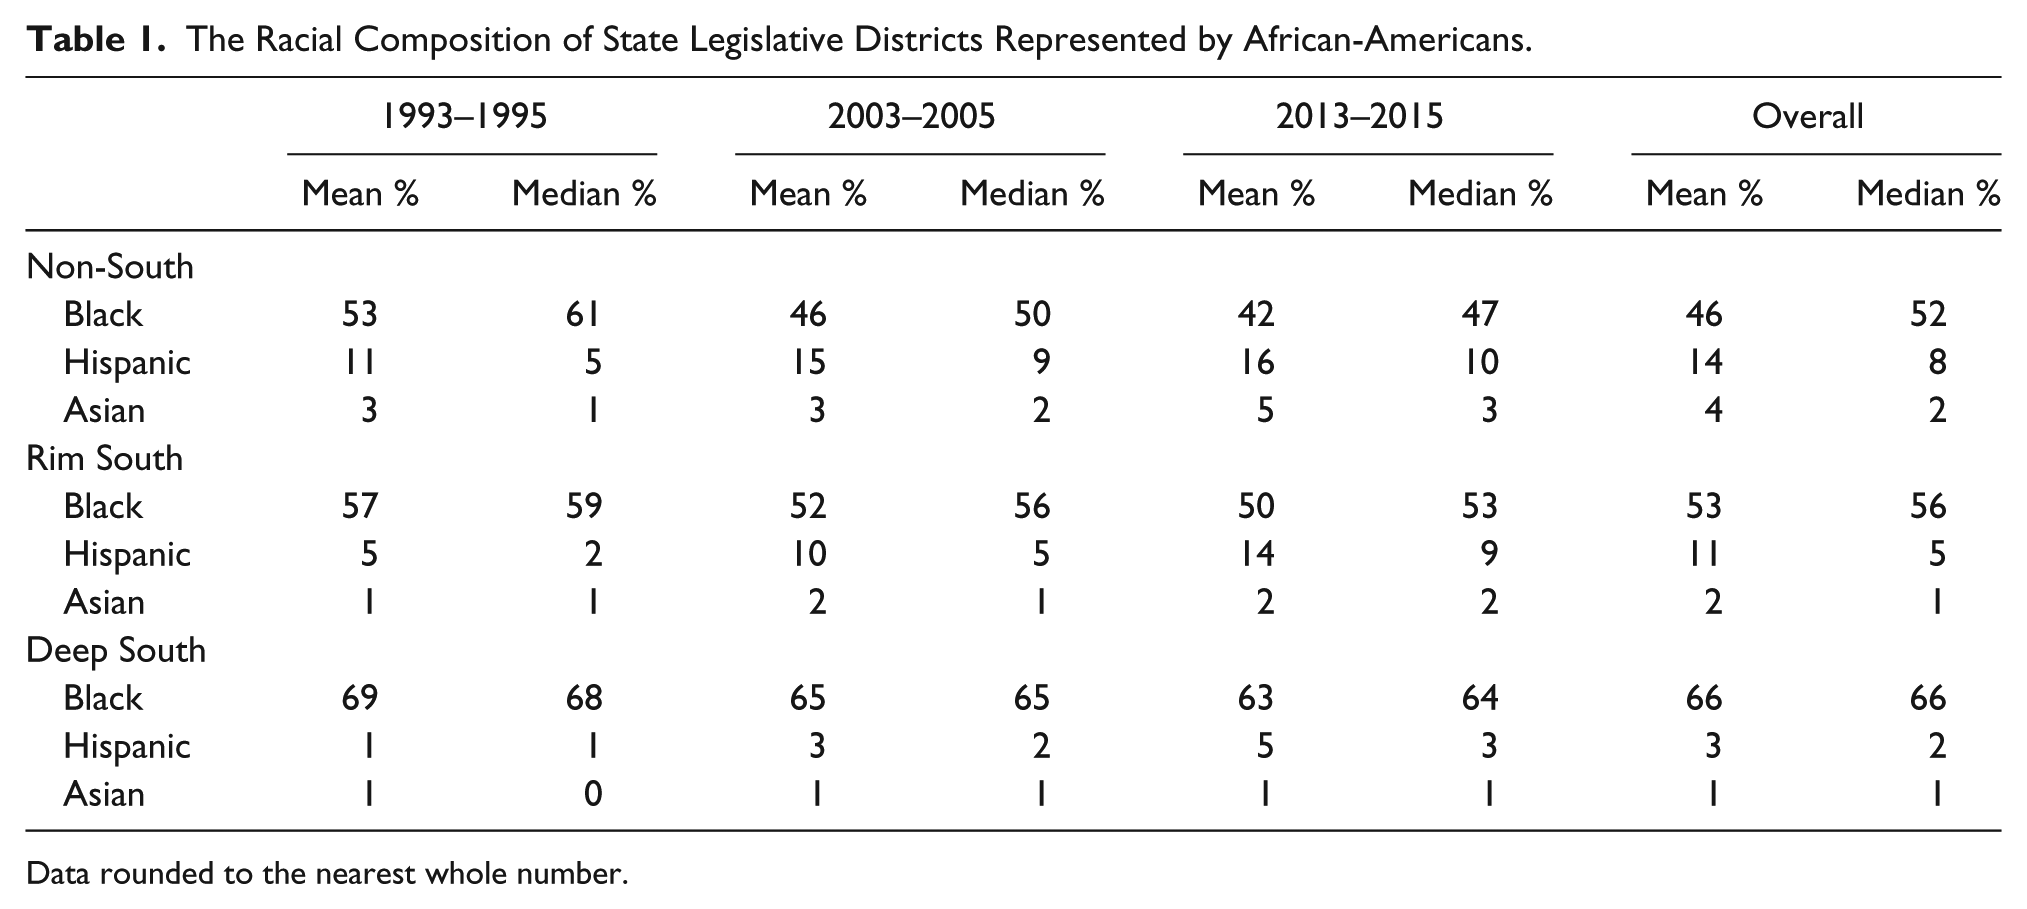
Data rounded to the nearest whole number.
Data and Method
In keeping with existing studies, we expect certain variables to significantly shape the election of black lawmakers in American state legislatures. First, and most obviously, we argue that a district’s demographic characteristics play a crucial role in determining whether an African-American is elected (Lublin 1997a, 1997b). Given persistent racial polarization in the United States, legislative districts with majority-black population should be significantly more likely to elect a black lawmaker than districts with minority-black population, other things being equal. Second, we argue that time plays an important role. In particular, we expect the black population threshold of a district necessary to elect a black lawmaker may vary over time because minority populations across the country are growing at a higher rate than white populations. 8 Third, the likelihood a district elects a black lawmaker should vary according to a district’s geographic region. We expect the likelihood a district elects a black legislator is significantly different between the South and the Non-South, and within the South, between the Deep South and the peripheral states making up the Rim South. Importantly, each of these variables interacts with the next. For example, we expect Deep South districts with populations under 50 percent black to be less likely than non-southern districts with the same demographic profile to elect a black lawmaker.
We investigate the manner in which these variables shape the election of minority lawmakers by modeling the likelihood that a district elects a black legislator dating back to 1993. Unlike previous studies, our dataset includes the election of both black and nonblack lawmakers (King-Meadows and Schaller 2006), states with less than 10 percent black population (Grofman and Handley 1989, 1991), legislative elections covering three decades, an array of covariates, and elections from both (not just a single) legislative chambers (Stephanopoulos 2016). Our data are organized as binary time-series cross-sectional. Our central dependent variable is coded 1 if a district elects a black lawmaker and 0 otherwise among all lawmakers elected in a given election cycle. The population in a given year, then, is all legislators who won their election. Although we have data on our dependent variable dating back to the 1970s, our data on districts’ racial characteristics go back to the 1990s, so the time frame for our statistical models spans 1993–2015, the post-Thornburg era. Our approach to modeling these data accounts for complications inherent in the data generation process. First, each state redistricts after each decennial Census. This means that we have to segment our data according to redistricting regimes (i.e., 1990s, 2000s, and 2010s districts). Second, districts are clustered in chambers, states, and regions, meaning our residuals are likely correlated at these levels. (See the online appendix for a note on the comprehensiveness of our dataset.)
To manage these problems, we analyze data from these three redistricting regimes separately. Our first table, for example, presents results from models of the likelihood a district elects a black lawmaker in the 1993–1995, 2003–2005, and 2013–2015 periods, respectively. We combine years that end in three with years that end in four and five to accomplish two tasks. As mentioned, unlike previous studies, our three-year cycles allow us to account for the small number of states that hold odd-year elections (e.g., Louisiana, Mississippi, New Jersey, and Virginia). Our approach also allows us to capture the likelihood a district elects an African-American early in a post-redistricting cycle.
We manage the clustered nature of our data in two ways. First, we include a fixed effect for chambers by including a dummy variable that indicates whether or not a legislator in our sample was elected to a state senate or a state house. We also include fixed effects for regions to account for systematic differences between regions, which we argue are theoretically important. We only include regions, however, that make good theoretical sense. As discussed, we expect the likelihood a district elects a black lawmaker varies between states in the Non-South, the Deep South, and the Rim South. However, we do not expect meaningful differences between Midwest, Mountains/Plains, Northeast, and Pacific Coast districts (political regions as defined by Black and Black 2007). Second, we compared these models to multilevel models with random intercepts fit to the states. Nevertheless, the multilevel models failed to improve model-fit significantly enough to warrant the more complicated inclusion of random intercepts. As the findings from these models were substantively the same, we, instead, present simple logit models.
We include a number of control variables in our models. We include a binary variable separating open seat districts from districts with an incumbent running. Open seats may provide opportunities, net of other variables, for black lawmakers to gain office. We also include a binary variable for contested elections. We define an election as contested if and only if the general election includes a Republican and a Democratic candidate. In addition, we include a binary variable for multimember districts (MMD). We restrict our definition of MMDs to include only free-for-all multimember state house and senate districts. Although some bivariate analyses suggest that MMDs dilute black votes, especially in the South (Valelly 2004, 218), we suggest following Niemi, Hill, and Grofman (1985) that the supposed negative relationship may not be so clear-cut. Finally, following Lublin (1997a) and Lublin et al. (2009), we include a control variable that captures the percentage of a district’s population that is urban. Given that black citizens are more likely to live in urban areas and because these denser settings are more Democratic (McKee and Teigen 2009), districts in which the share of the population is relatively more urban than rural should be more likely to elect black state legislators. 9
Finally, to assess the impact of racially polarized voting, we offer an additional set of models for our 2013–2015 dataset that includes estimates for the share of each district’s white population that voted for Barack Obama in 2008. Our measure of the white vote for Obama in state legislative districts is derived from Amos and McDonald (2015). 10 We include white support for Obama as a proxy for white voters’ partisanship and ideology as we suspect it may indirectly shape the likelihood a district elects a black state legislator. More important, white voting patterns serve as a crucial control variable, as regional differences in the likelihood a district elects a black lawmaker should persist even after controlling for patterns of racially polarized voting.
Black lawmakers are significantly more likely to be Democrats than Republicans (see note 3). To account for this pattern empirically, we compared our central models with an additional set of models whose dependent variable is coded 1 if a district elects a black Democrat and 0 otherwise. A few things are worth pointing out about these party-specific models. First, there are only a very small number of black Republicans elected in the years we explore in our analysis. Only fifteen of the 6,107 lawmakers elected in 1993–1995, only fourteen of the 5,978 lawmakers elected in 2003–2005, and only 21 of the 6,259 lawmakers elected in 2013–2015 were black Republicans. By comparison, of the legislators elected in 2013–2015, more than 600 were black Democrats. The rarity of districts electing black Republicans between 1993 and 2015 helps demonstrate two critical points. First, modeling the election of black Republicans is fruitless, given the lack of variation. Second, there should be few differences between the likelihood a district elects a black lawmaker and the likelihood it elects a black Democrat. Indeed, when we compare our models, the only difference is that our findings are marginally stronger when the dependent variable is confined to black Democrats. Because our coefficients are so similar, we only present the findings from models where the dependent variable is the election of a black lawmaker irrespective of their major party affiliation.
Results
We present our findings in Tables 2 and 3. The baseline models in these tables contain all of the control variables, but constrain interaction effects between region and district demographics to zero. These models reveal, net of race, that region matters substantially. According to the first column of coefficients in Table 2, the odds that a district in the Deep South elects a black lawmaker are lower by a factor of 0.55 relative to the odds a district in the Non-South elects a black legislator. The differences between the Deep South and Non-South become even more pronounced in later years as the 2003–2005 and 2013–2015 base models demonstrate.
The Likelihood a State Legislative District Elects a Black Lawmaker.
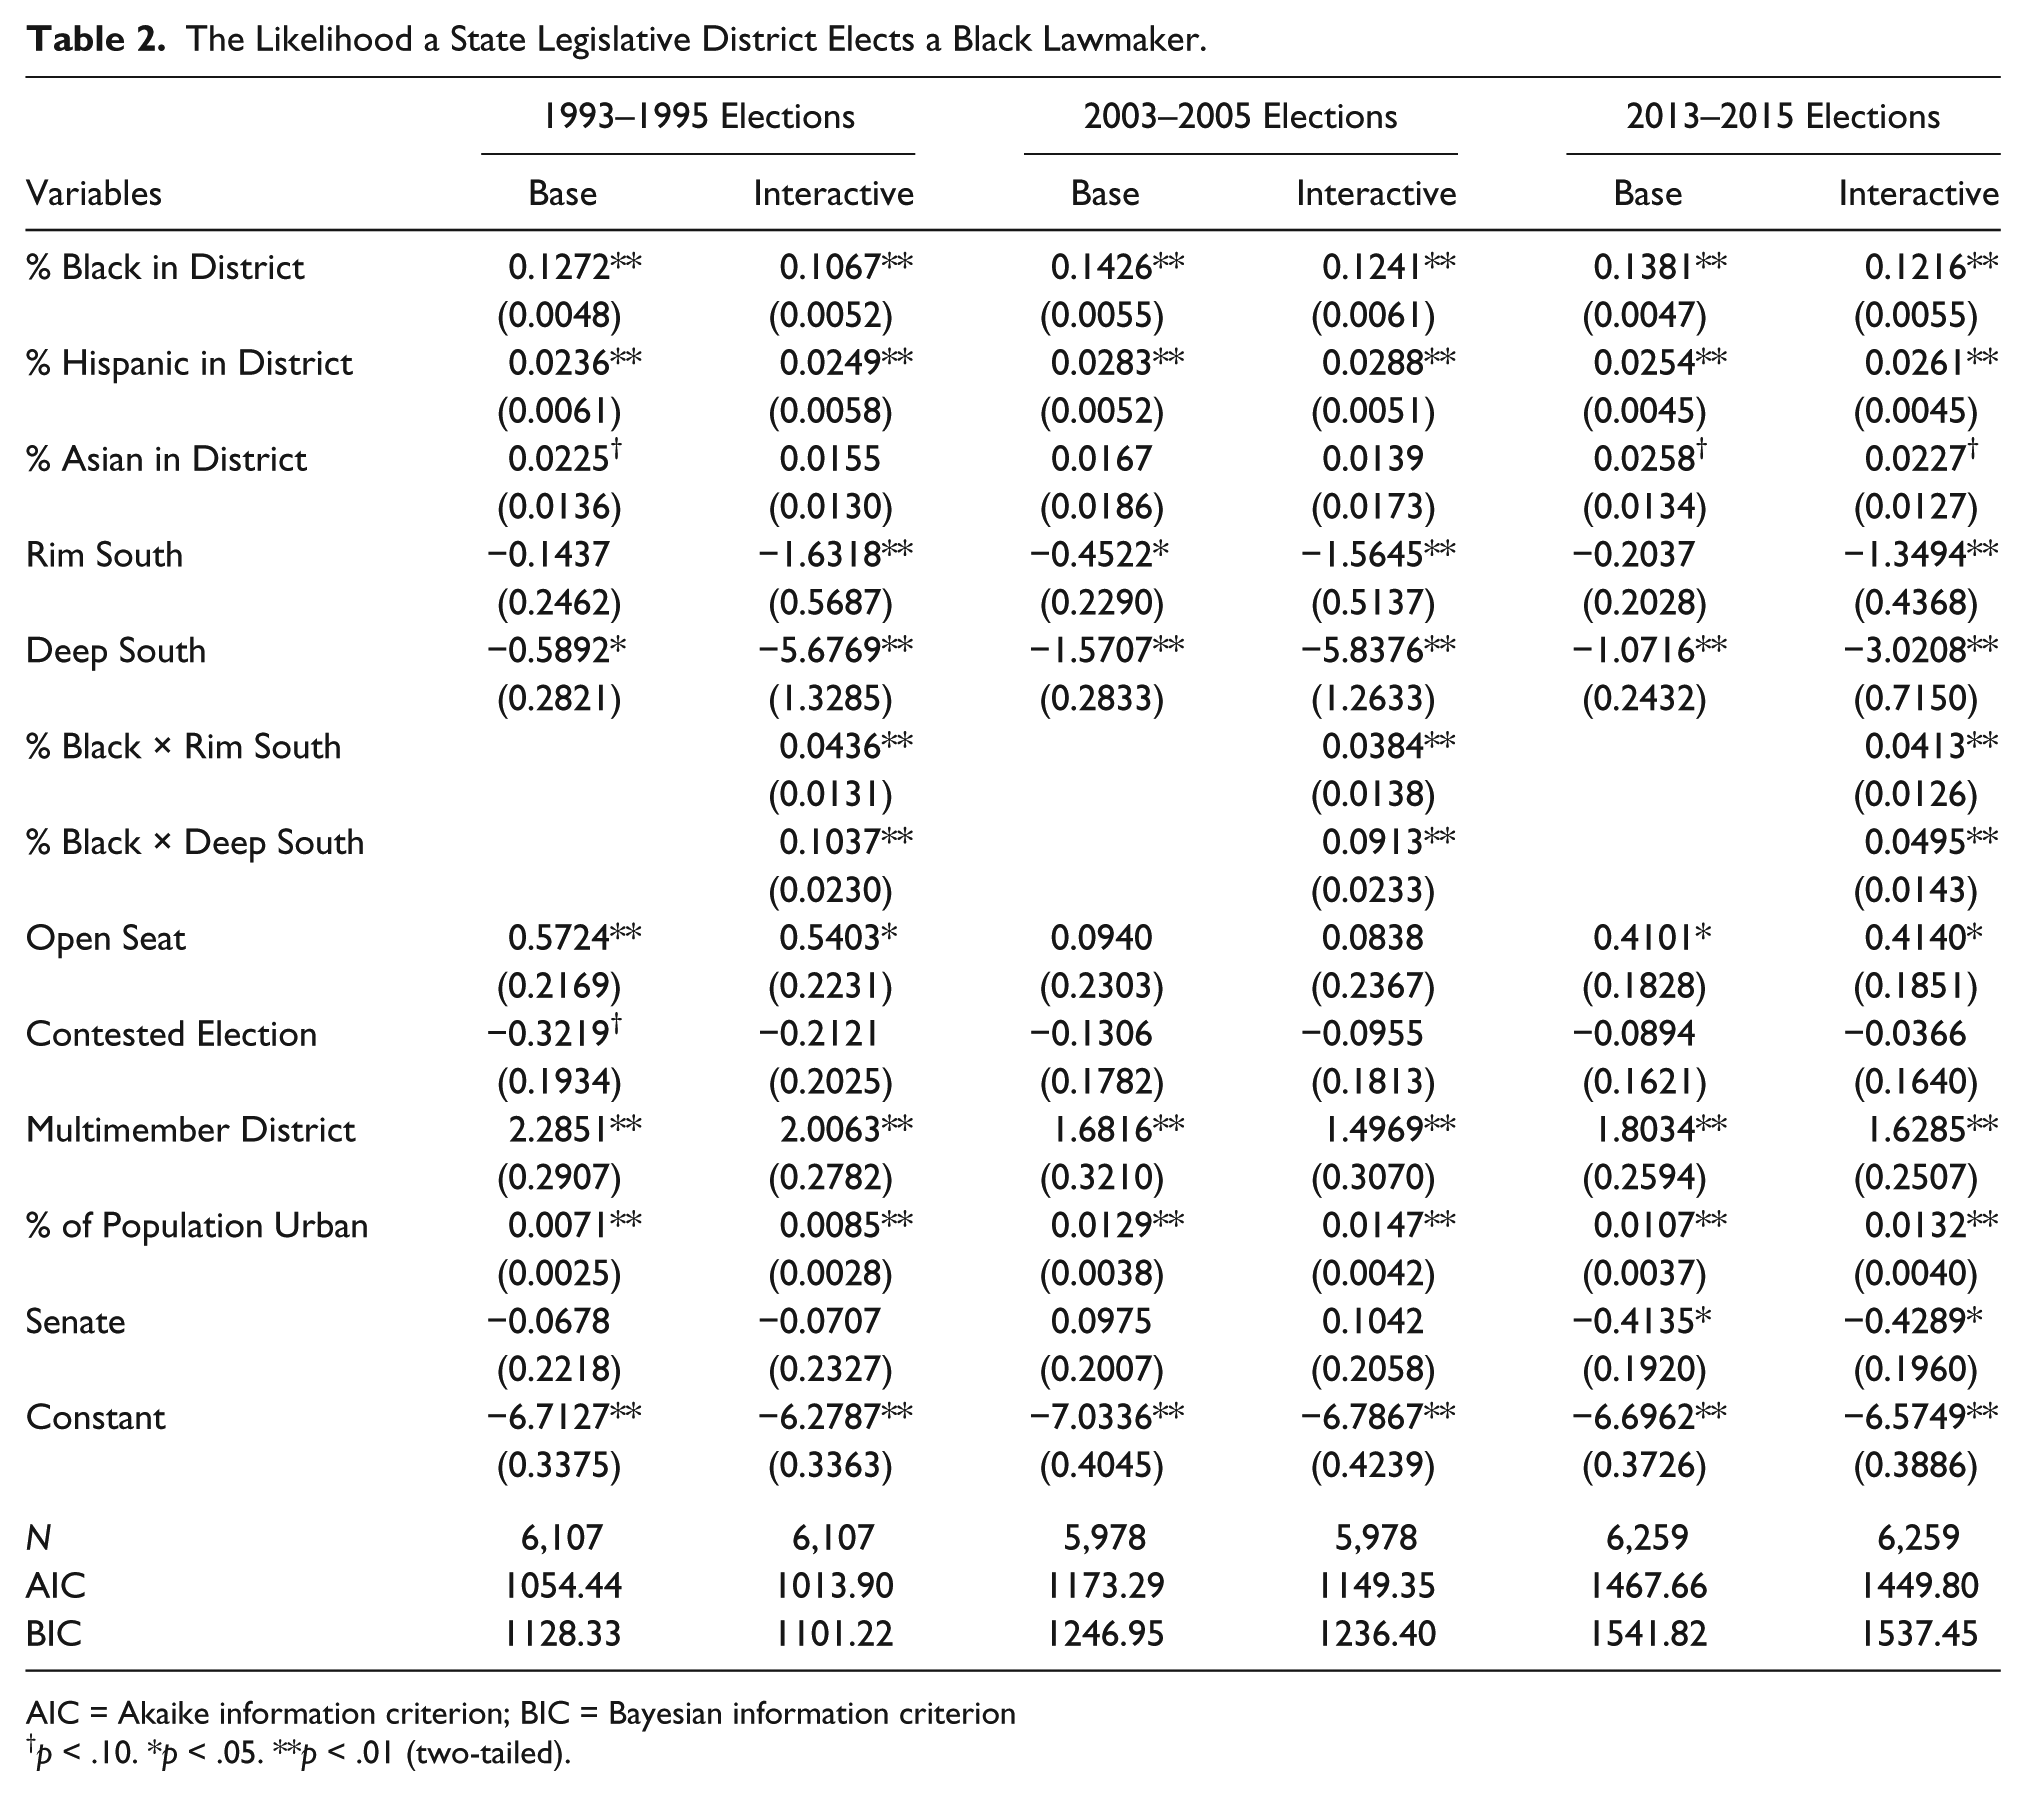
AIC = Akaike information criterion; BIC = Bayesian information criterion
p < .10. *p < .05. **p < .01 (two-tailed).
The Likelihood a Black State Legislator is Elected, Controlling for the 2008 White Vote for Obama in the District.
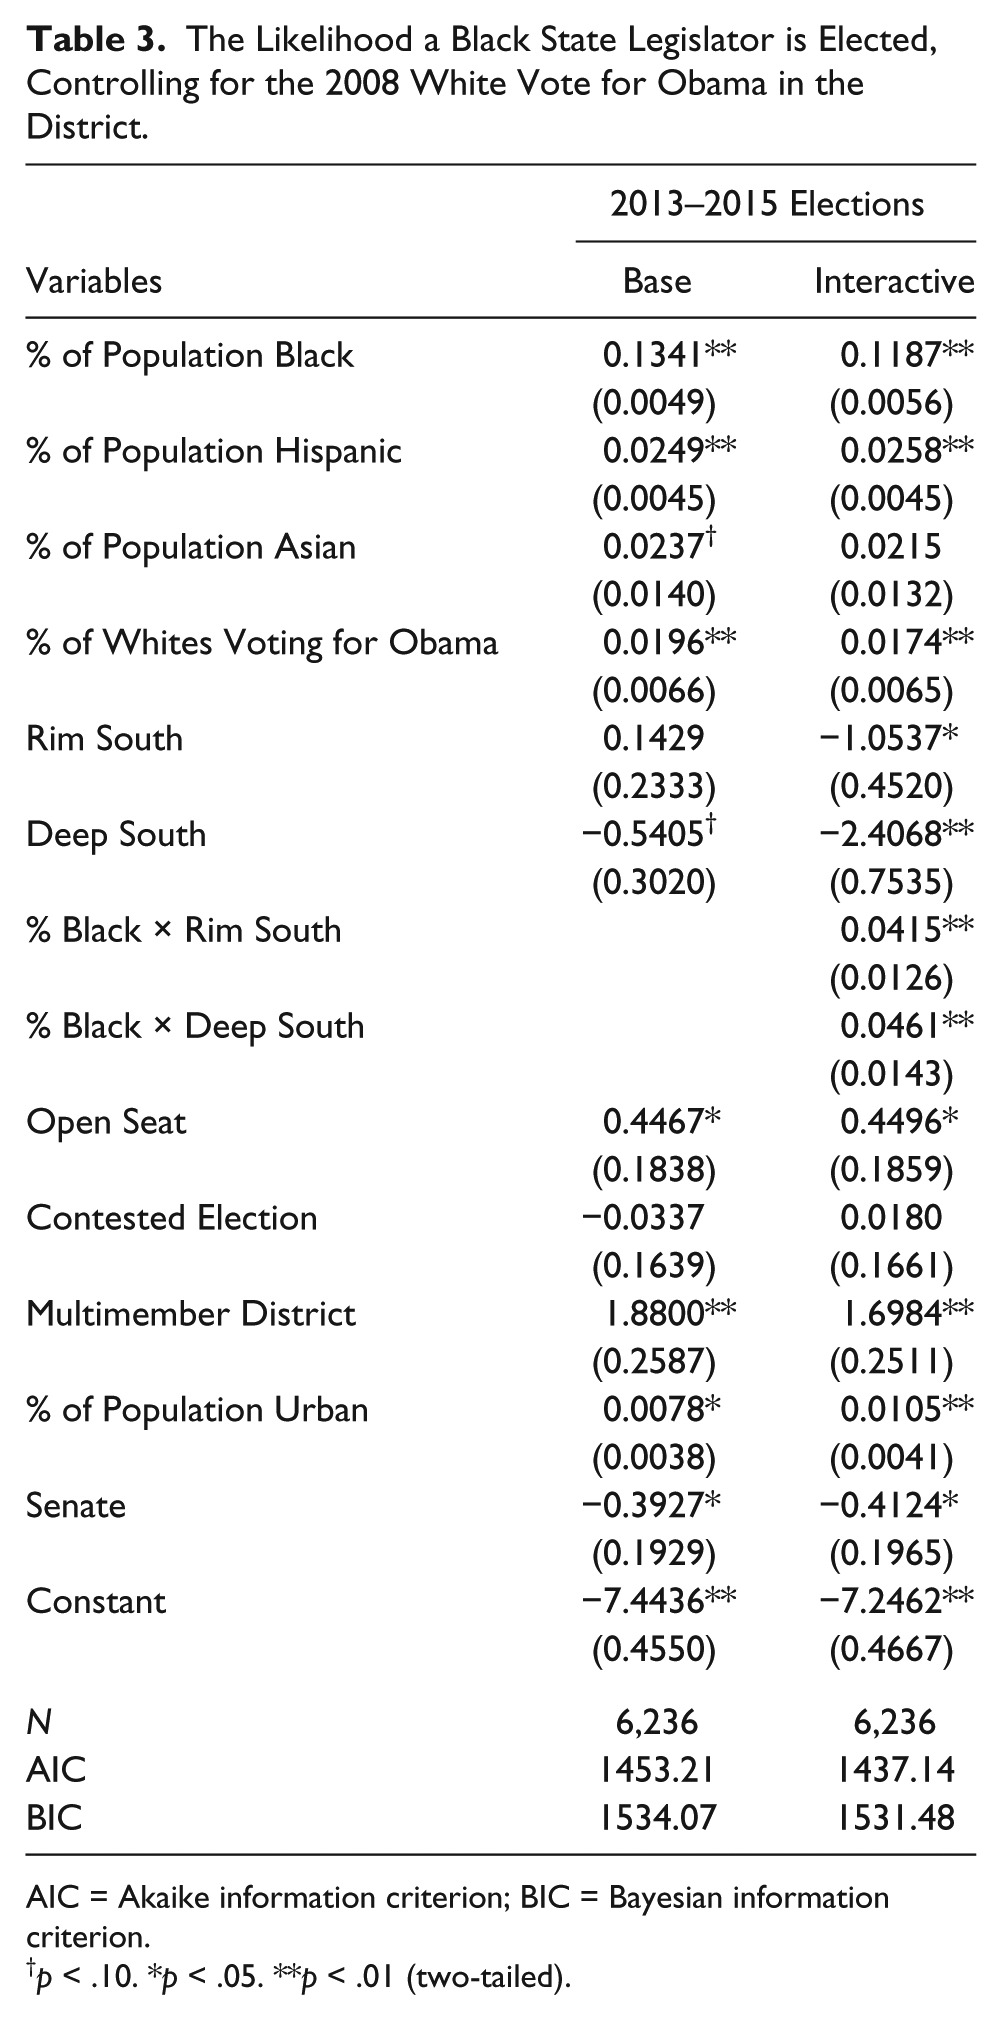
AIC = Akaike information criterion; BIC = Bayesian information criterion.
p < .10. *p < .05. **p < .01 (two-tailed).
Comparing the coefficients between our Rim South and Deep South variables is also revealing. Not only are the coefficients for Rim South insignificant in two of the three base models, meaning we cannot reject the hypothesis that the likelihood a district in the Rim South and the Non-South elect a black lawmaker is equal, but the values are also noticeably smaller than the coefficients for the Deep South variable. This provides preliminary evidence that the Deep South is decidedly different from the other two regions.
Our base models also reveal that demographics shape the election of black lawmakers. Although the size of the black population has a significant and substantive effect on the likelihood a district elects a black state legislator, we also find that this likelihood is positively associated with the size of districts’ Hispanic and Asian populations. These models imply that increases in the size of the non-white population more generally increases the likelihood districts will elect black legislators. Nevertheless, our central hypothesis is that regional differences in the likelihood a district elects a black lawmaker depend on the size of the black population. For example, we expect that the black population required for a Deep South district to elect a black lawmaker is significantly higher than the threshold in Rim South and Non-South districts. All of our interaction effects reach conventional levels of significance, which provides support for this expectation.
We present two figures to demonstrate these findings. Figure 4 plots the probability a district elects a black legislator conditional on region and the size of that district’s black population. Figure 5 plots the marginal effect, or simple-slope, of the Deep South and Rim South variables conditional on the size of a district’s black population. This graph plots, in other words, the expected difference in electing a black lawmaker between districts in Deep South states and those in Non-South states, and districts in Rim South states versus those in Non-South states, respectively.
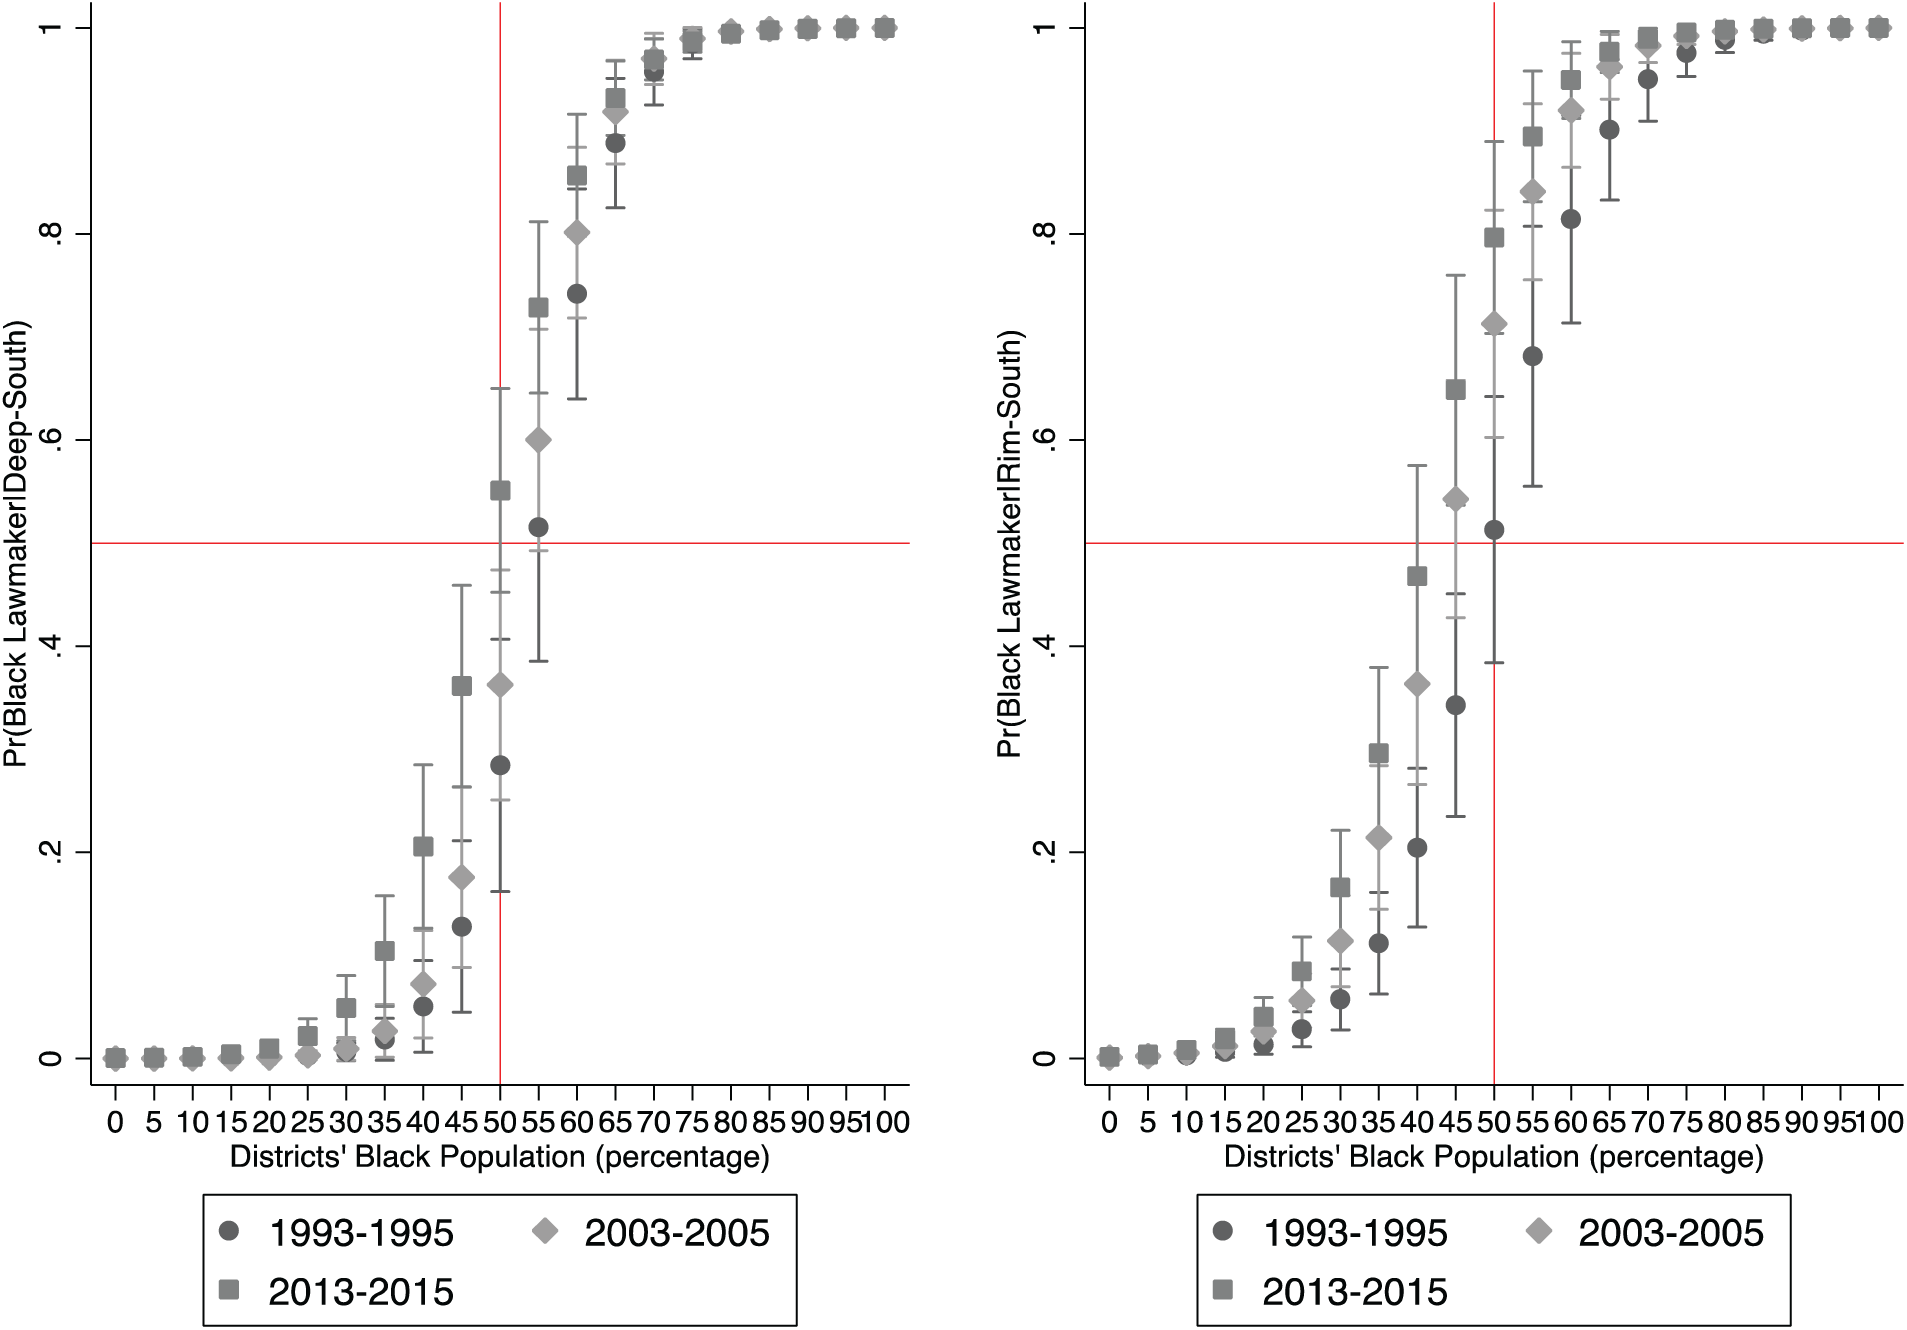
Probability a district elects an African-American lawmaker, Deep South and Rim South.
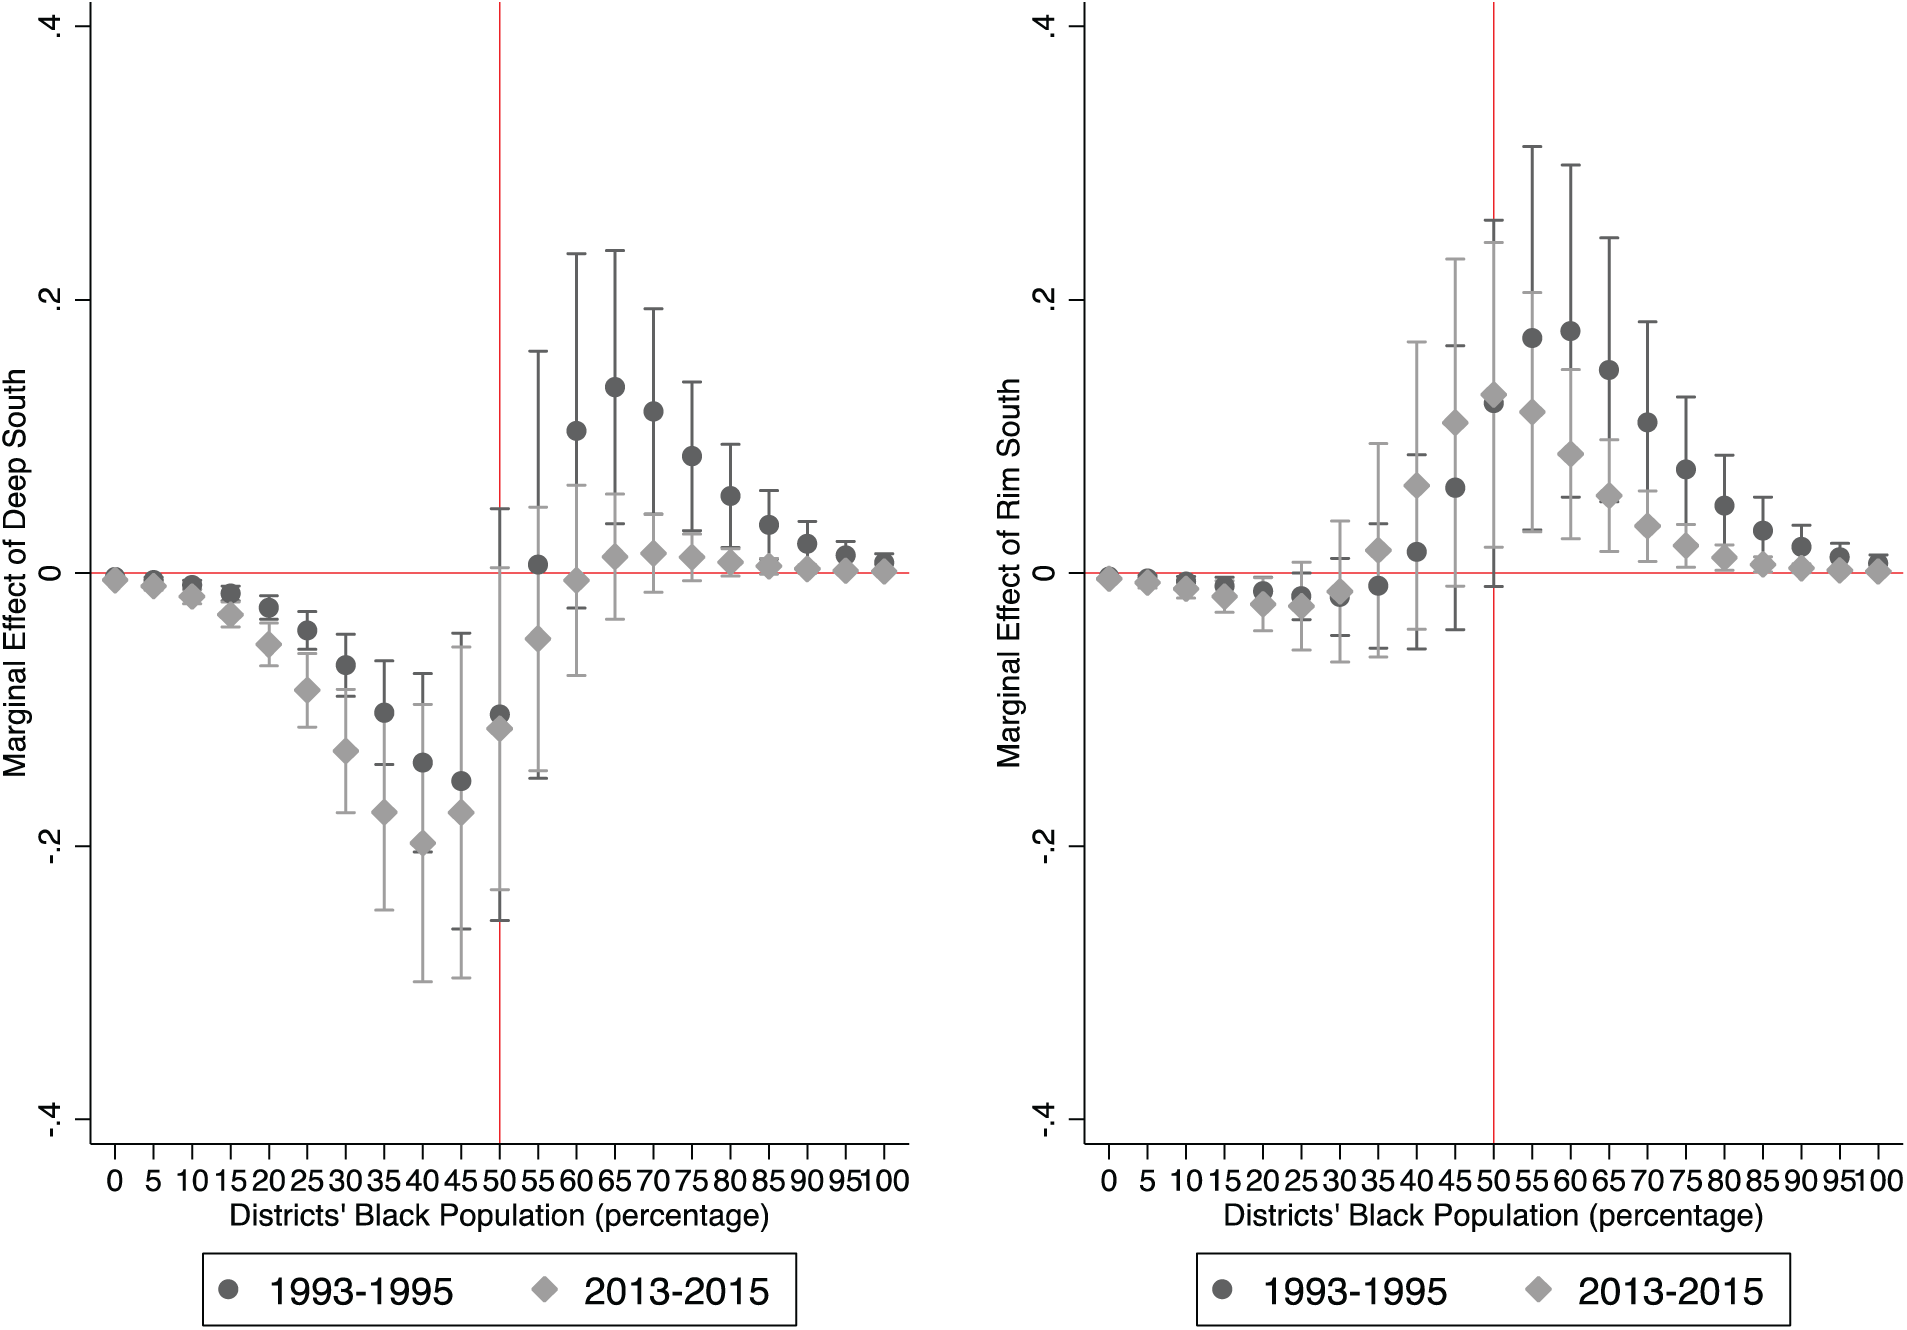
Marginal effect of the probability a district elects an African-American lawmaker, Deep South and Rim South versus Non-South.
Figure 4 plots the probability a district elects a black lawmaker in the Deep South (left panel) versus the Rim South (right panel) depending on the size of a district’s black population. This figure shows that, in each of the election periods we include, black legislators are elected with smaller black populations in the Rim South relative to the Deep South. This figure does not contain the same probability for districts in the Non-South because, as the coefficients imply, the differences are larger still. In 1993–1995, the probability that a district elects a black lawmaker reaches 0.5 (an even chance) when the black population is between 54 percent and 55 percent in the Deep South. In that same period, the probability a district elects a black legislator reaches 0.5 when the black population is between 49 percent and 50 percent in the Rim South. This 5 percentage-point difference nearly doubles in 2003–2005 (52% to 53% for the Deep South versus 43 percent to 44 percent for the Rim South) and in 2013–2015 (48% to 49% for the Deep South versus 40% to 41% for the Rim South). 11 An additional trend this figure reveals is that, in each region, the threshold required to elect a black legislator declined between 1993–1995 and 2013–2015.
Figure 5 further reveals the unambiguous regional differences in the chance of electing a black legislator in 1993–1995 and 2013–2015. It plots the marginal effect, or simple-slope of the Deep South (left panel) and Rim South (right panel) on the likelihood a district elects a black lawmaker, conditional on the size of the black population. In other words, we plot the average differences between Deep South districts and Non-South districts, and the average differences between Rim South districts and Non-South districts in these respective panels. Figure 5 illustrates that relative to Non-South districts, Deep South (left panel) districts are significantly less likely to elect a black lawmaker provided that their populations are less than 50 percent black. In fact, equivalence in the likelihood of electing a black legislator in the Deep South and Non-South only occurs in districts whose populations are above 50 percent black. However, there are noticeably fewer differences between Rim South districts and Non-South districts. Rim South districts, on average, are statistically indistinguishable from Non-South districts if their populations are under 50 percent black. A district in both 1993–1995 and 2013–2015 whose population is at least half black, however, is more likely to elect an African-American legislator in the Rim South than in the Non-South.
Our findings in reference to our control variables demonstrate a significant association between the share of a district’s population that is urban versus rural and the likelihood it elects a black legislator. In 2013–2015, for example, the probability a district whose population is entirely urban elects a black lawmaker is higher by more than 4 percentage points relative to a district whose population is entirely rural, other things being equal. We also find some limited evidence that black lawmakers are more likely to be elected in open seats. We find few consistent differences across our models in comparing senate districts with house districts, and in comparing contested elections with uncontested elections. That said, we also find strong evidence, net of other variables (including racial demographics), that multimember districts are significantly more likely to elect black lawmakers. That our models account for race is important in interpreting this finding, as many multimember districts were originally drawn to disadvantage African-Americans (Davidson and Grofman 1994).
White Obama Voters
In Table 3, we provide an additional set of models using a new variable that captures the percentage of the white vote for Barack Obama (in 2008) in each district. The inclusion of this variable, which provides an estimate of racially polarized voting in state legislative districts, is important to our analysis because it acts as a proxy for white voters’ partisanship and ideology in a district. The estimates of white support for Obama in state legislative districts, derived from Amos and McDonald (2015), indicate clear evidence of racially polarized voting. Nationwide, the estimate of white support for Obama in state legislative districts averages 42.7 percent. In Non-South state legislative districts, average white support for Obama is 47.7 % in contrast, in Rim South legislative districts, average white support for Obama is 34.3 percent, but it is only 23.4 percent in Deep South legislative districts.
Including state legislative district estimates of white support for Obama enhances our final models in Table 3 in two critical ways. First, even after controlling for white partisan voting patterns in legislative districts, the models reveal that regional differences in the likelihood that districts elect black lawmakers persist. Indeed, these models reveal the same patterns between the Non-South, Rim South, and Deep South, as we discussed above in Table 2. Given that white voting patterns in these districts correlate with white voters’ partisanship and ideology, this certainly adds to our confidence in these findings. Second, we find evidence that white voting patterns also shape the election of black lawmakers. With other variables set to their mean or modal values, adjusting our white Obama voters variable from its minimum to maximum yields a 5-percentage point difference in the likelihood a district elects a black legislator in the Non-South, from 0.08 to 0.13. This gap is smaller for districts in the Rim South (0.09 to 0.13) and Deep South (0.07 to 0.10).
Discussion and Conclusion
State legislative district lines do not draw themselves. They are crafted to further political goals while complying with legal parameters (Winburn 2008). In fact, in most scenarios, the state legislators themselves are tasked with creating their own maps (Butler and Cain 1992; McDonald 2004), and sometimes they take the lead in determining the boundaries of the very same districts in which they vie for reelection. More recently, commissions and the courts (McKenzie 2012) have played an influential role in the redistricting process of several states (Carson and Crespin 2004; Edwards et al. 2017), but no seasoned political observer would contend that electoral districts in the United States have ever been engineered and implemented behind a veil of ignorance.
Even in the first post-Thornburg round of redistricting, when Democratic-controlled southern state legislatures were compelled by the Justice Department to greatly enhance their number of majority-minority districts, they drew remarkably convoluted boundaries (see Monmonier 2001) in the hopes of minimizing the electoral cost to white Democratic incumbents (who, in many cases, were both the line drawers and the likely victims). And despite these Democrats’ best efforts, the strong prevailing Republican tides running through southern states undermined these attempts to limit the electoral damage of race-based redistricting (McKee 2010, 2013; Petrocik and Desposato 1998). In fact, so many of these Democratic-drawn maps blew up in the designers’ faces (Bullock 1995a, 1995b) that Grofman and Brunell (2005) dubbed them “dummymanders.”
Since the 1990s, both parties have a better grasp of what the implementation of majority-minority districts portends for the overall state of electoral politics. In the words of Epstein and O’Halloran (1999a), “a social science approach to race, redistricting, and representation” leads to the incontrovertible conclusion that the creation of majority-black districts places the Democratic Party at a disadvantage because few African-Americans vote for Republicans. But as we have shown with the most rigorous and comprehensive analysis of the likelihood of electing black state legislators in the three-decade post-Thornburg era, the electoral trade-off associated with furthering black representation is most severe in the Deep South. Indeed, in more recent state legislative elections, the Non-South and Rim South have become more similar in terms of the necessary threshold of black district population needed to provide an equal chance for black representation, controlling for other factors. By contrast, in the Deep South, where the sorting by race into opposing partisan camps is most extreme (Black and Black 2012; Grofman 2006; Hood, Kidd, and Morris 2012) and the presence of Hispanic and Asian voters remains trivial (see Table 1), ensuring the election of African-American lawmakers requires a much higher district percentage of black voters.
Nonetheless, disparities in the actual size of the black electorate versus the necessary size needed to achieve black representation vary considerably depending on where they are located. In some jurisdictions, like those in the Deep South, a reduction in the size of the black population in majority-minority districts could be undertaken without compromising the overall number of black state legislators as the typical black lawmaker represents a district that is about two-thirds African-American. 12 This explains why Georgia Democrats, in what would constitute their last hurrah as the majority party in the state legislature, drew districts for the 2002 election cycle that systematically reduced the number of majority-minority districts to maintain control of the Georgia General Assembly. In a 5-to-4 decision, the Supreme Court in Georgia v. Ashcroft (2003) upheld the Democratic-drawn plan but Republicans still managed to capture legislative majorities in both chambers after the 2004 elections. 13 Once again, the nature of race-based redistricting made for political theater, as Republicans vehemently “defended” the VRA—and, hence, the need to safeguard majority-black districts—while many black Democrats actually defended the reduction in black district populations because it was expected to help the Democratic Party maintain its majority status (Gaddie and Bullock 2006).
But herein lies the insoluble political dilemma of majority-minority districts and black representation. Despite conducting the most thorough analysis of the factors contributing to the attainment of black representation since the fateful Thornburg v. Gingles (1986) ruling, the weight of the evidence does nothing to resolve competing normative positions. The old adage that politics makes for strange bedfellows holds with respect to majority-minority districts and black representation. To the extent that some African-American candidates and officeholders care more about their own political careers than the fate of the Democratic Party, many will continue to align with Republicans who are more than happy to pack African-American voters into majority-black districts so that the net effect fosters GOP legislative majorities while practically guaranteeing the election of black Democrats.
In short, the creation of majority-minority districts has generated an issue that crosscuts the Democratic coalition by pitting black and white Democrats against each other. To be sure, in the aforementioned Georgia case, most black and white Democrats were united, but it is easy to find many (if not more) instances where this is not true (e.g., see Lamis 1999). 14 For example, former African-American Democratic Congresswoman Corrine Brown supported the effort by Florida Republicans to maintain her majority-black district, which snaked from Jacksonville to Orlando through disproportionately black populations. By diluting Democratic strength in surrounding districts, Brown’s district had been the key in reducing the ability of Florida Democrats to increase their total seats in the state’s U.S. House delegation (Altman and McDonald 2015). However, in 2015, following a lengthy lawsuit, the Florida Supreme Court redrew the district that she had held since 1992. 15 But who is to say that Representative Brown’s justification of her old district is indefensible? After all, there is compelling evidence that African-Americans, when given the choice, prefer descriptive representation to substantive representation (Tate 2003; see also Hayes and Hibbing 2017). Even if majority-minority districts are eliminated, if Republicans continue to control legislative majorities in the South, then why not at least further descriptive representation?
Instead of pressing our normative views regarding the broader political and representational implications of the relationship between majority-minority districts and black representation, we want to emphasize that our empirical analysis indicates an inexorable dynamic in party politics. Our findings leave no doubt that a considerable reduction in majority-minority state legislative district populations can be accomplished while safeguarding black descriptive representation. In light of the Supreme Court’s 2013 decision in Shelby County v. Holder, which scrapped the federal enforcement of the Section 5 preclearance provision of the VRA, it necessarily follows that in the next decennial round of redistricting, most Democrats will push for a reduction in the size of black populations in majority-minority districts, while most Republicans will insist that majority-black districts should remain as is, or better yet, contain even higher black populations.
Footnotes
Declaration of Conflicting Interests
The author(s) declared no potential conflicts of interest with respect to the research, authorship, and/or publication of this article.
Funding
The author(s) received no financial support for the research, authorship, and/or publication of this article.
Supplemental Material
Notes
References
Supplementary Material
Please find the following supplemental material available below.
For Open Access articles published under a Creative Commons License, all supplemental material carries the same license as the article it is associated with.
For non-Open Access articles published, all supplemental material carries a non-exclusive license, and permission requests for re-use of supplemental material or any part of supplemental material shall be sent directly to the copyright owner as specified in the copyright notice associated with the article.