






Abstract
This study examined the measurement invariance (MI) of the Planning for Career and Family Scale (PLAN; Ganginis Del Pino et al., 2013), originally developed to assess career and family planning decisions for women college students, across a diverse sample of engineering students. Using Confirmatory Factor Analysis (CFA) with a sample of 1,454 engineering students, the PLAN scale was refined from 24 to 21 items by removing three cross-loading items. Subsequent testing of one-factor, two-factor, and bifactor structural models suggested that the bifactor model fits best to the data, aligning with existing literature, and thus was used as the baseline model for subsequent MI testing. We used two methods to test the MI of the 21-item bifactor PLAN model across gender, race/ethnicity, intersections of gender and race/ethnicity, and academic years. Results of the two methods revealed mixed results on the levels of invariance, with scalar invariance across academic years supported by one method. Latent mean comparisons indicated significant differences in career and family planning intentions between sophomores and seniors. These findings validate the PLAN scale’s applicability across diverse student groups, emphasizing its utility in informing educational policies and programs tailored to support varied career and family planning needs among engineering students.
Keywords
Considering future family when making career plans is defined as “the degree to which an individual is willing to consider (and compromise career plans for) a future romantic partner or children” (Ganginis Del Pino et al., 2013). This process of selecting and eliminating potential careers based on social roles is grounded in Career Compromise Theory (Gottfredson, 1981), which posits that individuals adjust their career preferences by circumscribing options that are perceived as incompatible with their social roles and compromising to accommodate external constraints, such as family expectations or societal norms. Empirical research has largely validated these theoretical hypotheses, while also highlighting nuances and differences among students with diverse identities and backgrounds (Creed & Blume, 2013; Flores et al., 2014; Junk & Armstrong, 2010; Lent et al., 2013, 2015; Navarro et al., 2014, 2019). To measure this construct of considering future family when making career plans, the Planning for Career and Family Scale (PLAN) was developed by Ganginis Del Pino et al. (2013). This scale includes two key dimensions: willingness to plan for children and willingness to plan for a partner, both of which reflect how individuals prioritize or adjust their career goals in the context of potential family responsibilities.
The PLAN scale was initially developed and validated among women, based on the assumption that future family considerations play a particularly salient role in heterosexual women’s career decision-making (Eccles, 2009) and their concentration on female-dominated fields (Abele & Spurk, 2011). Using two samples of predominantly White women college students, researchers developed and validated a bifactor 24-item scale with one general factor (i.e., Planning for Career and Family) and two subdomains (e.g., Planning for Children and Planning for Partner). The PLAN scale has been increasingly used in research to assess individual’s willingness to consider children and partners when making career decisions. Research utilizing the PLAN scale has demonstrated its relevance in career decision-making. For example, a study on leadership aspiration among female doctoral students found that the willingness to compromise career for children significantly predicted leadership aspirations among a group of female graduate students in clinical and counseling psychology (Gregor & O’Brown, 2015). Another study with a diverse sample of community college student found that willingness to compromise career for a partner uniquely predicted achievement and educational aspirations (Gregor et al., 2020). Furthermore, PLAN scale scores have been significantly associated with other career-related variables, such as perceived work-family conflict and career decision self-efficacy. (Gregor & O’Brien, 2015, 2016; Gregor et al., 2020; Lee & Wessel, 2022; Savela & O’Brien, 2016).
While planning for a future family has been shown to significantly influence women’s career decisions and their preference for female-dominated fields, it is also a broadly relevant factor across gender identities and career domains. Research in career decision-making and work-life balance suggests that considerations of family responsibilities is relevant across gender identities (De Hauw & Greenhaus, 2015; Scarborough et al., 2019; Tan-Wilson & Stamp, 2015; Yogman & Garfield, 2016). Although many studies have identified significant gender differences—women are more likely than men to prioritize family over career and report greater work-family conflict (Abele & Spurk, 2011; Ferriman et a., 2009; Sáinz et al., 2020)—emerging research suggests a shifting dynamic. Younger men now value family as much as their careers (Radcliffe Public Policy Center, 2000), and men and women make career sacrifices (e.g., refusing overtime or turning down promotions to accommodate family responsibilities) at comparable rates (Milkie & Peltola, 1999). Additionally, family considerations have been identified as a key factor in career choices in male-dominated fields, such as Science, Technology, Engineering, and Mathematics (STEM) fields. For example, studies on STEM education found the desire for a future family life or for family-flexible professions is one of the reasons for gender gaps in selection of science and engineering majors (Frome et al., 2006). High school students, particularly females, cited reasons of not choosing male-dominated major due to concerns about the fields’ demanding nature and the potential conflicts with family roles (Farmer, 1997; Legewie & DiPrete, 2014; Novakovic & Fouad, 2013; Sáinz et al., 2020). Similarly, students in STEM fields may switch majors or opt for non-STEM careers to prioritize family responsibilities (Buse et al., 2013; Diekman et al., 2010; Fouad et al., 2017). Sonnert and Holton (1995) points out that successful female scientists often did not have children, suggesting that the challenges of balancing family life with a career in male-dominated fields like STEM may deter some women from pursuing or remaining in these professions. Given its wide applicability, examining how planning for a future family influence career choices in male-dominated fields like STEM could provide valuable insights into addressing disparities and the underrepresentation of gender and racial/ethnic minorities in these fields.
Despite the broad applicability of the concept and the development of the PLAN measure, it remains unclear whether this tool accurately captures the concept of planning for a future family across diverse sociodemographic groups. Establishing measurement invariance (MI) is crucial, as it is necessary for making valid comparisons of this concept across different groups (Chen et al., 2020). Addressing this gap is particularly important for underrepresented populations in male-dominated fields like engineering, where cultural, societal, and academic barriers complicate career and family planning decisions. To address this gap, the present study examines the MI of the PLAN scale among college engineering students, a field where women and racial/ethnic minorities remain significantly underrepresented.
Family Considerations in Engineering Careers: Race/Ethnicity, Gender, and College Years
Cultural norms often shape career and family planning in distinct ways across different racial/ethnic groups. Family considerations, particularly those related to children and partners, are critical in career decision-making, especially for Latinx individuals, as Latinx culture places strong emphasis on familia and family responsibilities (Fouad & Byars-Winston, 2005; López et al., 2019; Ojeda et al., 2011). These cultural factors may lead to unique challenges in STEM fields, where career demands are often perceived as conflict with traditional family roles (Bravo & Stephens, 2023). In contrast, White students may encounter fewer cultural pressures around family responsibilities or different societal expectations regarding balancing work and family life. Given the distinct cultural and societal expectations Latinx students face, compared to their White peers, examining the MI of the PLAN scale across these groups offers valuable insights into how family considerations influence career choices in engineering. This is particularly relevant in engineering, a field where Latinx students remain underrepresented, and understanding these dynamics could help mitigate disparities in engineering education and career advancement.
For women, consideration of future family responsibilities plays a key role in pursuing a career in male-dominated fields like engineering. Gottfredson’s (1981) Career Compromise Theory suggests that children begin selecting and eliminating potential careers based on societal perceptions of gender-appropriate roles. Consequently, girls often exclude male-dominated fields, such as engineering, from their career aspirations. Gender role socialization theories further highlight the traditional expectation for women to prioritize supporting their husband’s career and caring for children (Betz, 2008; Eccles, 2009). In heterosexual relationships, women’s careers are often deprioritized in favor of their male partners’ careers (Eby et al., 2005), while they continue to bear the primary responsibility for childcare and household duties (Sayer & Fine, 2011). Women in engineering, particularly during college, face the challenge of balancing future family responsibilities with the demanding nature of the field (Frome et al., 2006). Studies show that women who leave engineering often cite family concerns as a significant factor in their decision (Fouad et al., 2016; Jean et al., 2015). Given these gendered dynamics, it is essential to examine how family considerations are reflected in career decision-making across gender. This is particularly relevant for understanding how the PLAN scale, which captures the willingness to plan for future family responsibilities, functions across male and female students in engineering. Investigating the MI of the PLAN scale between women and men will provide valuable insights into whether and how family considerations influence career choices differently across gender, helping to address gender disparities in engineering.
The intersection of gender and cultural expectations significantly influences career decision-making and aspirations in engineering. Disparities in STEM career aspirations emerge early. Saw et al. (2018) found that female, Black, Hispanic, and low-SES students were less likely to develop or sustain STEM interest throughout high school. Compared to White boys from higher-SES backgrounds, girls across all racial/ethnic and SES groups, as well as Black and Hispanic boys from lower-SES backgrounds, exhibited consistently lower levels of STEM interest, persistence, and career aspirations over time. In science and engineering academia, intersecting disadvantages related to race/ethnicity and gender accumulate, with women of color reporting compounded challenges that shape their academic and career trajectories (Kachchaf et al., 2015). Similarly, Latina women navigate the intersecting cultural and gendered expectations of family caregiving, often experiencing tension between familial responsibilities and the demands of an engineering career (Brito, 2023; Kachchaf et al., 2015). These challenges shape their career aspirations and trajectories in distinct ways compared to their White peers and Latino men (Dewsbury et al., 2019; Sparks et al., 2023). Theses disparities highlight the need to examine how gender and race/ethnicity intersect in engineering career decision-making. The current study aims to assess the MI of the PLAN scale across the intersection of gender (men vs. women) and race/ethnicity (White vs. Latinx) groups, ensuring that observed differences in family considerations reflect true group differences rather than measurement bias.
The college years are a critical period for shaping career aspirations and family planning decisions. According to Gottfredson’s theory, college students make career compromises by weighing external barriers (e.g., lack of support, work-family conflict) alongside internal reflections (e.g., personal values) (Gottfredson, 1981; Junk & Armstrong, 2010; Tsaousides & Jome, 2008; Wee, 2014). Research on anticipated career-family conflict has long focused on this life period, as it is a time when students prepare to launch careers, build long-term romantic relationships, and coordinate dual-career demands (Barnett et al., 2003; Cinamon, 2006; Gaffey & Rottinghaus, 2009; Westring & Ryan, 2011). By senior year, anticipated work-family conflict becomes particularly salient in career decision-making (Barnett et al., 2003; Gregor & O’Brien, 2015). Similarly, in the STEM fields, student’s persistence intentions and career aspirations may change during college (Chen, 2015; Flores et al., 2021; Price, 2010), and as they approach graduation (Jelks & Crain, 2020; Kim & Beier, 2020), influenced by social pressures and evolving life circumstances. Those underscore the importance of understanding how career and family priorities shift during college. To accurately assess this concept and how it evolves in college, it is essential to establish MI for the relevant tools. This study, therefore, aims to examine the MI of the PLAN scale across college students at different stages of their college years to understand how may career aspirations and family planning decisions evolve over time.
Examining Measurement Invariance with Ordered-Categorical Data
Measurement invariance assesses the psychometric equivalence of a construct across groups (or across time). Establishing measurement invariance is crucial as it serves as the basis of meaningful and unbiased comparison and ensures that any observed differences in scores are due to actual differences in the constructs being measured rather than biases in the measurement tool itself. Measurement invariance testing generally involves setting cross-group constraints from a less restricted to a more restricted model and examining changes in model fit indices to evaluate invariance hypotheses (Putnick & Bornstein, 2016; Vandenberg & Lance, 2000).
Establishing Baseline Model for MI
The foundational step in MI testing is the establishment of a baseline model. The baseline model is typically established through confirmatory factor analysis (CFA), conducted separately for each group of interest. This process involves specifying the measurement structure of the construct—defining the relationships between observed items and their underlying latent factors—and testing whether the specified model fits the data within each group. The baseline model ensures that the construct is valid and well-defined for each group independently, providing a crucial foundation for further cross-group comparisons (Putnick & Bornstein, 2016; Vandenberg & Lance, 2000).
A well-fitting baseline model is characterized by adequate goodness-of-fit indices, such as the Comparative Fit Index (CFI), Tucker-Lewis Index (TLI), Root Mean Square Error of Approximation (RMSEA), and Standardized Root Mean Square Residual (SRMR). Common thresholds for determining model fit include CFI and TLI ≥.95, RMSEA and SRMR ≤.06, for excellent fit, and CFI and TLI ≥.90, and RMSEA and SRMR ≤.08 as adequate fit (Hu & Bentler, 1999). If the baseline model does not meet these thresholds, researchers may refine it by examining modification indices to identify sources of misfit, such as poorly performing items or cross-loadings (Luong & Flake, 2023; Schmitt & Kuljanin, 2008). Once a valid baseline model is established, it provides a shared framework for subsequent MI testing, ensuring that observed differences between groups are not artifacts of poor model specification.
Two Methods for Testing MI with Ordered-Categorical Data
A traditional approach to testing measurement invariance is through multigroup confirmatory factor analysis (MGCFA) (Bowen & Masa, 2015; Luong & Flake, 2023; Schmitt & Kuljanin, 2008). MGCFA is a robust method commonly employed to assess invariance hypotheses by imposing progressively stringent cross-group constraints (Dimitrov, 2010). This analysis typically begins with the establishment of Configural (same item loads on the same factors across groups) invariance, followed by tests for Metric invariance (equal loadings), Scalar invariance (equal intercepts), and Strict invariance (equal residual). Strict invariance is not considered necessary for most practice and research purposes, so researchers do not usually proceed to this step (Byrne & Stewart, 2006; Schmitt & Kuljanin, 2008; Widaman & Reise, 1997).
However, researchers have noted limitations of the traditional method when applying to ordered-categorical data. Wu and Estabrook (2016) argued that the effectiveness of traditional invariance testing hinges critically on how the baseline model is defined, particularly in relation to the scaling of latent continuous responses. This dependency can affect both the parameter constraints applied and the resulting conclusions about invariance. They suggested that the traditional sequence of testing might lead to misleading results. To address these concerns, they propose a revised approach: after confirming configural invariance, researchers should test Threshold invariance before examining Metric invariance. This revised sequence aims to provide a more accurate assessment of invariance across groups, particularly when dealing with ordered-categorical data.
The traditional method is well-established but may not fully account for threshold differences in ordinal data, while Wu and Estabrook’s (2016) approach, designed for ordinal data, lacks extensive validation. Despite the widespread use of the traditional method and the suggestion to use the revised approach for addressing scaling issues in ordinal data, neither method has emerged as definitively superior. Given the lack of consensus on which method is more optimal, this study employs both methods and compares their results to provide a practical comparison.
Present Study
The present study examines the measurement invariance of the Planning for Career and Family Scale (PLAN) in a diverse sample of college students majoring in engineering. Specifically, this study evaluates whether the PLAN scale operates equivalently among engineering college students across gender (women vs. men), race/ethnicity (Latinx vs. White), their intersection, and academic year (first-year through fourth-year students). To address limitations in traditional MI testing for ordered-categorical data, the study employs two approaches: the traditional MGCFA method and the revised method proposed by Wu and Estabrook (2016), which includes threshold invariance testing. Through rigorous MI testing and direct comparison of traditional and revised methods, this study provides valuable insights into the applicability of the PLAN scale across diverse demographic groups, with implications for both research and practice in STEM education and career development.
Method
Participants
Participants consisted of 1,454 engineering students from U.S. institutions, including Hispanic-Serving Institutions (HSIs; n = 610, 41.9%) and Predominantly White Institutions (PWIs; n = 844, 58.1%). For measurement invariance tests across gender, race/ethnicity, and academic year, we excluded groups with insufficient sample sizes, resulting in final sample sizes of 1,449 for gender, 1,428 for race/ethnicity, and 1,441 for academic year analyses. Additionally, we analyzed the intersection of gender and race/ethnicity with a final sample size of 1,423, distributed as follows: 480 Latinx men, 337 White women, 323 Latinx women, and 283 White men.
The age range of the sample was 18–33 years, with a mean age of 21.0 and a standard deviation of 4.1. The demographic breakdown of the participants was as follows: 772 (53.1%) identified as men, 677 (46.6%) as women, and 5 (0.3%) as other. Ethnically, 804 (55.3%) identified as Latinx, 624 (42.9%) as White, and 26 (1.8%) as multiracial or other. Academic distribution included 320 (22.0%) first-year students, 351 (24.1%) sophomores, 422 (29.0%) juniors, and 348 (24.9%) seniors. The most frequently reported majors were mechanical engineering (n = 324, 22.3%), computer engineering (n = 245, 16.9%), civil engineering (n = 230, 15.8%), electrical engineering (n = 183, 12.6%), bio-medical engineering (n = 157, 10.8%), chemical engineering (n = 101, 6.9%), industrial engineering (n = 74, 5.1%), and aerospace engineering (n = 49, 3.4%).
Measures
Planning for Career and Family Scale (PLAN)
The 24-item Planning for Career and Family Scale (Ganginis Del Pino et al., 2013) was developed to assess one’s willingness to consider future children and romantic partners when planning for a career. The original study evaluated the PLAN measure’s factor structure and psychometric properties through two independent factor-analytic studies involving a total of 726 college women. Predominantly, research employing the PLAN measure has focused on women college students (Ganginis Del Pino et al., 2013; Gregor & O’Brien, 2015, 2016; Lee & Wessel, 2022; Savela & O’Brien, 2016). Notably, one study extended its application to a community college sample (Gregor et al., 2020); however, the gender demographics of this group were unable to be obtained due to a data collection error.
Participants rated each item using a 4-point scale ranging from 1 (strongly disagree) to 4 (strongly agree) with higher scores representing a stronger willingness to consider future children and romantic partners in career planning. Sample items included “I will find a career where I do not have to work full time after I have children” and “When selecting a career, I will consider the needs of my partner.” Nine of the twenty-four items are reverse coded.
Prior studies reported adequate internal consistency ranging from .89 to .95 (Gregor & O’Brien, 2015, 2016; Gregor et al., 2020; Lee & Wessel, 2022; Savela & O’Brien, 2016). Structural validity has been supported through confirmatory factor analysis (Ganginis Del Pino et al., 2013). Convergent and construct validity have been supported through negative correlations with measures of achievement and educational aspirations (Gregor et al., 2020), leadership aspiration (Gregor & O’Brien, 2015), career orientation, and work role salience (Ganginis Del Pino et al., 2013; Gregor & O'Brien, 2016). A bifactor model was found to best represent the structure of the PLAN, suggesting that PLAN items all share common variance (Planning for Career and Family) and that subsets of items share common variance (Planning for Children or Planning for Partner) that is unique to the general factor.
Demographic Questionnaire
A demographic questionnaire obtained information regarding participants’ age, gender, race/ethnicity, year in school, institution type, and major.
Procedures
Data for this study were obtained from a larger project that examined factors related to the academic satisfaction and persistence decisions of engineering students. Participants were Latinx and White engineering majors enrolled in the 2014-2015 academic year at partnering institutions which included five PWIs and six HSIs with engineering colleges that had high rates of graduating Latinx students. Participants were invited to participate in an online survey administered in spring 2015. The survey included the demographic questionnaire, the Planning for Career and Family scale along with additional measures regarding students’ academic experiences. Participants received a $20 gift certificate to an online retail store for completing the survey.
Participants were recruited via announcements and flyers in undergraduate engineering courses and student organization/chapter meetings, flyers that were posted in high-traffic areas within their respective engineering colleges, and email messages sent via the department and student organization/chapter listservs. Follow-up e-mails were sent on listservs and to students individually who indicated interest in participating but did not finish the survey at two-week intervals until the sample goal was met.
Analytic Approach
Validating Factor Structure of PLAN
All data analyses were conducted using R Statistical Software (Version 4.2.3; R Core Team, 2022). After preliminary analysis to examine missing value, outliers, and normality, the analytical process starting with establishing a baseline factor structure, followed by cross-group measurement invariance and latent mean analysis are summarized in Figure 1. Analytical process for cross-group measurement invariance and latent mean analysis for plan.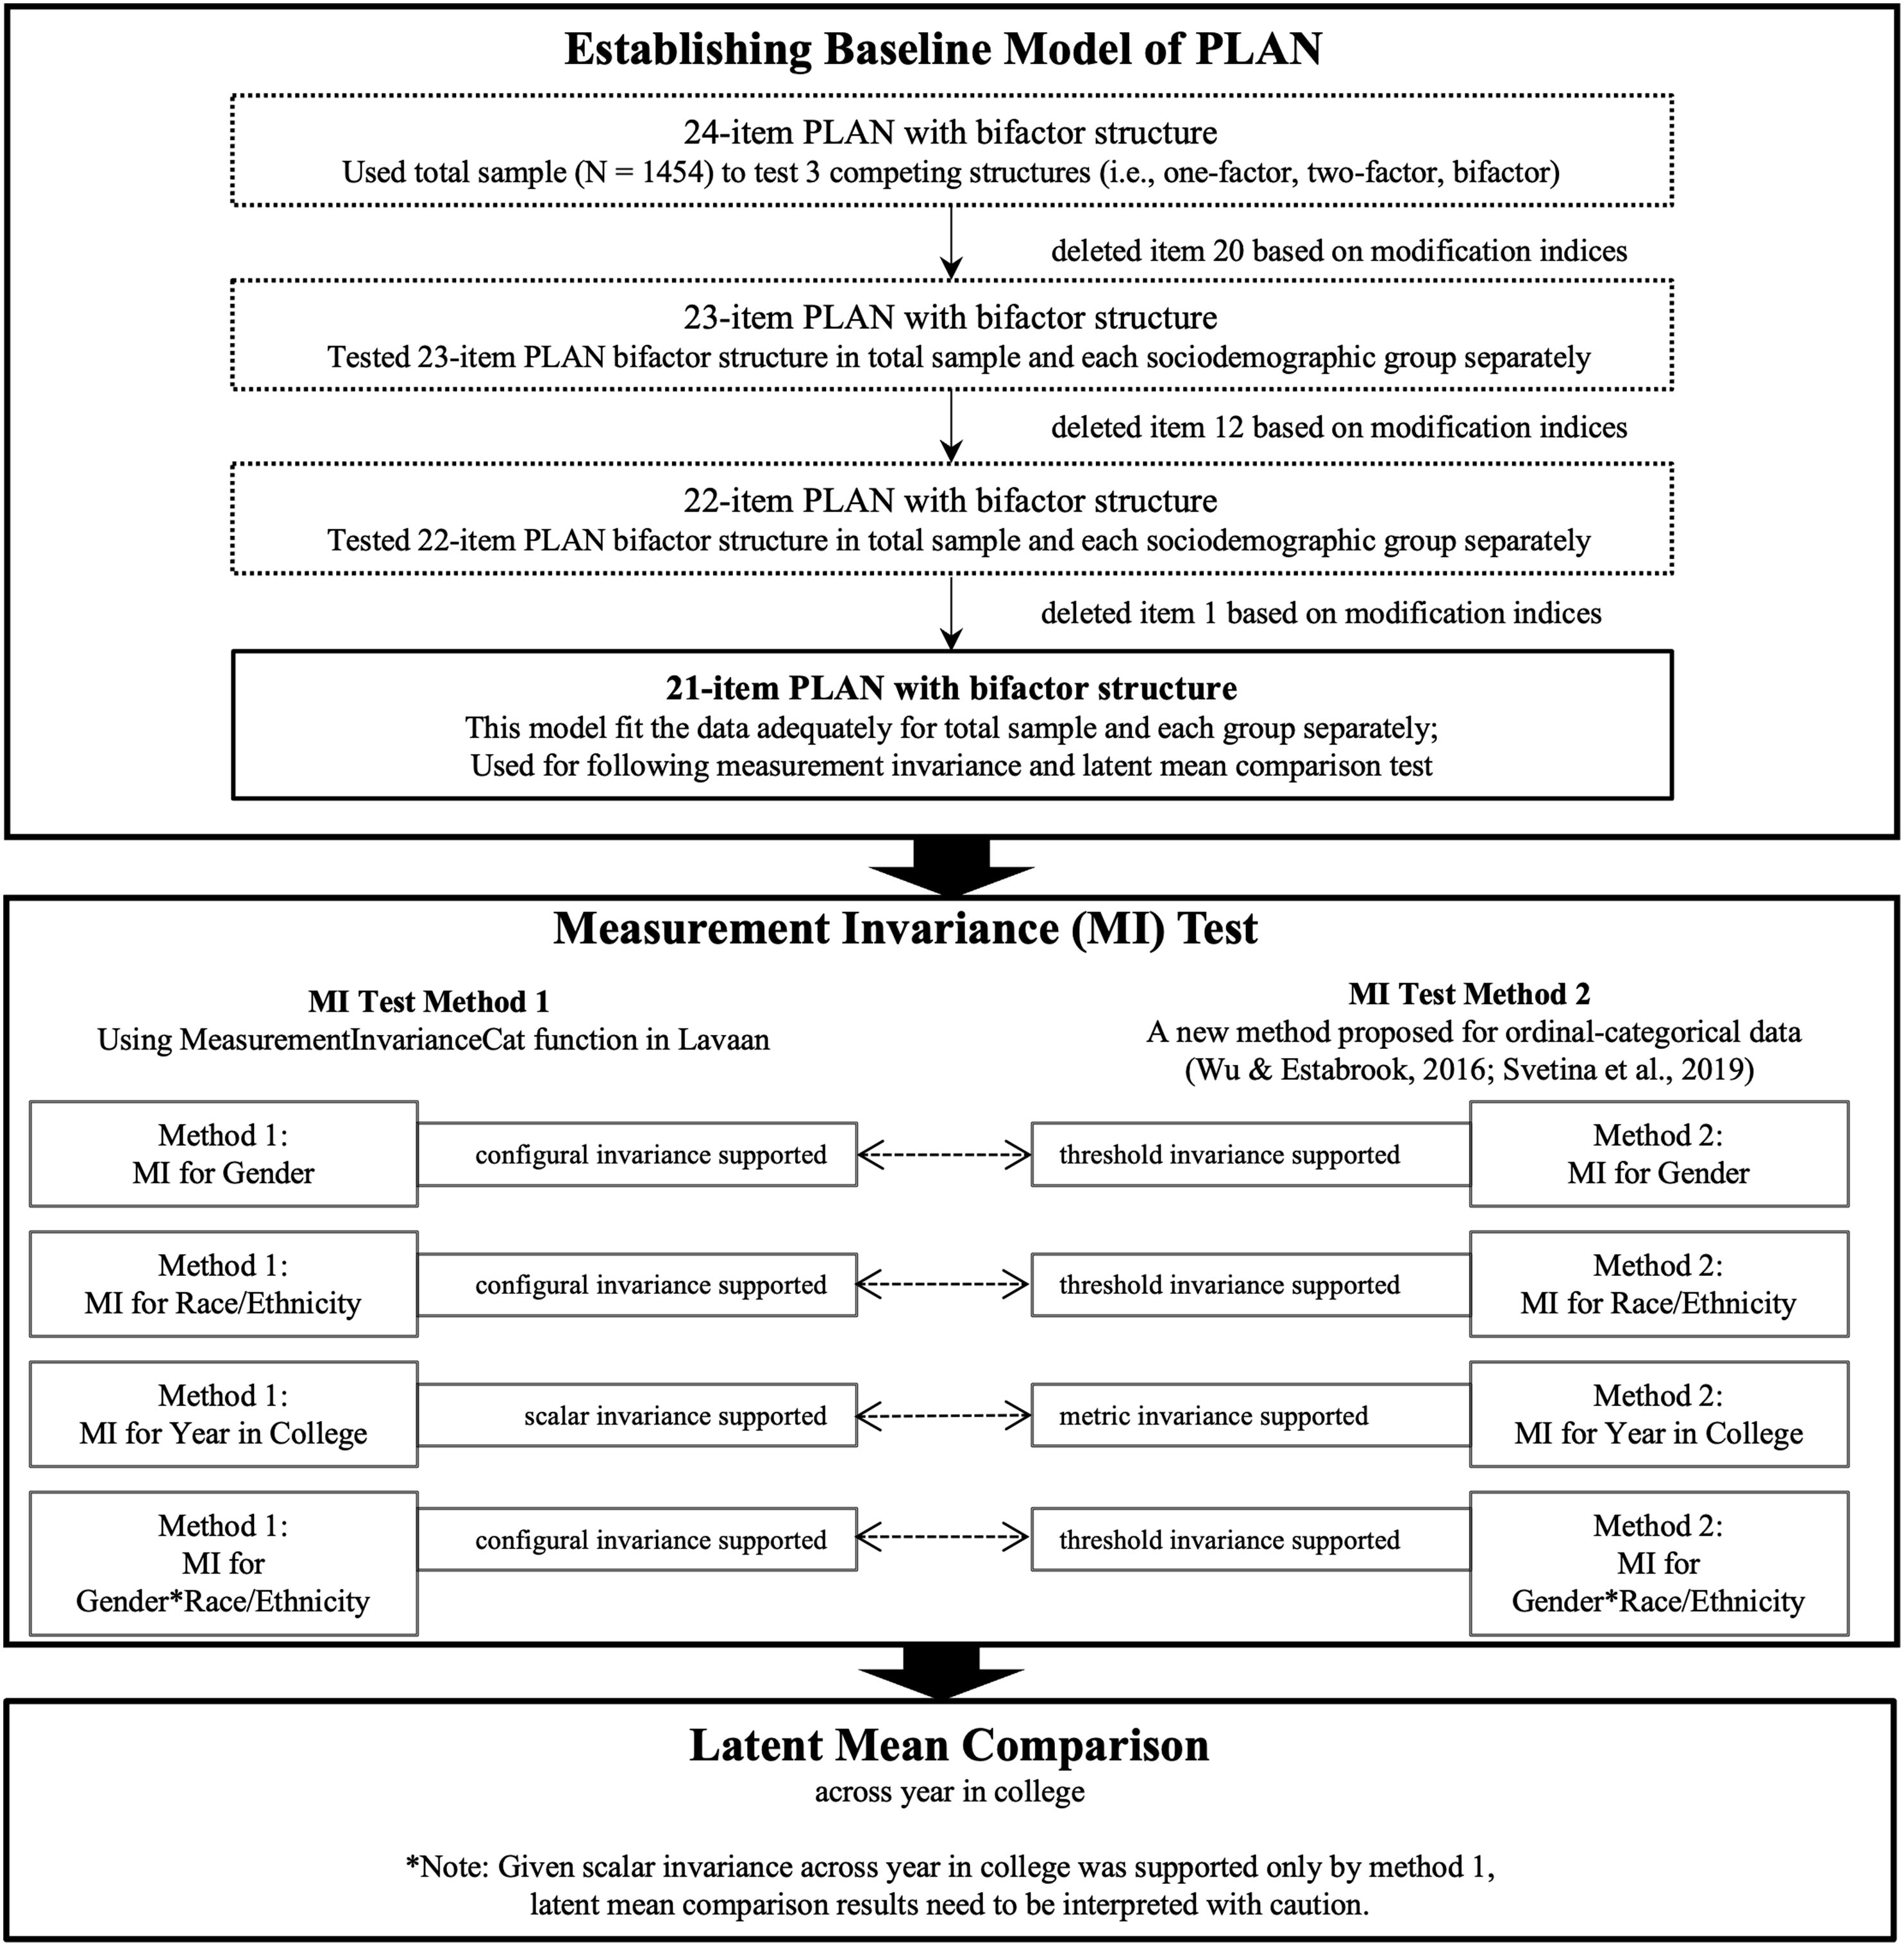
To establish a baseline model, we conducted Confirmatory Factor Analyses (CFA) with the total sample and with each sociodemographic group separately to cross-validate the structure of PLAN. We tested three competing models of the 24-item PLAN proposed by Ganginis Del Pino et al. (2013): (1) a one-factor model which assumed that only one underlying factor accounted for variance in the 24-item PLAN scale; (2) a two-factor model which assumed that two underlying factors (i.e., Considering Children; Considering Partner) accounted for variance in the 24-item PLAN scale; and (3) a bifactor model which assumed one general factor that accounted for variance in all PLAN items and two domain-specific factors that accounted for variance in subsets of PLAN items.
Considering that the PLAN uses an ordinal rating scale and the large sample size in the current study (>1000), we used robust diagonally weighted least squares estimation (WLSMV) which has been found to be less biased and more accurate compared to other methods (Li, 2014). Model fit was evaluated by χ2, comparative fit index (CFI), root mean square error of approximation (RMSEA), standardized root mean residual (SRMR), Tucker-Lewis Index (White et al.) Following recommendations of Hu and Bentler (1999), this study adopted model fit indices including CFI and TLI ≥.95, RMSEA and SRMR ≤.06 for excellent fit, and CFI and TLI ≥.90, and RMSEA and SRMR ≤.08 for adequate fit. In the event of poor model fit, we used model modification indices to identify parameter estimates that contributed to the largest degree of model misfit.
Measurement Invariance of PLAN – Two Methods Comparison
After establishing the most appropriate baseline model of PLAN with the total sample and with each group separately, we used two methods to examine the measurement invariance of PLAN. At each level, changes in fit indices were evaluated to determine whether adding equality constraints resulted in a worse-fitting model. A review of previous studies suggested several indicators to evaluate model fit and invariance: chi-square difference, ΔCFI, and ΔRMSEA (Luong & Flake, 2023; Schmitt & Kuljanin, 2008; Svetina et al., 2020). Chi-square differences test was proposed as a non-significant chi-square differences could suggest that the more restrictive model is a better representation of the data because it fits the data equivalently to the less restrictive model but has better parsimony; however, the chi-square difference test has been found to be highly sensitive to the sample size and thus tends to reject the null hypothesis of measurement invariance. Aside from chi-square difference, a smaller ΔCFI and Δ RMSEA were widely adopted to in measurement invariance test. Although varied cutoff values were proposed, we used the most common cutoffs in this study: ΔCFI ≤.010 and Δ RMSEA ≤.015 (Sass et al., 2014; Svetina et al., 2020). Once scalar measurement invariance was established, we further investigated latent mean invariance for the dimensions of the PLAN scale across sociodemographic groups.
Results
Preliminary Analysis
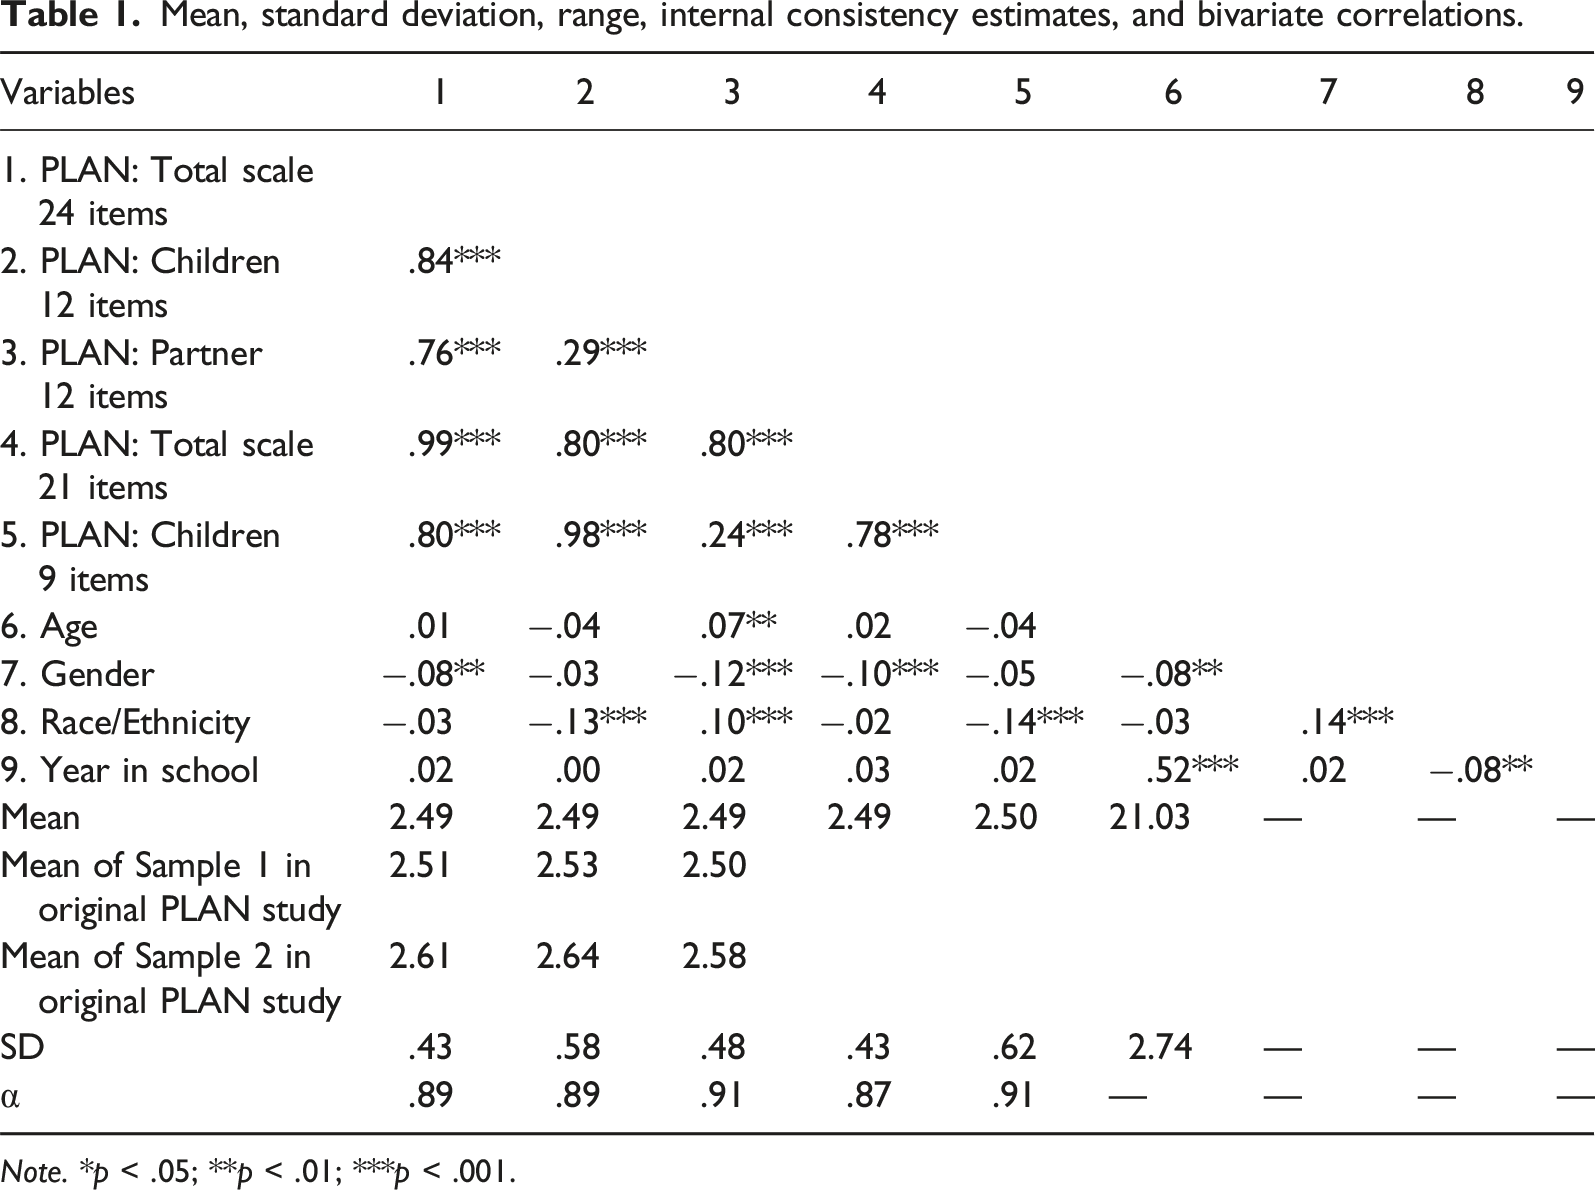
Mean, standard deviation, range, internal consistency estimates, and bivariate correlations.
Note. *p < .05; **p < .01; ***p < .001.
Factor Structure of PLAN
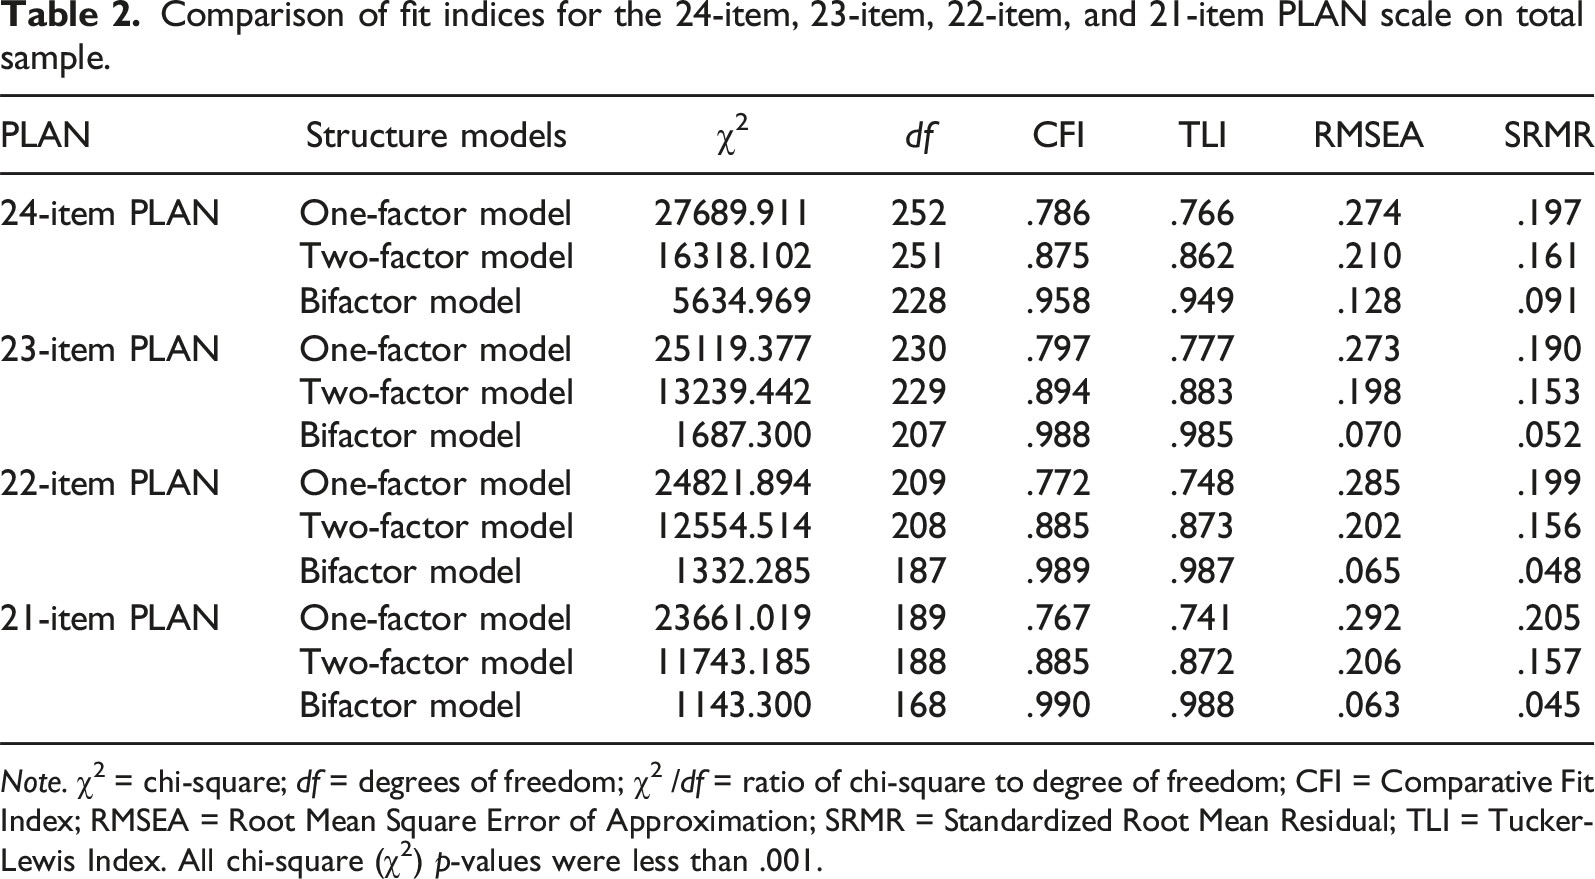
Comparison of fit indices for the 24-item, 23-item, 22-item, and 21-item PLAN scale on total sample.
Note. χ2 = chi-square; df = degrees of freedom; χ2 /df = ratio of chi-square to degree of freedom; CFI = Comparative Fit Index; RMSEA = Root Mean Square Error of Approximation; SRMR = Standardized Root Mean Residual; TLI = Tucker-Lewis Index. All chi-square (χ2) p-values were less than .001.
CFA results for the three competing models using the 24-item PLAN scale indicated that, compared with the one-factor and two-factor models, the bifactor model exhibited better fit [ χ2 (228) = 5634.969, p < .001, CFI = .958, TLI = .949, RMSEA = .128, SRMR = .091], yet it still did not adequately fit the data. Modification indices were used to detect the potential reason and refine the measure, which suggested that item 20 (“I will not plan my career around parenting responsibilities”), which was proposed under the Consideration for Children subdomain, also highly loaded on Consideration for Partner subdomain. This suggested that the item ambiguously measures aspects of both domains. Given this ambiguity and its potential to confound the distinct measurement of each domain, this item was removed from the measure which resulted in a 23-item measure.
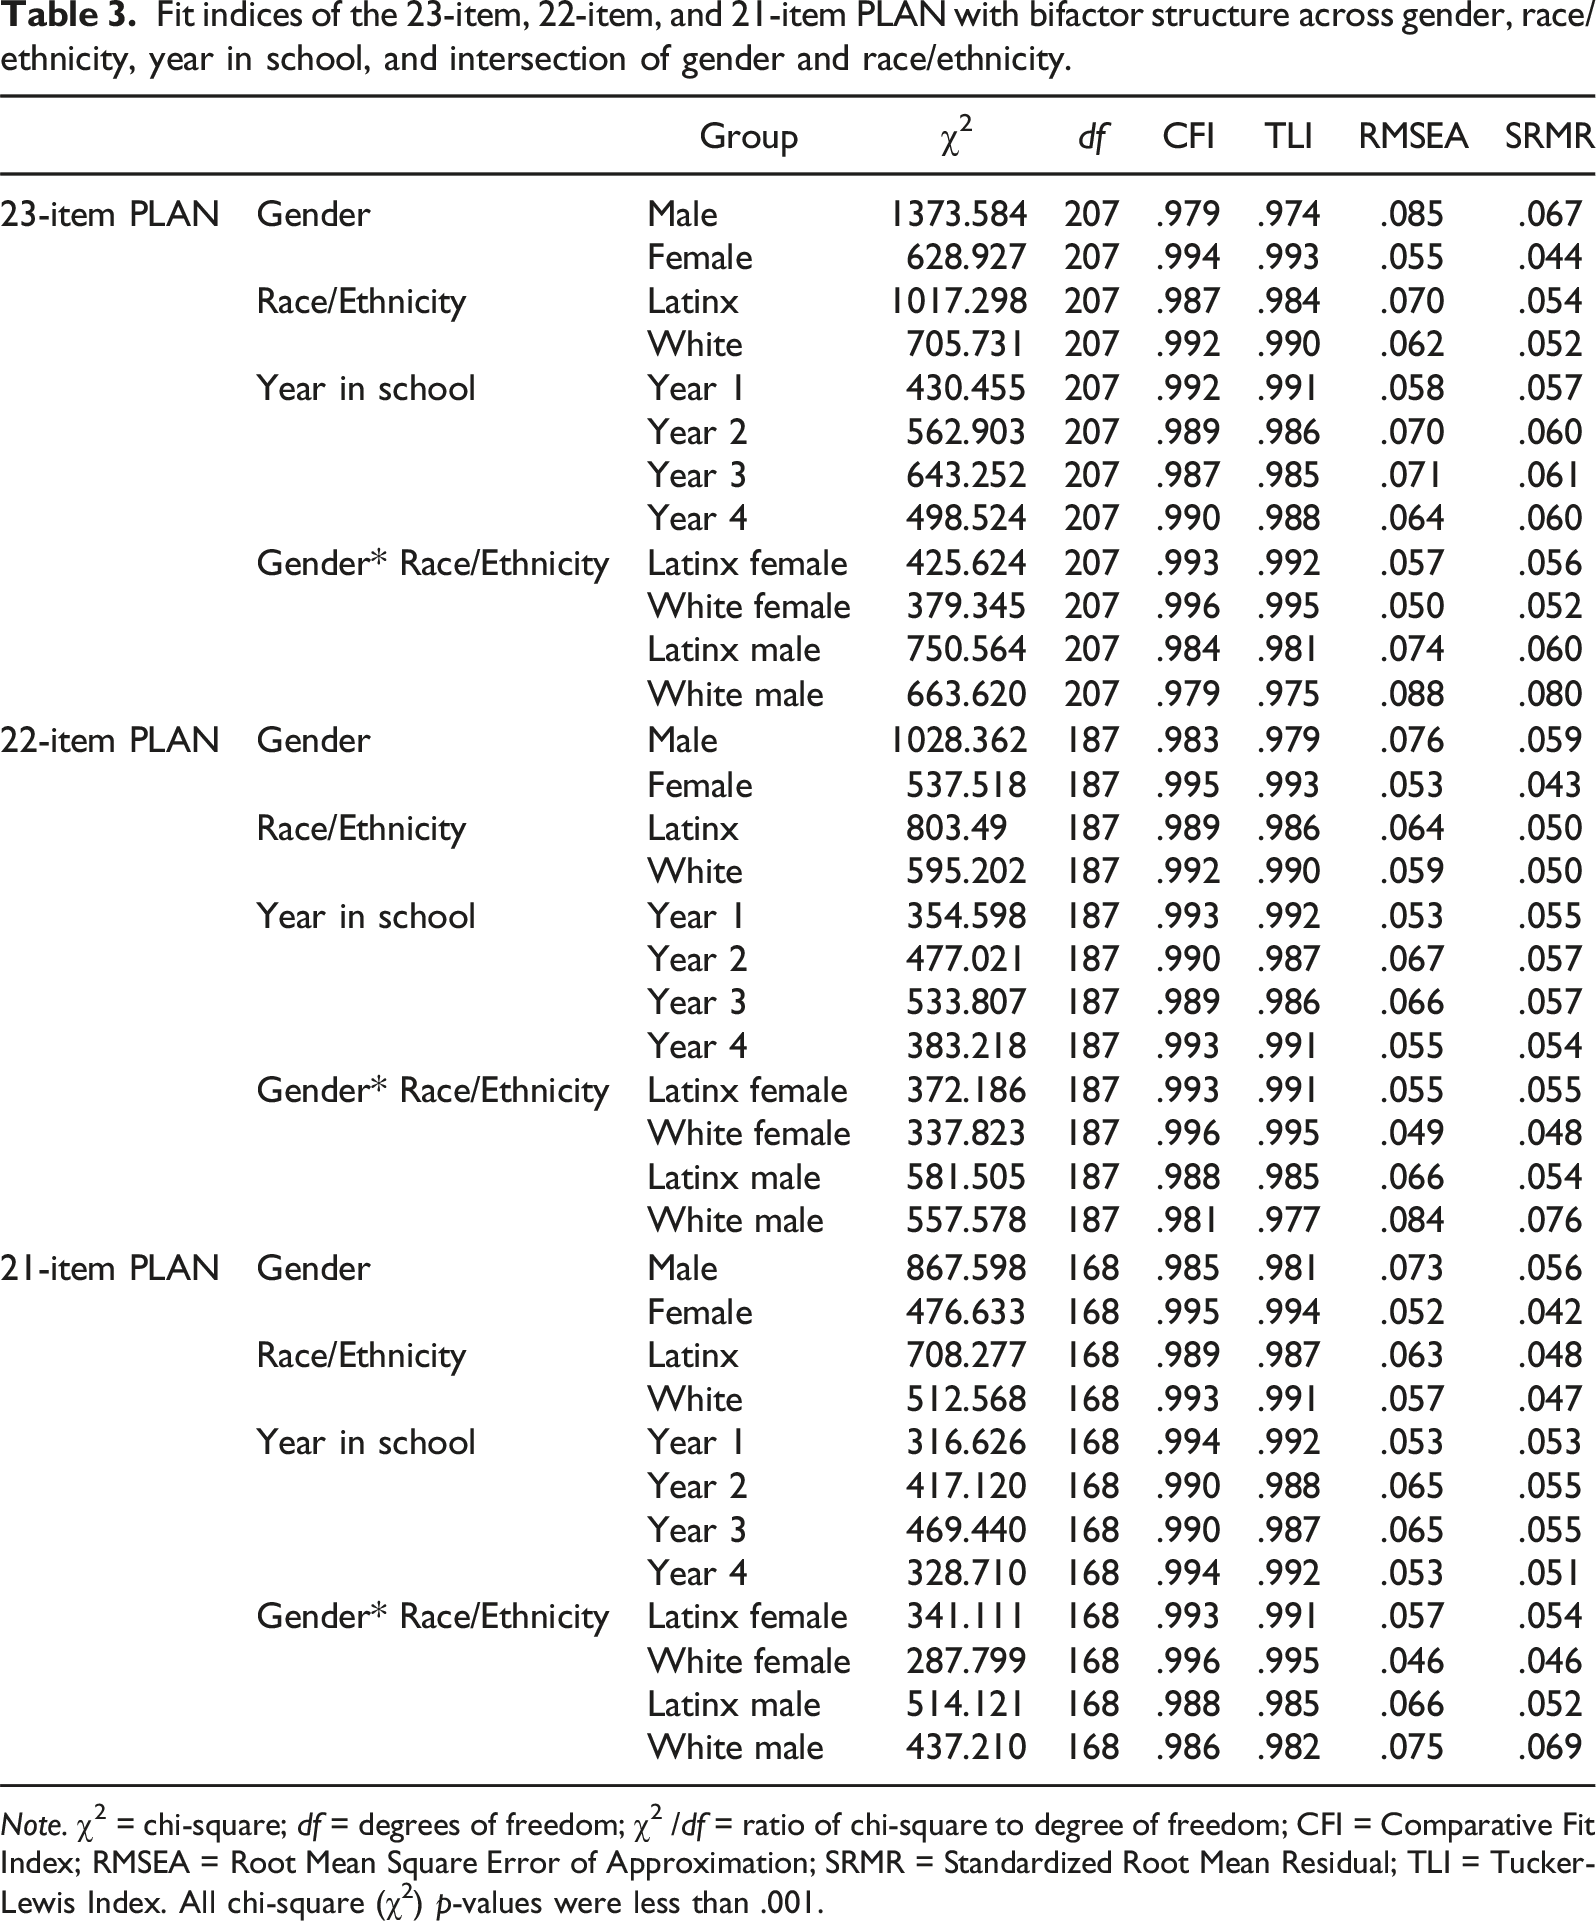
Fit indices of the 23-item, 22-item, and 21-item PLAN with bifactor structure across gender, race/ethnicity, year in school, and intersection of gender and race/ethnicity.
Note. χ2 = chi-square; df = degrees of freedom; χ2 /df = ratio of chi-square to degree of freedom; CFI = Comparative Fit Index; RMSEA = Root Mean Square Error of Approximation; SRMR = Standardized Root Mean Residual; TLI = Tucker-Lewis Index. All chi-square (χ2) p-values were less than .001.
Next, we examined the bifactor structure of the 22-item PLAN scale in the total sample and each demographic group separately. Results of CFA indicated that the bifactor structure of the 22-item PLAN fit appropriately with our total sample and most groups but with elevated RMSEA among the White men group. Modification indices suggested that item 1 (“I will find a career where I do not have to work full time after I have children”), which was proposed under the Consideration for Children subdomain, also highly loaded on Consideration for Partner subdomain. This item was then removed from the measure, resulting in a 21-item PLAN scale.
Subsequently, we examined the bifactor structure of the 21-item PLAN scale in the total sample and each demographic group separately. Results of CFA indicated that the bifactor structure of the 21-item PLAN fit appropriately with our total sample as well as each demographic group. As such, we established a valid structure (i.e., 21-item PLAN with bifactor structure) for the subsequent measurement invariance tests. Figure 2 presents the bifactor structure of the 21-item PLAN scale. The 21-item bifactor PLAN model. Planning for Career and Family = Planning for Career and Family general factor; Planning for Children (9 items) = Planning for Children domain-specific factor; Planning for Partner (12 items) = Planning for Partner domain-specific factor. The bifactor model suggests that PLAN items all share common variance (Planning for Career and Family) and that subsets of items share common variance (Planning for Children or Planning for Partner) that is unique to the general factor.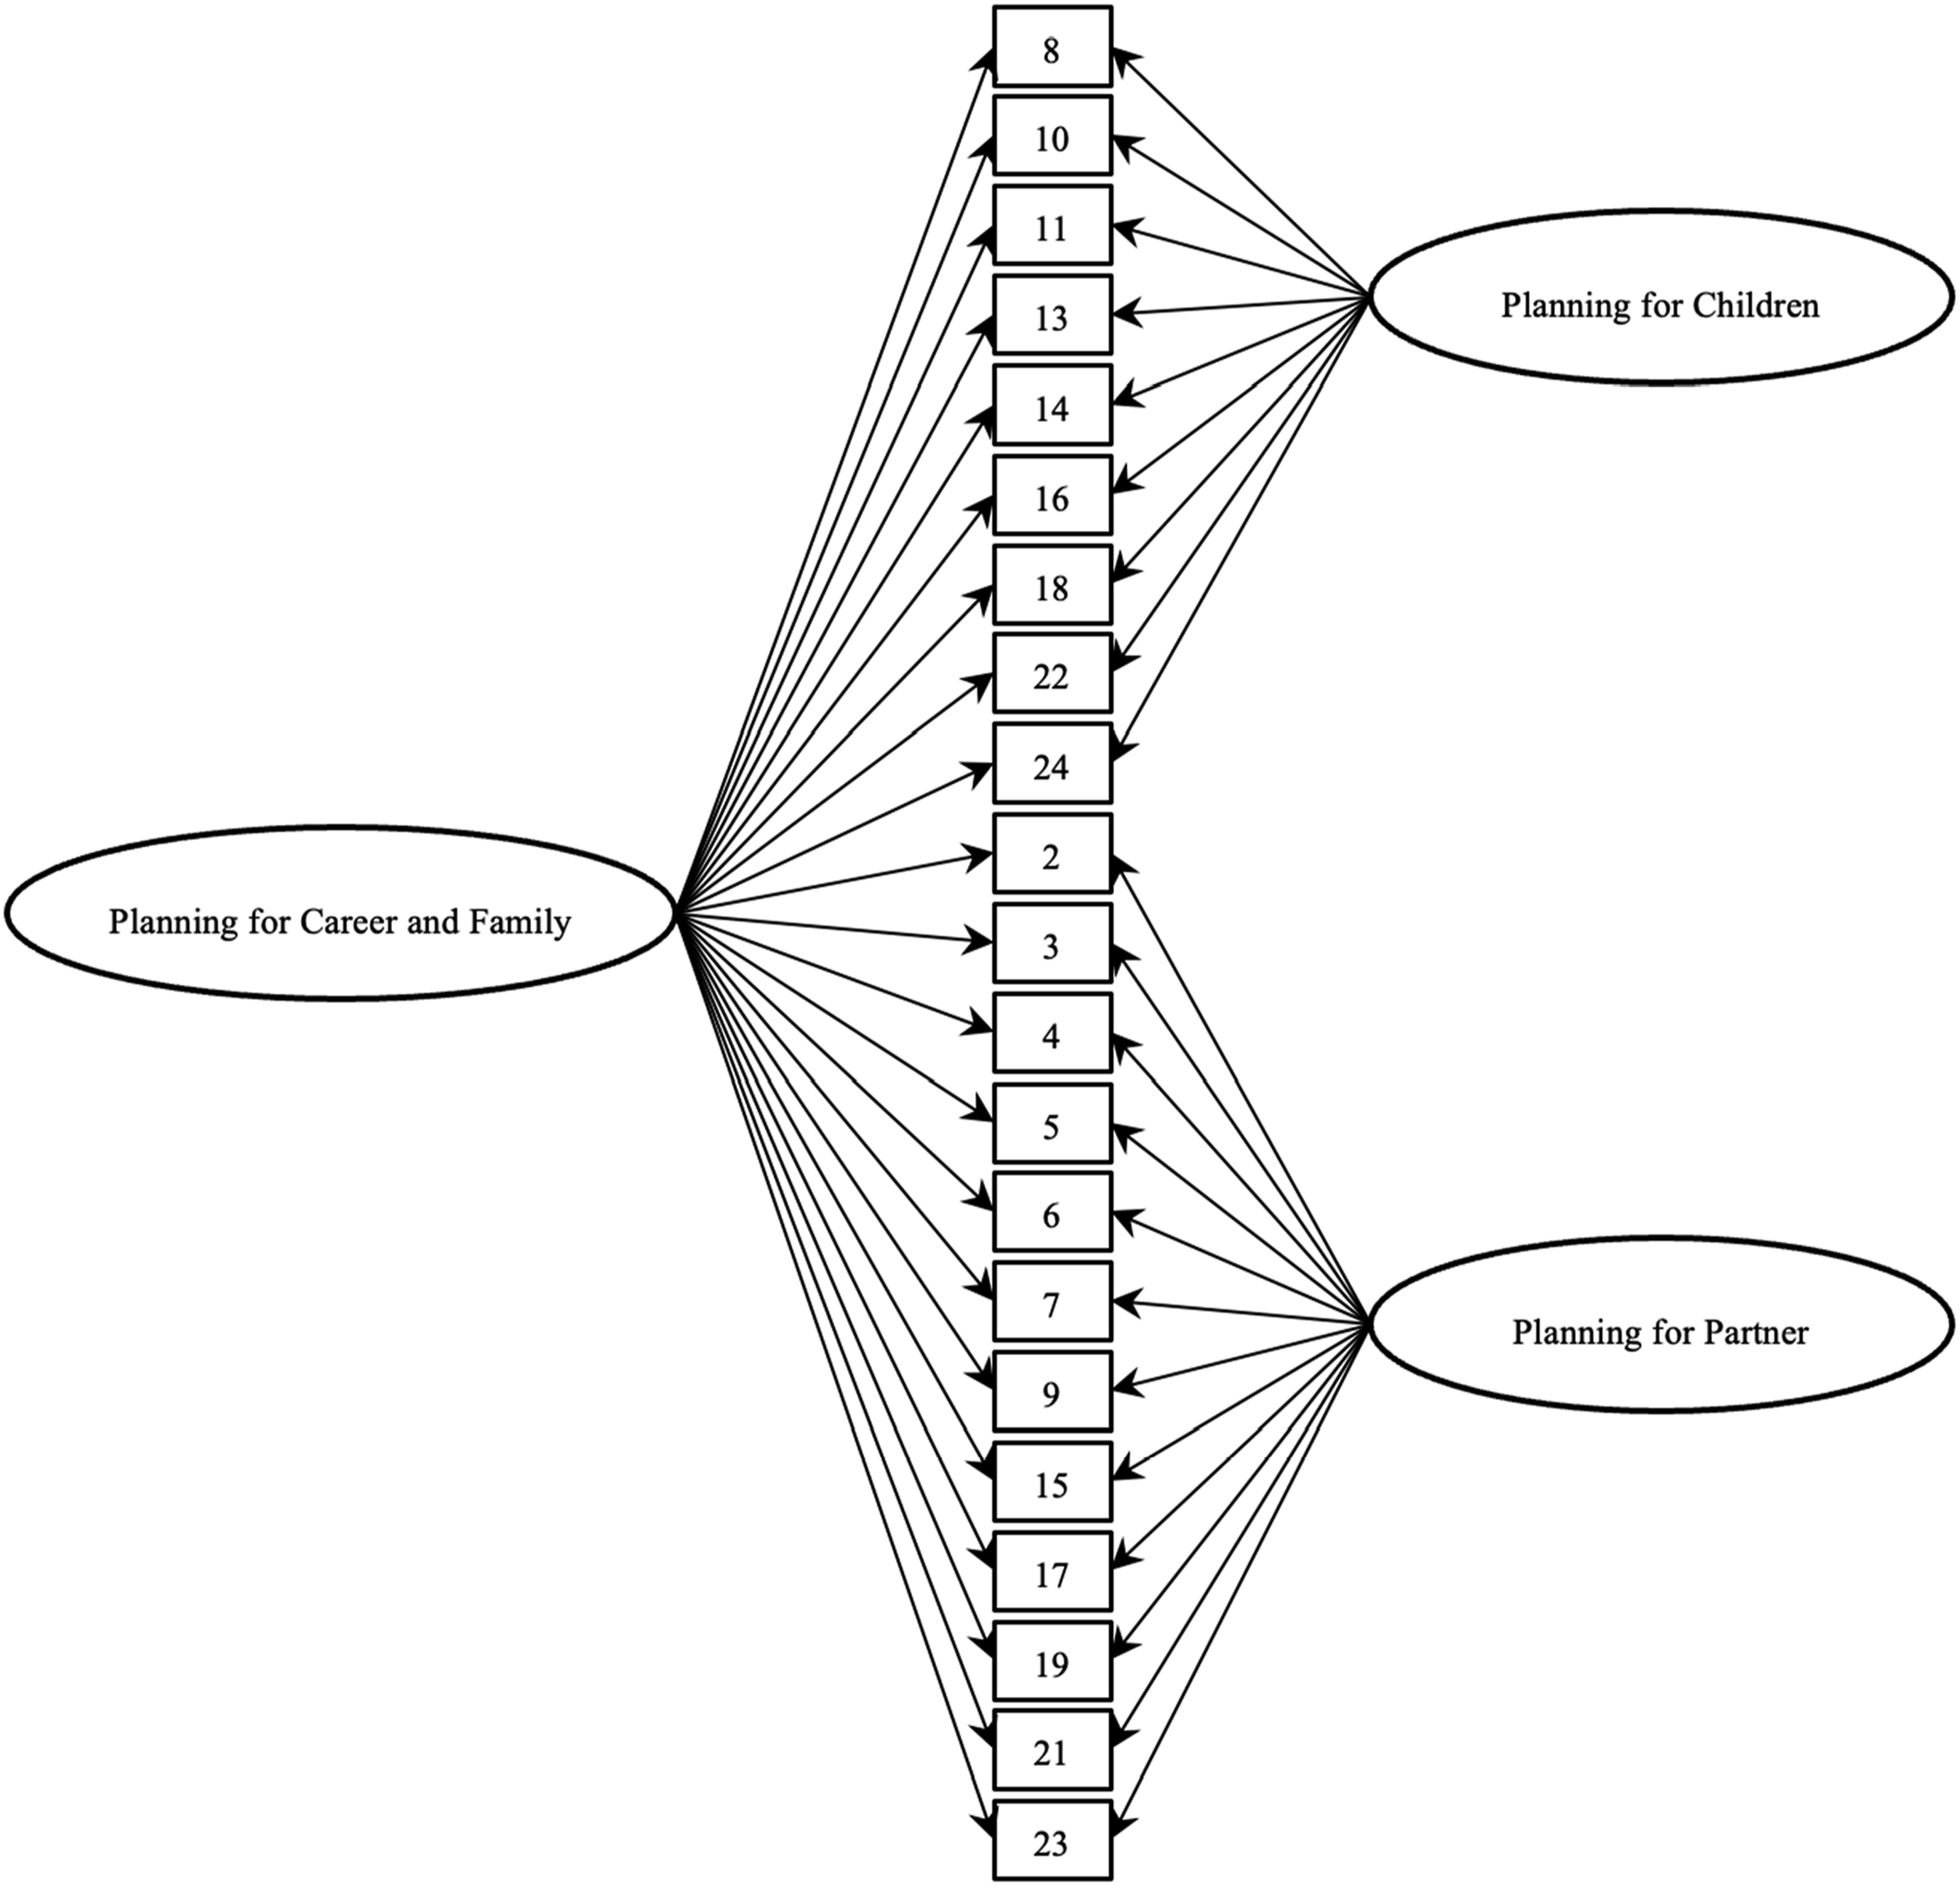
Measurement Invariance of PLAN
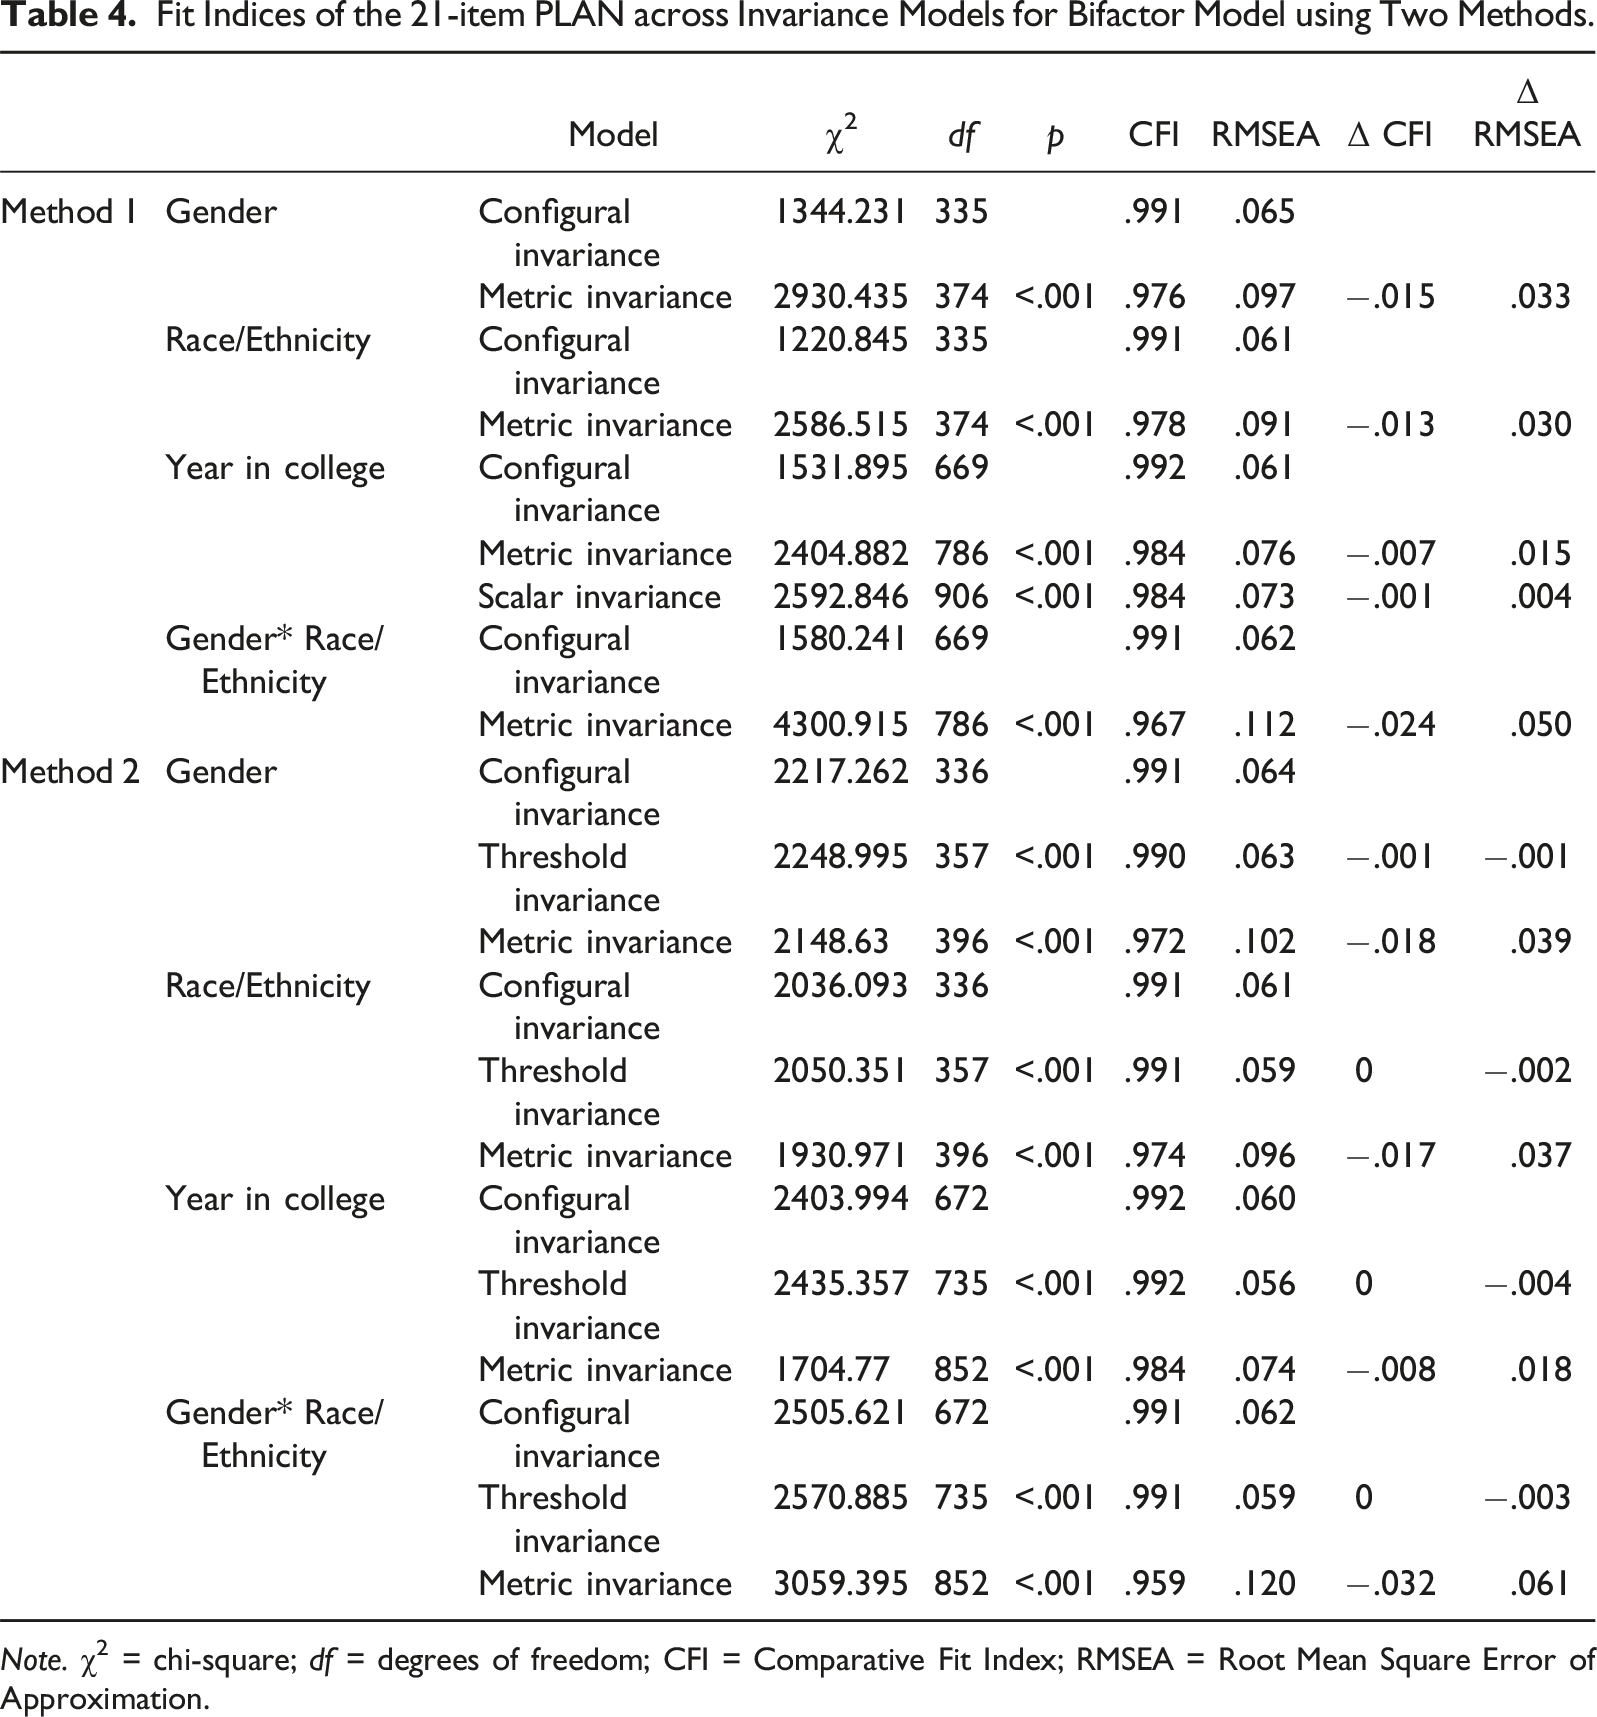
Fit Indices of the 21-item PLAN across Invariance Models for Bifactor Model using Two Methods.
Note. χ2 = chi-square; df = degrees of freedom; CFI = Comparative Fit Index; RMSEA = Root Mean Square Error of Approximation.
Latent Mean Comparisons Across Years in College
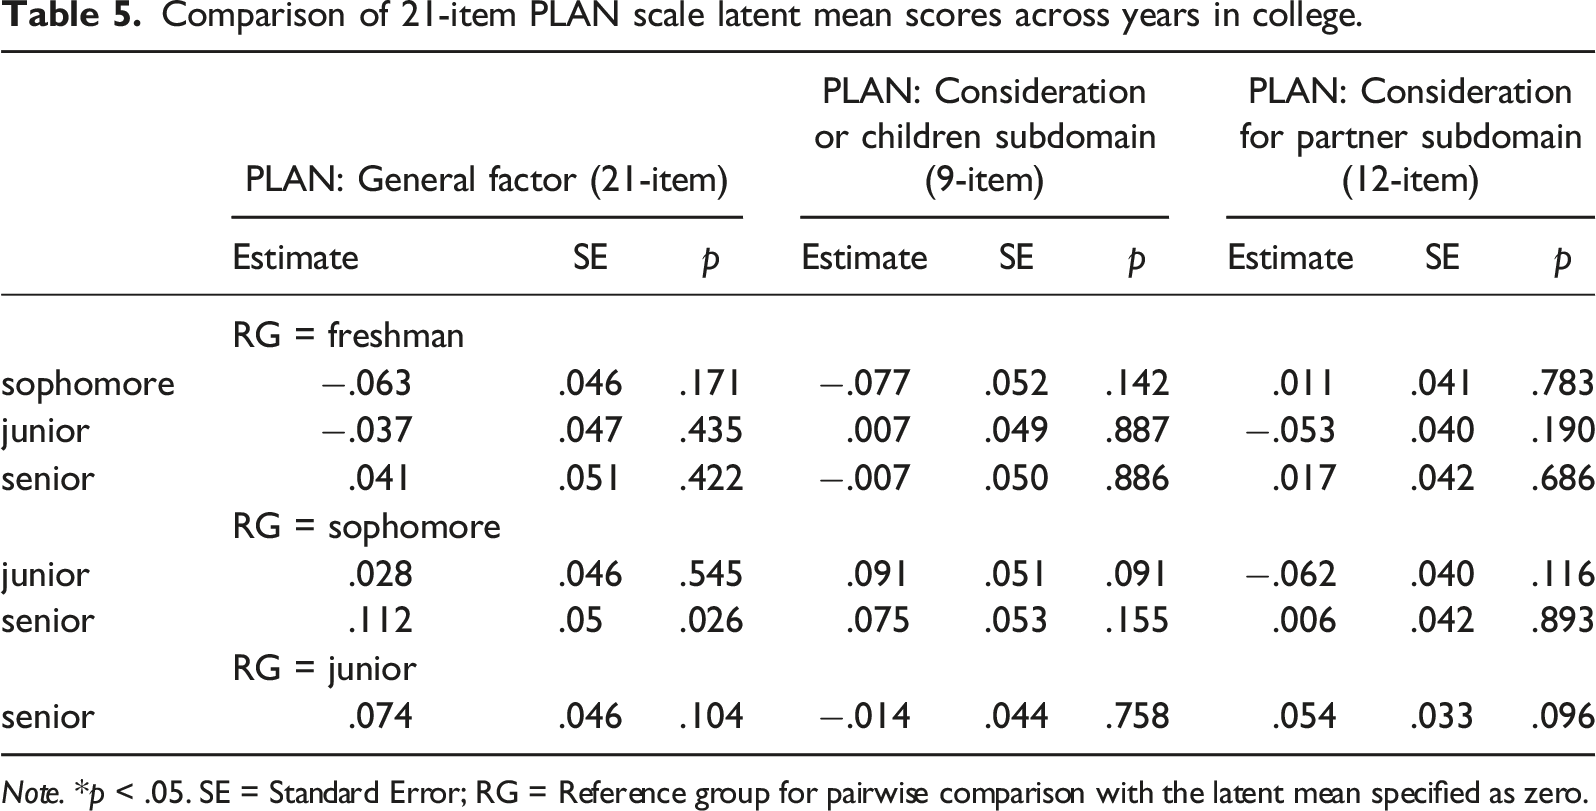
Comparison of 21-item PLAN scale latent mean scores across years in college.
Note. *p < .05. SE = Standard Error; RG = Reference group for pairwise comparison with the latent mean specified as zero.
PLAN measure items and domains.

Note. item numbers with (r) indicate the item is reversely coded. Children indicates the items fall under the Planning for Children subdomain; Partner indicates the items fall under the Planning for Partner subdomain. Italicized items (i.e., item 1, 12, and 20) were removed from the measure that was used in the measurement invariance test given their high cross-loading issues. The items listed in this table were originally developed by Ganginis Del Pino et al., 2013.
Discussion
This investigation refined the PLAN scale into a 21-item version through confirmatory factor analysis (CFA), eliminating three cross-loading items from the original 24-item scale. The bifactor structure of the refined scale demonstrated satisfactory fit within the overall sample and across subgroups defined by gender, race/ethnicity, academic year, and the intersection of gender and race/ethnicity. These findings align with prior research and support the validity of the bifactor structure of the PLAN scale. However, measurement invariance (MI) testing produced mixed results. The traditional method (Method 1) indicated metric invariance across gender, race/ethnicity, and their intersection, while the revised method (Method 2) supported only threshold invariance for these groups. For academic year classifications, scalar invariance was supported by Method 1 but only partial metric invariance by Method 2. These discrepancies underscore the complexities of MI testing for ordered-categorical data, warranting further exploration of best practices in this area.
Implications for Using PLAN in Research and Practice
The findings from MI testing of PLAN have critical implications for the administration of the PLAN scale in both research and practice. Although results suggest that while the bifactor structure of the 21-item PLAN scale is broadly valid across demographic groups, neither method suggest measurement invariance of the PLAN scale across gender, race/ethnicity, and their intersection. This result is not surprising given the measurement was initially developed and validated within only women college students. Researchers should therefore exercise caution when comparing PLAN scores across diverse demographic groups. Given that interpretations of constructs like willingness to plan for children or a partner may vary depending on sociodemographic contexts, direct comparisons of PLAN scores across groups may not be valid. Researchers should account for potential cultural and contextual differences in how respondents understand this construct and items on the scale. Further, qualitative methods such as interviews, focus groups, or case studies may be used alongside the PLAN scale to provide deeper insights into how different groups interpret and prioritize family considerations. Using those methods can help contextualize results of the measurement and provide a more nuanced understanding of the factors influencing career decisions (Luong & Flake, 2023).
In practice, these findings highlight the importance of tailoring counseling and educational interventions to the diverse needs of students. Practitioners working with engineering students can use the adapted 21-item PLAN scale to identify how considerations of family influence career decision-making and to support students in addressing potential conflicts between career aspirations and family planning. However, they should remain mindful of potential cultural and demographic differences in how students perceive and prioritize family considerations.
Implication for Engineering Education
This study’s findings have significant implications for engineering education, particularly regarding how career and family planning considerations evolve throughout college. The latent mean comparison across academic years revealed senior engineering students reported a significantly higher willingness to plan for family when making career decisions compared to their sophomore peers. This suggest that family considerations become more salient as students progress through college. This finding aligns with career development theories and research suggesting that career aspirations and family planning evolve over time. For example, Harren’s (1979) four-stage model indicates that career goals change as individuals progress through developmental stages, with the college years being pivotal for refining these goals. Similarly, Social Cognitive Career Theory (SCCT; Lent et al., 1994) highlights how factors like self-efficacy and perceived barriers shift over time, influencing career decisions. Furthermore, research on work-family conflict found that individual’s perceived work-family conflict becomes more pronounced as they move from school to the workforce and as they take on more family responsibilities (Fouad et al., 2016; Greenhaus & Beutell, 1985). Similarly, research on leadership aspirations of female doctoral students found that female graduate students approaching the completion of their doctoral programs demonstrated a greater willingness to prioritize their partner and adjust their career plans for children compared to those in the earlier stages of their studies (Gregor & O’Brien, 2015).
Engineering education programs can benefit from integrating stage-specific interventions tailored to students’ developmental stages. For example, freshmen and sophomores could benefit from workshops that introduce career-family planning frameworks and anticipate challenges, while juniors and seniors could be offered professional development opportunities that focus on strategies for managing work-family conflict in engineering careers. These stage-appropriate interventions could be integrated into existing career counseling and academic advising services to better equip students for the realities of their future careers.
Additionally, the differences observed across demographic groups in relation to family planning and career intentions suggest that engineering education should adopt more culturally and demographically sensitive approaches. Understanding how diverse groups of students navigate career-family planning within engineering could lead to more inclusive and effective educational strategies. In particular, integrating career development resources that address gendered and cultural expectations in engineering could help to foster a more inclusive environment, ultimately improving retention and career persistence among underrepresented groups in the field.
Implication for Testing MI with Ordered-Categorical Data
This study contributes to the ongoing methodological discourse on testing measurement invariance (MI) with ordered-categorical data, an area that remains complex and underexplored. The mixed results observed between the traditional multigroup confirmatory factor analysis (MGCFA) method and the revised method proposed by Wu and Estabrook (2016) underscore the challenges of testing MI for ordered-categorical data and highlight the pressing need to advance statistical guidelines for MI testing in this context. By presenting both methods and comparing their results, this study offers a practical comparison that provides researchers with a deeper understanding of how different approaches may lead to varied conclusions.
Furthermore, empirical comparisons of traditional and revised MI methods, such as those undertaken in this study, are crucial for evaluating the applicability and limitations of each approach. The findings also suggest the importance of transparency in reporting MI testing procedures and results, as this promotes better replication and facilitates the refinement of MI testing practices. Ultimately, the results underscore that more theoretical and empirical research is needed to determine the most reliable and valid method for establishing measurement invariance in studies involving ordered-categorical data, and they call attention to the need for continued refinement of these testing procedures.
Limitations and Future Research
Despite the important findings of this study, there are several limitations that should be noted. First, the analysis focused exclusively on testing full measurement invariance hypotheses, yielding mixed results. Future research may consider partial measurement invariance to provide a more nuanced understanding of how different groups respond to the PLAN scale items; however, review of MI practices has suggested that, thought partial MI was used by some researchers, the test of partial MI was mostly empirical, without a robust theoretical guidelines (Schmitt & Kuljanin, 2008).
Second, the demographic scope of our sample was limited to Latinx and White college students with engineering majors. While this focus provides valuable insights into these groups, it may limit the generalizability of the findings to broader populations. Students in other STEM fields, or those pursuing non-STEM disciplines, may experience different dynamics in balancing career and family planning due to varied curriculum demands and career expectations. Future research should consider including a more diverse array of participants, encompassing additional racial and ethnic backgrounds and academic disciplines, to enhance the external validity of the findings.
Third, the latent mean comparison results across academic years should be interpreted with caution given the mixed results from two methods. The scalar measurement invariance, which facilitates a meaningful comparison of means across groups, was supported only by the traditional method. This limitation highlights the potential variability in how different analytic methods can influence the interpretation of data in psychological research. It suggests that future studies might benefit from employing a range of statistical techniques to confirm findings and ensure robustness. In addition, it also suggests that testing MI with ordered-categorical data still needs much theoretical and empirical work.
Finally, another limitation of this study is the use of an online survey for data collection. While online surveys are efficient and effective for sampling college students, they may introduce potential biases that could impact the validity and representativeness of the findings. For example, the reliance on internet access and digital devices may disadvantage students from lower socioeconomic backgrounds or those with limited technological proficiency (Fricker & Schonlau, 2002). Self-reported data collected in this format is susceptible to biases such as social desirability (Arnold & Feldman, 1981) or inattentive responses (Fricker & Schonlau, 2002; Lefever et al., 2007). These limitations should be considered when interpreting the results, as they may affect the representativeness and generalizability of the findings.
Conclusion
This study refined the PLAN scale into a 21-item version with a bifactor structure, demonstrating satisfactory validity across several demographic groups. However, mixed MI results highlight the complexity of psychometric testing for categorical data and suggest that the PLAN scale may not capture the construct of career and family planning equivalently across all groups. Latent mean comparisons revealed developmental differences in students’ willingness to plan for family and career, emphasizing the dynamic nature of these considerations during college. These findings have important implications for research, clinical practice, engineering education and career advancement. Tailored interventions that address the unique needs of diverse demographic groups and developmental stages can enhance support for students navigating career and family planning. Additionally, the study underscores the need for methodological advancements in MI testing and further adaptation of the PLAN scale to ensure its applicability across diverse populations.
Footnotes
Author Note
Correspondence concerning this article should be addressed to Xiaotian Daisy Hu, University of Washington, Department of Psychiatry & Behavioral Sciences, 1959 NE Pacific Street, Box 357920, Seattle, WA 98195-6560, USA. Email:
Declaration of Conflicting Interests
The author(s) declared no potential conflicts of interest with respect to the research, authorship, and/or publication of this article.
Funding
The author(s) disclosed receipt of the following financial support for the research, authorship, and/or publication of this article: This work is funded by National Science Foundation grants: NSF EHR-2000607/2000636; NSF DUE-1430614/1430640.
