
Abstract
The effects of tibial malrotation on the biomechanics of the tibiotalar joint were studied using a cadaveric model loaded in an Instron 8521 materials testing device and a TEKScan I-Scan thin-film resistive ink pressure measuring system. Testing of 23 legs was performed using rotational conditions of 10 and 20° internal and external rotation as well as neutral rotation. All rotational conditions were found to decrease joint contact area. Peak pressures were significantly greater with 20° internal rotation as well as 20° external rotation. Total load across the joint was significantly lower for both 10 and 20° of external rotation. In conclusion, rotational deformity across the tibiotalar joint results in significant alteration of overall joint biomechanics and should be minimized whenever possible.
INTRODUCTION
This project seeks to define the biomechanical changes in tibiotalar joint contact areas after simulated rotational malunions of the tibia in a cadaveric model. Fractures of the tibia are the most common fracture of long bones. Treatment options include casting, brace treatment, and surgical reduction with internal fixation. Potential complications following tibia fracture include malunion and limitation of ankle range of motion. Fracture malunion can disrupt otherwise normal joint kinematics resulting in nonphysiologic loading of the ankle and post-traumatic arthritis.
Improved biomechanical understanding of tibial rotational malunions will help to formulate improved treatment modalities.
Previous studies have determined that malunion of the tibia can lead to significant limitation of function secondary to hindfoot disability 5 and the development of early degenerative arthritis. 8,12 The exact etiology of the degenerative changes has not been completely elucidated. 13 It is commonly accepted that the degree of ankle disability is directly related to the proximity of the malunion to the ankle joint. 4,6,7,10 The ultimate development of degenerative joint disease of the tibiotalar joint is a direct result of altered joint kinematics due to malalignment. 3,13 The effects of fibular malunion on tibiotalar biomechanics after ankle fractures has been well-documented. 3,9,13 These cadaveric studies have demonstrated that tibiotalar joint incongruity from ankle fractures can lead to decreased contact areas and increased contact stress. It is now commonly accepted that talar displacements measuring greater than 1 to 2 mm predispose the ankle to post-traumatic arthritis. Tarr and associates 11 used a similar line of reasoning when they investigated the effects of tibial angular deformities on tibiotalar joint contact areas. These authors modeled tibial malunions at the level of the proximal, mid-, and distal tibial diaphysis using varus, valgus, posterior and anterior angular deformities ranging from 5 to 15°. Pressure sensitive film was placed into the tibiotalar joint to record the joint contact area with static, single leg stance loading of 600 Newtons (N). Malunions nearest the ankle joint caused the most significant decrease in tibiotalar contact area. Unfortunately, this study did not assess the effects of rotational deformity. Rotational deformity is often significant after tibia fractures and may lead to tibiotalar degenerative joint disease. 12 To our knowledge, there is no study in the English language literature that investigates the effects of tibial rotational malunion on tibiotalar joint biomechanics.
The purpose of this investigation was to determine the effects of tibial malrotation on the biomechanics of the tibiotalar joint to include contact area, total load, and peak pressure using a cadaveric model.
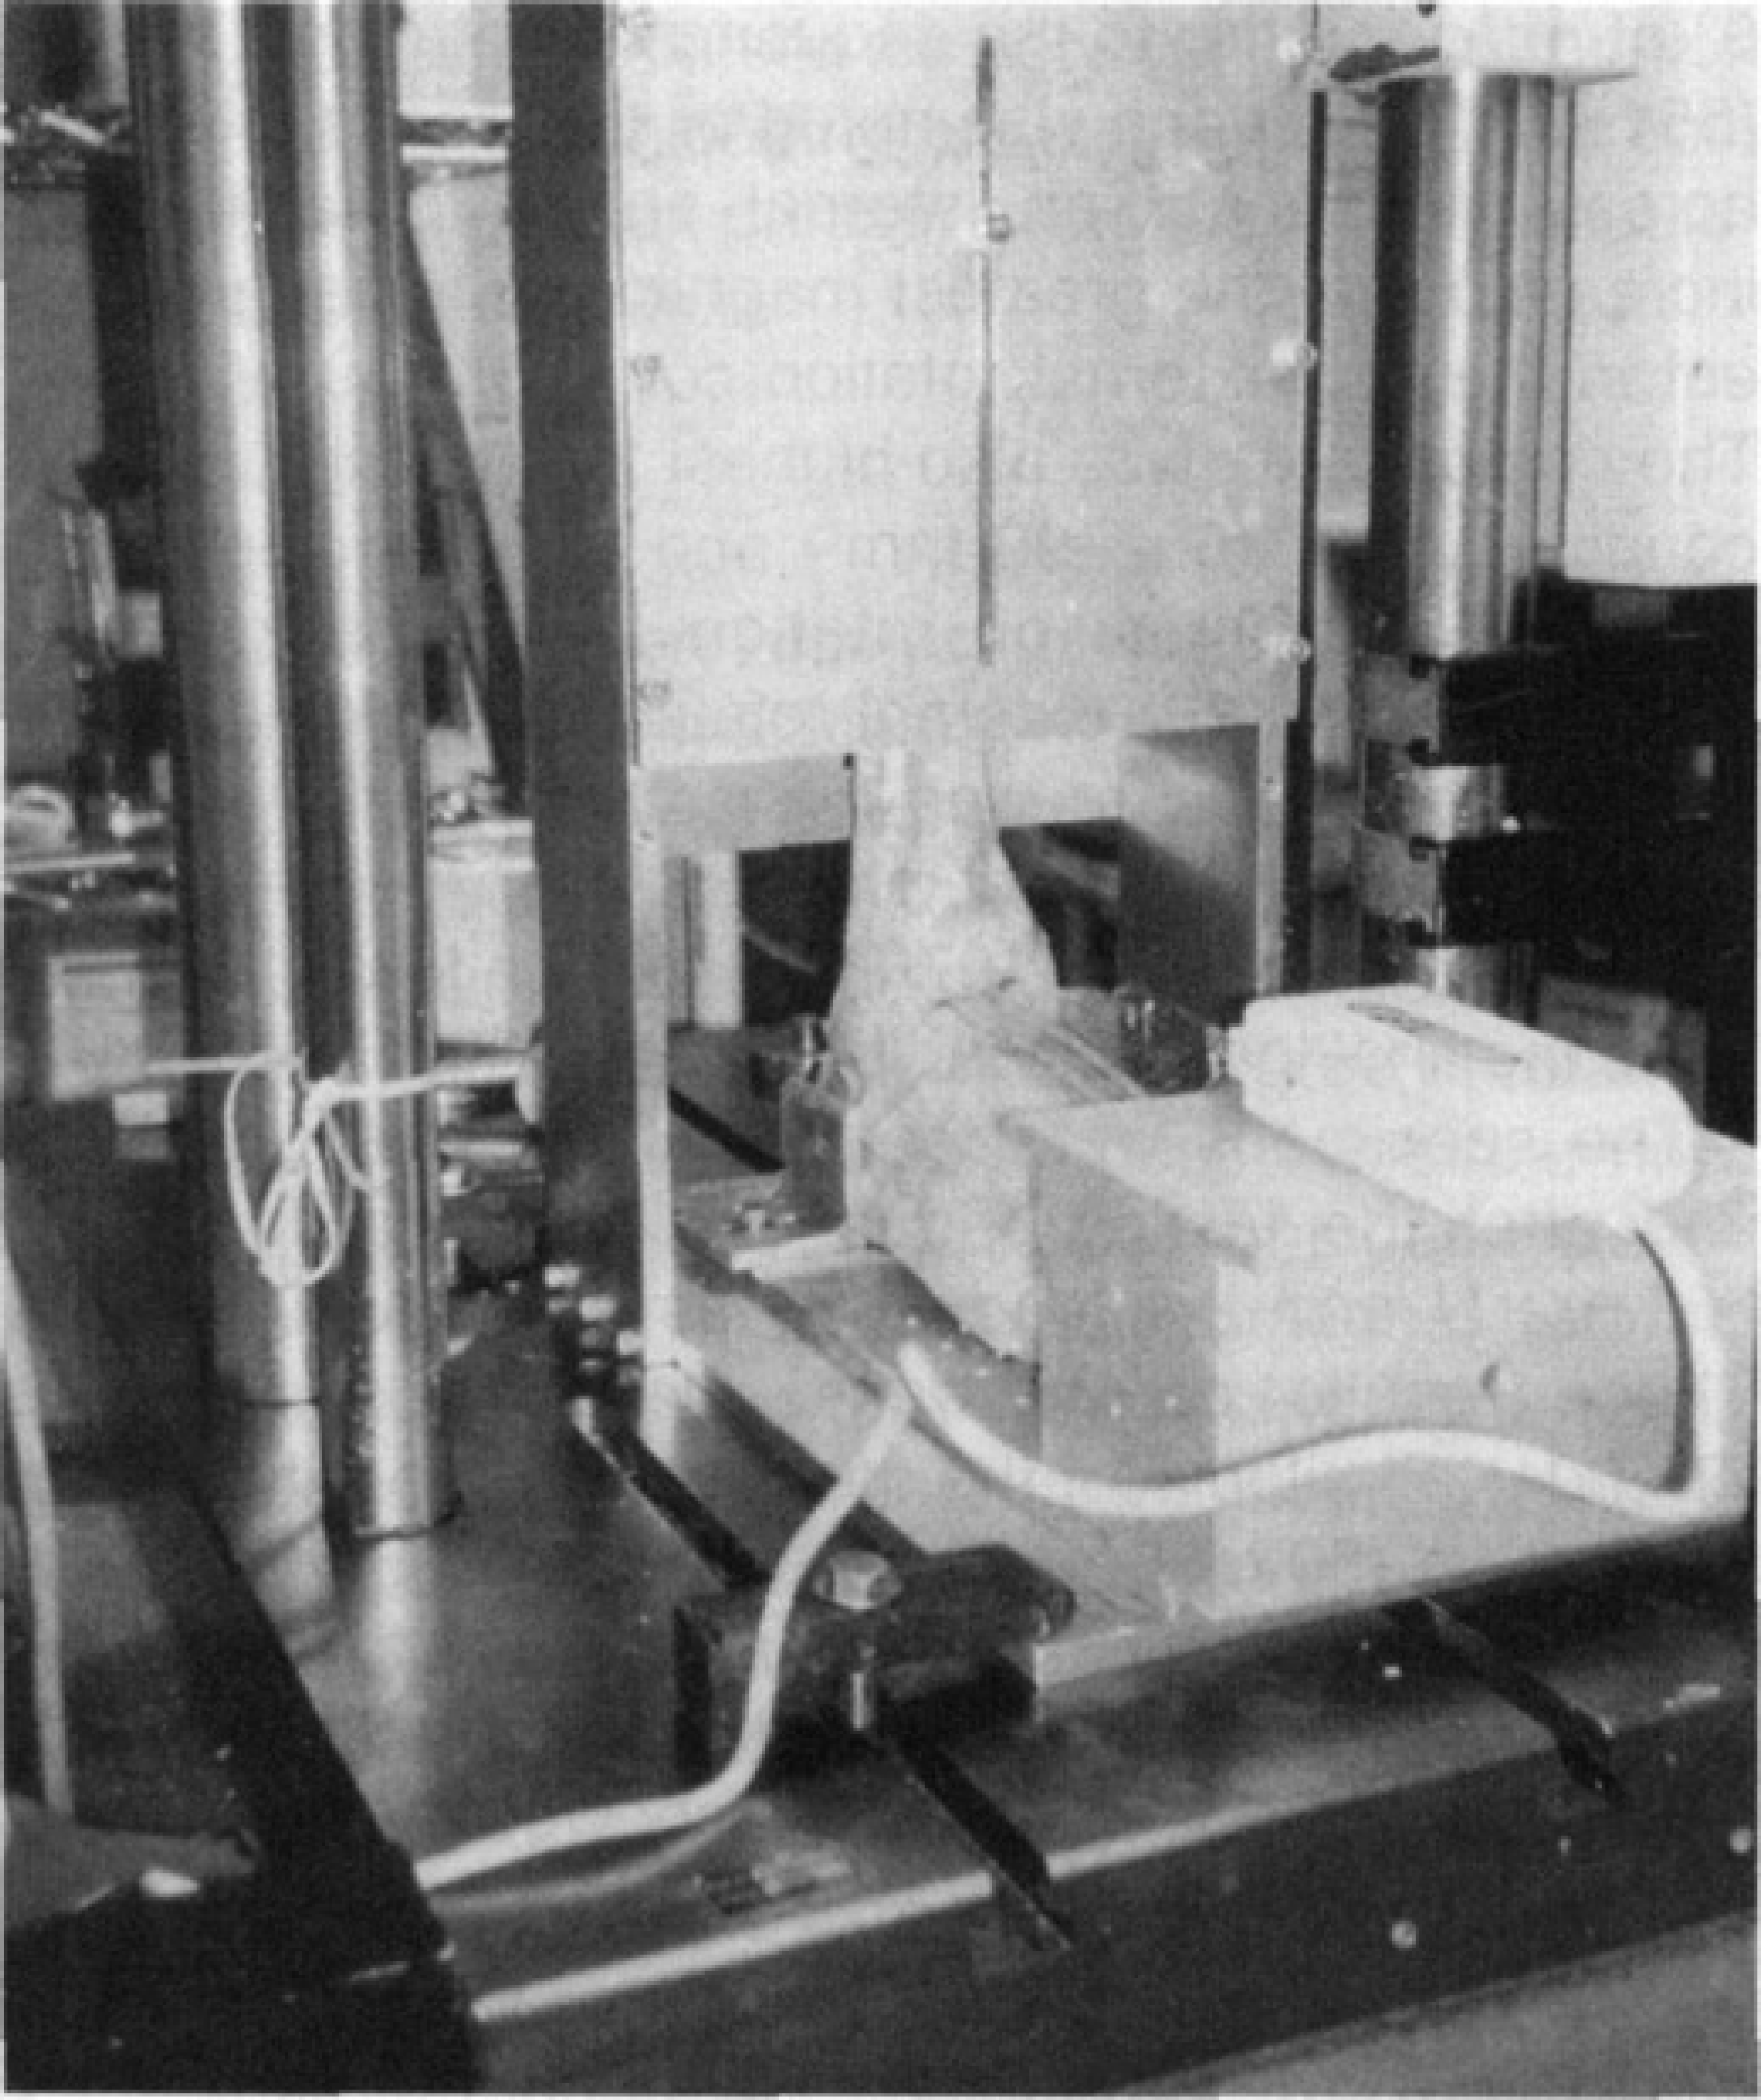
Specimen mounted in special load frame on servohydraulic materials testing machine. Load actuator is attached to proximal tibia and fibula that have been cut at the mid-diaphyseal level. Ankle is in neutral dorsiflexion with the foot attached to a plate on the frame allowing 10 and 20° of rotation both internally and externally. The sensor handle is seen inserted into the tibiotalar joint through an anterior arthrotomy.
METHODS AND MATERIALS
In the present study, the model established by Tarr and coworkers was modified to accommodate analysis of the effects of tibial malrotation. Twenty-three fresh, unembalmed lower limbs were harvested at the level of the mid-diaphysis of the tibia and stored frozen at −20°C until the time of testing. After thawing at room temperature for a period of 24 hours, the specimens were stripped of all soft tissues except the interosseous membrane and the soft tissues of the ankle and foot. Ligament integrity was evaluated at this time. Anterior ankle arthrotomies were performed to facilitate placement of the pressure sensor.
Each leg was mounted into a specially designed load frame in a hydraulic materials testing device (Instron Model 8521) to simulate single-leg stance with the ankle in a neutral position. Load was applied from the actuator of the materials tester to the proximal aspect of the tibia that was potted in a 5-inch diameter piece of PVC pipe. A 0.25-inch threaded rod was placed from anterior to posterior through the proximally potted tibia that had been transected at the mid-shaft level. This rod extended through a vertical slot in the front of the load frame and prevented the tibia from rotating while allowing motion along a vertical axis. The foot was mounted to a rotating plate using screws driven from plantar to dorsal into the metadiaphysis of the first and third metatarsals through fixed holes in the footplate. The footplate attached to the base of the load frame through a rotating joint centered beneath the tibiotalar joint. In addition, brackets were placed against the hindfoot bilaterally to prevent excessive inversion or eversion. The rotating plate had fixed rotation stops placed at 0° as well as 10 and 20° of rotation in either direction. Thus, rotation of the foot was used to create tibial malrotation relative to the foot. (Fig. 1)
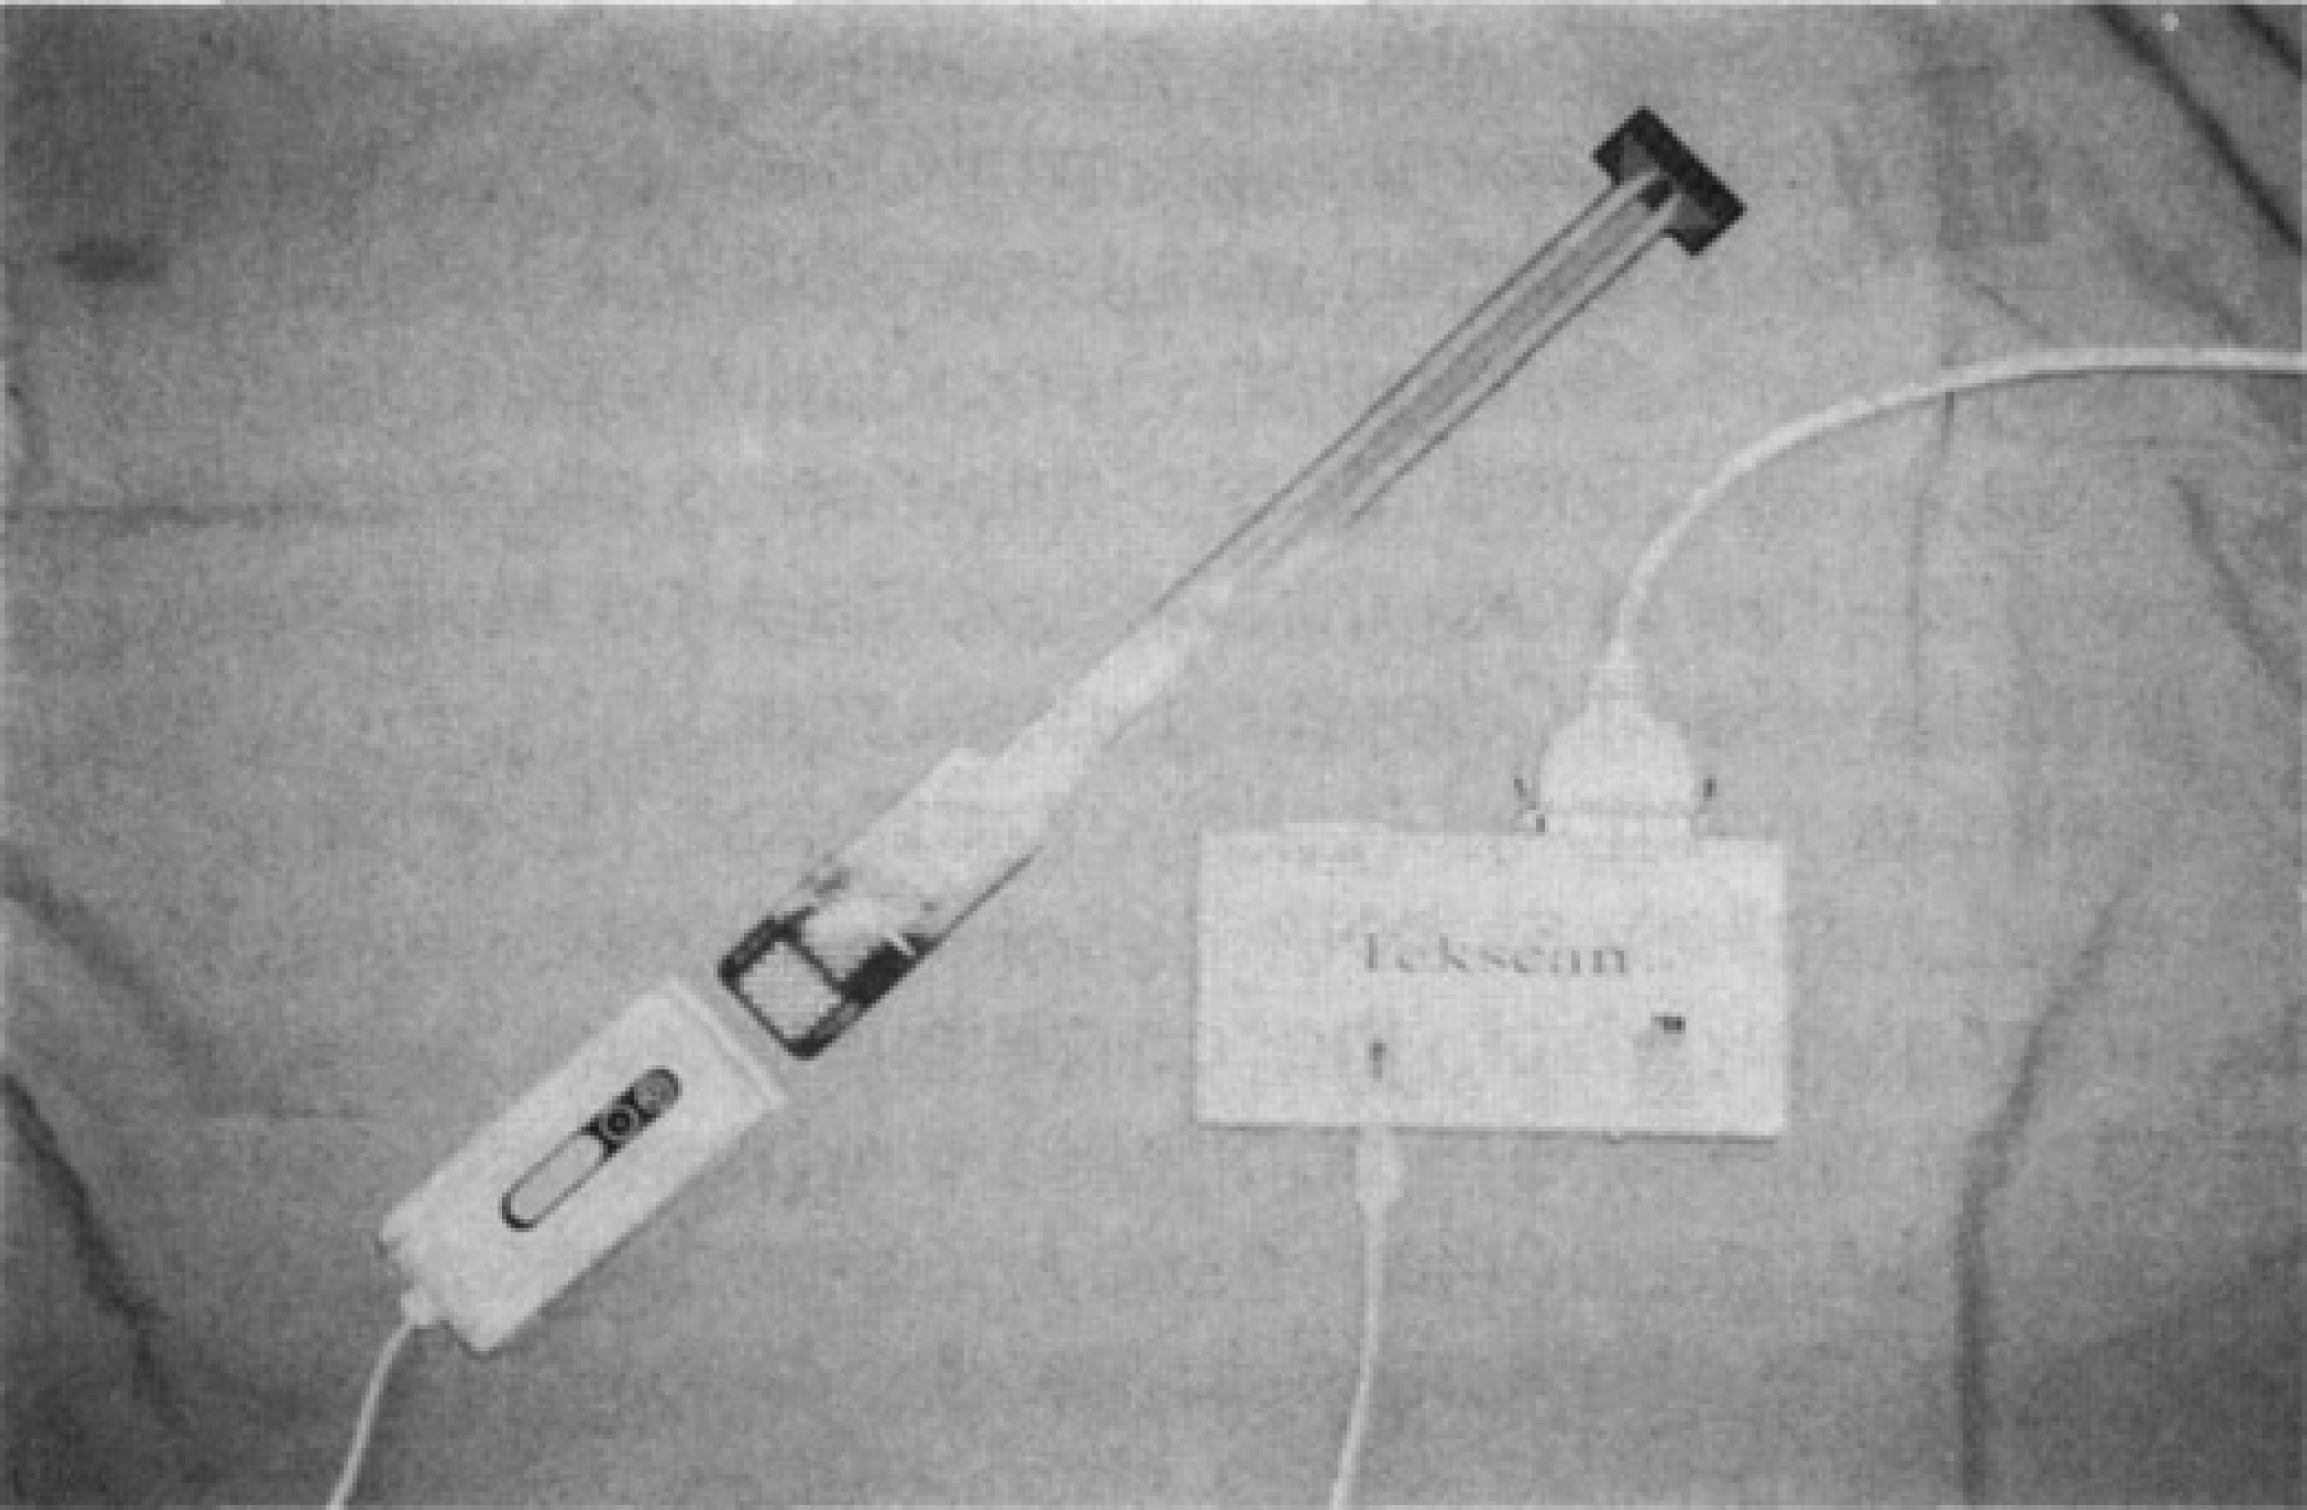
The TekScan I-Scan Adjustable Gain Pressure Measuring System with Model 4200 pressure sensor. The thin-film pressure sensor attaches to the scanning handle directly and the handle is attached to the personal computer via cables through a parallel port (box labeled “TekScan”). Note that the sensor in this photo has not been trimmed to fit the ankle.
Pressure measurements were obtained using the TEKScan I-Scan Adjustable Gain Pressure Measuring System (TEKScan, Incorporated, Boston, MA). This system consists of a thin, flexible pressure sensor that outputs data to proprietary TEKScan software via a scanning handle. (Fig. 2) The pressure sensor (Model 4200) is 0.15-mm thick and consists of a 24 × 11 grid of sensing elements (sensors) arranged over a 4.5-cm × 2-cm area. The sensor was calibrated prior to testing according to the manufacturer's recommendation to a load of 600 N using a specially fabricated calibration jig mounted in the materials testing device. The sensor was positioned in the tibiotalar joint through the anterior arthrotomy and centered over the talus as a position reference. The sensor covered the central portion of the middle facet of the talus including the major portion containing the centroid of loading as defined by Calhoun et al. 1 A portion of the most posterior part of the middle facet of the talus was not covered by the sensor; however, this is correlated closely with the area noted by these authors to have no load transmission while the ankle is in neutral position. The specimen was tested at 600 Newtons and static pressure distributions recorded by computer. The load was maintained for two-minutes to allow for drift of the sensor that at two-minutes yields a load result ±0.1 % of actual. (I-Scan Operating Instructions)
With four rotational testing conditions, i.e. internal and external rotation at both 10° and 20°, there were 24 sequences in which the conditions could be administered. By means of a computer program based on random number generation, each specimen was assigned to one of these sequences to reduce bias in the order of testing. The previous calibration and testing steps were repeated for these simulated rotational malunions. Each sensor was used until it no longer provided reliable data, which can occur as a result of lead breakage and violation of the closed space between the sensor layers. This was defined to occur when any one or more sensors on a sensor began to read out of range which was noted numerically as the highest value calibrated to and visually as a red sensor point. At the completion of the testing sequence for each of the 23 limbs, the ankle was returned to 0° of rotation and the testing repeated to ensure no irreversible changes occurred to the limb. After the completed testing sequence, the specimens were examined and dissected to delineate structural ligamentous changes (due to excessive loading) and to rule-out significant intra-articular pathology (degenerative joint disease or cartilage damage) which could impact the testing results. The contact area at two-minutes was calculated by the TEKScan pressure monitoring system software as was total load over this area. Examination of this visual data revealed the sensor grid point with the peak pressure reading and this was recorded as well. Data were analyzed using repeated measures analysis of variance, with a Bonferroni correction for pairwise comparisons.
RESULTS
The mean values and standard deviations for contact area, total load, and peak pressure are recorded in Table 1. The total load was highest for the condition of 0° of rotation prior to the sequence of rotational testing (551±99 N) . A trend was noted of decreased total load across the sensor as internal and external rotation increased with the greatest magnitude of change present in the 20° external rotation condition (395±113 N). The contact area was also highest for the initial loading condition of 0° (502±90 mm 2 ) and similarly decreased with the extremes of rotation, with the greatest decrease in the 20° external rotation condition (308±81 mm 2 ). Peak pressure was highest at the extremes of rotation with the highest pressure recorded at 20° of external rotation (541±107 PSI) and the lowest recorded at the final loading condition of 0° (430PSI±115PSI).
Tibiotalar Joint Biomechanical Data for Conditions of Neutral, 10° and 20° of Rotation.
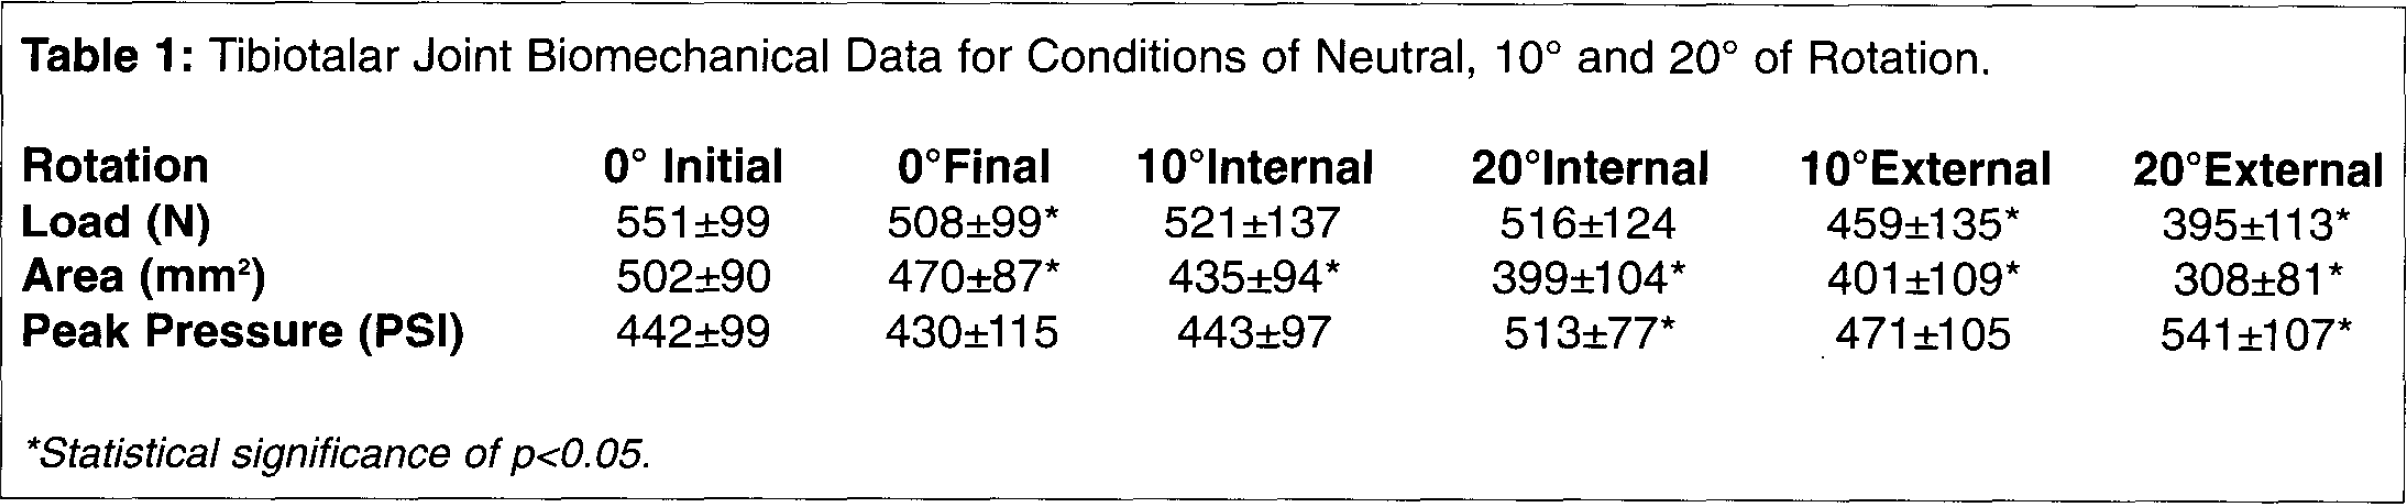
Statistical significance of p<0.05.
The specimens were tested at 0° of rotation before and after the testing sequence. The initial load was 551±99 N and the load after testing was 508±99 N. These results demonstrated statistical significance (P=.001). Similarly, for the contact area, the initial trial of 0° rotation (502±90 mm 2 ) was statistically significantly different than the final condition of 0° rotation (470±87 mm 2 ) (p=.017). Comparison of the peak pressure before and after the testing sequence showed no statistically significant difference (442±99 PSI vs. 430±115 PSI) (p=.292).
Comparison of the mean total loads for the various rotational conditions to the initial condition of 0° showed that no significant difference existed between the 0° condition and the internal rotation conditions of both 10 and 20° (p=1.00, using a Bonferroni adjustment for multiple comparisons). There was a statistically significant difference for both the 10 and 20° conditions of external rotation (p=.017 and p=.000, respectively). In both cases the total loads decreased from the initial 0° loading condition.
Analysis of contact area revealed that there was a statistically significant difference for all comparisons of rotation i.e. 10 and 20° of internal and external rotation to the 0° condition (p<.001). In all cases, the contact areas for the tested condition were smaller than the initial loading condition at 0° rotation.
Comparison of the peak pressure values for the testing conditions to the initial loading condition showed a statistically significant difference between external rotation of 20° and the initial loading condition (p=.005) as well as a significant difference between internal rotation of 20° and the initial loading condition (p=.003). In both cases, the mean peak pressure was higher than that for the 0° loading condition.
DISCUSSION
The alteration in tibiotalar joint biomechanics resulting from pure rotational malalignment has not been previously reported. It is well documented that angular malunions of the tibia result in altered tibiotalar joint biomechanics and clinically this has been reported as well. It is commonly accepted that a certain degree of rotational malalignment is acceptable in these fractures; however, the degree of malrotation has not been clearly delineated. Our data suggest that all rotational deformities modeled in our study result in significantly decreased joint contact areas. In addition, external or internal rotational deformities of 20° were found to significantly increase the peak pressure noted in the joint. A trend of increasing peak pressures was found for 10° of internal or external rotation. Our data also found that load across the tibiotalar joint was significantly lower for the conditions of external rotation for both 10 and 20°.
It stands to reason that contact area within the tibiotalar joint would decrease as the congruency of the joint is disrupted by a rotational deformity. Our data supports this and shows that the contact area continues to decrease with the extremes of rotation in either direction. This may result in accelerated joint degeneration under otherwise normal loading conditions. This conclusion is seemingly contradicted by our data for total load as it was found to be lower in the conditions of malrotation and significantly so for the cases of external rotation. This likely represents a limitation of our model as the sensor was placed only between the tibial plafond and talar dome. Given that a constant load was generated reliably by the materials testing device, the loss of this generated load is probably accounted for by load transmission at other locations. In our model, these other locations may have included the medial and lateral gutters of the ankle joint which were not evaluated in the present study. This finding is supported by the work of Calhoun et al. 1 that stated inversion and eversion of the ankle resulted in increased loading of the medial and lateral facets of the talus. This loading accounted for up to 22% of the load being transmitted through the medial facet and up to 10.5% of the load being transmitted to the lateral facet depending on ankle position. It stands to reason that similar loading of the medial and lateral facets of the talus may occur with rotation of the tibiotalar joint as occurs with inversion and eversion of the foot. Measured load may also have been reduced by the development of shear forces within the thin film sensor. This is a well-recognized limitation of the sensors (l-Scan Operating Instructions). Peak pressures measured in the joint tended to increase with malrotation and significantly so at 20° of external or internal rotation.
There are several limitations inherent to this study. As a cadaveric biomechanical study, interpretation of results cannot be carried directly to the in vivo state. Our study design was limited to analysis of static loading in mid-stance phase. This was chosen mainly due to restraints imposed by the method of intra-articular pressure monitoring. Varying degrees of plantar flexion and dorsiflexion of the ankle would have led to the generation of significantly more shear stresses and degradation of the sensor's output. In addition, due to sensor drift, dynamic testing would have been inaccurate given that sensor output tends to vary with time to a certain extent. 2
We compared the contact area, total load, and peak pressures at neutral rotation both before testing and after the testing sequence as a means to asses reliability of our methods. The peak pressure and contact area before and after testing were not statistically different. We did note a significant difference between the total load values before and after testing. There are several possible reasons to account for this. First, although the sensor was under direct observation at all times, some micromotion may have occurred during testing which may have an effect on the sensor output. Individual sensors in the grid may have failed during testing leading to variability in the load readings; however, this was easily noted as a failed sensor begins to read out of the calibrated range and appears red on the visual output. Sensors were discarded when they no longer could be calibrated to our testing range or when they developed one or more out-of-range sensor readings. We had no instance during or at the completion of testing where sensors were noted to read out of range; thus, in practice, sensors were used until they could no longer be calibrated for the next specimen tested. In addition, sensors may have failed due to the presence of moisture between the two membranes. We resealed the sensor edges with occlusive tape after trimming to prevent moisture from entering between the layers. We must emphasize that we did not have the ability to measure moisture content within the sensor except to ensure that there was no grossly visible moisture between the membrane layers. Perhaps the most rational explanation for the difference between the initial and final neutral rotation load values is provided by the work done by Cooper et al. 2 In their study, they analyzed the effects of repeated, constant loads on the output generated by the identical Model 4200 sensor. They found that there was a reproducible 3.5% increased load output from the sensor compared to the actual applied load with an initial pulse over repeated tests. They concluded that at any specific moment in time, sensor output was reliable between tests and that accuracy was improved by frequent calibration. We minimized the bias incurred by this known sensor property by randomizing the testing order for each specimen. Further, we performed sensor calibration prior to each testing sequence as recommended by these authors.
Our study addressed the biomechanical effects of simulated rotational malunions on the tibiotalar joint. It is clear that all types of rotational malunion cause decreased contact area and increased peak pressures. Total load seems to decrease although some of it is most likely being transmitted through another region about the ankle not accounted for by our model. Recognizing the limits of this type of cadaveric biomechanical study, it would seem prudent to recommend that tibiotalar malrotation be limited to less than 10° at the time of initial treatment in order to minimize the derangement of normal ankle biomechanics.